 Adama Lo1,2*
 Abdoul Aziz Diouf1
 Ibrahima Diedhiou2
 Cyrille Djitamagne Edouard Bassène1,3
 Louise Leroux4,5
 Torbern Tagesson6,7Rasmus Fensholt6Pierre Hiernaux8
 Anne Mottet9
 Simon Taugourdeau10,11Daouda Ngom3Ibra Touré10
 Babacar Ndao1Mamadou Adama Sarr1,12
- 1Centre de Suivi Ecologique, Dakar, Sénégal
- 2ENSA, Université Iba Der Thiam de Thiès, Thiès, Sénégal
- 3UCAD, Département de Biologie Végétale, Dakar, Sénégal
- 4CIRAD, UPR AIDA, Dakar, Sénégal
- 5AIDA, Univ Montpellier, CIRAD, Montpellier, France
- 6Department of Geosciences and Natural Resource Management, Faculty of Science, University of Copenhagen, Copenhagen, Denmark
- 7Department of Physical Geography and Ecosystem Sciences, Lund University, Lund, Sweden
- 8Pastoralisme Conseil, Caylus, France
- 9Food and Agriculture Organization of the United Nations, Animal Production and Health Division, Rome, Italy
- 10CIRAD, UMR SELMET-PPZS, Dakar, Sénégal
- 11UMR SELMET, Univ Montpellier CIRAD INRAE Institut AGRO, Montpellier, France
- 12Section de Géographie, UFR Lettres et Sciences Humaines, Université Gaston Berger (UGB), Saint-Louis, Sénégal
Strengthening of feed security in the Sahel is urgently needed given the climate change and growing human population. A prerequisite to this is sustainable use of rangeland forage resources for livestock. Many studies have focused on the assessment of rangeland resources during the rainy season, while only a few have focused on the dry season which is the longest and most demanding period for livestock in Sahelian rangelands. The objective of this study is to develop remote sensing-based models for estimating dry season forage vegetation mass. To that end, 29 vegetation indices calculated from each of the MODIS-MCD43A4 (500 m), Landsat-8 (30 m), and Sentinel-2 (10 m) satellite products were used and tested against in situ data collected during three field-measurement campaigns in 2021 at eleven monitoring sites across Senegalese rangelands. Four statistical models were tested, namely, random forest, gradient boosting machines, and simple linear and multiple linear regressions. The two main vegetation mass variables modeled from remote sensing imagery were the standing herbaceous and litter dry mass (BH) and total forage dry mass (BT) with a dry mass of woody plant leaves added to BH. Overall, Sentinel-2 data provided the best performance for the assessment of BH with multiple linear regression (R2 = 0.74; RMSE = 378 kg DM/ha) using NDI5 (Normalized Difference Index5), GRCI (Green Residue Cover Index), SRI (Simple Ratio Index), TCARI (Transformed Chlorophyll Absorption in Reflectance Index), and DFI (Dead Fuel Index) indices. For BT, the best model was also obtained from Sentinel-2 data, including RVI3 (Ratio Vegetation Index3) (R2 = 0.78; RMSE = 496 kg DM/ha). Results showed the suitability of combining the red, green, blue, NIR, SWIR1, and SWIR2 bands in monitoring forage availability during the dry season. Our study revealed that the spectral richness of the optical sensor systems Sentinel-2, Landsat-8, and MODIS-MCD43A4 allowed for accurate assessments of dry-season forage mass of semi-arid rangelands. Adding to this, the high spatial and temporal resolution of Sentinel-2 satellite imagery makes this a promising data source for timely monitoring. These findings can support the monitoring of the animal feed balance in Sahelian countries and contribute to enhancing the resilience of pastoralism toward feed shortage through early warning systems.
1 Introduction
Livestock production is the primary livelihood strategy to generate income for the Sahelian population, particularly in West Africa (Dicko et al., 2006), where many pastoral households depend on their livestock for both milk and meat production (Sayre et al., 2013). Livestock is, therefore, a strong guarantee for food security in this region (Sloat et al., 2018). Livestock income was found to be important for purchasing food, engaging in non-farm activities, and acting as a safety net in case of crop failure (Loison & Bignebat, 2017). However, the pastoral livelihood system is highly dependent on forage availability from rangelands, which is the predominant source of feed for the livestock.
Rangelands play multiple essential roles both in relation to the balance of the Sahelian ecosystem and in the lives of human populations (Hiernaux et al., 2018). Rangelands are fundamental for food security (ISRA, 2003) and play an important ecological role in allowing for improved soil fixation, carbon uptake, and biodiversity conservation (Holechek et al., 2020). However, pastoral systems in the Sahel have faced major crises since the 1970s, accentuated by climate change, increasingly threatening the region. Climate change has led to an increase in rainfall variability (Sloat et al., 2018; Zhang et al., 2017), impacting mainly the processes that control ecosystem functioning (Zhang et al., 2018). In particular, biological activity and productivity have been affected, as well as the floristic composition of herbaceous components in rangelands (Hiernaux et al., 2009; Briske et al., 2015; Delon et al., 2015; Brandt et al., 2016). Consequently, animal feeding, growth, and reproduction are all impacted (Chirat et al., 2014). Optimal use of pasture as a fodder source is vital for successful production (Otgonbayar et al., 2019), particularly in the dry season (the longest and most difficult period of the year, during which livestock can experience increasing food shortages) when the amount of forage decreases, severely impacting livestock (Jacques et al., 2014). Timely monitoring and estimation of plant vegetation mass during the dry season, therefore, are essential for forage resource management in Sahelian rangelands (Diouf et al., 2015).
Many studies have been conducted in the Sahel to improve the quantification of forage mass (Diouf et al., 2014; Diouf et al., 2015; Garba et al., 2015, Garba et al.,2017). Recently, the FAO (Food and Agriculture Organization of the United Nations) and CIRAD (Centre de coopération internationale en recherche agronomique pour le développement) have provided guidelines to propose a harmonized feed balance methodology and feed balance sheet that is being implemented already in five countries in the Sahel (FAO, 2020). These guidelines, in particular, recommend a better description of the available forage according to its type and its nutritional value at different periods of the year. Indeed, forage balances are often used for evaluations at different scales, such as in the context of competition between animal and human food (Mottet et al., 2017). In addition, over the past decades, food security information systems like AGRHYMET (Centre régional de formation et d’applications agronomique, hydrologique et météorologique) (Traore et al., 2014), SMIAR (Système Mondial d'Information et d'Alerte Rapide) (Jost, 1996) and specific systems to pastoral monitoring, e.g., SIG Sahel (pastoral monitoring system of action against hunger in the Sahel) (Ham & Fillol, 2012), GEOGLAM RAPP (Group on Earth Observations Global Agricultural Monitoring Rangelands and Pasture Productivity) (Guerschman et al., 2015) have shown significant progress.
Remote sensing techniques are currently used with good success to monitor vegetation mass over large areas using both Lidar and multispectral sensors (Rana et al., 2014). Jin et al. (2015) used Landsat-8 images and textural layers to estimate maize residue cover in Northeast China. Otgonbayar et al. (2019) also used Landsat-8 images to map pasture vegetation mass in Mongolia using Random Forest regression. Najaf et al. (2019) compared Sentinel-2 and Landsat-8 data to map and characterize residues of crops in the east of the Azerbaijan province (Iran). Since the 1970s, regular remote sensing monitoring of rainy-season vegetation mass has been conducted throughout the Sahel for better management of pastoral resources (Tucker et al., 1985; Diallo et al., 1991). Several parametric models have been established to assess forage vegetation mass at the end of the rainy season in the Sahel using vegetation indices such as the NDVI (Normalized Difference Vegetation Index) (Diouf & Lambin, 2001; Fensholt et al., 2004; Tucker et al., 1985). Jacques et al. (2014) tested combinations of MODIS (Moderate Resolution Imaging Spectroradiometer) bands (NBAR collection 5) to quantify forage vegetation mass during the dry season in the Sahelian zone. Their study was based on MODIS SWIR (short-wave infrared) bands that were found to be relevant due to their sensitivity to components such as lignin, cellulose, and hemicellulose (Daughtry, 2001). Kergoat et al. (2015) used field-based radiometer measurements and MODIS images to estimate dry vegetation mass and cover fraction throughout the dry season across the Sahel using the SWIR1.6 and SWIR2.1 bands. Over the years, several other spectral indices have been suggested to estimate vegetation mass during the dry season based on different sensors, e.g., Landsat Thematic Mapper, Landsat Enhanced Thematic Mapper, MODIS, and ASTER (Advanced Spaceborne Thermal Emission and Reflection Radiometer); normalized difference indices such as Normalized Difference Index 5—NDI5 (Mcnairn & Protz, 1993); chlorophyll detection indices such as Triangular Vegetation Index—TVI (Broge & Leblanc, 2001); indices with correction for atmospheric or soil effects such as Soil-Adjusted Vegetation Index—SAVI (Huete, 1988), and vegetation indices by ratio such as Soil Tillage Index—STI (Van Deventer et al., 1997).
Taking advantage of the ever-increasing quality of satellite sensor technology and surface reflectance products readily available to the users, the main objective of this study is to estimate the forage availability during the dry season using spectral indices computed from satellite images for Senegalese rangelands. We aim to address the following research questions: what would be the most efficient approach to assess dry season vegetation mass in Senegalese rangelands from remote sensing data and what are the dynamics of vegetation mass during the dry season according to the best performing model?
2 Materials and methods
2.1 Study area
The study area covers almost the entire silvopastoral zone of Senegal, with a total area of 101.609 km2. It is located in the Sahel belt and is characterized by two seasons: a dry season from November to June and a rainy season from July to October, each year. The climate is arid to semi-arid, with a minimum and maximum annual rainfall of 200 and 980 mm, respectively. Generally, it is during the rainy season that herbaceous vegetation develops and reaches its maximum growth. At the end of this season, the vegetation begins to dry out. During the dry season, a thin dry herbaceous layer covers the ground. As elsewhere in the pastoral Sahel, the vegetation is dominated by annual herbaceous species, with scattered trees and shrubs (Kergoat et al., 2015).
The study area covers five ecoregions: the northern and southern sandy pastoral regions, the ferruginous pastoral region, the eastern transitional region, and the agricultural expansion region (Figure 1) (Tappan et al., 2004). Field measurements were collected at 11 monitoring sites: 10 sites of the CSE (Centre de Suivi Ecologique) (Diouf et al., 2015) and the Dahra field site (Tagesson et al., 2015).
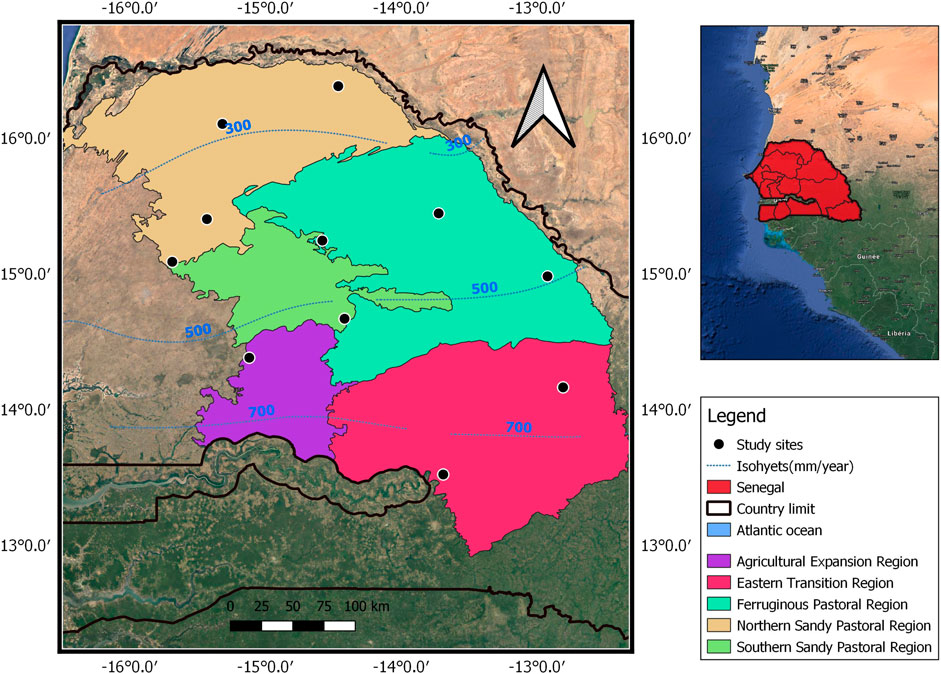
FIGURE 1. Map of the study area with isohyets corresponding to the average annual rainfall for the period 1981–2010.
2.2 Data acquisition and processing
2.2.1 Field measurement
2.2.1.1 Collection and calculation of standing herbaceous and litter dry mass
Standing herbaceous dry mass was collected during three field campaigns in the 2021 dry season (January 31 to February 10; March 25 to April 04; May 15 to May 25) following the sampling protocol of Kergoat et al. (2015) at the 11 monitoring sites. At each site, we used a 500-m transect subdivided into 500 plots of 1 m2. Each of the 500 1 m2 plots was visually classified into one of the four levels of productivity; bare soil, low-, medium-, and high-level productivity. Bare soil was assumed to have no dry mass, and randomly, three plots were selected in the low level, six plots in the medium level, and three plots in the high level. At each of these 12 plots, geographic coordinates, the nadir pointing vertical photos taken at 1.2 m height above the top of the vegetation, and species composition were recorded. Also, the dominant species was recorded (from the contribution of each herbaceous species to the cover in a given plot). Then, within each of these 12 plots, aboveground vegetation mass was cut and weighed to obtain the fresh mass. Litter was also collected and weighed separately. At the Dahra site, the collection protocol was similar to that of the other sites, but the sampling plots followed, instead, two perpendicular transects of 250 m as proposed by Mbow et al. (2013). All samples were thereafter dried at 80°C for 48 h and weighed to retrieve the dry weight mass (DM). The dry matter rate was estimated as the ratio of DM to fresh mass.
The resulting DM was then incorporated into the following equation to calculate the standing herbaceous dry mass (SBH) at the site level:
where SBH is the total standing herbaceous dry mass of the site (kg DM/ha), FMi is the average fresh mass of the production level (i) measured in the field (g/m2), ani is the fraction of occurrence of the specific productivity level (i) along the 500 m transect, ms is the dry matter rate (the ratio of DM to fresh mass), and 10 is the conversion factor of g/m2 to kg/ha.
This weighting was not applied for litter mass because it did not vary between the productivity levels. The litter mass was calculated taking into account the percentage of bare soil (BS) using the following formula:
where Lit is the total dry mass of the litter for the site (kg DM/ha), M.lit is the mass of the litter per plot (g/m2), ms is the dry matter rate, BS is the percentage of bare soil, and 10 was used to convert g/m2 to kg/ha.
2.2.1.2 Collection and calculation of the woody foliage mass
Foliage mass of woody plants was also collected during the three campaigns. An inventory of dominant tree species was made in two circular plots with the center located at 200 and 400 m from the beginning of the 500-m transects (Supplementary Figure S1). For the Dahra site, four circular plots were used, instead, located at the beginning and end of the perpendicular transects due to the difference between the sampling schemes. The radius of the plots was 28 m in the four northernmost sites and 20 m in the remaining sites, taking into account vegetation density which is higher in the southern sites. For each of the dominant woody species, five twigs with 2-cm diameter were cut, defoliated, and leaves (only) were weighed. The samples of around 200 g were then dried in an oven at 80°C for 48 h, and foliage was again weighted to obtain DM. The site-level foliage dry mass of woody plants was then calculated as follows:
where BL is the sum of foliage dry mass of woody plants in kg DM/ha, n is the number of dominant species listed,
Finally, the total forage dry mass (BT) of each site was calculated by adding the standing herbaceous dry mass (SHB), litter dry mass (Lit), and foliage dry mass (BL). The herbaceous dry mass (BH) is the sum of the standing herbaceous dry mass (SBH) and litter dry mass (Lit).
2.2.2 Satellite image acquisition and processing
Three different satellite data sets were used to study their suitability for dry season vegetation mass monitoring: MODIS, Landsat-8, and Sentinel-2 (Table 1). The acquisition dates of the images were chosen to correspond, as closely as possible, to the dates of the field campaigns.
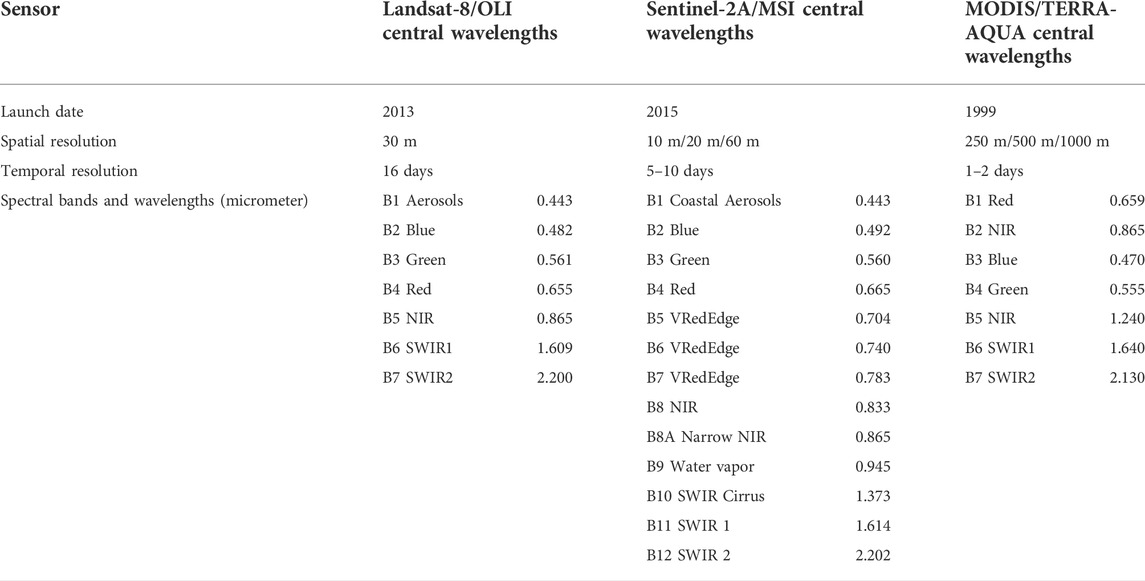
TABLE 1. Description of the sensors used in the study.
2.2.2.1 Moderate-resolution imaging spectroradiometer
The MODIS-NBAR (Nadir BRDF-Adjusted Reflectance) collection 6 (MCD43A4) product with 500-m spatial resolution (Schaaf & Wang, 2015) was downloaded with the MODIStsp platform (Busetto & Ranghetti, 2016). The NBAR product with a temporal resolution of 1–2 days was chosen because reflectance is less-affected by view angle effects. The quality layer from the MCD43A2 product was used to exclude pixels with clouds (i.e., quality value > 2) (Jacques et al., 2014). The seven bands (bands 1–7) were used to calculate spectral indices.
2.2.2.2 Landsat-8
With a spatial resolution of 30 m and a temporal resolution of 16 days, Landsat-8 OLI (operational land imager) data collection 2 level 2 (EROS, 2020) was downloaded from the Earth Explorer platform. These images were geometrically and atmospherically corrected prior to downloading. Images with less than 10% cloud cover were downloaded following a visual inspection to ensure that clouds were not present over the specific study sites.
2.2.2.3 Sentinel-2
Sentinel-2 L2A images, atmospherically corrected (Drusch et al., 2012) with less than 5% clouds, were downloaded from the Copernicus Open Access Hub. The spatial resolution of Sentinel-2 is varying between 10 and 60 m, and the temporal resolution is 5 days. All bands were resampled (nearest neighbor method) to a 10-m spatial resolution using the Sentinel Application Platform (SNAP).
2.2.3 Spectral indices
Initially, a literature review was conducted in order to list the most suitable remote sensing indices for monitoring dry vegetation and crop residues. Then, from this review, several indices for green vegetation were suggested to be very useful for mapping dry vegetation and crop residues and were subsequently used in this study. These indices were also used to capture the chlorophyll activity left on the vegetation at the beginning of the dry season. In total, 29 spectral indices were calculated for monitoring foliage dry mass during the dry season (Supplementary Table S1). These indices were grouped into four categories: 1) normalized difference vegetation indices, 2) chlorophyll detection indices, 3) vegetation indices with correction for atmospheric or soil effects, and 4) vegetation indices by ratio. All indices were averaged for each site within a 500-meter buffer.
2.3 Methods
The overall approach for developing the models to monitor dry season forage mass followed five processing steps is given in Figure 2.
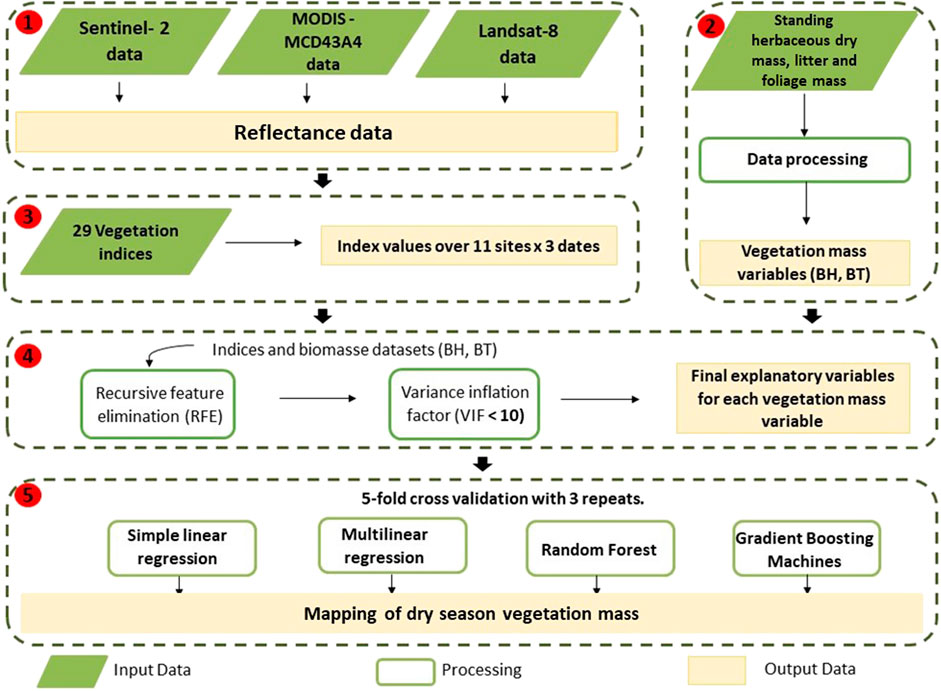
FIGURE 2. Flowchart of the main steps of the study with 1) satellite data pre-processing, 2) preparation of field observed BH and BT, 3) satellite index calculation, 4) selection of explanatory variables, and 5) parameterization and validation of models.
2.3.1 Selection of explanatory variables of vegetation mass
A performance test was applied to identify the most relevant satellite variables and eliminate non-performing spectral indices for predicting each of the dry mass variables (BH (herbaceous dry mass) and BT (total forage dry mass)). To do this, the recursive feature elimination algorithm (RFE) was used (Kuhn et al., 2021). To assess and select the best collection of spectral indices, the random forest classifier was used with 5-fold cross-validation. Additionally, the variance inflation factor (VIF) was applied to detect the collinearity or dependence between the spectral indices (Thompson et al., 2017) and avoid its amplifying effect on the standard error of the model (Miles, 2014). The VIF uses multiple regression in order to eliminate satellite variables that could impact the performance of the models, e.g., create overfitting. A VIF threshold >10 (only predictors with a VIF less than or equal to 10 were retained) was used to exclude collinear spectral indices from the dataset (Midi & Bagheri, 2010) and retrieve the optimal number of variables used to build the final models.
where R2 is the coefficient of determination from a multiple linear regression with the predictor variable against the other independent variables that gives the proportion of the variance in the outcome associated with the explanatory variables.
2.3.2 Model approaches
Four regression modeling approaches were used to estimate the dry season forage vegetation mass across the study area: two linear regression models (simple and multiple) and two machine learning algorithms (random forest and gradient boosting machines). Independent variables were BH and BT, and the spectral indices checked for collinearity were used as explanatory variables. Since the dataset available for this study was relatively small, the k-fold cross-validation method was applied with five folds and three repetitions (Kuhn et al., 2021). For each modeling approach, the different possible combinations that could emerge from the final base obtained after the VIF test for each vegetation mass variable (BH and BT) have been assessed. Each combination (a minimum of two for ordinary least squares (OLS) models and a minimum of three for machines learning (ML) models) constituted a separate model. In total, for all types of images, 619 models were tested for BH and 987 models for BT (Supplementary Table S2).
2.3.2.1 Random forest
To run the random forest (RF) model (Liaw & Wiener, 2002), the number of features to use at each split (mtry) was set to the half number of included explanatory variables, while the number of trees to grow (ntree) were set to 1,000. All combinations starting at three up to the total number of explanatory variables retained after the RFE and VIF tests were tested for each independent variable. The model with the lowest RMSE was selected and optimized based on these three input parameters: mtry, ntree, and minimum node size. The final result of the optimization used the following values: 1 for mtry, 100 for ntree, and 2 for minimum node size (Supplementary Table S3). The optimization was carried out by rescaling the model with the prediction variables of the best model. By iteration, the best mtry was integrated as a parameter of the model, and the latter was re-run to search for the best ntree. Then, the best ntree and mtry were integrated with the parameters of the model to search for the best node size.
2.3.2.2 Gradient boosting machines
Several combinations of explanatory variables (starting at three) were also tested with gradient boosting machines (GBM) (Ridgeway, 2020). The model run and optimization involved the total number of trees (ntrees), the maximum depth of variable interactions (interaction depth), the learning rate (shrinkage), and the minimum number of observations in the tree's terminal nodes (n. minobsinnode) (Supplementary Table S4). After the iteration process, the GBM model with the lowest RMSE was obtained using the following values: ntrees (200), interaction. depth (3), shrinkage (0.1), and n. minobsinnode (3).
2.3.2.3 Linear regression
Simple linear regression (MLS) was carried out for each of the vegetation indices, and multiple linear regressions (MML) were tested for all possible combinations of vegetation indices. A comparison between the linear model developed by Jacques et al. (2014) and the one developed in this study was carried out for the herbaceous dry mass estimation (Supplementary Table S5).
2.3.3 Assessment of model performance
Four parameters were used to assess the accuracy of the models: coefficient of determination (R2), root mean square error (RMSE), relative root mean square error (RRMSE), and Nash Sutcliff Efficiency (NSE). NSE shows the relative magnitude of the residual variance compared to the measured data variance and varies in the range of −∞ to 1 (Nash & Sutcliffe, 1970). A value of NSE = 1 reflects that between the modeled and measured values, there is a perfect match (Nadiri et al., 2020).
The residuals of the best model for each vegetation mass variable and each sensor were also used to analyze existing variability over the dry season (Supplementary Figure S2).
2.3.4 Upscaling of dry season vegetation mass
The indices included in the best models for BH and BT were computed across the study area using the Google Earth Engine platform (Gorelick et al., 2017) for the three study periods (January–February, March–April, and May). For each composite image (MODIS-MCD43A4, Landsat-8, and Sentinel-2), cloud masks were applied to remove residual noises from the final output images.
3 Results
3.1 Vegetation index relation with dry season forage variability
After the exploratory analysis of the explanatory variables (i.e., RFE and VIF test), eight of the 29 vegetation indices were selected for development of the models (Table 2). It is noted that TCARI, DFI, and NDI5 were retained for each of the dry mass variables and for all sensors (Figure 3). The explanatory variables for each dry mass variable and each sensor contain at least one index belonging to the four-index group with a dominance of normalized difference vegetation indices and vegetation indices with correction for atmospheric or soil effects (Figure 3).
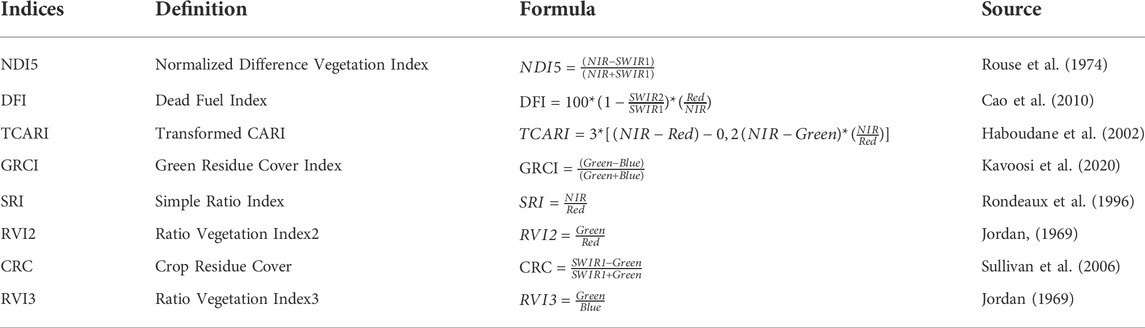
TABLE 2. List of the vegetation indices used in the development of the models.
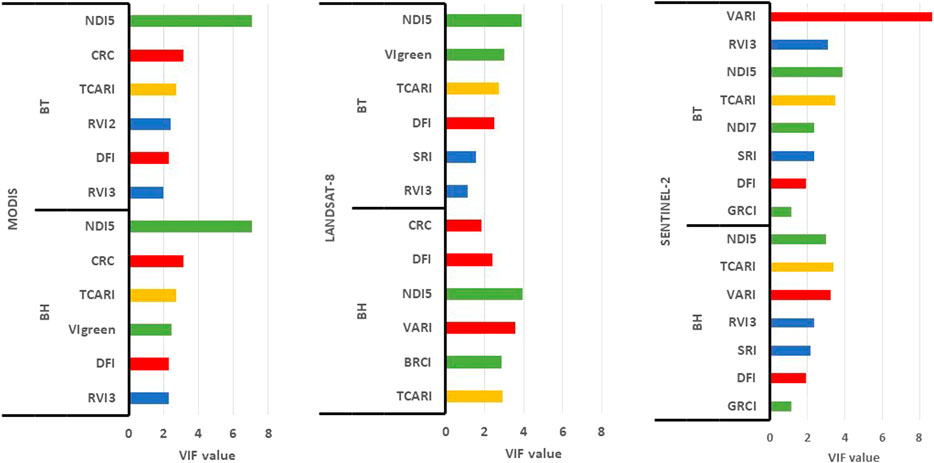
FIGURE 3. Selected explanatory variables after performance and collinearity tests. The included variables are colored as follows: vegetation indices by normalized difference (green), chlorophyll detection indices (yellow), vegetation indices with correction for atmospheric or soil effects (red), and vegetation indices by the ratio (blue).
3.2 Models adapted for monitoring vegetation dry mass variables
On the basis of R2, RMSE, RRMSE, and NSE, the multilinear model (MML) showed the best performance among the four tested models for the estimation of both BH and BT (Table 3) and for all sensor types (Supplementary Tables S6–S8). The multilinear model applied to Sentinel-2 was found to be the best model for estimating dry vegetation mass in the silvopastoral zone of Senegal (Table 4).
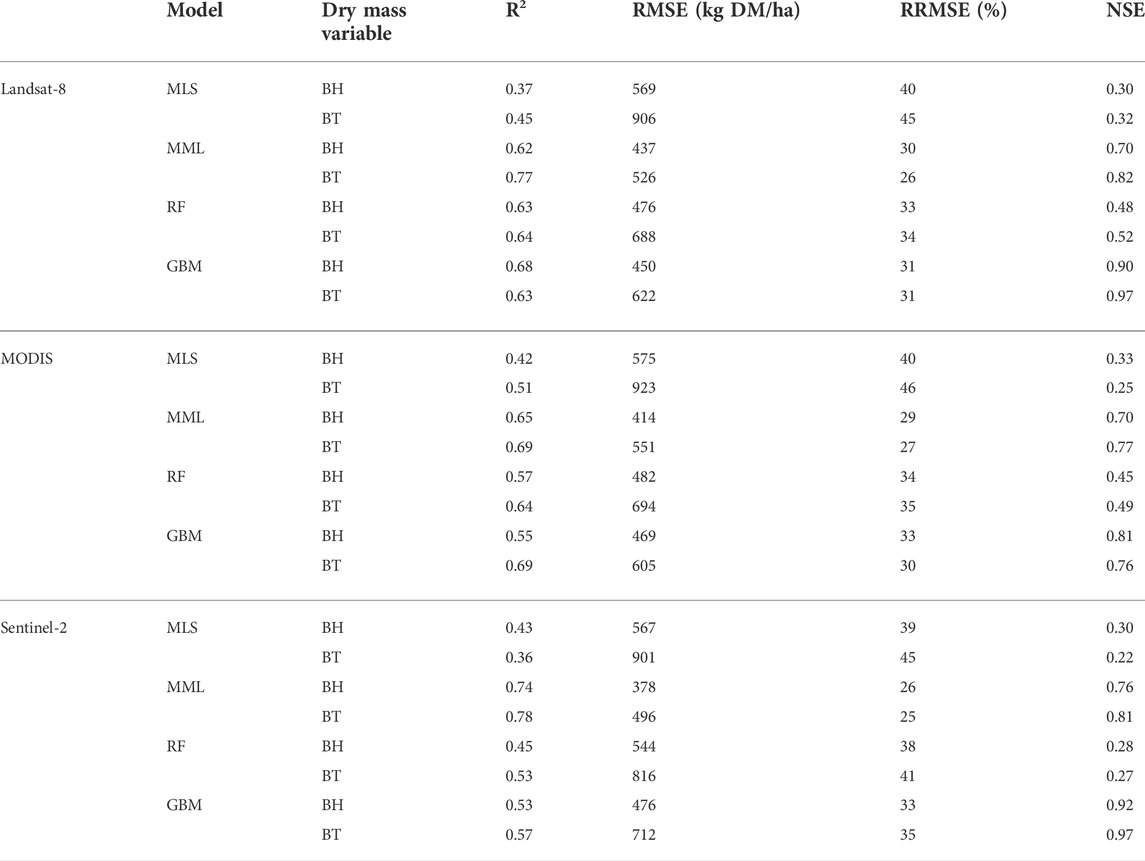
TABLE 3. Model performance for estimating dry season herbaceous dry mass (BH) and total ecosystem foliage dry mass (BT) (upper and lower row, respectively) for the three satellite sensor systems.
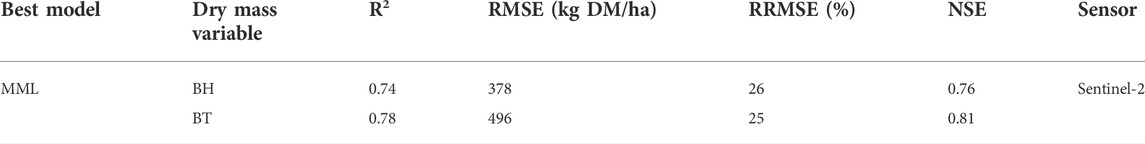
TABLE 4. Best model and sensor for estimating dry season herbaceous dry mass (BH) and total ecosystem foliage dry mass (BT) in the silvopastoral zone in Senegal.
3.3 Dry season dynamics in herbaceous dry mass and total foliage dry mass
3.3.1 Field observed variation during the dry season
A boxplot analysis (Figure 4) shows that herbaceous standing dry mass (SHB) showed a decrease over the dry season, while the litter dry mass (Lit) increased slightly between January and May. An increase in foliage dry mass (BL) was observed between January and April and then decreased between April and May.
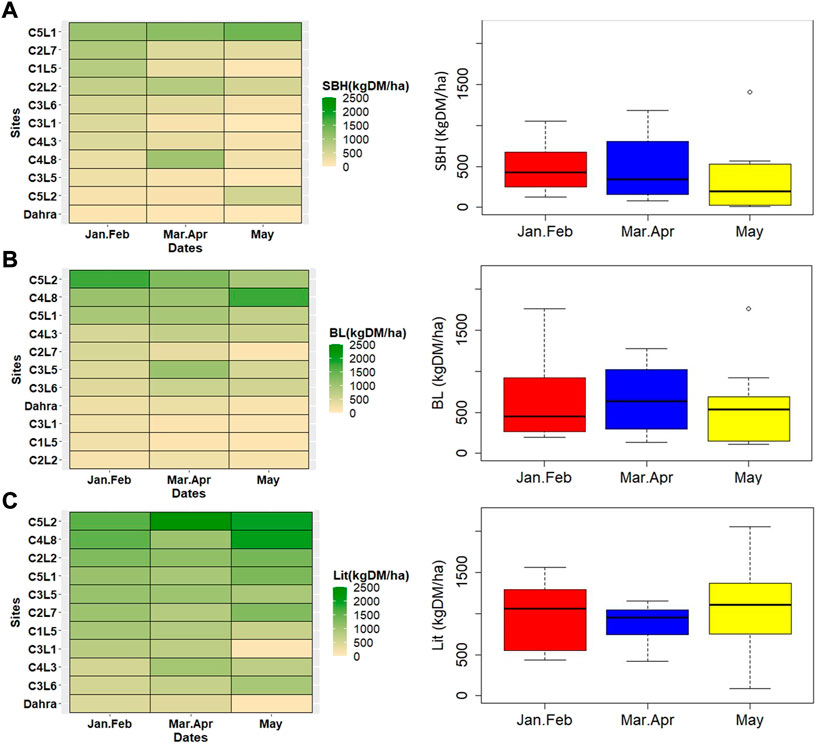
FIGURE 4. Variation of field observed SBH (A), BL (B), and Lit (C) during the dry season. Jan.Feb = January–February, Mar.Apr = March–April. The values in the first column of heatmaps were sorted in descending order from the top to bottom.
Spatiotemporal analysis from the heatmap (Figure 4) showed a spatial variability with BL with an increase along a north–south gradient. On the other hand, temporal variability is observed for SBH.
3.3.2 Spatialization maps for BH and BT with the best Sahelian model outputs
The multilinear model applied on a Sentinel-2 image was found to be effective in predicting BH and BT data over the entire study area with the following model equations:
The extrapolated results with these best models reflected, through the scatterplots, that a strong and significant relationship exists between the observed and predicted dry mass by the model. This implies that these models are capable of predicting total dry mass spatially (Figure 5) and temporally at 10-m resolution (Figure 6).
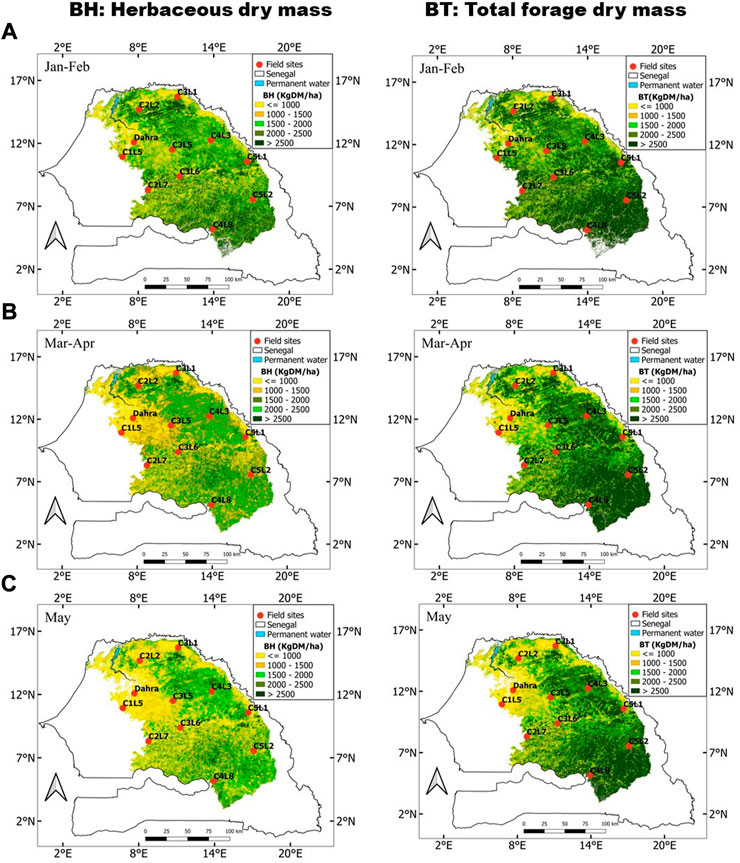
FIGURE 5. Prediction maps of herbaceous dry mass and total forage dry mass in (A) January–February, (B) March–April, and (C) May with the best model to estimate BH and BT.
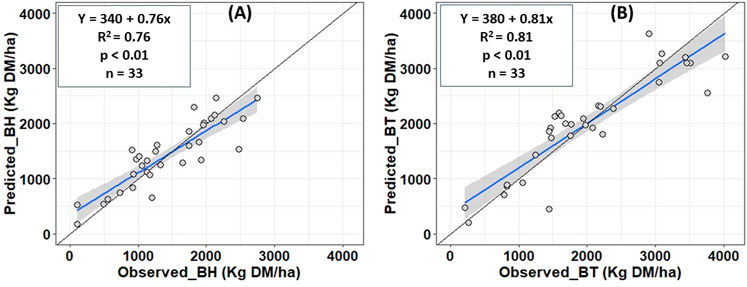
FIGURE 6. Scatterplot between observed and predicted (data over all the three periods) data using the best model for each dry mass variable with (A): BH and (B): BT.
4 Discussion
4.1 Best approach to estimate dry season vegetation mass
4.1.1 Most suited sensor(s) and indices for monitoring dry season vegetation mass
Sentinel-2 data generally yielded better performances for BH and BT estimation (Table 3) with a finer spatial resolution and a higher capacity to differentiate signals from the woody and herbaceous components.
Indices such as NDI5, DFI, and TCARI are essential for monitoring of dry vegetation mass (Figure 3). These indices used the red, green, blue, NIR, SWIR1, and SWIR2 bands. In particular, the SWIR1 and SWIR2 bands play an important role in forage estimation with low model accuracy when omitted. Kergoat et al. (2015) showed the relevance of using the SWIR1 and SWIR2 bands for dry season vegetation mass estimation in the Sahel. Similarly, Kavoosi et al. (2020) showed that indices based on SWIR1 and SWIR2 bands were able to provide more accurate predictions of crop residue cover. In fact, without the SWIR (i.e., 2100 nm region), the estimation of crop residues on the soil surface likely provides a high RMSE as shown by Najaf et al. (2019). This is mainly due to the absorption signature of the cellulose which increases in the SWIR region, around 2,100 nm (Daughtry et al., 2004).
Previous studies have reported the relevance of other indices, also tested in this study, to quantify dry vegetation mass. For example, Kavoosi et al. (2020) identified the DFI as the most suitable for monitoring the cover of crop residues, and it was found here to be an important variable for estimation of both BH and BT. Therefore, we can confirm its relevance in monitoring dry vegetation in semi-arid areas. According to Ji et al. (2020), the red and NIR bands from Sentinel-2 were identified to be effective in improving the accuracy of non-photosynthetic vegetation cover fraction estimation. Kowalski et al. (2022) pointed out that non-photosynthetic vegetation often had a stronger reflectance increase in the red edge to the NIR wavelength region (different from soil reflectance). Furthermore, we suggest the use of these indices that differentiate the soil from non-photosynthetic vegetation for dry mass monitoring, and as stated by Verrelst et al. (2015), there is no reason to limit the estimation to two-band indices when multiple bands are available.
This study also showed that a saturation of the estimates occurs at thresholds equal to 2,200 kg DM/ha for BH and 3,000 kg DM/ha for BT regardless of the sensor type (Supplementary Figure S3). Our results are thereby in line with those of Jacques et al. (2014) who showed a saturation of the herbaceous mass estimation with values above 2,500 kg DM/ha using the STI based on SWIR1 and SWIR2 bands from MODIS.
4.1.2 Selection of modeling approach
The multilinear regression model (the best model of this study) (Table 3) showed better performance than the random forest and gradient boosting machines models, regardless of sensor type. The weaker performance of the machine learning algorithms could be explained by the small size of the dataset (33 samples). In fact, Li et al. (2014) showed that the larger the dataset, the better the performance of the random forest model in their study on improving the linkage affinity prediction of scoring functions on the substitution of random forest for linear regression. This conclusion was also reached by Ding et al. (2020) in their study on the comparison of empirical regressions and machine learning methods for crop residue cover estimation using Sentinel-2 data, as well as by Wang et al. (2016) in their study on wheat biomass estimation using the random forest regression algorithm and remote sensing data. They all reported that the accuracy of the machine learning approaches was improved when increasing the training sample size relative to the total sample population.
4.2 Dynamics of vegetation mass throughout the dry-season
Our results showed a diminution in forage dry mass during the dry season, from January to May (Figure 5). These results are consistent with those of Sanon et al. (2015) who showed that the availability of herbaceous forage and grazed forage was significantly reduced during the dry season in their study on the seasonal dynamics of herbaceous forage production in Sahelian pastures used by domestic ruminants. Furthermore, Sanon et al. (2015) indicated that, in addition to biological aging, this reduction in dry mass during the dry season could be accentuated by livestock trampling and human activities such as cutting wood for charcoal and cutting certain herbaceous species such as Andropogon gayanus to obtain straw or bushfire.
4.3 Comparison of the best herbaceous dry mass estimation model with Jacques’s model on moderate resolution imaging spectroradiometer images
The STI index has been proven suitable to monitor dry vegetation mass in the Gourma region of Mali but is potentially suitable for many other semi-arid areas (Jacques et al., 2014).
The simple linear model developed in this study using only the STI index and the one developed by Jacques et al. (2014) based on MODIS images (Supplementary Figure S4) showed a similar correlation coefficient of 0.53. The dry vegetation mass estimation model of the Malian Gourma (Jacques et al., 2014) was implemented through a set of field measurements (26 sites) along the 1-km transect and over the 7-year period (2004–2011). In their study, the best results were obtained with indices such as the short-wave infrared bands (R2 = 66%, n = 126, RRMSE = 44%, index = STI). In contrast to several studies that reported the relevance of the STI for estimating dry vegetation mass such as that by Jacques et al. (2014) or Kergoat et al. (2015), this study showed that this index (Supplementary Table S5) was not the most suited for monitoring dry vegetation mass in Senegalese rangelands (R2 = 42%, RRMSE = 39%).
5 Conclusion
The performance assessment of estimation models of dry season forage dry mass through several modeling approaches and vegetation indices derived from three widely used satellite sensor systems (i.e., MODIS, Landsat-8, and Sentinel-2) allowed the following conclusions:
- Sentinel-2 overall provides better estimates of herbaceous dry mass (BH) and total forage dry mass (BT) in silvopastoral ecosystems in Senegal;
- MODIS and Landsat-8 data could also be used for predicting BH and BT in the study area with nearly similar performance;
- a multilinear model is preferred for estimating dry season vegetation when only limited numbers of sample points are available;
- The indices NDI5, DFI, GRCI, TCARI, SRI, and RVI3 are all relevant to estimate BH and BT in Sahelian drylands.
This study demonstrated that dry season vegetation mass could be accurately predicted (RRMSE = 26%) using multilinear models and satellite indices that include several spectral bands covering both visible, near-infrared, and shortwave infrared wavelengths. Most countries in the Sahel region calculate feed balances only once a year, using estimated forage dry mass toward the end of the rainy season. This constitutes a shortcoming as such assessment offers increasingly less detailed information on the feed status and potential forage deficits as the dry season, lasting up to 9 months, progresses. It also hinders the efficiency of response measures potentially to be taken to alleviate such deficit. While several countries in West Africa are currently improving their national feed balance inventory tools, better estimates of available dry mass over the year and during the dry season, in particular, are timely signs of progress. As a perspective to this study, we recommend further increasing the number of sampling sites, taking into account the size of the ecoregions as well as performing further analysis of the impact of fires on the satellite-based estimation of forage resources.
Data availability statement
The raw data supporting the conclusions of this article will be made available by the authors, without undue reservation.
Author contributions
AL, AD, LL, and CB contributed to the research design, acquisition, analysis, interpretation of data, and writing of the manuscript. ST, PH, RF, TT, and BN provided comments and suggestions on the acquired data and data analysis. All authors contributed to the final version of the manuscript.
Funding
This research was financed by “Carbon sequestration and greenhouse gas emissions in (agro) silvopastoral ecosystems in the Sahelian CILSS states” (CaSSECS) project (FOOD/2019/410-169) supported by European Union under the “Development Smart Innovation through Research in Agriculture” (DeSIRA) Initiative. TT was additionally funded by the Swedish National Space Agency (SNSA 2021-00144; 2021-00111) and FORMAS (Dnr. 2021-00644).
Conflict of interest
The authors declare that the research was conducted in the absence of any commercial or financial relationships that could be construed as a potential conflict of interest.
Publisher’s note
All claims expressed in this article are solely those of the authors and do not necessarily represent those of their affiliated organizations, or those of the publisher, the editors, and the reviewers. Any product that may be evaluated in this article, or claim that may be made by its manufacturer, is not guaranteed or endorsed by the publisher.
Supplementary material
The Supplementary Material for this article can be found online at: https://www.frontiersin.org/articles/10.3389/fenvs.2022.931299/full#supplementary-material
Supplementary Table S1 | List of the 29 vegetation indices used in this study.
Supplementary Table S2 | Number of models tested to estimate BH and BT.
Supplementary Table S3 | Optimization parameters used with random forest.
Supplementary Table S4 | Optimization parameters used with Gradient Bosting Machines.
Supplementary Table S5 | Simple linear models for the assessment of the herbaceous biomass during the dry-season developed by Jacques et al. (2014) and in this study, both using the STI index based on MODIS and the best model using Sentinel-2 images.
Supplementary Table S6 | Performance of MLS, MML, RF and GBM models with Landsat-8.
Supplementary Table S7 | Performance of MLS, MML, RF and GBM models with MODIS.
Supplementary Table S8 | Performance of MLS, MML, RF and GBM models with Sentinel-2.
References
Brandt, M., Hiernaux, P., Tagesson, T., Verger, A., Rasmussen, K., Diouf, A. A., et al. (2016). Woody plant cover estimation in drylands from Earth Observation based seasonal metrics. Remote Sens. Environ. 172, 28–38. doi:10.1016/j.rse.2015.10.036
Briske, D. D., Joyce, L. A., Polley, H. W., Brown, J. R., Wolter, K., Morgan, J. A., et al. (2015). Climate-change adaptation on rangelands: Linking regional exposure with diverse adaptive capacity. Front. Ecol. Environ. 13 (5), 249–256. doi:10.1890/140266
Broge, N. H., and Leblanc, E. (2001). Comparing prediction power and stability of broadband and hyperspectral vegetation indices for estimation of green leaf area index and canopy chlorophyll density. Remote Sens. Environ. 76 (2), 156–172. doi:10.1016/S0034-4257(00)00197-8
Busetto, L., and Ranghetti, L. (2016). MODIStsp: an R package for automatic preprocessing of MODIS Land Products time series. Comput. Geosci. 97, 40–48. doi:10.1016/j.cageo.2016.08.020
Cao, X., Chen, J., Matsushita, B., and Imura, H. (2010). Developing a MODIS-based index to discriminate dead fuel from photosynthetic vegetation and soil background in the Asian steppe area. Int. J. Remote Sens. 31 (6), 1589–1604. doi:10.1080/01431160903475274
Chirat, G., Groot, J. C. J., Messad, S., Bocquier, F., and Ickowicz, A. (2014). Instantaneous intake rate of free-grazing cattle as affected by herbage characteristics in heterogeneous tropical agro-pastoral landscapes. Appl. Animal Behav. Sci. 157, 48–60. doi:10.1016/j.applanim.2014.06.003
Daughtry, C. S. T. (2001). Agroclimatology: Discriminating crop residues from soil by shortwave infrared reflectance. Agron. J. 93 (1), 125–131. doi:10.2134/agronj2001.931125x
Daughtry, C. S. T., Hunt, E. R., and Mcmurtrey, J. E. (2004). Assessing crop residue cover using shortwave infrared reflectance. Remote Sens. Environ. 90, 126. doi:10.1016/j.rse.2003.10.023
Delon, C., Mougin, E., Serça, D., Grippa, M., Hiernaux, P., Diawara, M., et al. (2015). Biogenic NO emissions from soils in a Sahelian rangeland Modelling the effect of soil moisture and organic matter degradation on biogenic NO emissions from soils in Sahel rangeland (Mali) Biogenic NO emissions from soils in a Sahelian rangeland. Biogeosciences Discuss. 12, 1155–1203. doi:10.5194/bgd-12-1155-2015
Diallo, O., Diouf, A., Hanan, N. P., Ndiaye, A., and Prévost, Y. (1991). AVHRR monitoring of savanna primary production in Senegal, west Africa: 1987-1988. Int. J. Remote Sens. 12 (6), 1259–1279. doi:10.1080/01431169108929725
Dicko, M. S., Djitèye, M. A., and Sangaré, M. (2006). Les systèmes de production animale au Sahel. Sci. Changements Planétaires /Sécheresse 17 (1), 83–97. Available at: http://www.jle.com/fr/revues/sec/e-docs/les_systemes_de_production_animale_au_sahel_270090/article.phtml?tab=texte.
Ding, Y., Zhang, H., Wang, Z., Xie, Q., Wang, Y., Liu, L., et al. (2020). Remote Sens. (Basel)., 12(9), 1470. doi:10.3390/rs12091470Available at: https://sci-hub.se/https://www.mdpi.com/2072-4292/12/9/1470.
Diouf, A. A., Brandt, M., Verger, A., Jarroudi, M., Djaby, B., Fensholt, R., et al. (2015). Fodder biomass monitoring in sahelian rangelands using phenological metrics from FAPAR time series. Remote Sens. 7 (7), 9122–9148. doi:10.3390/rs70709122
Diouf, A. A., Djaby, B., Diop, M. B., Wele, A., Ndione, J.-A., and Tychon, B. (2014). “Fonctions d’ajustement pour l’estimation de la production fourragère herbacée des parcours naturels du Sénégal à partir du NDVI S10 de SPOT-vegetation,” in XXVIIème Colloque de l’Association Internationale de Climatologie, Dijon, France, July 2–5, 2014.
Diouf, A., and Lambin, E. F. (2001). Monitoring land-cover changes in semi-arid regions: Remote sensing data and field observations in the Ferlo, Senegal. J. Arid Environ. 48 (2), 129–148. doi:10.1006/jare.2000.0744
Drusch, M., Del Bello, U., Carlier, S., Colin, O., Fernandez, V., Gascon, F., et al. (2012). Sentinel-2: ESA’s optical high-resolution mission for GMES operational services. Remote Sens. Environ. 120, 25–36. doi:10.1016/J.RSE.2011.11.026
EROS. (2020). USGS EROS archive - Landsat archives - Landsat 8-9 OLI/TIRS collection 2 level-2 science products | US, U.S. Geological Survey. Available at: https://www.usgs.gov/centers/eros/science/usgs-eros-archive-landsat-archives-landsat-8-9-olitirs-collection-2-level-2.
FAO (2020). Estimation des bilans fourragers dans la région du Sahel d’Afrique de l’Ouest et Centrale. doi:10.4060/ca9111fr
Fensholt, R., Sandholt, I., and Rasmussen, M. S. (2004). Evaluation of MODIS LAI, fAPAR and the relation between fAPAR and NDVI in a semi-arid environment using in situ measurements. Remote Sens. Environ. 91, 490. doi:10.1016/j.rse.2004.04.009
Garba, I., Djaby, B., Salifou, I., Boureima, A., Toure, I., and Tychon, B. (2015). Evaluation des ressources pastorales au sahel nigérien à l’aide des données NDVI issues de SPOT-vegetation et MODIS. Eur. J. Remote. Sens. 1, 13–28.
Garba, I., Djaby, B., Salifou, I., Toure, I., Samba, A., Yapo, Y., et al. (2017). Improving fodder biomass modeling in the sahelian zone of Niger using the multiple linear regression method. Available at: www.ijraset.com.
Gorelick, N., Hancher, M., Dixon, M., Ilyushchenko, S., Thau, D., and Moore, R. (2017). Google Earth engine: Planetary-scale geospatial analysis for everyone. Remote Sens. Environ. 202, 18–27. doi:10.1016/J.RSE.2017.06.031
Guerschman, J., Held, A., Donohue, R., Renzullo, L., Sims, N., Kerblat, F., et al. (2015). L’activité GEOGLAM sur les parcours et la productivité des pâturages : Progrès récents et orientations futures - NASA/ADS. Available at: https://ui.adsabs.harvard.edu/abs/2015AGUFM.B43A0531G/abstract.
Haboudane, D., Miller, J. R., Tremblay, N., Zarco-Tejada, P. J., and Dextraze, L. (2002). Integrated narrow-band vegetation indices for prediction of crop chlorophyll content for application to precision agriculture. Remote Sens. Environ. 81 (2–3), 416–426. doi:10.1016/S0034-4257(02)00018-4
Ham, F., and Fillol, E. (2012). Pastoral surveillance system and feed inventory in the Sahel. Available at: http://web.vgt.vito.be/documents/BioPar/g2-BP-RP-BP053-ProductUserManu- Hiernaux.
Hiernaux, P. (1980). “Inventory of the browse potential of bushes, trees and shrubs in an area of the sahel in Mali: Method and initial results,” in Browse in AfricaILCA: Addis ababa, Ethiopia. Editor H. N. L. Houerou. Available at: https://books.google.bf/books?hl=en&lr&id=f8wzMTZzPZYC&oi=fnd&pg=PA197&ots=OtA4WBbo1Z&sig=q-CtP-_mT64_BttQu2rCjECWXxQ&redir_esc=y#v=onepage&q&f=false.
Hiernaux, P., Ayantunde, A., Kalilou, A., Mougin, E., Gérard, B., Baup, F., et al. (2009). Trends in productivity of crops, fallow and rangelands in Southwest Niger: Impact of land use, management and variable rainfall. J. Hydrology 375 (1–2), 65–77. doi:10.1016/j.jhydrol.2009.01.032
Hiernaux, P., Diawara, M. O., and Assouma, M. H. (2018). Au Sahel, maintenir l’élevage pastoral pour s’adapter au changement climatique. Available at: https://agritrop.cirad.fr/593558/1/Article dans le Monde.pdf.
Holechek, J. L., Geli, H. M. E., Cibils, A. F., and Sawalhah, M. N. (2020). Climate change, rangelands, and sustainability of ranching in the Western United States. Sustain. Switz. 12 (12), 4942. doi:10.3390/SU12124942
Huete, A. R. (1988). A soil-adjusted vegetation index ( SAVI ). Remote Sens. Environ. 25, 295–309. doi:10.1016/0034-4257(88)90106-x
ISRA (2003). Rapport national sur L’état des ressources phytogénétiques pour L’alimentation et L’agriculture sénégal.
Jacques, D. C., Kergoat, L., Hiernaux, P., Mougin, E., and Defourny, P. (2014). Monitoring dry vegetation masses in semi-arid areas with MODIS SWIR bands. Remote Sens. Environ. 153, 40–49. doi:10.1016/j.rse.2014.07.027
Ji, C., Li, X., Wei, H., and Li, S. (2020). Comparison of different multispectral sensors for photosynthetic and non-photosynthetic vegetation-fraction retrieval. Remote Sens. 12 (1), 115. Page 115. doi:10.3390/RS12010115
Jin, X., Ma, J., Wen, Z., Song, K., Ozdogan, M., Bajwa, S., et al. (2015). Estimation of maize residue cover using landsat-8 OLI image spectral information and textural features. Remote Sens. (Basel). 7, 14559–14575. doi:10.3390/rs71114559
Jordan, C. F. (1969). Derivation of Leaf-Area Index from quality of light on the forest floor. Ecology 50 (4), 663–666. doi:10.2307/1936256
Kavoosi, Z., Raoufat, M. H., Dehghani, M., Abdolabbas, J., Kazemeini, S. A., and Nazemossadat, M. J. (2020). Feasibility of satellite and drone images for monitoring soil residue cover. J. Saudi Soc. Agric. Sci. 19 (1), 56–64. doi:10.1016/j.jssas.2018.06.001
Kergoat, L., Hiernaux, P., Dardel, C., Pierre, C., Guichard, F., and Kalilou, A. (2015). Dry-season vegetation mass and cover fraction from SWIR1.6 and SWIR2.1 band ratio: Ground-radiometer and MODIS data in the Sahel. Int. J. Appl. Earth Observation Geoinformation 39, 56–64. doi:10.1016/j.jag.2015.02.011
Kowalski, K., Okujeni, A., Brell, M., and Hostert, P. (2022). Quantifying drought effects in Central European grasslands through regression-based unmixing of intra-annual Sentinel-2 time series. Remote Sens. Environ. 268, 112781. doi:10.1016/J.RSE.2021.112781
Kuhn, M., Wing, J., Weston, S., Williams, A., Keefer, C., Engelhardt, A., et al. (2021). caret: Classification and regression training version 6.0-90 from CRAN. Available at: https://rdrr.io/cran/caret/.
Li, H., Leung, K. S., Wong, M. H., and Ballester, P. J. (2014). Substituting random forest for multiple linear regression improves binding affinity prediction of scoring functions: Cyscore as a case study. BMC Bioinforma. 15 (1), 291. doi:10.1186/1471-2105-15-291
Liaw, A., and Wiener, M. (2002). Classification and regression by randomForest. Available at: http://www.stat.berkeley.edu/.23
Loison, S. alobo, and Bignebat, C. (2017). Patterns and determinants of household income diversification in rural Senegal and Kenya∗. BIGNEBAT 93-126 Patterns and Determinants of Household Income Diversification in Rural Senegal and Kenya.pdf https://agritrop.cirad.fr/584564/1/JPAID 8%281%29 ALOBO LOISON %26.
Mbow, C., Fensholt, R., Rasmussen, K., and Diop, D. (2013). Can vegetation productivity be derived from greenness in a semi-arid environment? Evidence from ground-based measurements. J. Arid Environ. 97, 56–65. doi:10.1016/j.jaridenv.2013.05.011
Mcnairn, H., and Protz, R. (1993). Mapping corn residue cover on agricultural fields in oxford county, ontario, using thematic mapper. Can. J. Remote Sens. 19 (2), 152–159. doi:10.1080/07038992.1993.10874543
Midi, H., and Bagheri, A. (2010). Robust multicollinearity diagnostic measure in collinear data set respondent driven sampling method view project data mining view project arezoo Bagheri national population studies robust multicollinearity diagnostic measure in collinear data set. Available at: https://www.researchgate.net/publication/265284031.
Mottet, A., de Haan, C., Falcucci, A., Tempio, G., Opio, C., and Gerber, P. (2017)., 14. Elsevier B.V, 1–8. doi:10.1016/j.gfs.2017.01.001Livestock: On our plates or eating at our table? A new analysis of the feed/food debateGlob. Food Secur.
Nadiri, A. A., Khatibi, R., Khalifi, P., and Feizizadeh, B. (2020). A study of subsidence hotspots by mapping vulnerability indices through innovatory ‘ALPRIFT’ using artificial intelligence at two levels. Bull. Eng. Geol. Environ. 79 (88), 3989–4003. doi:10.1007/S10064-020-01781-3
Najaf, P., Navid, H., Feizizadeh, B., Eskandar, I., and Blaschke, T. (2019). Sci-Hub | Fuzzy Object-Based Image Analysis Methods Using Sentinel-2A Landsat-8 Data Map Charact. Soil Surf. Residue. Remote Sens., 11(21), 2583 | doi:10.3390/rs11212583Available at: https://sci-hub.se/10.3390/rs11212583
Nash, J. E., and Sutcliffe, J. V. (1970). River flow forecasting through conceptual models part I - A discussion of principles. J. Hydrology 10 (3), 282–290. doi:10.1016/0022-1694(70)90255-6
Otgonbayar, M., Atzberger, C., Chambers, J., and Damdinsuren, A. (2019). Mapping pasture biomass in Mongolia using partial least squares, random forest regression and Landsat 8 imagery. Int. J. Remote Sens. 40, 3204–3226. doi:10.1080/01431161.2018.1541110
Rana, P., Korhonen, L., Gautam, B., and Tokola, T. (2014). Effect of field plot location on estimating tropical forest above-ground biomass in Nepal using airborne laser scanning data. Isprs J. Photogrammetry Remote Sens. 94, 55–62. doi:10.1016/j.isprsjprs.2014.04.012
Rondeaux, G., Steven, M., and Baret, F. (1996). Optimization of soil-adjusted vegetation indices. Remote Sens. Environ. 55 (2), 95–107. doi:10.1016/0034-4257(95)00186-7
Rouse, W. J., Haas, R. H., Schell, J. A., and Deering, D. W. (1974). Monitoring vegetation systems in the Great Plains with Erts. Patent No. PAPER-A20). doi:10.1021/jf60203a024
Sanon, O., Ouattara, F., and Savadogo, M. (2015). Seasonal dynamic of herbaceous fodder production in the Sahelian pastures used by domestic ruminants. J. Agric. Environ. Int. Dev. (JAEID) 109 (1), 123–138. doi:10.12895/JAEID.20151.317
Sayre, N. F., McAllister, R. R., Bestelmeyer, B. T., Moritz, M., and Turner, M. D. (2013). Earth stewardship of rangelands: Coping with ecological, economic, and political marginality. Front. Ecol. Environ. 11 (7), 348–354. doi:10.1890/120333
Schaaf, C., and Wang, Z. (2015). MODIS bidirectional reflectance distribution function (BRDF) /albedo parameter. Available at: https://modis.gsfc.nasa.gov/data/dataprod/mod43.php.
Sloat, L. L., Gerber, J. S., Samberg, L. H., Smith, W. K., Herrero, M., Ferreira, L. G., et al. (2018). Increasing importance of precipitation variability on global livestock grazing lands. Nat. Clim. Chang. 8 (3), 214–218. doi:10.1038/s41558-018-0081-5
Sullivan, D. G., Truman, C. C., Schomberg, H. H., Endale, D. M., and Strickland, T. C. (2006). Evaluating techniques for determining tillage regime in the southeastern Coastal Plain and Piedmont. Agron. J. 98, 1236–1246. doi:10.2134/agronj2005.0294
Tagesson, T., Fensholt, R., Cropley, F., Guiro, I., Horion, S., Ehammer, A., et al. (2015). Dynamics in carbon exchange fluxes for a grazed semi-arid savanna ecosystem in West Africa. doi:10.1016/j.agee.2015.02.017
Tappan, G. G., Sall, M., Wood, E. C., and Cushing, M. (2004). Ecoregions and land cover trends in Senegal. J. Arid Environ. 59, 427–462. doi:10.1016/j.jaridenv.2004.03.018
Thompson, C. G., Kim, R. S., Aloe, A. M., and Becker, B. J. (2017). Basic and applied social psychology extracting the variance inflation factor and other multicollinearity diagnostics from typical regression results. doi:10.1080/01973533.2016.1277529
Traore, S. B., Ali, A., Tinni, S. H., Samake, M., Garba, I., Maigari, I., et al. (2014). Agrhymet: A drought monitoring and capacity building center in the west Africa region. Weather Clim. Extrem. (3), 22–30. doi:10.1016/J.WACE.2014.03.008
Tucker, C. J., Vanpraet, C. L., Sharman, M. J., and Van Ittersum, G. (1985). Satellite remote sensing of total herbaceous biomass production in the senegalese sahel: 1980-1984. Remote Sens. Environ. 17 (3), 233–249. doi:10.1016/0034-4257(85)90097-5
Van Deventer, A. P., Ward, A. D., Gowda, P. H., and Lyon, J. G. (1997). Using thematic mapper data to identify contrasting soil plains and tillage practices. Photogrammetric Eng. Remote Sens. 63 (1), 87–93.
Verrelst, J., Rivera, J. P., Veroustraete, F., Muñoz-Marí, J., Clevers, J. G. P. W., Camps-Valls, G., et al. (2015). Experimental Sentinel-2 LAI estimation using parametric, non-parametric and physical retrieval methods – A comparison. doi:10.1016/j.isprsjprs.2015.04.013
Wang, ai, Zhou, X., Zhu, X., Dong, Z., and Guo, W. (2016). Estimation of biomass in wheat using random forest regression algorithm and remote sensing data. doi:10.1016/j.cj.2016.01.008
Zhang, W., Brandt, M., Guichard, F., Tian, Q., and Fensholt, R. (2017). Using long-term daily satellite based rainfall data (1983–2015) to analyze spatio-temporal changes in the sahelian rainfall regime. Available at: https://www.elsevier.com/open-access/userlicense/1.0/.
Keywords: forage dry mass, dry season, MODIS MCD43A4, Landsat-8, Sentinel-2, food security, statistical modeling, Senegalese rangelands
Citation: Lo A, Diouf AA, Diedhiou I, Bassène CDE, Leroux L, Tagesson T, Fensholt R, Hiernaux P, Mottet A, Taugourdeau S, Ngom D, Touré I, Ndao B and Sarr MA (2022) Dry season forage assessment across senegalese rangelands using earth observation data. Front. Environ. Sci. 10:931299. doi: 10.3389/fenvs.2022.931299
Received: 28 April 2022; Accepted: 07 September 2022;
Published: 29 September 2022.
Edited by:
Lindsay Beaumont Hutley, Charles Darwin University, AustraliaReviewed by:
Abel Ramoelo, University of Pretoria, South AfricaNiall Patrick Hanan, New Mexico State University, United States
Copyright © 2022 Lo, Diouf, Diedhiou, Bassène, Leroux, Tagesson, Fensholt, Hiernaux, Mottet, Taugourdeau, Ngom, Touré, Ndao and Sarr. This is an open-access article distributed under the terms of the Creative Commons Attribution License (CC BY). The use, distribution or reproduction in other forums is permitted, provided the original author(s) and the copyright owner(s) are credited and that the original publication in this journal is cited, in accordance with accepted academic practice. No use, distribution or reproduction is permitted which does not comply with these terms.
*Correspondence: Adama Lo, bG9hZGFtYTExQGdtYWlsLmNvbQ==