- 1State Key Laboratory of Hydrology and Water Resources and Hydraulic Engineering Science, Nanjing Hydraulic Research Institute, Nanjing, China
- 2State Key Laboratory of Hydro Science and Engineering, Department of Hydraulic Engineering, Tsinghua University, Beijing, China
- 3Water Conservancy Development Research Center of Taihu Basin Authority of Ministry of Water Resources, Shanghai, China
- 4Jiangsu Province Hydrology and Water Resources Investigation Bureau, Nanjing, China
Urbanization has reduced river network connectivity, posing a great threat to water security. However, the mechanism through which changes in river network connectivity impact water security remains uncertain. River network connectivity and water security have been separately and thoroughly assessed by several researchers; however, few studies conducted a coupled assessment of these two aspects together, which may shed light on this mechanism. Based on assessment indicators developed in previous studies and key influence factors identified in the study area, this study proposed a comprehensive evaluation method to continually evaluate the adaptability between river network connectivity and water security in the Wuchengxiyu region, a highly urbanized area in Eastern China. The continuous evaluation was conducted for the period 2010–2019 based on the coupling coordination degree calculation formula. The results show that from 2010 to 2015, the coupling coordination degree between river network connectivity and water security followed a downward trend, due to the uncoordinated development between water systems and urbanization. After 2015, an increasing trend was observed with the implementation of environmental policies. In the past decade, the water surface rate and the coverage rate of suitable flow velocity decreased from 4.59% to 4.28% and from 54.1% to 30.9%, respectively, which may have negative effects on water quality and limit the improvement of regional flood control capacity. Moreover, the evaluation results also prove that policies such as the Ecological River–Lake Construction and the River Chief System have contributed to improve the quality of the water environment and regional flood control. The proposed assessment framework can be used as a guidance to evaluate the relationship between water network connectivity and water security; moreover, it provides new ideas for water network system protection and water quality maintenance in similar highly urbanized areas.
1 Introduction
As a vital infrastructure to support economic development, interconnected river–lake systems play a major role in flood control, waterlogging elimination, water resources allocation, and aquatic environment protection (Wang et al., 2018; Yang et al., 2021). In China, several water conservancy projects have been implemented at the end of the 20th century to address the mismatch between water supply and demand, such as the Luan River–Tianjin Water Diversion Project in 1983 (Zhang et al., 2019), the Songhua River–Changchun Water Diversion Project in 1999 (Yang et al., 2019), and the South-to-North Water Diversion Project at the beginning of the 21st century (Xu et al., 2010; Nong et al., 2020). More in general, an increasing number of water system connection projects have been built or are ongoing in the last 20 years, not only for the purposes of management of water resources, but also for ecological environment protection. These include the Yangtze River–Taihu Lake Water Diversion Project in 2002 (Liu et al., 2017; Qin et al., 2018), the Integrative Conservation Project of Hangzhou West Lake in 2009 (You et al., 2015), and the Yellow River–Hebei Province Water Diversion Project in 2017 (Li et al., 2021). Although these projects modified the water system and promoted the connectivity of the watershed system, numerous urban drainage systems have been destroyed due to rapid urbanization in several urban or peri-urban areas, causing a series of water security problems (Rashid et al., 2018). Moreover, urbanization entailed great changes in regional land use, filling and interrupting several rivers (Chen et al., 2007). In the Taihu Lake Basin in Eastern China, from the 1980s to the 2010s, river network density decreased by 11.3%; moreover, the degradation rate of river networks increased rapidly, while the urbanization rate reached 40% (Xu et al., 2018), resulting in frequent urban waterlogging and pollution-induced water shortage problems (Wei, 2003). Deng et al. (2020) showed that from 1990 to 2015, urbanization had a significant impact on river systems in the mid-west part of China, and the attenuation rate of river systems was positively correlated with the growth rate of urban construction land. This caused severe flood risks and ecological problems in the Wei River Basin. Moreover, due to the rapid urbanization process, in 100 cities in the United States; the index of water area, the numerical density of water bodies, and the density of flow channels decreased by 89, 25, and 71%, respectively (Steele et al., 2014); this is considered as an important reason for the increase in flood risks and environmental landscape loss.
In order to support the improvement of urban water security, it is necessary to assess the influence of river network connectivity on water security. Several researchers used assessment indexes to evaluate river network connectivity and water security (Cote et al., 2009; Xu et al., 2012; Deng et al., 2018; Deng, 2019; Garbin et al., 2019; Shao et al., 2020; Gao et al., 2022). Cui et al. (2009) used the connectivity index γ and the circuitry index α, which are based on the graph theory, to analyze natural and designed channel networks and assess the impact of their optimization on flood control in Xiaoqinghe River Basin in China. Phillips et al. (2011) also used the graph theory to describe the relationship between hydrological connectivity and basin runoff conditions in the Baker Creek Basin in Canada. Meng et al. (2014) used a series of assessment indexes of river quantity, density, connectivity, flow potential, and water transport ability to evaluate the urban river network connectivity in Huaian City, China. Xu et al. (2018) used similar assessment indexes to analyze the connectivity between river network change and urbanization in the Taihu Lake Basin. In parallel, also hydraulic models such as MIKE11\MIKE21 (Karim et al., 2012), HEC–HMS (Gao et al., 2018), and CRUM2D (Lane et al., 2009), have been used to quantify river network connectivity. Moreover, water security has been assessed by several research groups (Norman et al., 2013; Veettil and Mishra, 2016; Babel and Shinde, 2018; Shrestha et al., 2018; Cai et al., 2020). Jiang and Yang (2015) built a water security assessment framework to evaluate the water security conditions of 47 countries in the Asia-Pacific region, considering domestic water safety, economic water security, urban water security, environmental water security, and resilience to water-related disasters. Zuo et al., 2020; 2021 combined 16 basic indicators and 34 alternative indicators into an assessment framework for river security management along the Yellow River. A case study was conducted in the United States to develop a multiscale analysis of water security by using 10 sub-indicators focusing on specific dimensions including water quality, productivity, and infrastructure. (Doeffinger and Hall, 2021) Many of the previous assessment indexes can evaluate the conditions of river network connectivity and water security comprehensively and objectively, but some indexes needed for assessing materials are difficult to obtain. In this study, data accessibility will be an important factor to consider so that the assessment can be proceeded successfully and accurately.
As a result, river network connectivity and water security have been separately and thoroughly assessed by several researchers and in many regions. However, few studies performed an assessment of these two aspects together to determine how changes in river network connectivity affect regional water security. The concept of adaptability refers to the coordination and consistency between different subjects, and reflects the suitability and matching relationship between subjects (Wang et al., 2021). Several research groups in other fields focused on evaluating the coupling degree and adaptability between two separate systems. Lin et al. (2017) built a coupling and coordination model between urbanization and river system network for the Jiangsu Province of China. Han et al. (2020) assessed the degree of coupling of the water–food–energy nexus in 30 provinces across China. Liu et al. (2021) proposed an integrated supply–demand coupling model to evaluate water security in China. This demonstrates that the coupling analysis can be applied to the suitability analysis of water system connectivity and water security.
The Wuchengxiyu (WCXY) region, as one of the regions with the highest urbanization in Eastern China and an important part of Taihu Lake Basin, was selected as a representative case study area. In fact, this region is characterized by a plain river network system and high urbanization. On the one hand, the natural river network system in WCXY has a relatively high density and connectivity, extending in all directions and connected with each other, and providing a good foundation for regional flood control, industrial and agricultural production, residential water consumption, navigation condition, and water quality conservation. On the other hand, rapid urbanization has led to changes in the river–lake system structure, reducing the drainage ability and increasing the pollution load in WCXY, and resulting in the increase in flood risk and in the likelihood of water environmental problems. As a result, a problem has gradually emerged in this area of adaptability between the connectivity of the river–lake system and the needs for economic and social development. Hence, in this study, a continuous assessment framework was developed to quantitatively assess river network connectivity, regional water security, and adaptability between these elements in WCXY, and to identify the main problems that limited the development of water security, providing a guide to implement future river regulation measures.
2 Material and methods
2.1 Study area and data sources
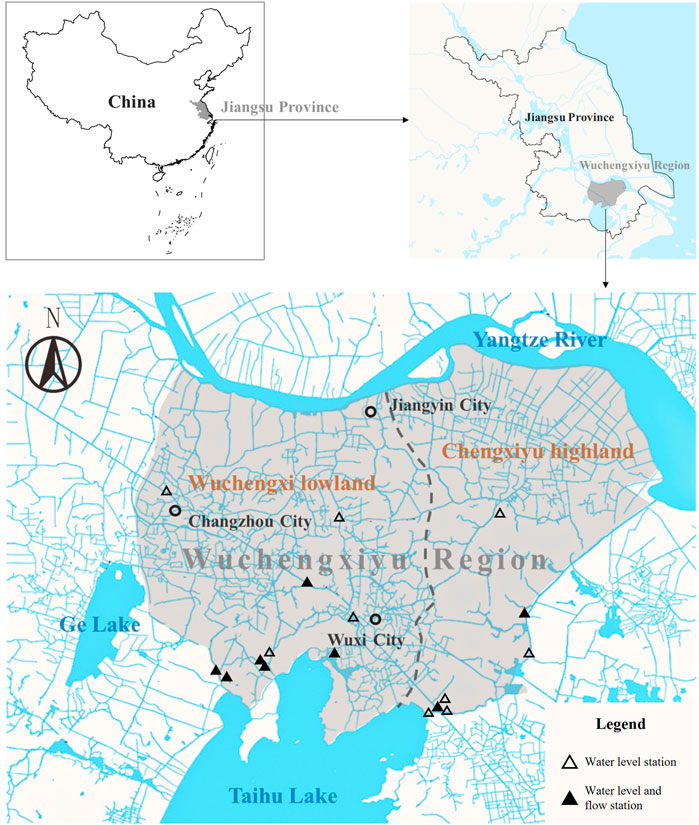
The WCXY region is a low-lying plain in the lower course of the Yangtze River in the southern Jiangsu Province, with a total area of 4,016 km2. It lies to the south of the Yangtze River, to the north of the Taihu Lake, to the east of the Huxi District, and to the west of the Wangyu River’s east bank, and includes highly urbanized cities such as Changzhou and Wuxi. The terrain of the WCXY region is relatively plain, and is divided by the Baiqu Port East Control Line into two zones, namely, Wuchengxi lowland and Chengxiyu highland, whose area is 2,255 km2 and 1,761 km2, respectively. WCXY has a subtropical monsoon climate; the multi-year average precipitation is 1,112 mm, mainly concentrated in the period from May to September and with great interannual and seasonal variations. The multi-year average temperature in this area is about 15.5°C, with the highest temperatures normally recorded in July and August and the lowest in January and February.
The hydrological data used in this study originate from the hydrological yearbooks of the Yangtze River Basin from 2010 to 2019, including daily water level data from 17 stations and daily flow data from eight stations (Figure 1). Water quality data were taken from the Jiangsu Province Hydrology Bureau and the Jiangsu Provincial Academy of Environmental Science. This study used 30 m land-use/land-cover (LUCC) data from the Institute of Geographic Science and Natural Resources Research.
2.2 Methods
The assessment of the coupling between river network connectivity and water security included the consideration of the connectivity of rivers and lakes and its impact on flood control safety, water supply security, and hydro-ecological environment security. As shown in Figure 2, in this study, we first evaluated river network connectivity and water safety separately, and then used the coupling coordination degree calculation formula to quantify the coordination degree between these two aspects. Before carrying out the evaluation, it was necessary to select the evaluation indexes that were suitable for such a highly urbanized and plain river network area. After selecting the evaluation indexes, the coupling assessment was performed to identify and solve water security problems, reflect the different aspects of water disasters, water resources, and water ecological environment, and consider the interaction between local and surrounding areas. As water security is a dynamic process, the coupling assessment index framework of river network connectivity and water security should be flexible. Table 1 presents an overview of the assessment framework of this study.
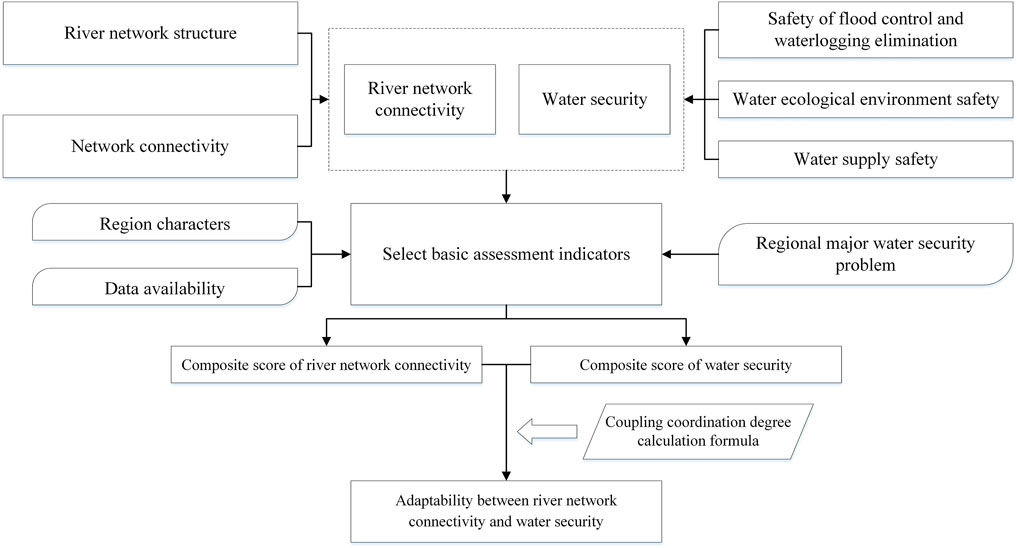
FIGURE 2. Assessment framework of adaptability between river network connectivity and water security.
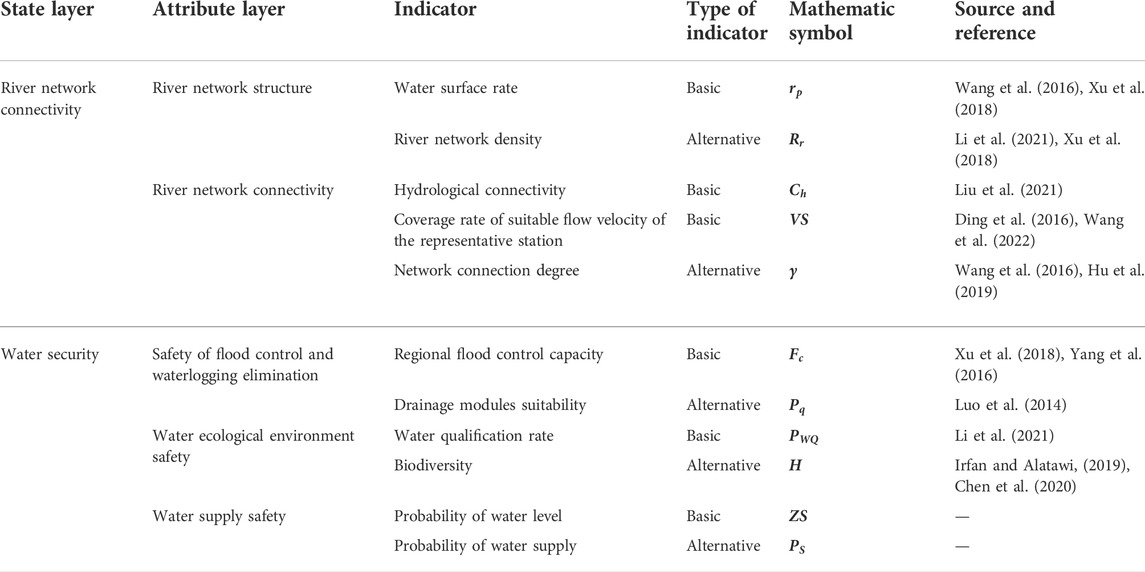
TABLE 1. Index framework to assess the adaptability between river network connectivity and water security.
2.2.1 Evaluation of river network connectivity
The assessment of river network connectivity included the evaluation of river network structure and of connectivity. In the WCXY region, rivers are densely distributed and well developed. The water surface rate and river network density were selected as indexes to evaluate the river network structure, while hydrological connectivity, suitable flow velocity coverage rate of the representative station, and network connection degree were selected as indexes to evaluate river network connectivity.
2.2.1.1 Water surface rate
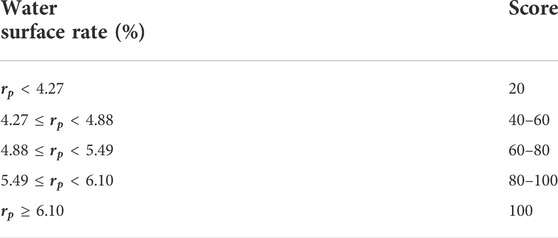
The water surface rate indicates the ratio of the water surface area to the total area of a region. Since the water surface area changes dynamically with the water level, this rate usually refers to the ratio of the water area at a constant or average water level to the total area of a region. The water surface rate provides an intuitive indication of water areas, and is also an important index of regional hydro-ecological space. Liu et al. (2021) research on the river network structure in the WCXY area shows that from the 1960s to the 2010s; the water surface rate continually decreased at a nearly stable rate, while the hydrological connectivity was in a steady state in the 1960s and decreased abruptly at the beginning of the 1970s, thereby indicating that a breakpoint of change in the river network occurred at that time. Moreover, with the adjustment of the national urban development policies, China’s urbanization started to increase in the 1970s, following a slow growth stage that was seriously hampering the industrialization process. Therefore, in this study, considering that the recreation of a virgin scenario of the river network is challenging, the river network condition in the 1960s was considered as the near-ideal state of the WCXY region.
Accordingly, the water surface rate in the 1960s was used as a reference value to measure the current water surface rate. The closer the current water surface rate to the historical natural water surface rate, the healthier the river network system, and the more harmonious the relationship between humans and water systems. The formula used to calculate the water surface rate
where
2.2.1.2 River network density (alternative indicator)
The river network density indicates the total length of a river per unit area, and reflects the drainage effectiveness of the river system in the basin. In general, the higher the river network density, the higher the connectivity level of the river and lake system. This study considered the state of river network density in the 1960s as the near-ideal state of the WCXY region, and used this value as a reference to measure the current river network density. The formula used to calculate river network density
where
2.2.1.3 Hydrological connectivity
Hydrological connectivity indicates the relevance of each river channel in an area based on water level differences (Liu et al., 2021). A high relevance of the water level from two monitoring sites means that river flow can easily move through channels between these two sites, that is, the river network system has a relatively high connectivity in this area. On the contrary, a low value of the index of hydrological connectivity means that river channels between two monitoring sites are interrupted or there are problems of channel filling. The calculation formula used is as follows:
where
2.2.1.4 Coverage rate of the suitable flow velocity of the representative station
The coverage rate of the suitable flow velocity of the representative station (
where
2.2.1.5 Network connection degree (alternative indicator)
The network connection degree represents the ratio of the number of interconnected channels in a river network to the maximum possible number of connections. The value of the network connection degree varies between 0 and 1, where a value of 0 indicates that no channels are connected, while a value of 1 indicates that each channel is connected to other channels. In other words, the higher the ratio, the higher the hydrological connectivity of the river network. This study considered the network connection degree in the 1960s in the WCXY region as the near-ideal state of the region, and used it as a reference value to measure the current network connection degree. The formula used to calculate the network connection degree
where
2.2.2 Water safety assessment
Based on natural geographic characteristics, river and lake water systems, and on the social and economic development of the WCXY region, six indicators of water safety assessment were constructed to characterize flood control safety, water supply safety, and water ecological environment safety. The aim was to analyze whether the current state of river and lake connectivity and the level of water security were coordinated and compatible. In relation to flood control and waterlogging elimination, considering the coordination between urban and regional waterlogging, the two indicators of regional flood control capacity and drainage modulus suitability were constructed. In relation to the water ecological environment, considering water environmental quality and biological safety, the two indicators of water qualification rate and biodiversity were constructed. In relation to water supply, as the WCXY region is a plain river network area with bottlenecks in water resources, the two indicators of water level probability and water supply probability were constructed.
2.2.2.1 Regional flood control capacity
Regional flood control capacity (
Actually, the flood control capacity standard in every region is different, and the regional governments in China have normally set flood control capacity targets under the guidance of the national ‘Standard for flood control (Deng et al., 2014)’, which considers the local development of society and economy. Therefore, it was necessary, in this study, to consider the flood control capacity target set in the local flood control plan as the ideal condition, and use it as a basis for scoring.
By the end of 2020, the flood protection standard in WCXY has reached a 30-year event, and will gradually increase to a 50-year event before 2025, which was set as a development goal in the regional flood control plan. Thus, the regional flood protection to a 50-year return flood was considered as the ideal condition in this study. However, in many other countries such as the United States, the United Kingdom, and Germany, a 100-year return flood is a widely accepted standard of flood control capacity (Begum et al., 2007; Hu et al., 2019; Environment Agency, 2020). So, 100-year return flood control capacity can be used as an ideal condition in the assessed areas without the specific regional flood control plan.
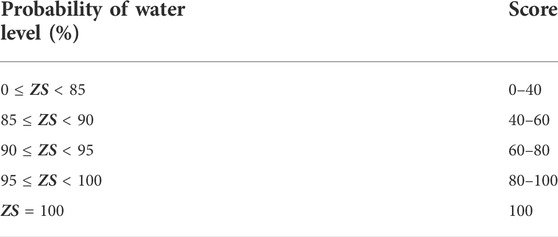
In terms of assessment criteria, a score of 100 points were assigned for reaching the standard of 50-year event, 80 points for 30-year event, 60 points for 20-year event, 40 points for 10-year event, and 20 points for 10-year event.
2.2.2.2 Drainage modulus suitability (alternative indicator)
Taihu Lake Basin is in a plain area characterized by a densely distributed river network, low terrain in its central part, and high water and tide levels outside the basin. The river network water level in this basin is often higher than the ground. Embankments have been built around low-lying areas for flood control and waterlogging elimination, forming polder areas. Polder gates have been built on the embankments, and pump stations in the polder area.
Drainage modulus suitability represents the closeness of the actual drainage modulus to the design drainage modulus in each polder area, which reflects the matching degree between current and designed drainage capacity. Since the magnitude of the drainage modulus has different impacts on the external area and the polder area, it was necessary to determine the drainage modulus that adapts to local conditions according to the size and importance of polder areas. A drainage modulus is considered as appropriate when it can meet certain urban or polder area drainage standards, and the corresponding discharged water can be absorbed at the regional level. The value of drainage modulus suitability generally varies between 0 and 100%, and the closer it is to 100%, the more favorable it is for regional flood control and waterlogging elimination. The formula used to calculate the drainage modulus suitability
where
2.2.2.3 Water qualification rate
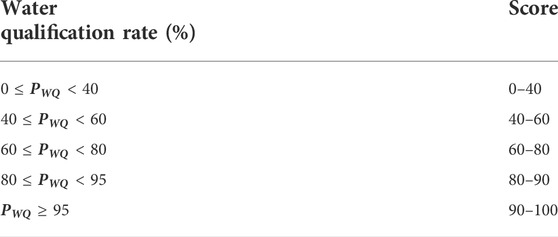
Water qualification rate refers to the ratio of the number of water quality monitoring points that reach the water quality standard to the total number of monitoring points among all representative monitoring points in a region. It is used to evaluate the qualification degree of overall water in the region. According to the national environmental quality standards for surface water of China (GB3838-2002), water quality is evaluated by several indicators including ammonia–nitrogen, chemical oxygen demand, and permanganate index. This means that only when all the indicators reach the water quality standards, the water quality of the monitoring point meets the setting requirements. The calculation formula used is as follows:
where
2.2.2.4 Biodiversity (alternative indicator)
Biodiversity is the main characteristic of biological communities. Clean waters host a number of species with relatively stable numbers of individuals. However, when a water body is polluted, each species has a different sensitivity and tolerance to new factors. Sensitive species die off under unfavorable conditions, while species with a strong resistance develop in large numbers under the new conditions. This phenomenon of community succession can be represented by the biodiversity index, which is an important measure of environmental quality. Based on the evaluation methods for aquatic organisms in Jiangsu Province’s regional specification for ecological river and lake status assessment (DB32/T 3674–2019), the diversity of phytoplankton and river resident algae was considered as important indicators to evaluate the water eco-environment. The biodiversity assessment was based on the Shannon–Wiener method, which is commonly used to measure community species diversity. The calculation formula of the Shannon–Wiener index is as follows:
where
2.2.2.5 Water level probability
Water level probability is defined as the ratio of the number of water level records that are lower than the minimum permitted level for water intake, to the total number of all the water level records in a study area. A water level below the minimum permitted level means that water demand cannot be satisfied in the area around that water level monitoring point. The value of water level probability ranges from 0 to 100%, and water demand will be satisfied when this index has an evaluation score of 100%, which indicates that all the users can meet their water demand in the study area. The formula used to calculate water level probability is as follows:
where
2.2.2.6 Water supply probability (alternative indicator)
Water supply probability refers to the comprehensive water supply guarantee rate of various industries in a region, including indicators of agricultural, industrial, and domestic water supply. The degree of guarantee is weighted on the basis of whether the water supply goals of each industry are met. Normally, as the economic loss caused by insufficient or interrupted water supply in urban life and industrial production is relatively large, the general water supply probability is in the range of 95–99%. However, agricultural water supply is mainly limited by economic and natural conditions, and water supply probability is relatively low. The formula used to calculate water supply probability is as follows:
where
2.2.3 Assessment of the adaptability between river network connectivity and water security
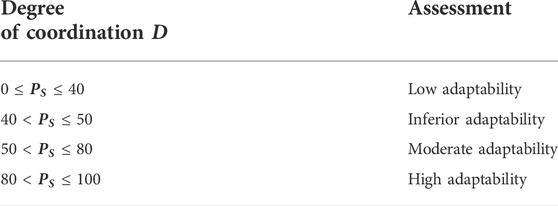
The aim of a coupling and coordination model was to analyze the degree of coordinated development of evaluation objects (Liu et al., 2017; Han et al., 2020; Liu et al., 2021); as such, it can be applied to the assessment of adaptability between river network connectivity and water security. A high adaptability between river network connectivity and water security means that changes in the river network system meet the demand for comprehensive, coordinated, and sustainable development of water security and urbanization.
The degree of coordination
where
3 Results and discussion
3.1 Analysis of river network connectivity
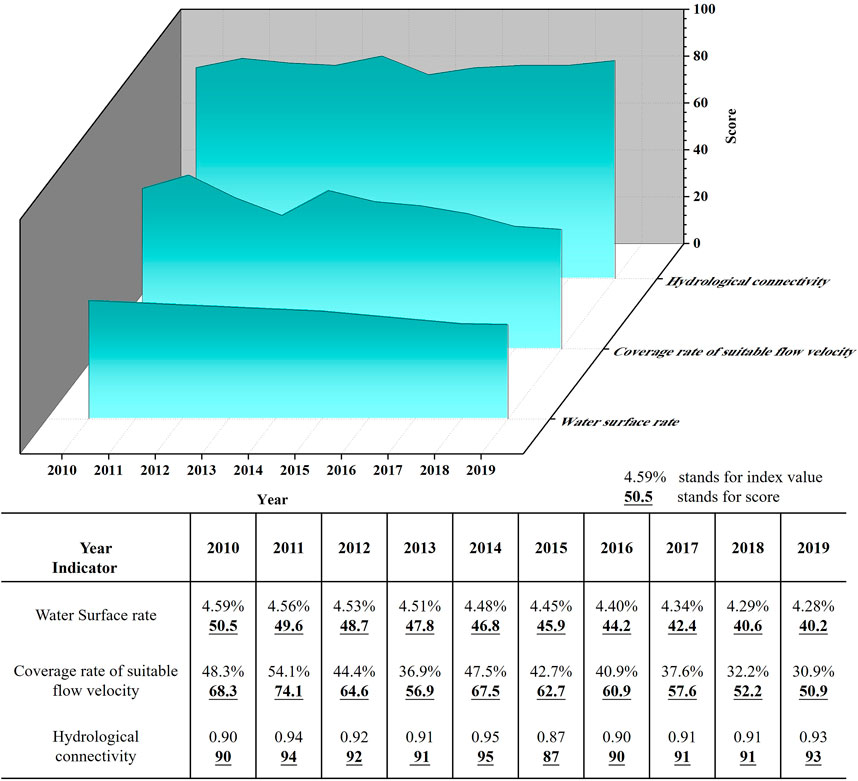
The water surface rate was calculated using the China’s National Land Use and Cover Change data (CNLUCC) with 30 m resolution (Figure 3), taken from the Institute of Geographic Science and Natural Resources Research (Xu et al., 2018), as well as by referring to the conclusions of Xu et al. (2018) and Liu et al. (2021). As is shown in Figure 4, the water surface rate decreased from a value of 6.10% in the 1960s, to 4.59% in 2010, and 4.27% in 2020. This indicates that about 75 km2 (i.e., 1.83% of the WCXY region) of water surface area has been erased since the 1960s, most of which consisted of river branches in urban areas. This phenomenon is related to the land-use change in the process of urbanization, where the growing demands of the urban population and industrial facilities for more land resources caused the encroachment of grassland, forest, and water surface (Zhou et al., 2011). The water surface rate decreased rapidly during the period 2015–2018, and this decrease clearly slowed down after 2018, which may be related to the impact of water protection policies, including the completion of the River Chief System in 2018 (whose construction started in 2016).
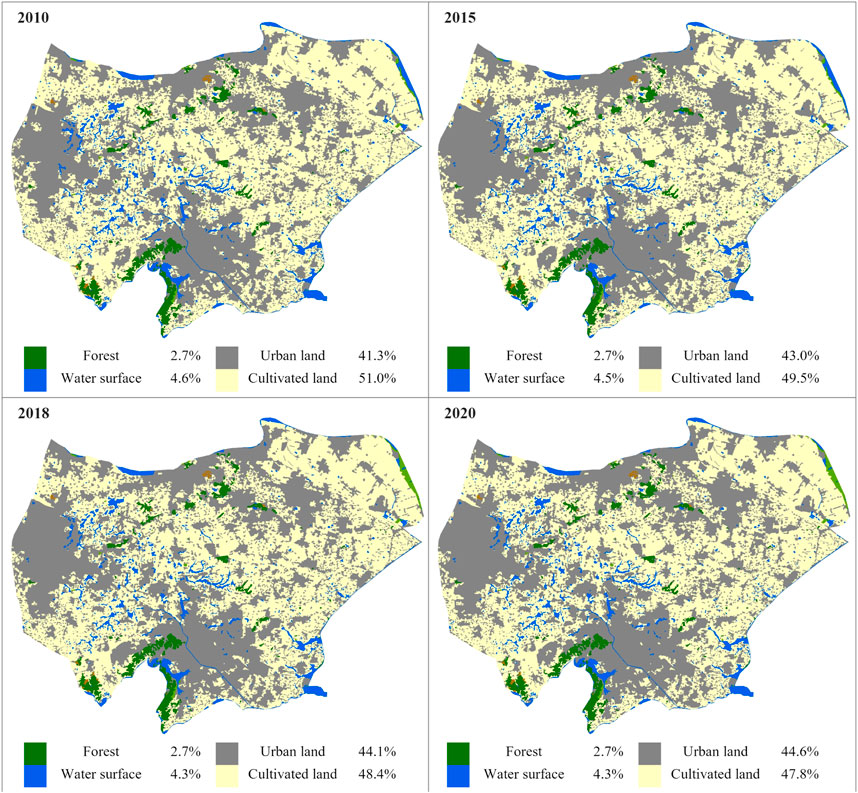
FIGURE 3. Main land cover of the Wuchengxiyu region in 2010, 2015, 2018, and 2020 (CNLUCC data with 30 m resolution, taken from the Institute of Geographic Science and Natural Resources Research).
In order to assess hydrological connectivity, the WCXY region was divided into two subareas, namely, Wuchengxi lowland and Chengxiyu highland. The total hydrological connectivity was calculated by considering the relevance of the average water level between these two subareas (Liu et al., 2021). To avoid the impact of flood control projects running during the flood season, such as drainage pumping stations and gates, only the water level during the non-flood season was used in the assessment. Three water level monitoring points in Wuchengxi and two in Chengxiyu were used to calculate the regional average maximum monthly water level, while the yearly hydrological connectivity was evaluated from the average connectivity over a 6-month period during the non-flood season each year. The results show that in the study area during the period 2010–2015, hydrological connectivity decreased from 0.94 to 0.95 to 0.87 with strong fluctuations, while river channels were interrupted and filled critically. This decrease is related to urban encroachment, leading to the disappearance of river channels, especially of some narrow embranchments. Moreover, the main reason for the fluctuations may lay in the fact that, in order to intensify the ability of regional flood control and waterlogging elimination, several water conservancy projects have been constructed in the WCXY region, which may have interrupted the river networks. After 2015, hydrological connectivity recovered from 0.87 to 0.93, a value that is slightly higher than that for 2010. This can be explained by the application of river network interconnection research during this period.
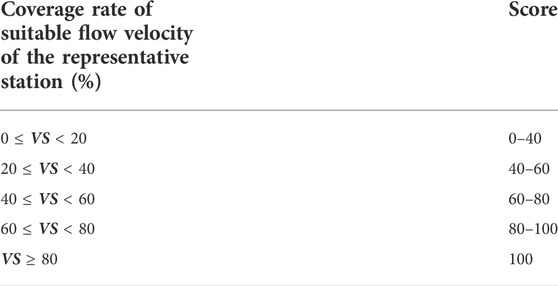
The coverage rate of the suitable flow velocity of the representative station (
3.2 Analysis of water security
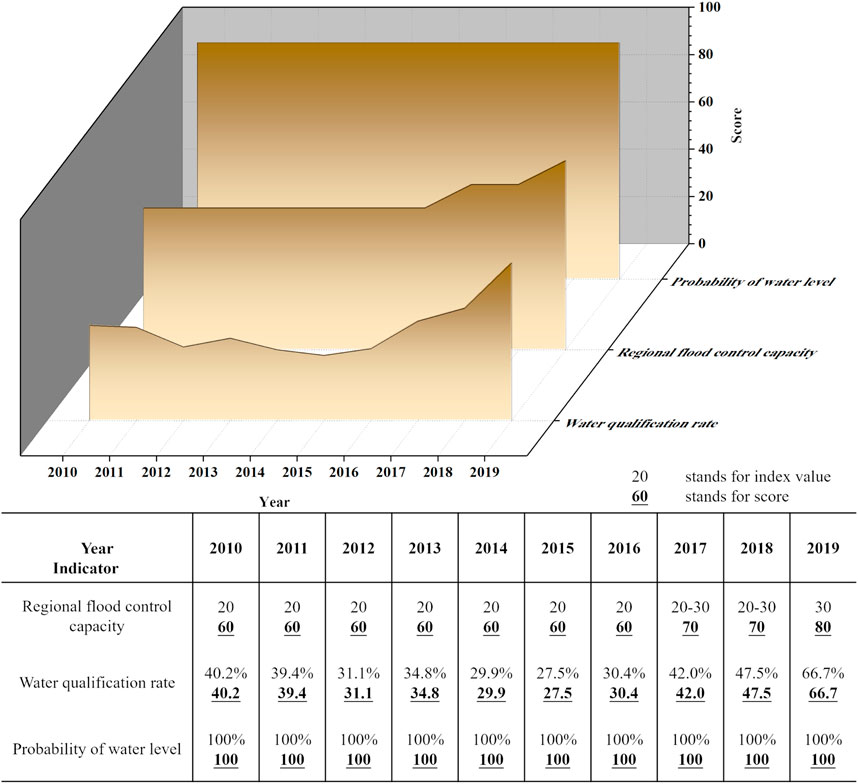
The evaluation results of water security are shown in Figure 5. Even if numerous water conservancy projects for flood control have been built during the past 10 years, the improvement of regional flood control capacity has been relatively slow due to a large quantity of rainfall in this area. The flood control ability could only allow a defense from 20-year floods before 2016, and was strengthened to defense from 30-year floods in 2019. As a comparison, the target requirement of flood control ability in 2025 is to defend from 50-year floods. As extreme rainfall events take place increasingly more frequently, it is urgent to ensure a high level of flood control ability for the WCXY region.
Water qualification rate followed a downward trend from 2010 to 2015, due to the impact of urbanization, population explosion, and large quantities of industrial emissions and agricultural non-point source pollution (Lu et al., 2020). The situation was worse in 2015, when more than 70% of water quality monitoring records were below the standard. However, afterward, the trend of water quality was reversed and water quality was increased rapidly, with the proportion of monitoring records that reached the standard rising from 27.5% in 2015 to 66.7% in 2019. This increase in water qualification rate was mainly related to the policy of the River Chief System and a series of environmental governance projects. A high correlation was found between the water qualification rate and hydrological connectivity, where the enhancement of river network connectivity had a positive effect on the improvement of the water ecological environment.
In terms of water supply, in the past 10 years, water use for agriculture, industry, and domestic consumption could be easily satisfied in the WCXY region due to the abundant water resources. However, pollution-induced water shortage was pointed out as a problem in some regions in Taihu Lake Basin (Wei, 2003), which should be also taken into consideration in the WCXY region.
3.3 Analysis of adaptability between river network connectivity and water security
The composite scores of river network connectivity and water security needed to be calculated before performing the adaptability assessment. Due to the similar importance of each indicator, the mean value was used to evaluate the composite scores of river network connectivity and water security. Then, the degree of coordination between river network connectivity and water security from 2010 to 2019 was calculated, based on the coupling coordination degree calculation formula.
By comparing the scores of the indicators of river network connectivity and water security for 2010 with those for 2019, which is shown in Figure 6, it is observed that some indicators were significantly different in the past decade. In terms of river network connectivity, the water surface rate and the coverage rate of the suitable flow velocity decreased by about 15–30%, while hydrological connectivity followed a slightly upward trend. The reduction in the water surface area and poor flow velocity condition seem to be the restraining factors for the development of river network connectivity in WCXY. Even if an increase in hydrological connectivity may indicate that water is able to flow between two specific areas, this does not mean that the connectivity among adjacent rivers is in a good condition. In other words, a high hydrological connectivity but a low coverage rate of suitable flow velocity means that water travels through a small number of channels, usually mainstreams, while many tributaries are interrupted or filled by urban encroachment during the rapid urbanization process. Moreover, the indicators of water security clearly increased in the last 10 years, especially water qualification rate and regional flood control capacity, although they were far from the ideal condition that can satisfy the requirements for sustainable urbanization.
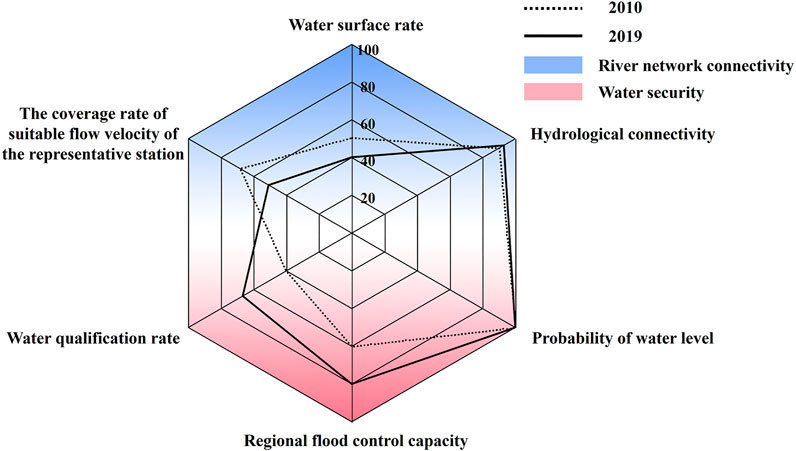
FIGURE 6. Radar graph of the scores of the indicators of river network connectivity and water security for 2010 and 2019.
As shown in Figure 7, the adaptability between river network connectivity and water security generally decreased in the past decade, with sight fluctuations in 2011, 2014, and 2017. By analyzing the individual index in terms of river network connectivity, the fluctuations in 2011 and 2014 were found to be caused by the same factor. In fact, in these 2 years, the water surface rate in the study area did not change too much, while on the contrary, the coverage rate of suitable flow velocity and hydrological connectivity clearly increased, which mainly led to the sudden increase in river network connectivity. Unlike river network connectivity, the integrated evaluation of water security showed to follow a slightly downward trend from 2010 to 2015, increasing rapidly after 2015. This can be explained by the downward trend of water qualification rate and the steady state of regional flood control capacity before 2015, and the simultaneous increase in these two indicators after 2016, during which a series of water protection and environmental protection policies have been implemented. This may be the main reason why the third fluctuation of the adaptability score took place in 2017.
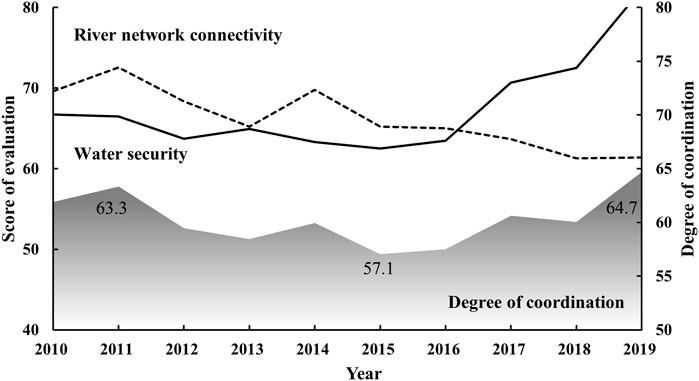
FIGURE 7. Composite evaluation results of river network connectivity, water security, and degree of coordination from 2010 to 2019.
The adaptability between river network connectivity and water security showed to follow a downward trend from 63.3 in 2010 to 57.1 in 2015, then increased rapidly to 64.7 until 2019. This means that the relationship between the development of the river network and water security was nearly at an inferior adaptability stage, especially around 2015. Relatively low-level adaptability between river network connectivity and water security was related to the rapid urbanization in the WCXY area. In order to satisfy the demand for urbanization development, including economic development, residential and industrial construction, transportation expansion, and other urban infrastructures, several tributary channels have been filled or interrupted by the construction of hydraulic works, which were built for flood control and waterlogging elimination. These anthropogenic pressures caused the deterioration of the water environment, frequent urban waterlogging, and ecological damage in the WCXY region. Fortunately, the adaptability between river network connectivity and water security has begun to recover since 2015, which indicates that additional efforts for water system management were made by society and the government. A higher adaptability between river network connectivity and water security is required to ensure a comprehensive, balanced, and sustainable development in China, and policies such as the Action Plan for the Prevention and Control of Water Pollution in 2015 and the River Chief System (fully established in 2018) were highly effective in terms of water security improvement and river network system protection.
In fact, the adaptability between river network connectivity and water security represents the relationship between human activities and the natural environment. A high adaptability means a harmonious development between humans and nature, that is, that effective environmental protection is ensured in the process of urbanization and economic development. On the contrary, a low adaptability between river network connectivity and water security indicates an unrestrained destruction of the natural environment during the process of social development, which will cause problems such as severe pollution, urban waterlogging, and lack of water supply related to scarcity of water resources or poor water quality. Moreover, it will also damage urban landscapes and lead to low-level satisfaction and happiness among urban residents.
4 Conclusion
This study proposed a new assessing method to continuously evaluate the adaptability between river network connectivity and water security. The results show that the degree of coordination followed a downward trend from 2010 to 2015 and increased rapidly afterward, which can be explained by the implementation of related water environmental protection policies in China. In recent years, the relationship between human activities and natural environment has improved, together with the increase in the degree of coordination in the WCXY area. However, excessive reductions in the water surface area and flow velocity still exist which lead to the deterioration of water quality, lack of clean water supply, and difficulties in flood control improvement. For the moderate adaptability relationship between river network and water security, we need to further improve water security. This assessment framework can be used continually in the WCXY area or other similar highly urbanized regions to perform real-time supervision on the urban river network development, and it is meaningful for the problem determination of water security in the context of rapid urbanization.
Some uncertain aspects in the assessment are worth to be mentioned.
1) In terms of the coverage rate of the suitable flow velocity of the representative station, monitoring points on both mainstreams and tributaries should be considered. Actually, in this study, only monitoring points on representative mainstreams were used in the calculation because of the lack of records for tributaries. This may have influenced the results of the assessment, due to the fact that water flow records for tributaries are often worse than those for mainstreams. Even if adequate water flow monitoring points can be used, the choice of monitoring points will have a strong impact on results; this is an important issue that should be overcome in future research.
2) Water level probability was equal to 100% for the whole past decade. This may be related to the limited number of water level gauges from which records can be obtained, which can only represent the water supply ability in some parts of the study area. Moreover, water quality needs to be taken into consideration in the calculation of water supply probability, due to the relatively high risk of quality-induced water shortage in the regions under rapid urbanization.
3) The materials to evaluate regional flood control capacity were not sufficient, and the regional flood control ability area was evaluated once for several years, which led to a relatively low resolution in the assessment.
4) Alternative indicators in the assessment framework could sufficiently improve the accuracy of the integrated evaluation. In this study, some alternative indicators were temporarily abandoned because of problems in the accessibility of related data. For example, the regional assessment of biodiversity in WCXY was possible only after the proposal of policies such as the Ecological River and Lake Construction and the River Chief System; therefore, in this study, it was possible to perform only a regional biodiversity assessment for the year 2016. The increasing attention to the importance of the ecological environment will increase the number of biodiversity assessments that will be carried out in the WCXY area, which in turn will be helpful for the completion of the assessment framework.
As mentioned earlier, the continuous assessment framework can help managers determine the degree of regional coordinated development between river network and water security, and formulate policies to avoid potential water disasters and water pollution under rapid urbanization. However, the assessment framework proposed in this study was based on the characteristics of WCXY, which is mainly facing water security problems such as floods and water pollution. This means that some indicators may be not suitable to be applied to other regions with a high level of urbanization and a lack of water supply and other water security problems. Therefore, in the future, it is necessary to optimize the assessment framework so that it can be applied to different types of urbanized regions.
Moreover, although this study used the currently available assessment material, this is still insufficient for all the indicators, especially for the alternative indicators. Fortunately, several technologies have been developing rapidly in recent years, which provide new ideas and possibilities for data collection. For example, using remote sensing techniques to monitor the water level and river discharge is a burgeoning field rife with innovation (Gleason and Durand, 2020), which can help us obtain relatively high-resolution information on river network connectivity. In addition, with the development of unmanned aerial vehicles (UAVs) and high-resolution satellite imagery, it is more convenient for researchers and managers to obtain accurate river network structure data, including on structural connection (i.e., the physical connections of the river network) and hydraulic connection (i.e., the interruption of connection by dams or weirs). Therefore, future research should consider multi-source data to cover the shortages in the assessment material, and improve the objectivity and prevision of the continuous assessment.
Data availability statement
Publicly available datasets were analyzed in this study. These data can be found here: Hydrologic year book (print-out); Water quality data from the local environmental protection section.
Author contributions
Conceptualization, YG and SW; data curation, YG, ZL, and MG; founding acquisition, SW and MC; investigation, YG and ZL; methodology, YG, QH, and SW; project administration, SW, QH, and MC; supervision, SW and JS; data analysis, YG and SW; visualization, YG; writing–original draft, YG; writing–review & editing, SW, QH, and JS; All authors have read and agreed to the submitted version of the manuscript.
Funding
The authors are grateful for the support by the National Key Research and Development Program of China, “Key technologies of river–lake systems connectivity and water security” (2018YFC0407200, 2018YFC0407205); and the National Natural Science Foundation of China, “Sponge cities within managed basins: integrated responses of hydrology and environmental quality to constructing a sustainable city” (71961137007).
Conflict of interest
The authors declare that the research was conducted in the absence of any commercial or financial relationships that could be construed as a potential conflict of interest.
Publisher’s note
All claims expressed in this article are solely those of the authors and do not necessarily represent those of their affiliated organizations, or those of the publisher, the editors, and the reviewers. Any product that may be evaluated in this article, or claim that may be made by its manufacturer, is not guaranteed or endorsed by the publisher.
Supplementary material
The Supplementary Material for this article can be found online at: https://www.frontiersin.org/articles/10.3389/fenvs.2022.932376/full#supplementary-material
References
Babel, M., and Shinde, V. R. (2018). A framework for water security assessment at basin scale[J]. APN Sci. Bull. 8 (1), 27–32. doi:10.30852/sb.2018.342
Begum, S., Stive, M. J. F., and Hall, J. W. (2007). Flood risk management in europe: Innovation in policy and practice[J]. Adv. Nat. Technol. Hazards Res 25, 231–251. doi:10.1007/978-1-4020-4200-3:231-251
Cai, J., He, Y., Xie, R., and Liu, Y. (2020). A footprint-based water security assessment: An analysis of Hunan province in China. J. Clean. Prod. 245, 118485. doi:10.1016/j.jclepro.2019.118485
Chen, T., Wang, Y., Gardner, C., and Wu, F. (2020). Threats and protection policies of the aquatic biodiversity in the Yangtze River. J. Nat. Conservation 58, 125931. doi:10.1016/j.jnc.2020.125931
Chen, Y., Xu, Y., and Fu, W. (2007). Influences of urbanization on river network in the coastal areas of East Zhejiang province[J]. Adv. Water Sci. 18 (1), 73. doi:10.3321/j.issn:1001-6791.2007.01.012
Cote, D., Kehler, D. G., Bourne, C., and Wiersma, Y. F. (2009). A new measure of longitudinal connectivity for stream networks. Landsc. Ecol. 24 (1), 101–113. doi:10.1007/s10980-008-9283-y
Cui, B., Wang, C., Tao, W., and You, Z. (2009). river channel network design for drought and flood control: A case study of Xiaoqinghe River basin, jinan city, China. J. Environ. Manag. 90 (11), 3675–3686. doi:10.1016/j.jenvman.2009.07.010
Deng, L., Wang, F., Han, J., Ge, W., Ma, C., and Hei, Z. (2020). Change of weihe river system and lts response to urbanization in guanzhong area[J]. Res. Soil Water Conservation 27 (4), 256–261. doi:10.13869/j.cnki.rswc.2020.04.033
Deng, X. (2019). Correlations between water quality and the structure and connectivity of the river network in the Southern Jiangsu Plain, Eastern China. Sci. Total Environ. 664, 583–594. doi:10.1016/j.scitotenv.2019.02.048
Deng, X., Xu, Y., Zhai, L., Liu, Y., Li, Y., et al. (2014). Establishment and application of the index system for urban river health assessment[J]. Acta Ecol. Sin. 34 (4), 993–1001. doi:10.5846/stxb201209221339
Deng, X., Xu, Y., and Han, L. (2018). Impacts of human activities on the structural and functional connectivity of a river network in the Taihu Plain. Land Degrad. Dev. 29 (8), 2575–2588. doi:10.1002/ldr.3008
Ding, Y., Jia, H., Ding, Y., and Sun, Z. (2016). Hydrodynamic optimization of urban river network of water towns based on EFDC model[J]. Acta Sci. Circumstantiae 36 (4), 1440–1446. doi:10.13671/j.hjkxxb.2015.0472
Doeffinger, T., and Hall, J. W. (2021). Assessing water security across scales: A case study of the United States. Appl. Geogr. 134, 102500. doi:10.1016/j.apgeog.2021.102500
Environment Agency (2006). Understanding flood risk using our flood map; identifying and understanding flood risk in england & wales. Bristol, UK: Environment Agency. Available at: www.environment-agency.gov.uk/floodmap (accessed on June 15, 2020).
Gao, X., Hu, Z., Yan, C., and Sun, B. (2022). Construction and application of water system connectivity evaluation index system considering hydraulic connectivity[J]. Water Resour. Prot. 38 (2), 41–47. doi:10.3880/j/issn.1004-6933.2022.02.006
Gao, Y., Xiao, X., Ding, M., Tang, Y., and Chen, H. (2018). Evaluation of plain river network hydrologic connectivity based on improved graph theory[C]//IOP conference series: Earth and environmental science. IOP Conf. Ser. Earth Environ. Sci. 178 (1), 012002. doi:10.1088/1755-1315/178/1/012002
Garbin, S., Celegon, E. A., Fanton, P., and Botter, G. (2019). Hydrological controls on river network connectivity. R. Soc. open Sci. 6 (2), 181428. doi:10.1098/rsos.181428
Gleason, C. J., and Durand, M. T. (2020). Remote sensing of river discharge: A review and a framing for the discipline. Remote Sens. 12 (7), 1107. doi:10.3390/rs12071107
Han, D., Yu, D., and Cao, Q. (2020). Assessment on the features of coupling interaction of the food-energy-water nexus in China. J. Clean. Prod. 249, 119379. doi:10.1016/j.jclepro.2019.119379
Hu, K., Tang, Y., Jia, F., and Wang, Y. (2019). Structural optimization of flood control screw piles: A review. IOP Conf. Ser. Mat. Sci. Eng. 611 (1), 012049. doi:10.1088/1757-899x/611/1/012049
Irfan, S., and Alatawi, A. M. M. (2019). Aquatic ecosystem and biodiversity: A review. Open J. Ecol. 9 (01), 1–13. doi:10.4236/oje.2019.91001
Jiang, H., and Yang, X. (2015). Entropy weight-based water security assessment in Asia-Pacific[J]. Prog. Geogr. 34 (3), 373–380. doi:10.11820/dlkxjz.2015.03.012
Karim, F., Kinsey‐Henderson, A., Wallace, J., Arthington, A. H., and Pearson, R. G. (2012). Modelling wetland connectivity during overbank flooding in a tropical floodplain in north Queensland, Australia. Hydrol. Process. 26 (18), 2710–2723. doi:10.1002/hyp.8364
Lane, S. N., Reaney, S. M., and Heathwaite, A. L. (2009). Representation of landscape hydrological connectivity using a topographically driven surface flow index. Water Resour. Res. 45 (8), 2263–2289. doi:10.1029/2008wr007336
Li, X., Zhang, X., and Wang, S. (2021). Managing conflicts and equitability in hierarchical decision making for water resources planning under fuzzy uncertainty: A case study of Yellow River, China. J. Hydrology Regional Stud. 38, 100963. doi:10.1016/j.ejrh.2021.100963
Lin, P., Chen, J., Deng, P., Zhang, Y., and Yin, Y. (2017). Research of the coupling and coordination model between urbanizationlevel and the interconnected river system network in Jiangsu Province[J]. J. Water Resour. Water Eng. 28 (2), 86–91. doi:10.1016/j.jclepro.2020.120641
Liu, B., Zhang, F., Qin, X., Wu, Z., Wang, X., and He, Y. (2021). Spatiotemporal assessment of water security in China: An integrated supply-demand coupling model. J. Clean. Prod. 321, 128955. doi:10.1016/j.jclepro.2021.128955
Liu, H., Xu, Y., Lin, Z., and Zhang, X. (2021). Change of river structure and hydrological connectivity in Wu-Cheng-Xi-Yu region of the Taihu Lake plain[J]. Resour. Environ. Yangtze Basin 30 (5), 1069–1075. doi:10.11870/cjlyzyyhj202105004
Liu, J., Wang, P., Wang, C., Qian, J., and Hou, J. (2017). Heavy metal pollution status and ecological risks of sediments under the influence of water transfers in Taihu Lake, China. Environ. Sci. Pollut. Res. 24 (3), 2653–2666. doi:10.1007/s11356-016-7909-1
Lu, Z., Cai, M., Ma, N., and Li, M. (2020). Study on river and lake system interconnection and water security of Wuchengxiyu Region[J]. Yzangtze River 51 (08), 118–122. doi:10.16232/j.cnki.1001-4179.2020.08.021
Luo, W., Wang, X., Luo, Q., and Zhang, X. (2014). Effects of underlying surface changes on drainage modulus in Four-lake Watershed[J]. Adv. Water Sci. 25 (2), 275–281doi:10.14042/j.cnki.32.1309.2014.02.020
Meng, X Y., Chen, X., Chen, D Y., Kuda, F., et al. Evaluation system of urban water system connectivity[J]. Journal of Hohai University (Natural Sciences), 2014, 42(1): 24-28. doi:10.1088/1755-1315/900/1/012047
Nong, X., Shao, D., Zhong, H., and Liang, J. (2020). Evaluation of water quality in the South-to-North Water Diversion Project of China using the water quality index (WQI) method. Water Res. 178, 115781. doi:10.1016/j.watres.2020.115781
Norman, E. S., Dunn, G., Bakker, K., Allen, D. M., and Cavalcanti de Albuquerque, R. (2013). Water security assessment: Integrating governance and freshwater indicators. Water Resour. manage. 27 (2), 535–551. doi:10.1007/s11269-012-0200-4
Phillips, R. W., Spence, C., and Pomeroy, J. W. (2011). Connectivity and runoff dynamics in heterogeneous basins[J]. Hydrol. Process. 25 (19), 3061–3075. doi:10.1002/hyp.8123
Qin, Y., Wen, Q., Ma, Y., Yang, C., and Liu, Z. (2018). Antibiotics pollution in gonghu bay in the period of water diversion from Yangtze River to Taihu Lake. Environ. Earth Sci. 77 (11), 419. doi:10.1007/s12665-018-7558-4
Rashid, H., Manzoor, M. M., and Mukhtar, S. (2018). Urbanization and its effects on water resources: An exploratory analysis[J]. Asian J. Water, Environ. Pollut. 15 (1), 67–74. doi:10.3233/AJW-180007
Shao, X., Fang, Y., and Cui, B. (2020). A model to evaluate spatiotemporal variations of hydrological connectivity on a basin-scale complex river network with intensive human activity. Sci. Total Environ. 723, 138051. doi:10.1016/j.scitotenv.2020.138051
Shipp, A., and Jansen, K. (2011). Reinterpreting time in fit theory: Crafting and recrafting narratives of fit in medias res:crafting and recrafting narratives of fit in media res [J]. Acad. Manage. Rev. 36 (1), 76–101. doi:10.5465/amr.2009.0077
Shrestha, S., Aihara, Y., Bhattarai, A. P., Bista, N., Kondo, N., Futaba, K., et al. (2018). Development of an objective water security index and assessment of its association with quality of life in urban areas of developing countries. SSM Popul. Health 6, 276–285. doi:10.1016/j.ssmph.2018.10.007
Steele, M. K., Heffernan, J. B., Bettez, N., Cavender-Bares, J., Groffman, P. M., Grove, J. M., et al. (2014). Convergent surface water distributions in U.S. Cities. Ecosystems 17 (4), 685–697. doi:10.1007/s10021-014-9751-y
Veettil, A. V., and Mishra, A. K. (2016). Water security assessment using blue and green water footprint concepts. J. Hydrology 542, 589–602. doi:10.1016/j.jhydrol.2016.09.032
Wang, H., Wu, J., and Gao, Y. (2021). Spatial fitness of urban public resources and population distribution: Taking shenzhen as an example[J. ]. Beijing Da Xue Xue Bao 57 (6), 1143–1152. doi:10.13209/j.0479-8023.2021.088
Wang, Q., Jiang, R., and Li, R. (2018). Decoupling analysis of economic growth from water use in city: A case study of beijing, shanghai, and guangzhou of China. Sustain. cities Soc. 41, 86–94. doi:10.1016/j.scs.2018.05.010
Wang, S., Gu, Y., Yang, D., Sun, J., Hu, Q., and Zhang, X. (2022). Study on hydrodynamic improvement of urban tidal river for a typical plain city in the lower reaches of Yangtze River[J]. Adv. Water Sci. 33 (1), 91–101. doi:10.2166/ws.2021.313
Wang, Y., Xu, Y., Lei, C., Li, G., Han, L., Song, S., et al. (2016). Spatio-temporal characteristics of precipitation and dryness/wetness in Yangtze River Delta, eastern China, during 1960–2012. Atmos. Res. 172, 196–205. doi:10.1016/j.atmosres.2016.01.008
Wei, Z. (2003). Taihu basin authority, shanghai 200434, P. R. ChinaWater scarcity caused by pollution in the Taihu basin. J. Lake Sci. 15 (2), 133–138. doi:10.18307/2003.0206
Xu, G. L., Xu, Y. P., and Wang, L. (2012). Evaluation of river network connectivity based on hydraulic resistance and graph theory[J]. Adv. Water Sci. 23 (6), 776–781. doi:10.1007/s11783-011-0280-z
Xu, K., Milliman, J. D., and Xu, H. (2010). Temporal trend of precipitation and runoff in major Chinese Rivers since 1951. Glob. Planet. Change 73 (3-4), 219–232. doi:10.1016/j.gloplacha.2010.07.002
Xu, X., Liu, J., Zhang, S., Li, R., Yan, C., and Wu, S. (2018). China’s multi-period land use land cover remote sensing monitoring data set (CNLUCC)[Z]. Beijing, China: Resource and Environment Data Cloud Platform.
Yang, L., Xu, Y., Han, L., Song, S., Deng, X., and Wang, Y. (2016). River networks system changes and its impact on storage and flood control capacity under rapid urbanization. Hydrol. Process. 30 (13), 2401–2412. doi:10.1002/hyp.10819
Yang, R., Wu, S., Gao, X., Wu, X., Zhang, C., Wang, C., et al. (2021). An accuracy-improved flood risk and ecological risk assessment in an interconnected river–lake system based on a copula-coupled hydrodynamic risk assessment model. J. Hydrology 603, 127042. doi:10.1016/j.jhydrol.2021.127042
Yang, Z., Hu, P., Wang, J., Zhao, Y., and Zhang, W. (2019). Ecological flow process acknowledging different spawning patterns in the Songhua River. Ecol. Eng. 132, 56–64. doi:10.1016/j.ecoleng.2018.12.034
You, A., Wu, Z., Han, Z., Yang, J., and Hua, L. (2015). Spatial and temporal distributions and variations of nutrients in the West Lake, Hangzhou, after the implementation of integrated water management program (1985–2013)[J]. J. Lake Sci. 27 (3), 371–377. doi:10.18307/2015.0301
Xu, Y., Xu, Y. P., Wang, Q., Wu, L., Yang, J., and Shi, H. (2018). Relationship between urbanization and river network change in Taihu Lake basin, China[J]. Adv. Water Sci. 29 (4), 473–481. doi:10.1007/s11769-012-0570-9
Zhang, C., Huang, Y., Javed, A., and Arhonditsis, G. B. (2019). An ensemble modeling framework to study the effects of climate change on the trophic state of shallow reservoirs. Sci. Total Environ. 697, 134078. doi:10.1016/j.scitotenv.2019.134078
Zhao, A., Li, Y., Wei, H., Chen, X., and Sun, X. (2011). Evolutional analysis of coupling between urbanization and resource-environment in shaanxi[J]. Res. Agric. Mod. 32 (6), 725–729. doi:10.1016/j.proenv.2012.01.350
Zhou, X., and Wang, Y. C. (2011). Spatial–temporal dynamics of urban green space in response to rapid urbanization and greening policies. Landsc. urban Plan. 100 (3), 268–277. doi:10.1016/j.landurbplan.2010.12.013
Zuo, Q., Hao, M., Zhang, Z., and Jiang, L. (2020). Assessment of the happy river index as an integrated index of river health and human well-being: A case study of the Yellow River, China. Water 12 (11), 3064. doi:10.3390/w12113064
Keywords: rapid urbanization, evaluation framework, river network connectivity, water security, adaptability
Citation: Gu Y, Wang S, Hu Q, Sun J, Cai M, Lu Z and Gao M (2022) Continuous assessment of the adaptability between river network connectivity and water security in a typical highly urbanized area in eastern China. Front. Environ. Sci. 10:932376. doi: 10.3389/fenvs.2022.932376
Received: 29 April 2022; Accepted: 12 July 2022;
Published: 12 August 2022.
Edited by:
Senlin Zhu, Yangzhou University, ChinaCopyright © 2022 Gu, Wang, Hu, Sun, Cai, Lu and Gao. This is an open-access article distributed under the terms of the Creative Commons Attribution License (CC BY). The use, distribution or reproduction in other forums is permitted, provided the original author(s) and the copyright owner(s) are credited and that the original publication in this journal is cited, in accordance with accepted academic practice. No use, distribution or reproduction is permitted which does not comply with these terms.
*Correspondence: Siru Wang, c3J3YW5nQG5ocmkuY24=
 Yicheng Gu
 Siru Wang
 Qingfang Hu1