 Rauno Lust1*
 Jaak Nerut2Sharvari S. Gadegaonkar1
 Kuno Kasak1
 Mikk Espenberg1
 Triinu Visnapuu3
 Ülo Mander1
- 1Department of Geography, Institute of Ecology and Earth Sciences, University of Tartu, Tartu, Estonia
- 2Institute of Chemistry, University of Tartu, Tartu, Estonia
- 3Department of Genetics, Institute of Molecular and Cell Biology, University of Tartu, Tartu, Estonia
Microbial electrosynthesis is a promising solution for removing nitrate from water with a low concentration of electron donors. Three single-chamber microbial electrosynthesis reactors were constructed and operated for almost 2 years. The single-chamber reactor design saves on construction costs, and the pH of the solute is more stable than that in the case of a two-chamber reactor. Nitrate reduction started at the working electrode potential of −756 mV versus standard hydrogen electrode (SHE), and subsequently, the working electrode potential could be increased without hindering the process. The optimal potential was −656 mV versus SHE, where the highest Faradaic efficiency of 71% and the nitrate removal rate of 3.8 ± 1.2 mgN-NO3/(L×day) were registered. The abundances of nitrite reductase and nitrous oxide reductase genes were significantly higher on the working electrode compared to the counter electrode, indicating that the process was driven by denitrification. Therefore, a microbial electrosynthesis reactor was successfully applied to remove nitrate and can be utilized for purifying water when adding organic compounds as electron donors is not feasible, that is, groundwater. In addition, at the lower working electrode potentials, the dissimilatory nitrate reduction to ammonium was observed.
1 Introduction
In many regions worldwide, the nitrate (NO3) concentration exceeds the safe drinking threshold of 50 mgNO3/L in the groundwater and is increasing health risks as specified by the World Health Organization (WHO, 2017). Consumption of NO3-rich water can be hazardous and cause methemoglobinemia in humans or play a potential role in the development of digestive tract cancers (Camargo and Alonso, 2006). The NO3 concentration is increasing in groundwater aquifers and surface water bodies due to the use of chemical fertilizers in agriculture and the discharge of untreated wastewater (Pärn et al., 2018). In surface water, high NO3 concentrations can cause eutrophication and, therefore, a loss of biodiversity (Camargo and Alonso, 2006). Therefore, developing different applicable technologies to remove NO3 from water is essential.
NO3 can be removed from waters by utilizing the activity of various microbes. The denitrification process can turn NO3 stepwise into nitrogen gas (N2) as the final product, thereby eliminating nitrogen compounds from water to the atmosphere (Lam and Kuypers, 2011). In the case of heterotrophic denitrification, some microbes, that is, Alicycliphilus denitrificans and Pseudomonas stutzeri, use organic compounds as electron donors and carbon sources (Eq. (1)) (Mechichi et al., 2003; Pang and Wang, 2021). Autotrophic denitrification occurs when bacteria, that is, Thiobacillus denitrificans, use hydrogen, sulfur, ferrous iron, or other inorganic compounds as electron donors and inorganic carbon such as carbon dioxide or carbonate as carbon sources for growth (Eq. (2)) (di Capua et al., 2016; Pang and Wang, 2021; Szekeres et al., 2002). A description and graphical representation of the process have been published previously, where NO3 reduction was studied in a two-chamber microbial electrosynthesis reactor (MESR) (Lust et al., 2020).
One of the main aspects that hinder NO3 removal from water is a low concentration of electron donors (Andalib et al., 2018). In 2004, it was demonstrated that Geobacter species could acquire electrons provided by electrodes (Gregory et al., 2004) and use these electrons to reduce NO3 when organic carbon was absent. Since then, hundreds of studies have been conducted to optimize various processes by changing cell design, inoculation, and operating practices (Dehghani et al., 2018; Ding et al., 2018; Sharma et al., 2019; Kadier et al., 2020). From the other perspective, many researchers have been working intensively to describe the mechanisms of interaction between the microbe and the electrode (Rosenbaum et al., 2011; Bonanni et al., 2012; Ding et al., 2018; Pankratova et al., 2019).
There has been a significant development in wastewater treatment related to bioelectrochemical systems. Regarding the purification of urban wastewater, the use of electrically conductive materials for constructing filter bodies in wetlands is shown to be a feasible way to increase the nutrient removal efficiency (Aguirre-Sierra et al., 2020). In these systems, the whole filter body acts as an electrical network for microbes, and it can be described as a short-circuited fuel cell (Wang et al., 2020). In other cases, microbial fuel cells are used to harvest energy and raise the removal efficiency simultaneously (Afsham et al., 2015; Wang et al., 2019; Huang et al., 2020; Ren et al., 2020).
Microbial fuel cells are effective and applicable. However, they share the same shortcoming as these systems cannot reduce NO3 when the electron donor concentration is low. The solution can be utilizing the microbial electrosynthesis (MES) technology. The concept is based on the substitution of the microorganisms’ demand for electron donors with electrons provided via the electrode (Andalib et al., 2018; di Capua et al., 2019; Pang and Wang, 2021). A large-scale experiment on surface water with total nitrogen and phosphorus concentrations over the acceptable threshold was conducted in China, where the authors used MES to remove these nutrients from the Liushaxin River in Guang-dong Province (Liu et al., 2021). According to the available literature, only a few studies of MES have targeted real-life applications of drinking water purification, indicating the gap in the knowledge. In recent publications, a NO3 reduction in MESR has been achieved (Pous et al., 2016; Ceballos-Escalera et al., 2021). To achieve the goal of removing nitrogen from low-carbon waters, for example, groundwater, the development of feasible MES-based reactors with varied designs and finding the necessary conditions for operating the system are vital.
The main goal of this study was to achieve a long-term stable NO3 reduction by denitrification in the constructed MESR for treating wastewater with a low electron donor concentration. However, in our previous study (Lust et al., 2020), where a two-chamber MESR was used, the NO3 reduction rate was relatively low, and a lack of electroactive bacteria was thought to be the cause. The use of two-chamber MESR caused the pH to drift and therefore needed constant neutralizing. Using the sludge taken from the municipal wastewater treatment plant as the inoculum caused NO3 reduction to occur in the control reactor due to the addition of organic compounds (Lust et al., 2020). Thus, in this study, a single-chamber MESR was designed to ensure that pH remains unchanged. In addition, by removing the cation-exchange membrane from the reactor, the construction cost can be lowered. To ensure that the electroactive autotrophic bacteria are present in the MESR and allowing an evaluation of the difference between MESR and the control reactor, a pure culture of T. denitrificans was used as the inoculum. T. denitrificans was chosen as it is an autotropic denitrifier identified in higher abundance where denitrification in MESR has been studied (Nguyen et al., 2016; Xu et al., 2017). The second aim was to find the optimal working electrode (WE) potential, where the Faradaic efficiency was the highest and no ammonium (NH4) or nitrite (NO2) accumulated. After these goals are achieved, it would be possible to move toward evaluating whether MESR could be used for enhancing the NO3 removal efficiency in constructed wetlands or applied to purify drinking water.
2 Materials and methods
2.1 Reactor design
Experiments were carried out in three single-chamber MESRs made of Plexiglas. All of them had the same design and had a total volume of 5.86 L (Figure 1). The same reactors were used in the previous study (Lust et al., 2020), except the cation-exchange membrane with its carrier module, which was removed.
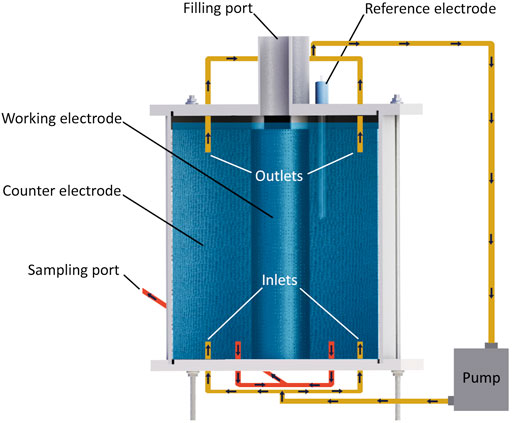
FIGURE 1. Reactor design. The blue area in the reactor represents the electrolyte.
To decrease oxygen production on the counter electrode (CE), the outer electrode, with a 3.6 times larger geometric surface area compared to WE, was used as CE, and the inner electrode was WE (Figure 1). A 3 mm thick graphite felt (Graphite felt PGF 3 × 1.200 m, CGT Carbon GmbG, Asbach, Germany) was used to prepare CE and WE and had geometric surface areas of 930 and 255 cm2, respectively.
For mixing the electrolyte, two outlets on top and two inlets at the bottom of the reactor were connected via a pump (Figure 1). At the bottom of the reactor, two outlets were used to collect water samples. On top of the reactor, two sampling ports were used only for filling the reactor during this experiment (Figure 1).
The electrode contacts were made from Grade-1 titanium wire with a cross-section of 0.2 mm (Grade-1 Titanium Round Wire 0.2 mm × 50 m, Metal Clays 4 You, Mayfield, United Kingdom). Since the graphite felt is a relatively brittle material, glue was used to ensure proper contact between graphite and titanium. The glue was made from a graphite-based paint (Electric paint, Bare Conductive, London, United Kingdom) mixed with epoxy (Moment 5-min repair Epoxy, Henkel AG, and Co. KgaA, Düsseldorf, Germany) in a ratio of 1 to 1.
The reactors were operated as three-electrode systems and were equipped with reference electrodes (REs) (Figure 1). All potentials are presented as potential versus standard hydrogen electrode (SHE) throughout the article.
The study was set up for nearly 2 years, and three different potentiostats were used as controls in the experiment. Multiple measurement cycles (batches) were conducted under various conditions during the experiment. Reactor 1 was mainly used to determine the WE potentials where NO3 reduction occurs and to find the optimal WE potential. One cycle was also conducted to verify how much the reactor could be disturbed without ceasing the NO3 reduction after the NO3 reduction was initiated. Reactor 2 was mainly used as a control reactor, and reactor 3 was used only to conduct the secondary abiotic control. The respective potentiostats and reference electrodes that were used and applied WE potentials and additional preparations that were applied for each measurement cycle are described in Supplementary Tables S1–S3 in more detail.
2.2 Inoculum and synthetic wastewater composition
The actively growing culture of T. denitrificans was ordered from DSMZ (German Collection of Microorganisms and Cell Cultures GmbH, Leibniz Institute, Brunswick, Germany) and cultivated anaerobically as instructed by the supplier in medium 113. The cultivation was conducted in three stages. At first, 5 mL of the ordered culture was cultivated in a 25 mL medium. After 3 days, the inoculum was diluted by adding 270 mL of a fresh medium. Thirty days later, the inoculum was further diluted by adding 200 mL of the medium. Ten days later, the inoculum was stirred, and 200 mL of the inoculum was used for each reactor (1 and 2). To ensure that there are enough trace elements, 20 mL of trace element solution SL-4, described in medium 113, was also added to the reactor.
Synthetic wastewater was used as an electrolyte and was made from tap water, where 4.64 g/L Na2HPO4, 1.75 g/L NaH2PO4, 1.39 g/L NaHCO3, and 0.165 g/L KNO3 were added (Cecconet et al., 2018).
2.3 Operating conditions
Whenever the reactor was assembled and filled with synthetic wastewater, the reactor was purged with N2 until the dissolved oxygen (DO) concentration dropped below 0.2 mgO2/L. At the beginning of each cycle, the level of the electrolyte was adjusted to the 5.5 L mark, and the NO3 concentration was increased to 100 mgN-NO3/L by the addition of KNO3 unless stated otherwise. Every cycle was ended when NO3 was depleted, or no change in the concentration was registered. All three reactors were operated differently, and the conditions of the cycles are described in Supplementary Tables S1–S3. Throughout the study, the cycles are referred to as “cycle (1:2)”, where the first digit indicates the reactor, and the second digit refers to the number of cycles of that reactor.
2.4 Enumeration of heterotrophic bacteria
For enumeration of culturable microorganisms in the electrolyte during the cycle (1:3), the samples were withdrawn from the reactor and kept in sterile containers at 4°C and were analyzed within 4 h for viable cell count. Decimal dilution series with dilution factors from 101 to 106 were performed using sterile MilliQ water on ice, and 1 mL of each dilution was immediately inoculated. The method for enumeration of culturable microorganisms in water samples was performed according to the ISO 6222:1999 standard. All the inoculations were performed in two technical parallels. The colony counts were recorded after 3 days (70 h) and 4 days (94 h) at 22°C, and 2 days (46 h) and 3 days (70 h) at 37°C. As the growth of the colonies was slow, the results from longer time points were used in calculations. The results were expressed as the number of colony-forming units (CFU) per 1 mL of the initial water sample. At each time point of the reactor process, the average CFU/mL was calculated from 4 to 6 parallel plates.
The number of denitrifying bacteria was determined by using the most probable number (MPN) method. Decimal dilutions with dilution factors from 101 to 104 of the samples were inoculated to Hiltay medium (2 g/L KNO3, 1 g/L asparagine, 5 g/L Na-citrate, 2 g/L KH2PO4, 2 g/L MgSO4×7H2O, 0.2 g/L CaCl2 × 6H2O, 0.08 g/L bromothymol blue, traces of FeCl3, pH 6.8). Inoculum sizes of 1 mL were applied to 10 mL Hiltay test tubes. All the inoculations were performed in three replicates and incubated at 22°C for up to 14 days under static conditions. The number of positive test tubes showing pH shift and nitrogen gas formation was registered. MPN indexes were used to calculate the MPN per 1 mL of the initial water sample using the MPN calculator (MPNcalc v1.2.0).
2.5 Analysis of gene abundances
Three sets of electrodes were used to analyze the presence and abundance of different genes. Each set consisted of two electrodes: WE and CE. Electrodes from every set were crushed into a fine powder using a coffee bean grinder (Robert Bosch GmbH, Germany) under sterile conditions. The ground electrodes were weighed (0.25 g) and processed further for DNA extraction. DNA was extracted using a PowerSoil DNA Isolation kit (MO BIO Laboratories Inc., Carlsbad, CA, United States) according to the manufacturer’s recommendations. Homogenization was performed at 5,000 rpm for 20 s (Precellys 24, Berlin Technologies, Montigny-le-Bretonneux, France). The extracted DNA samples were analyzed for their concentrations and quality using a spectrophotometer Infinite M200 (Tecan AG, Grodig, Austria).
Qualitative polymerase chain reaction (qPCR) analysis was carried out to evaluate the abundances of the bacterial 16S rRNA gene, archaeal 16S rRNA gene, and nitrogen transforming genes such as bacterial amoA, archaeal amoA, comammox (complete ammonia oxidation) amoA, nirK, nirS, nosZI, nosZII, and nrfA genes. The reaction was carried out in 10 µL of the reaction mixture, consisting of 1 µL of template DNA, 5 µL of Maxima SYBR Green Master Mix (Thermo Fisher Scientific Inc., Waltham, MA, United States), and optimized volumes of primers (Espenberg et al., 2018), and the remaining was nuclease-free water. All reactions were carried out in triplicates, with negative controls without template DNAs. The reactions were carried out using the RotorGene Q equipment (Qiagen, Valencia, CA, United States).
The gene-specific primer sets and the optimized reaction conditions were followed as described by Espenberg et al. (2018). The modifications were made for nirS and bacterial amoA primers: forward primer nirSCd3af was used instead of nirSC1F (Kandeler et al., 2006); the annealing temperatures for the qPCR program used were 55 and 57°C for the nirS gene and bacterial amoA gene, respectively. Comammox amoA genes were amplified using the comamoA AF and comamoA SR primer sets (Wang et al., 2018). The optimized program for the comammox amoA gene was as follows: 10 min at 95°C, 40 cycles of 15 s at 95°C, 30 s at 55°C, and 30 s at 72°C; the program ended with a melting curve analysis (the temperature was increased from 65 to 95°C at a rate of 0.35°C/step and held at each step for 3 s).
The standard stocks used for the determination of the gene abundances were prepared by serially diluting solutions of the target sequences (Eurofins MWG Operon, Ebersberg, Germany). The analysis of the runs was carried out using RotarGene® Series Software v.2.0.2 from Qiagen and LinRegPCR program v 2020.0 (Ruijter et al., 2009). Gene abundances were calculated as the mean fold differences between samples and the corresponding 10-fold standard dilution in respective standards (Ruijter et al., 2009). The gene abundances were represented as gene copy numbers per gram of dry weight (copies/g dw).
2.6 Chemical analysis
Water samples were collected for chemical analysis once a week unless stated otherwise. Total carbon, total organic carbon (TOC), and total inorganic carbon were analyzed with a Vario TOC cube (Elementar Analysensysteme GmbH, Langenselbold, Germany) following the EVS-EN 1484 standard. Total nitrogen (TN) was analyzed using the same device following the EVS-EN 12260 standard. NH4, NO3, and NO2 concentrations were measured spectrophotometrically using USEPA-8038 Hach Nessler, SFS 5752, and SFS 3029 standards, respectively. DO and pH were measured using a WTW Multi 3420 instrument (Xylem Analytics, Singapore) with a WTW FDO 925 and WTW pH-Electrode SenTix 940-3, respectively.
2.7 Calculation of the nitrate removal rate and the Faradaic efficiency
The calculations of TN and removal rate of NO3 and NH4 and Faradaic efficiency were performed as follows: the reactors were used as batch reactors where each cycle can be divided into three phases (Supplementary Figure S1): 1) the lag phase where the current density |j| increases significantly and the NO3 removal rate accelerates, 2) the stable phase where the current density and NO3 removal rate are stabilizing to the constant value, and 3) the end phase which begins with a rapid current density |j| drop, and it is associated with the depletion of NO3. Since the cycles lasted over 20 days, it was impossible to determine the exact moment when NO3 is fully depleted. Therefore, to compare different cycles, the NO3 removal rates and Faradaic efficiency were calculated based on the data gathered during the stable phase (Supplementary Figure S1).
The rate of NO3 reduction was calculated by evaluating the quantity of reduced NO3 per day. For calculating the Faradaic efficiency, the following formula was used:
Here, the moles of electrons are calculated based on the integrated charge, divided by the Faraday constant. Five indicates the number of electrons required to reduce one NO3 according to half-reaction (di Capua et al., 2019).
3 Results and discussion
3.1 Initiating the nitrate reduction, the open circuit, and abiotic controls
WE potentials were varied, and the initial NO3 concentration was increased multiple times to reach the initiation of the NO3 reduction during cycle (1:1). At first, the WE potential was set to −320 mV and the initial NO3 concentration was 14.6 mgN-NO3/L (Figure 2 and Figure 3; Supplementary Table S1). The potential was chosen based on previous studies, where autotrophic denitrification by MES has been researched (Yu et al., 2015; Pous et al., 2016; Yang et al., 2020). Within the first week after starting up the system, there was no change in NO3 concentration (Figures 2B, 3B). On day 7, the NO3 concentration was increased approximately by half for Reactors 1 and 2 in an attempt to initiate the active proliferation of denitrifying microorganisms (Supplementary Tables S1, S2). Still, by day 36, NO3 concentrations remained unchanged, and then the NO3 concentration was increased again, up to 82.4 and 70.8 mgN-NO3/L for Reactors 1 and 2, respectively. The DO was in the range of 0.3–0.5 mgO2/L, but it was still in the range to allow autotrophic denitrification (Gómez, 2002; Qambrani and Oh, 2013).
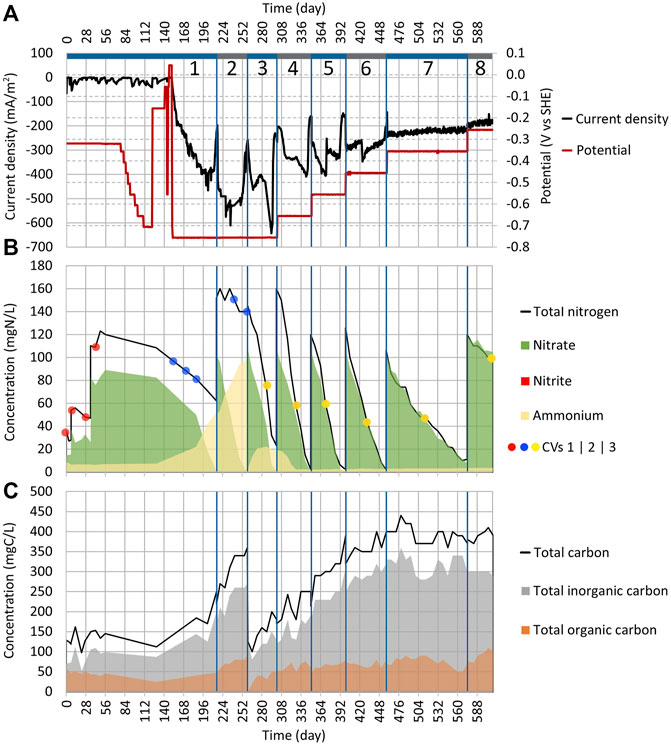
FIGURE 2. Dynamics of key parameters in Reactor 1 during cycles (1:1) to (1:8). (A) Change of current density and working electrode potential in time. (B) Area graph of total nitrogen, nitrate, nitrite, and ammonium concentrations in the electrolyte; the red, blue, and yellow dots represent when the CV measurements (shown in Figures 4, 9) were performed. (C) Area graph of total carbon, total inorganic carbon, and TOC concentrations in the electrolyte. The blue vertical lines represent borders between the cycles.
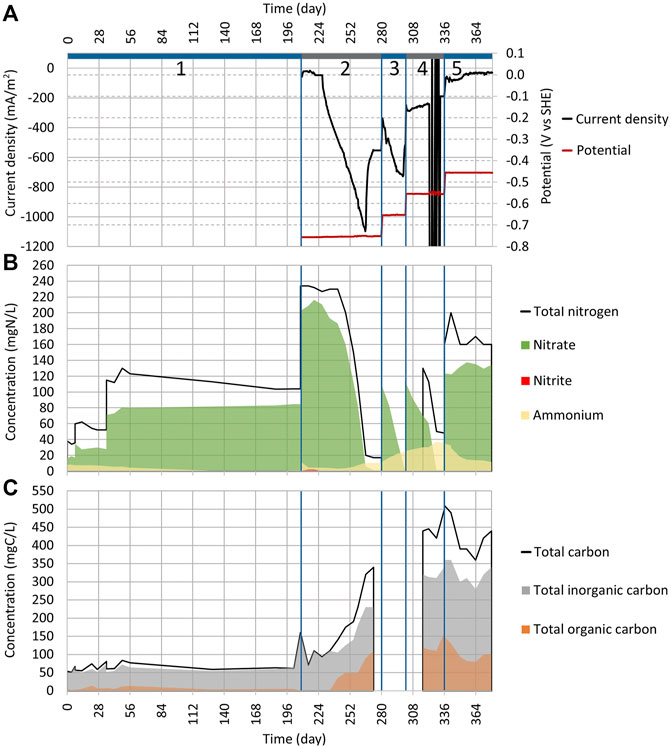
FIGURE 3. Dynamics of key parameters in Reactor 2 during cycles (2:1) to (2:5). See Figure 2 for the explanation of plots (A)−(C).
From day 77 to 122, the WE potential was lowered after every 3–7 days by 50 mV (Figure 2A). As there was no change in current density (Figure 2A) until day 122, the WE potential was increased from −706 mV to −156 mV. In both reactors (1 and 2), the NO3 concentration showed no change either (Figures 2B, 3B). On days 141 and 147, the WE potential was increased even further up to +43 mV, which was then the anodic potential, without a change in current density (Figure 2A). Even though the reduction peak, which is observed in other MESR-related publications, appeared in cyclic voltammograms around −300 mV during the first 43 days (Figure 4), in contrary to other studies, no NO3 reduction occurred (Gimkiewicz and Harnisch, 2013; Kondaveeti and Min, 2013; Pous et al., 2014; Zhou et al., 2016; Ceballos-Escalera et al., 2021). Therefore, on day 152, the WE potential was lowered to −756 mV (Figure 2A). Very low WE potentials were avoided at first due to the lack of knowledge about the values of cathodic potentials that cause damage to the microorganisms’ cell structure. After the WE potential was set, the current density |j| started to rise already on the next day (Figure 2A).
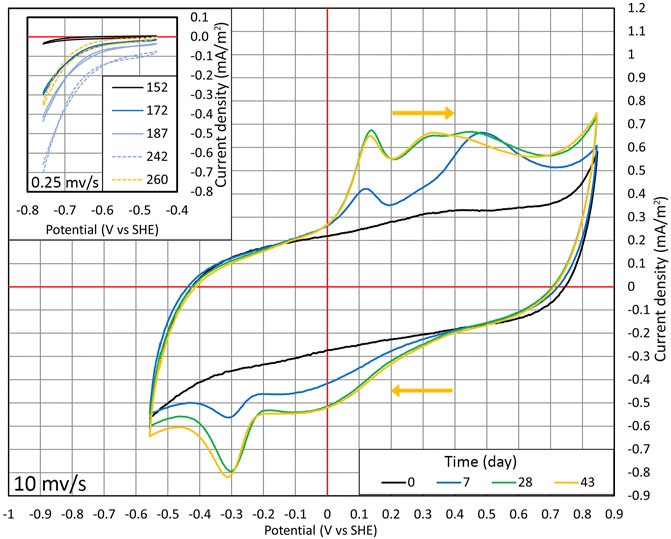
FIGURE 4. Cyclic voltammetry conducted during cycles (1:1) and (1:2). From days 0 to 43, CV was performed in the range of −556 to +846 mV at the potential sweep rate of 10 mV/s. Time points when the wide range of measurements was conducted are shown with the red dots in Figure 2B. The inset section shows the situation where CV is performed in the range of −756 to −456 mV at the potential sweep rate of 0.25 mV/s on days from 152 to 260, and the time points are shown in Figure 2B with the blue dots.
On day 186, the NO3 concentration drop was registered from 82.4 mgN-NO3/L to 50 mgN-NO3/L (Figure 2B). The adverse effect was that 45% of NO3 was reduced and turned into NH4 (the concentration increased from 7.4 mgN-NH4/L up to 21.9 mgN-NH4/L). By day 215, all NO3 in the system was reduced (Figure 2B). In the Reactor 2 cycle (2:1) the NO3, NH4, and TN concentrations remained the same as before (84 mgN-NO3/L, 1 mgN-NH4/L, and 104 mg N/L, respectively) (Figure 3B). Therefore, it can be concluded that the NO3 reduction in Reactor 1 was driven by the applied current. The pH stayed stable in both reactors.
The cycle (1:2) was conducted in Reactor 1, with the goal to confirm the replicability of NO3 reduction (Supplementary Table S1). For this, KNO3 was added, increasing the NO3 concentration to 102 mgN-NO3/L, and the WE potential was kept at −756 mV (Figure 2). NO3 was completely reduced in 43 days; however, the NH4 concentration continued to rise, meaning that 49% of NO3 was reduced to NH4 (Figure 2B). Usually, the accumulation of NO2 as an intermediate is observed during the autotrophic denitrification if the system is not functioning optimally; however, reduction down to NH4 was not anticipated (Al-Mamun and Baawain, 2015; Li et al., 2017). The dissimilatory nitrate reduction to ammonium (DNRA) can cause NO3 reduction to NH4, and it seemed to be competing with the autotrophic denitrification in the current system, and we found that it has been observed in some other cases also (Su et al., 2012). Consequently, during cycle (1:2), the pH increased from 7.3 to 7.5.
After the first successful replication of the denitrification process, the electrolyte was replaced for cycle (1:3) and the reactor was filled again with synthetic wastewater (Supplementary Table S1). This time, the reactor was expected to have the biofilm of denitrifying microbes, that is, T. denitrificans, developed on the electrodes. During cycle (1:3), the NO3 reduction rate was the same as for cycle (1:2). The DNRA’s share in NO3 reduction was lower this time than before, and only 15% of NO3 was reduced to NH4 (Figure 2B). During cycle (1:3), the pH value lowered from 7.4 to 7.2.
As the NO3 reduction was effective in Reactor 1, the abiotic electrochemical control was conducted to ensure that it was caused by MES (Supplementary Table S2). The WE potential was set to −756 mV. For 19 days (from day 208 to 227), the current density stayed stable at around −37 mA/m2 (Figure 3A), and no NO3 reduction was registered (Figure 3B). Since it took 19 days until the NO3 reduction occurred under the conditions, there is a low possibility that the NO3 reduction seen in Reactor 1 was caused purely by electrochemical reactions because electrochemical reactions tend to have a much shorter lag time.
After day 19, the current density started to increase rapidly, and by day 265, it had reached −1,100 mA/m2 (Figure 3A), which was significantly higher than the −550 mA/m2 that was previously seen on cycle (1:3) (Figure 2A). Only 3% of NO3 was reduced to NH4 in cycle (2:2) compared to 49% that we observed during cycle (1:2). The initiation of NO3 reduction that occurred during the abiotic cycle (2:2) was caused by the growth of microbes in the reactor since it got contaminated during the measurements. The gene abundance analysis that was conducted for electrodes also supports this assumption.
To confirm the results, another abiotic control cycle (3:1) was conducted, and to keep the contamination probability as low as possible, a new reactor body was made and sterilized. Also, the electrodes and the synthetic wastewater with a trace element solution were autoclaved to be used in the new reactor (Supplementary Table S3). As shown in Supplementary Figure S2B, there was no significant NO3 reduction during cycle (3:1) which lasted for 30 days. The rise in current density |j| (Supplementary Figure S2A) was probably caused by the O2 getting into the system. The rise of current density |j| was also observed in the previous study when WE was exposed to the gaseous phase (Lust et al., 2020). O2 can access the reactor by electrolyte inlets when fittings are not airtight.
In conclusion, it can be said that the NO3 reduction seen in Reactors 1 and 2 was taking place in synergy between the electrochemistry and microorganisms. We proved that the WE potential is critical when starting the NO3 reduction in the one-chamber MESR, and it was found to be around −756 mV. However, it has been previously shown that after inoculation the NO3 reduction occurs on higher WE potentials, that is, −300 to −500 mV (Yu et al., 2015; Cecconet et al., 2019). Most probably, the H2 production on WE is necessary at the beginning to provide an energy source for microbes for inoculation and enhancing anaerobic conditions (Chen et al., 2015).
Our study clearly indicates that the single-chamber design is suitable for conducting denitrification, and the biofilm of T. denitrificans was successfully inoculated on the WE. We determined that if CE has a significantly larger surface area compared to the WE’s surface area, the O2 production on CE is decreased, and therefore, the denitrification is not inhibited. By using the single-chamber reactor, the pH also remained relatively stable, and no NaOH or HCl was needed to neutralize the electrolyte.
3.2 Optimal working electrode potential
As NH4 was produced at the WE potential of −756 mV and it was unclear how much the WE potential could be increased before nitrogen reduction stopped and microorganisms were harmed, it was decided to increase the WE potential during the following cycles (Supplementary Table S1). For cycle (1:4), the WE potential was set to −656 mV and in consequence, NO3 was still reduced, and the concentration of NH4 decreased (Figure 2B). It is difficult to determine what process could have caused the removal of NH4 since there are at least two possible pathways, a combination of comammox and denitrification or anammox (Lam and Kuypers, 2011; Maddela et al., 2021). It was also not known if DNRA was still active at that point since there is a possibility that the NH4 removal was taking place at a faster rate and therefore masking the production of NH4.
As shown in Figure 5A, the TN and NO3 removal rates were the highest at the WE potential of −656 mV, with the daily removal rate of 3.9 and 3.8 ± 1.2 mg N/(L × day), respectively. The removal rate of TN and NO3 slowed with the increase of the WE potential and dropped down to 0.35 and 0.27 mg N/(L × day), respectively, at the WE potential of −256 mV. The NO3 removal rate achieved in the current reactor was relatively high. Compared to Pous et al. (2016), where a NO3 removal rate of 345 ± 166 mg N/(m2 × day) was achieved in their reactor setting, the NO3 removal rate in our experiment was 819 ± 258 mg N/(m2×day). However, the ratio of WE geometric surface area to electrolyte volume could have caused the difference in removal rate since it was 31
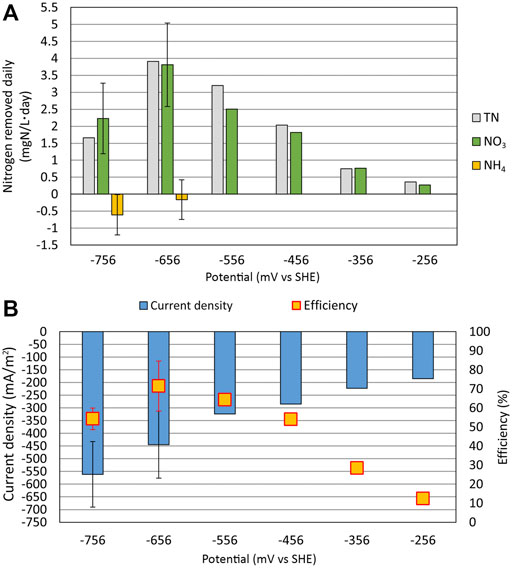
FIGURE 5. Relationship between the electrode potential (mV vs. standard hydrogen electrode), nitrogen removal rate, and current density. (A) Daily removal rate for total nitrogen (TN), nitrate (NO3), and ammonium (NH4) on different WE potentials. (B) Faradaic efficiency with the average current density is shown at different WE potentials. At the WE potential of −756 mV, there are three parallel measurements, and at −656 mV, there are two parallel measurements for NO3 and NH4. Error bars represent standard deviations.
NH4 was produced at the WE potentials of −756 mV and −656 mV; however, at higher WE potentials, NH4 was not formed. Therefore, the system is able to remove NH4 from the wastewater since in Reactor 1, the NH4 accumulated during cycle (1:3) was removed during cycle (1:4). On the contrary, Su et al. (2012) showed that DNRA could occur even when the WE potential of −303 mV was applied, but in our experimental setup, the NH4 concentration did not increase above a WE potential of −556 mV.
As shown in Figure 5B, the average current density drops from −560 mA/m2 at the WE potential of −756 mV to −190 mA/m2 at the WE potential of −256 mV. The decrease of current density is expected since the WE potential gets closer to the open-circuit potential and away from very cathodic potentials where hydrogen evolution and oxygen reduction are possible. On higher WE potentials, the NO3 reduction rate also decreases, causing the current density to drop.
The Faradaic efficiency was the highest at the WE potential of −656 mV, resulting in an efficiency of 71%. As the potential was increased, the current density |j| decreased and the NO3 reduction rate slowed down. At the same time, the Faradaic efficiency also substantially decreased (only 12% at −256 mV) because the proportion of side reactions increased. On the other hand, the NH4 production at the most negative potential of −756 mV also caused the drop in Faradaic efficiency.
In conclusion, we recorded that even relatively small changes in the WE potential can significantly affect the rate of the denitrification process and which processes are dominating in the system, therefore contributing to the Faradaic efficiency to a substantial extent. In this study, the WE potential of −656 mV was found to be optimal for NO3 reduction with the NO3 removal rate of 819 ± 258 mg N/(m2×day).
3.3 Changes in TOC
Throughout the study, no organic carbon was added into the system since the goal was to assess the NO3 reduction in the absence of organic carbon. Based on our data, it is possible to assume that the increase in TOC concentration is related to the growth of microorganisms. During the experiment, it was observed that the TOC concentration was increased during the cycles where electrosynthesis took place, that is, the current density |j| was high. However, the TOC concentration increased only up to 110 mgC-TOC/L in all three reactors, and later in the cycles, the increase stopped. The rise in TOC was relatively rapid, for example, in cycle (3:1), the TOC concentration increased from 10 to 110 mgC-TOC/L in 2–3 days. During cycle (2:1), where the open-circuit control was conducted, TOC stayed around 6 mgC-TOC/L for the whole 208 days and no NO3 was reduced.
During cycle (1:1), the TOC was also around 45 mgC-TOC/L before NO3 reduction was initiated. Therefore, an increase in TOC shows that some microorganisms are present and growing, but it does not necessarily mean that the consortium can also reduce NO3.
3.4 Analysis of numbers of heterotrophic bacteria in the electrolyte solution
During cycle (1:3), samples were taken to evaluate the numbers of heterotrophic bacteria in the electrolyte solution (Supplementary Table S1). This was the cycle where all electrolyte was replaced shortly after the NO3 reduction was achieved in the reactor (Figure 2B). Although it was anticipated that the bacterial numbers expressed by CFU per 1 mL of electrolyte would increase during the cycle, no constant increase of heterotrophic microorganisms could be seen (Figure 6). TOC increased significantly from 0 to 20 and then to 40 mgC-TOC/L on days 0, 6, and 14, respectively (Figure 2C). No correlation between detected bacterial numbers (CFU/mL) and TOC concentration was observed. The difference in TOC values is most probably caused by the proliferation of autotrophic denitrifiers in the electrolyte which are unable to grow on nutrient agar standardly used for assessing the number of water microbes.
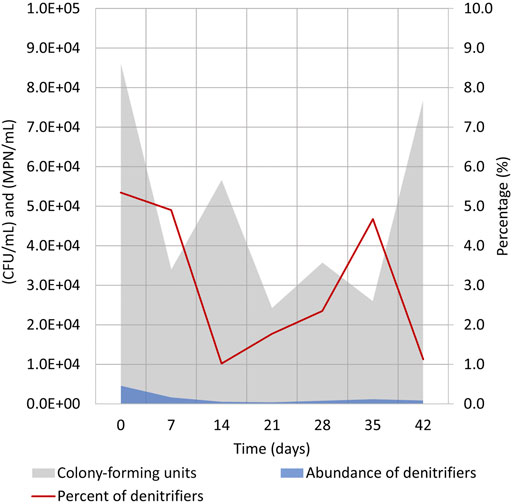
FIGURE 6. Evaluation of bacterial numbers during cycle (1:3) (days 260–302) in the electrolyte solution (Supplementary Table S1). Heterotrophic culturable microorganisms were enumerated by CFU/mL on nutrient agar, and heterotrophic denitrifying bacteria numbers were evaluated by MPN/mL in Hiltay medium (see chapter 2.4 for details).
At the beginning of the cycle, the CFUs/mL value was somewhat higher, and this might have been caused by the replacement of the electrolyte which caused some of the biofilm-living bacteria to detach from the electrodes. The CFUs/mL values dropped insignificantly during the cycle, and the heterotrophic bacteria count in the electrolyte solution did not reach its initial number.
The abundance of heterotrophic denitrifying bacteria followed a similar pattern, and only 1–5% of cultivated heterotrophs were heterotrophic denitrifying bacteria. Similar to total heterotrophic bacterial count, no growth of bacterial numbers was seen (Figure 6). These data indicate that despite the presence of heterotrophic bacteria in the reactor, the effective denitrification process is taking place mostly by autotrophic denitrifiers that are unable to grow in the test media. It has been recently shown that the shift of the microbial community from heterotrophic to autotrophic denitrification is feasible, but it is rather tedious and needs specific conditions (Huang et al., 2022). Our results also confirm that the autotrophic denitrifying community probably remains stable and is not replaced with heterotrophs during the cycle. Based on the trends and replicability of other measurements (Figure 3), the stabile denitrifying community is expected to reside attached to the WE of Reactor 1.
3.5 Abundance of nitrification genes on the electrodes
Three sets of electrodes were collected during the study. Electrode set 1 was used for 612 days in Reactor 1 for all eight cycles (1:1) to (1:8) (Figure 2). Electrode set 2 was used for 169 days in Reactor 2 cycles (2:2) to (2:5) (Figure 3), and electrode set 3 was used for 30 days in Reactor 3 cycle (3:1) (Supplementary Figure S2).
The abundances of bacterial and archaeal 16S rRNA, bacterial and comammox amoA, nirS, nirK, and nosZI genes were quantified. The bacterial 16S rRNA gene abundance was the highest on set 1 for the CE and WE (Figure 7). The difference in 16S rRNA genes abundance is much smaller between the three-electrode sets on the CEs compared to the WEs, indicating that on the CEs, time has a smaller impact on microbes’ growth (Figure 7). For archaeal 16S rRNA, the gene abundance followed the trend where the electrode that was used for a longer period had a higher gene abundance.
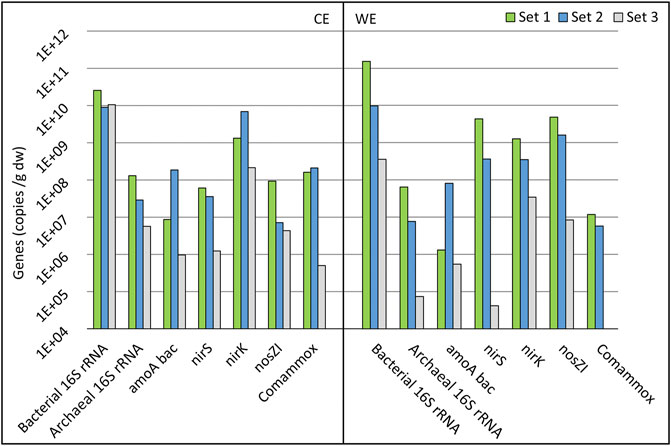
FIGURE 7. Gene abundances of electrode sets 1–3 on a logarithmic scale. Counter electrode data are shown in the CE section, and working electrode data are shown in the WE section. See Chapter 3.5 for the explanation of gene symbols and electrode names.
Electrodes from set 3 showed a high abundance of nitrogen cycle-related genes (Figure 7). Still, no significant NO3 reduction was observed after 30 days in the abiotic control reactor (Supplementary Figure S2). Compared to other electrode sets, WE (set 3) from cycle (3:1) showed significantly low copy numbers of the nirS gene, which is related to the second step of denitrification, reducing NO2 to NO (Lam and Kuypers, 2011), and might have been the reason why the NO3 reduction did not occur. The abundances of archaeal 16S rRNA genes and the commamox community were also very low on this electrode.
The presence of the nirS gene along with the nosZ gene is more abundantly found in denitrifiers over the nirK gene (Hallin et al., 2018). Therefore, there is relevant evidence of the presence of complete denitrifiers on the WE (Figure 8) as the abundances of nirS and nosZI genes are similar. Abundances of the nosZI gene are relatively higher on WE in comparison to CE (Figure 8) and can be an indication of the participation of the reductive electrode in the denitrification process by the nosZI gene-possessing microbes. Most of the N-transforming microbes have shown to be compromised by electrochemical manipulation, but complete denitrifiers are able to sustain themselves (Hallin et al., 2018). Microbes possessing nirK genes are naturally in high abundances in nature, and therefore, their presence on the WE should not always be correlated to any specific activity (Lam and Kuypers, 2011; Hallin et al., 2018). The previous study on the microbial electrochemical systems also showed increased abundances of nirS and nosZI gene-harboring microbes (Gadegaonkar et al., 2020), supporting our results and indicating probable complete denitrification.
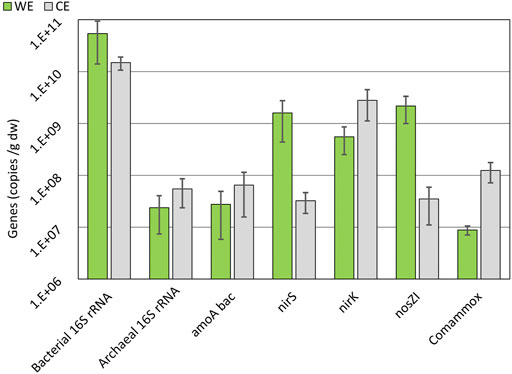
FIGURE 8. Average abundances of gene copies on WE and CE over all three electrode sets on a logarithmic scale. 16S rRNA, nirK, amoA bac, nirS, nosZI, and comammox gene abundances are shown. See chapter 3.5 for the explanation of gene symbols. Error bars are used to show the standard error.
amoA and comammox amoA genes are related to oxidizing ammonia and were found in higher numbers on the CE (Figure 8) (Lam and Kuypers, 2011). It was a predictable finding because there is a need for electron acceptors during the oxidation, and the CE could be used for this purpose.
3.6 Cyclic voltammetry
Throughout the experiment, cyclic voltammetry (CV) measurements were performed to describe the changes that were happening on the WEs. All shown measurements are taken from Reactor 1 and cyclic voltammograms presented are taken at different time points, which are shown in Figure 2B with different colored dots.
At first, CV was conducted in a wide potential range (from −556 to +846 mV). A relatively quick potential sweep rate (10 mV/s) was used to harm the microorganisms as little as possible (Figure 4). On day 0, CV followed a typical carbon-based electrode shape with no distinctive redox peaks (Pous et al., 2014). On day 7, the reduction peak of around −300 mV appeared. The peak in the same position is detected in multiple articles that have shown the autotrophic denitrification in MESR (Kondaveeti and Min, 2013; Pous et al., 2014; Yu et al., 2015; Zhou et al., 2016; Ceballos-Escalera et al., 2021).
After lowering the WE potential to −756 mV and observing the changes in NO3 concentration, the cyclic voltammograms were made only in a smaller potential range (−756 to −456 mV) to lower the possibility of harming the microorganisms and a potential sweep rate of 0.25 mV/s (as shown in the inset of Figure 4). The lower potential sweep rate was used because at a higher sweep rate, the main current comes from charging of the electrical double layer. However, at a low sweep rate, it is possible to measure mainly Faradaic current. The time points when these CV measurements were taken are shown in Figure 2B marked with blue dots. With time progressing, the overall current density |j| increased, and at lower potentials, the increase of current density |j| was much more pronounced compared to higher potentials (Figure 4). Therefore, WE got more active in time. On day 260, when NO3 was consumed from the reactor, the current density |j| dropped, as can be seen from CV (Figure 2A and in the inset of Figure 4), that is, the current density is directly related to the nitrate concentration.
During the search for the optimal WE potential, cycles (1:3) to (1:8), CV was conducted in a smaller range (−756 mV to −356 mV) with the potential sweep rate of 0.25 mV/s (Figure 9). All the cyclic voltammograms that are shown are chosen from times when the cycle was in a second phase and the NO3 concentration was as similar as possible during the measurement. The times when the measurements were conducted are shown in Figure 2B with the yellow dots. During the experiment, the WE capacitance increased with time significantly, that is, there is a visible difference between anodic and cathodic scans (Figure 9). It could be caused by the increase of WE surface area which is in contact with water, and better wetting of the graphite felt was achieved over time. The increase of capacitance could also be caused by the changes in WE structure and related to the growth of the biofilm on the WE, therefore making the bacterial community more active. However, the initial WE potential had to be at least −756 mV for the NO3 reduction to start the process, which was still active at lower potentials.
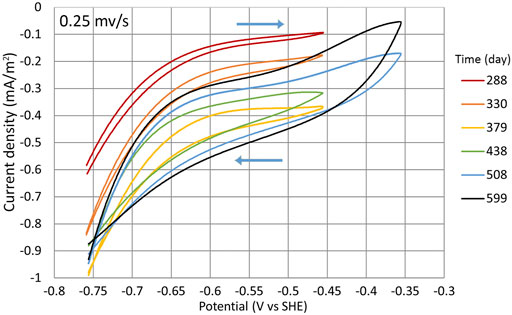
FIGURE 9. CV during cycles (1:3) to (1:8). Measurements were made in the potential range of −756 mV to −356 mV at the potential sweep rate of 0.25 mV/s. Time points when the measurements were conducted are shown with the yellow dots in Figure 2B.
The CV measurements indicate that even at higher potentials, the T. denitrificans biofilm surface area probably was still expanding as the WE current density |j| constantly increased (Figure 9) even during the cycles where higher potentials were used (Figure 2A).
4 Conclusion
A stable nitrate reduction by denitrification in the constructed one-chamber MESR was achieved. The WE was successfully inoculated by using T. denitrificans at the WE potential of −756 mV, without any additional treatment. It was observed that after initiation, the WE potential could be increased without stopping the process of denitrification. The optimal potential was found to be −656 mV, where the highest Faradaic efficiency of 71% and the nitrate removal rate of 3.8 ± 1.2 mgN-NO3/(L×day) were registered. The oxygen concentration was kept low throughout the experiment by using CE with a 3.6 times larger geometric surface area compared to WE. The abundance of nirS and nosZI genes was much higher on WE compared to CE, indicating that the process was driven by autotrophic denitrification.
Data availability statement
The raw data supporting the conclusions of this article will be made available by the authors, without undue reservation.
Author contributions
RL: conceptualization, data curation, formal analysis, investigation, methodology, project administration, visualization, and writing – original draft. JN: conceptualization, formal analysis, investigation, methodology, resources, supervision, and writing – review and editing. SG: investigation and writing – original draft. KK: supervision and writing – review and editing. ME: supervision and writing – review and editing. TV: investigation and writing – review and editing. ÜM: conceptualization, funding acquisition, methodology, project administration, resources, supervision, and writing – review and editing.
Funding
This research was supported by the Estonian Research Council (grant numbers PSG631, PSG714, PRG352) and by the European Union (EU) through the European Regional Development Fund: Centre of Excellence EcolChange, TK 141 Advanced materials and high-technology devices for energy recuperation systems (grant number 2014-2020.4.01.15-0011), the University of Tartu Feasibility Fund (grant number PLTOMARENG51), and the European Structural and Investment Funds.
Conflict of interest
The authors declare that the research was conducted in the absence of any commercial or financial relationships that could be construed as a potential conflict of interest.
Publisher’s note
All claims expressed in this article are solely those of the authors and do not necessarily represent those of their affiliated organizations or those of the publisher, the editors, and the reviewers. Any product that may be evaluated in this article or claim that may be made by its manufacturer is not guaranteed or endorsed by the publisher.
Supplementary material
The Supplementary Material for this article can be found online at: https://www.frontiersin.org/articles/10.3389/fenvs.2022.938631/full#supplementary-material
References
Afsham, N., Roshandel, R., Yaghmaei, S., Vajihinejad, V., and Sherafatmand, M. (2015). Bioelectricity generation in a soil microbial fuel cell with biocathode denitrification. Energy Sources, Part A Recovery, Util. Environ. Eff. 37, 2092–2098. doi:10.1080/15567036.2012.671900
Aguirre-Sierra, A., Bacchetti-De Gregoris, T., Salas, J. J., de Deus, A., and Esteve-Núñez, A. (2020). A new concept in constructed wetlands: Assessment of aerobic electroconductive biofilters. Environ. Sci. Water Res. Technol. 6, 1312–1323. doi:10.1039/C9EW00696F
Al-Mamun, A., and Baawain, M. S. (2015). Accumulation of intermediate denitrifying compounds inhibiting biological denitrification on cathode in Microbial Fuel Cell. J. Environ. Health Sci. Eng. 13, 81. doi:10.1186/s40201-015-0236-5
Andalib, M., Taher, E., Donohue, J., Ledwell, S., Andersen, M. H., Sangrey, K., et al. (2018). Correlation between nitrous oxide (N2O) emission and carbon to nitrogen (cod/N) ratio in denitrification process: A mitigation strategy to decrease greenhouse gas emission and cost of operation. Water Sci. Technol. 77, 426–438. doi:10.2166/wst.2017.558
Bonanni, P. S., Schrott, G. D., Robuschi, L., and Busalmen, J. P. (2012). Charge accumulation and electron transfer kinetics in Geobacter sulfurreducens biofilms. Energy Environ. Sci. 5, 6188. doi:10.1039/c2ee02672d
Camargo, J. A., and Alonso, Á. (2006). Ecological and toxicological effects of inorganic nitrogen pollution in aquatic ecosystems: A global assessment. Environ. Int. 32, 831–849. doi:10.1016/J.ENVINT.2006.05.002
Ceballos-Escalera, A., Pous, N., Chiluiza-Ramos, P., Korth, B., Harnisch, F., Bañeras, L., et al. (2021). Electro-bioremediation of nitrate and arsenite polluted groundwater. Water Res. 190, 116748. doi:10.1016/j.watres.2020.116748
Cecconet, D., Devecseri, M., Callegari, A., and Capodaglio, A. G. (2018). Effects of process operating conditions on the autotrophic denitrification of nitrate-contaminated groundwater using bioelectrochemical systems. Sci. Total Environ. 613-614, 663–671. doi:10.1016/j.scitotenv.2017.09.149
Cecconet, D., Bolognesi, S., Callegari, A., and Capodaglio, A. G. (2019). Controlled sequential biocathodic denitrification for contaminated groundwater bioremediation. Sci. Total Environ. 651, 3107–3116. doi:10.1016/j.scitotenv.2018.10.196
Chen, D., Yang, K., and Wang, H. (2015). High nitrate removal by autohydrogenotrophic bacteria in a biofilm-electrode reactor. Desalination Water Treat. 55 (5), 1–9. doi:10.1080/19443994.2014.925837
Dehghani, S., Rezaee, A., and Hosseinkhani, S. (2018). Biostimulation of heterotrophic-autotrophic denitrification in a microbial electrochemical system using alternating electrical current. J. Clean. Prod. 200, 1100–1110. doi:10.1016/j.jclepro.2018.08.013
Di Capua, F., Ahoranta, S. H., Papirio, S., Lens, P. N. L., and Esposito, G. (2016). Impacts of sulfur source and temperature on sulfur-driven denitrification by pure and mixed cultures of Thiobacillus. Process Biochem. 51 (10), 1576–1584. doi:10.1016/J.PROCBIO.2016.06.010
Di Capua, F., Pirozzi, F., Lens, P. N. L., and Esposito, G. (2019). Electron donors for autotrophic denitrification. Chem. Eng. J. 362, 922–937. doi:10.1016/J.CEJ.2019.01.069
Ding, A., Zhao, D., Ding, F., Du, S., Lu, H., Zhang, M., et al. (2018). Effect of inocula on performance of bio-cathode denitrification and its microbial mechanism. Chem. Eng. J. 343, 399–407. doi:10.1016/j.cej.2018.02.119
Espenberg, M., Truu, M., Mander, Ü., Kasak, K., Nõlvak, H., Ligi, T., et al. (2018). Differences in microbial community structure and nitrogen cycling in natural and drained tropical peatland soils. Sci. Rep. 8 (1 8), 4742. doi:10.1038/s41598-018-23032-y
Gadegaonkar, S. S., Philippon, T., Rogińska, J. M., Mander, Ü., Maddison, M., Etienne, M., et al. (2020). Effect of cathode material and its size on the abundance of nitrogen removal functional genes in microcosms of integrated bioelectrochemical-wetland systems. Soil Syst. 4, 47. doi:10.3390/soilsystems4030047
Gimkiewicz, C., and Harnisch, F. (2013). Waste water derived electroactive microbial biofilms: Growth, maintenance, and basic characterization. JoVE 82, 50800. doi:10.3791/50800
Gómez, M. (2002). Effect of dissolved oxygen concentration on nitrate removal from groundwater using a denitrifying submerged filter. J. Hazard. Mat. 90, 267–278. doi:10.1016/S0304-3894(01)00353-3
Gregory, K. B., Bond, D. R., and Lovley, D. R. (2004). Graphite electrodes as electron donors for anaerobic respiration. Environ. Microbiol. 6, 596–604. doi:10.1111/j.1462-2920.2004.00593.x
Hallin, S., Philippot, L., Löffler, F. E., Sanford, R. A., and Jones, C. M. (2018). Genomics and ecology of novel N2O-reducing microorganisms. Trends Microbiol. 26, 43–55. doi:10.1016/J.TIM.2017.07.003
Huang, S., Zhu, G., and Gu, X. (2020). The relationship between energy production and simultaneous nitrification and denitrification via bioelectric derivation of microbial fuel cells at different anode numbers. Environ. Res. 184, 109247. doi:10.1016/j.envres.2020.109247
Huang, X., Duan, C., Yu, J., and Dong, W. (2022). Transforming heterotrophic to autotrophic denitrification process: Insights into microbial community, interspecific interaction and nitrogen metabolism. Bioresour. Technol. 345, 126471. doi:10.1016/J.BIORTECH.2021.126471
Kadier, A., Jain, P., Lai, B., Kalil, M. S., Kondaveeti, S., Alabbosh, K. F. S., et al. (2020). Biorefinery perspectives of microbial electrolysis cells (MECs) for hydrogen and valuable chemicals production through wastewater treatment. Biofuel Res. J. 7, 1128–1142. doi:10.18331/BRJ2020.7.1.5
Kandeler, E., Deiglmayr, K., Tscherko, D., Bru, D., and Philippot, L. (2006). Abundance of narG , nirS , nirK , and nosZ genes of denitrifying bacteria during primary successions of a glacier foreland. Appl. Environ. Microbiol. 72, 5957–5962. doi:10.1128/AEM.00439-06
Kondaveeti, S., and Min, B. (2013). Nitrate reduction with biotic and abiotic cathodes at various cell voltages in bioelectrochemical denitrification system. Bioprocess Biosyst. Eng. 36, 231–238. doi:10.1007/s00449-012-0779-0
Lam, P., and Kuypers, M. M. M. (2011). Microbial nitrogen cycling processes in oxygen minimum zones. Annu. Rev. Mar. Sci. 3, 317–345. doi:10.1146/annurev-marine-120709-142814
Li, P., Wang, Y., Zuo, J., Wang, R., Zhao, J., Du, Y., et al. (2017). Nitrogen removal and N2O accumulation during hydrogenotrophic denitrification: Influence of environmental factors and microbial community characteristics. Environ. Sci. Technol. 51, 870–879. doi:10.1021/acs.est.6b00071
Liu, H., Kong, T., Qiu, L., Xu, R., Li, F., Kolton, M., et al. (2021). Solar-driven, self-sustainable electrolysis for treating eutrophic river water: Intensified nutrient removal and reshaped microbial communities. Sci. Total Environ. 764, 144293. doi:10.1016/j.scitotenv.2020.144293
Lust, R., Nerut, J., Kasak, K., and Mander, Ü. (2020). Enhancing nitrate removal from waters with low organic carbon concentration using a bioelectrochemical system-A pilot-scale study. Water 12, 516. doi:10.3390/w12020516
Maddela, N. R., Gan, Z., Meng, Y., Fan, F., and Meng, F. (2022). Occurrence and roles of comammox bacteria in water and wastewater treatment systems: A critical review. Engineering. In Press. doi:10.1016/j.eng.2021.07.024
Mechichi, T., Stackebrandt, E., and Fuchs, G. (2003). Alicycliphilus denitrificans gen. nov., sp. nov., a cyclohexanol-degrading, nitrate-reducing β-proteobacterium. Int. J. Syst. Evol. Microbiol. 53 (1), 147–152. doi:10.1099/ijs.0.02276-0
MPNcalc v1.2.0 MPNcalc v1.2.0. URL https://mpncalc.galaxytrakr.org/ (accessed 18 January, 2022).
Nguyen, V. K., Park, Y., Yu, J., and Lee, T. (2016). Bioelectrochemical denitrification on biocathode buried in simulated aquifer saturated with nitrate-contaminated groundwater. Environ. Sci. Pollut. Res. 23 (15), 15443–15451. doi:10.1007/s11356-016-6709-y
Pang, Y., and Wang, J. (2021). Various electron donors for biological nitrate removal: A review. Sci. Total Environ. 794, 148699. doi:10.1016/j.scitotenv.2021.148699
Pankratova, G., Hederstedt, L., and Gorton, L. (2019). Extracellular electron transfer features of Gram-positive bacteria. Anal. Chim. Acta 1076, 32–47. doi:10.1016/j.aca.2019.05.007
Pärn, J., Henine, H., Kasak, K., Kauer, K., Sohar, K., Tournebize, J., et al. (2018). Nitrogen and phosphorus discharge from small agricultural catchments predicted from land use and hydroclimate. Land Use Policy 75, 260–268. doi:10.1016/J.LANDUSEPOL.2018.03.048
Pous, N., Koch, C., Colprim, J., Puig, S., and Harnisch, F. (2014). Extracellular electron transfer of biocathodes: Revealing the potentials for nitrate and nitrite reduction of denitrifying microbiomes dominated by Thiobacillus sp. Electrochem. Commun. 49, 93–97. doi:10.1016/j.elecom.2014.10.011
Pous, N., Carmona-Martínez, A. A., Vilajeliu-Pons, A., Fiset, E., Bañeras, L., Trably, E., et al. (2016). Bidirectional microbial electron transfer: Switching an acetate oxidizing biofilm to nitrate reducing conditions. Biosens. Bioelectron. 75, 352–358. doi:10.1016/j.bios.2015.08.035
Qambrani, N. A., and Oh, S. E. (2013). Effect of dissolved oxygen tension and agitation rates on sulfur-utilizing autotrophic denitrification: Batch tests. Appl. Biochem. Biotechnol. 169, 181–191. doi:10.1007/s12010-012-9955-6
Ren, Y., Lv, Y., Wang, Y., and Li, X. (2020). Effect of heterotrophic anodic denitrification on anolyte pH control and bioelectricity generation enhancement of bufferless microbial fuel cells. Chemosphere 257, 127251. doi:10.1016/j.chemosphere.2020.127251
Rosenbaum, M., Aulenta, F., Villano, M., and Angenent, L. T. (2011). Cathodes as electron donors for microbial metabolism: Which extracellular electron transfer mechanisms are involved? Bioresour. Technol. 102, 324–333. doi:10.1016/j.biortech.2010.07.008
Ruijter, J. M., Ramakers, C., Hoogaars, W. M. H., Karlen, Y., Bakker, O., van den Hoff, M. J. B., et al. (2009). Amplification efficiency: Linking baseline and bias in the analysis of quantitative PCR data. Nucleic Acids Res. 37, e45. doi:10.1093/nar/gkp045
Sharma, M., Alvarez-Gallego, Y., Achouak, W., Pant, D., Sarma, P. M., Dominguez-Benetton, X., et al. (2019). Electrode material properties for designing effective microbial electrosynthesis systems. J. Mat. Chem. A 7, 24420–24436. doi:10.1039/C9TA04886C
Su, W., Zhang, L., Li, D., Zhan, G., Qian, J., Tao, Y., et al. (2012). Dissimilatory nitrate reduction byPseudomonas alcaliphilawith an electrode as the sole electron donor. Biotechnol. Bioeng. 109, 2904–2910. doi:10.1002/BIT.24554
Szekeres, S., Kiss, I., Kalman, M., and Soares, M. I. M. (2002). Microbial population in a hydrogen-dependent denitrification reactor. Water Res. 36 (16), 4088–4094. doi:10.1016/S0043-1354(02)00130-6
Wang, M., Huang, G., Zhao, Z., Dang, C., Liu, W., Zheng, M., et al. (2018). Newly designed primer pair revealed dominant and diverse comammox amoA gene in full-scale wastewater treatment plants. Bioresour. Technol. 270, 580–587. doi:10.1016/J.BIORTECH.2018.09.089
Wang, X., Tian, Y., Liu, H., Zhao, X., and Peng, S. (2019). The influence of incorporating microbial fuel cells on greenhouse gas emissions from constructed wetlands. Sci. Total Environ. 656, 270–279. doi:10.1016/j.scitotenv.2018.11.328
Wang, X., Aulenta, F., Puig, S., Esteve-Núñez, A., He, Y., Mu, Y., et al. (2020). Microbial electrochemistry for bioremediation. Environ. Sci. Ecotechnology 1, 100013. doi:10.1016/j.ese.2020.100013
WHO (2017). Guidelines for drinking-water quality: Fourth edition incorporating the first addendum. Geneva: World Health Organization. Licence: CC BY-NC-SA 3.0 IGO.
Xu, D., Xiao, E., Xu, P., Lin, L., Zhou, Q., Xu, D., et al. (2017). Bacterial community and nitrate removal by simultaneous heterotrophic and autotrophic denitrification in a bioelectrochemically-assisted constructed wetland. Bioresour. Technol. 245, 993–999. doi:10.1016/j.biortech.2017.09.045
Yang, Q., Zhao, N., Wang, H., Huang, B., and Yan, Q. (2020). Electrochemical and biochemical profiling of the enhanced hydrogenotrophic denitrification through cathode strengthening using bioelectrochemical system (BES). Chem. Eng. J. 381, 122686. doi:10.1016/j.cej.2019.122686
Yu, L., Yuan, Y., Chen, S., Zhuang, L., and Zhou, S. (2015). Direct uptake of electrode electrons for autotrophic denitrification by Thiobacillus denitrificans. Electrochem. Commun. 60, 126–130. doi:10.1016/j.elecom.2015.08.025
Keywords: microbial electrochemical system, biocathode, denitrification, dissimilatory nitrate reduction to ammonium, chemolithoautotrophy
Citation: Lust R, Nerut J, Gadegaonkar SS, Kasak K, Espenberg M, Visnapuu T and Mander Ü (2022) Single-chamber microbial electrosynthesis reactor for nitrate reduction from waters with a low-electron donors’ concentration: from design and set-up to the optimal operating potential. Front. Environ. Sci. 10:938631. doi: 10.3389/fenvs.2022.938631
Received: 07 May 2022; Accepted: 04 July 2022;
Published: 10 August 2022.
Edited by:
Narcis Pous, University of Girona, SpainReviewed by:
Ioannis Vyrides, Cyprus University of Technology, CyprusHongbo Liu, University of Shanghai for Science and Technology, China
Alba Ceballos-Escalera, University of Girona, Spain
Copyright © 2022 Lust, Nerut, Gadegaonkar, Kasak, Espenberg, Visnapuu and Mander. This is an open-access article distributed under the terms of the Creative Commons Attribution License (CC BY). The use, distribution or reproduction in other forums is permitted, provided the original author(s) and the copyright owner(s) are credited and that the original publication in this journal is cited, in accordance with accepted academic practice. No use, distribution or reproduction is permitted which does not comply with these terms.
*Correspondence: Rauno Lust, UmF1bm9sdXN0QGxpdmUuY29t