 Xiufeng Guo
 Ziyu Ji3
- 1College of Atmosphere and Remote Sensing, Wuxi University, Wuxi, China
- 2State Key Laboratory of Severe Weather, Chinese Academy of Meteorological Sciences, Beijing, China
- 3College of Electronic and Information Engineering, Nanjing University of Information Science and Technology, Nanjing, China
In this study, the authors developed a three-dimensional (3D) numerical model for the diffusion of positive corona charges based on a 2D model with a uniform grid to explore the characteristics of corona discharge at a building tip during a thunderstorm in the presence of wind. The variable-grid meshing method is used to solve the problems of implementing a large simulation domain for thunder clouds (kilometer-scale) and the minute calculations of corona discharge at the tip (centimeter scale) in the 3D numerical simulation. The proposed model has advantages in terms of the acquisition of the parameters of corona charges and the spatial distribution of the electric field (E-field) in the environment. We used positive corona discharge at the tip of a building under a negative thunderstorm, along with three wind fields (horizontal wind, updraft, and downdraft with wind speeds of 10 m/s) as an example. The presence of the wind increased the density of corona charges at the tip, where the horizontal wind was the most beneficial for its occurrence. Moreover, the characteristics of distortion of the electric field around the tip were significantly different, owing to the different directions of the wind. Downdraft led to the maximum enhancement in the E-field above the tip, and updraft prompted the minimum increase in it, by only 1.19 times. However, the opposite results were obtained for the enhancement in the spatial range of the charges: The updraft led to the greatest increase in it, and the downdraft caused the smallest. Corona charges had an apparent shielding effect on the E-field below the tip and can even change the polarity of the E-field in a small area close to it. The strongest shielding effect on the ground E-field occurred in the case of the downdraft, which decreased the E-field to 0.36 times compared with that without the corona charges. On the contrary, corona discharge had the weakest shielding ability on the ground when it met the updraft. The horizontal wind had the largest range of shielding on the ground, of up to 14,699.36 m2, while the updraft had the lowest, at only 6,170.91 m2.
Introduction
Corona discharge is the phenomenon whereby the local electric field (E-field) at the tip of the building exceeds the breakdown threshold of air. Large-scale laboratory simulations and field observations have shown that the initial E-field of corona discharge (Peek, 1929) and the relationship between the corona-induced current and the environmental E-field (Zhou et al., 1965; Lu et al., 2010; Yanhui et al., 2021) are influenced by many factors, such as the shape and material of the tip, the terrain, and characteristics of the thunderstorm E-field (Golde, 1977; Standler and Winn, 1979; Chauzy and Raizonville, 1982; Qie et al., 1994; Soula, 1994). Zhang et al. (2016) measured corona charges in the air in the range from several hundred to thousands of meters above the ground, with an average magnitude of about 1 nC/m3. The observations verified the 1D characteristics of the distribution of the average values of the corona charge, but it is difficult to obtain its 3D spatial distribution and the characteristics of its evolution over time.
The numerical simulation of corona discharge can compensate for the insufficiency of observational data, from which the distribution of corona charges is difficult to obtain. Aleksandrov et al. (2001) and Aleksandrov et al. (2002) established a 1D model for the initialization and diffusion of corona ions and discussed the effects of the characteristics of the tip on corona discharge and its use in the design of lightning rods in subsequent studies (Aleksandrov et al., 2005a; Aleksandrov et al., 2005b). Becerra (2013) extended the 1D model to a 2D symmetric model to clarify the characteristics of the distribution of corona ions around the lightning rod. However, neither model can be used to simulate tips with asymmetric structures. Guo et al. (2017) established a time-dependent model of corona discharge with a uniform grid meshing in a 2D Cartesian coordinate system by using Peek’s formula to calculate the thresholds of corona discharge at the tips of different structures. The model overcomes the shortcomings of the existing 1D and 2D axisymmetric models. Simulations of corona discharge under different wind conditions and on multiple tips were achieved. Chen (2018) established a model of corona discharge for 2D high-voltage transmission lines and discussed the spatiotemporal evolution of corona ions around the line of the E-field during a thunderstorm. However, the limitations to the 2D model, such as the inability to obtain the characteristics of the spatiotemporal evolution of corona charges in 3D space and the underestimation of the E-field and the effects of its distortion (lack of a horizontal component), highlight the need to carry out high-resolution 3D simulations of this phenomenon.
To sum up, methods of observation are inadequate for research on corona discharge at the tip of buildings during a thunderstorm, and 3D numerical simulations can be used as a supplement. At the same time, a balance needs to be struck between the large simulation domain required to represent thunder clouds (the kilometer scale) and the minute calculations involved in discharges (the centimeter scale). This study develops a 3D numerical model of the diffusion of positive corona charges with variable-grid meshing based on a 2D uniform model and considers the presence of the E-field of the thunderstorm and the wind field. The model is applied to examine the influence of wind on corona discharge in buildings and to identify the characteristics of variations in each corona-related parameter with the wind field. The aim was to reveal the influence of wind on various aspects of corona discharge.
Materials and Methods
Introduction to the Model
The authors used the 2D model developed by Guo et al. (2017) and their discussion of the corona current and the E-field in the presence of wind to establish a corresponding 3D model. We used three steps similar to those used in Guo et al.’s model: Peek’s formula, Kaptzov assumption, and diffusion–convection equations.
The environmental E-field gradually increases in the upward direction under an approaching thunderstorm cloud with a negative polarity. Due to its distortion by the shape of the tip, the E-field on the surface of the tip exceeds the threshold E-field, called Ecor, and a positive corona discharge is initiated at the tip of the building. Ecor is defined in Peek’s law as a constant for a certain building and a given relative atmospheric density.
Over time, the surface of the tip generates corona ions, and the number of ions can be determined by using the Kaptzov assumption such that the value of the E-field at the tip should be maintained at Ecor. To calculate the number of small positive ions created on the surface of the lightning rod according to the Kaptzov assumption, the E-field on the surface should be maintained within the range of Ecor ±2% in this model.
We referred to the diffusion–convection continuity equation coupled with the wind field, proposed by Guo and Zhang (2017), for the newly generated ions. We considered only small positive ions n+, large positive ions N+, and aerosol neutrals Na and calculated the diffusion, convection, and transformation as follows, respectively:
where t represents time, D is the coefficient of turbulent diffusion, μn+ is the mobility of small positive ions, μN+ is the mobility of large positive ions, and knN is the rate of adsorption of aerosol particles to small ions. The reference values (Qie et al., 1994; Qie, 1996; Becerra et al., 2007; Becerra, 2013) of D, μn+, μN+, and knN, are 1 m2/s, 1.5 × 10⁻⁴ m2/(V·s), 1.5 × 10⁻⁶ m2/(V·s), and 2.9 × 10⁻¹² m3/s, respectively. v is the wind field, E is the electric field, and both are vectors. The E-field E is calculated by the negative gradient of the electric potential φ:
The electric potential can be solved by transforming the Poisson equation of the electrostatic field into an over-relaxed iteration (SOR) form as follows:
where e0 is the charge of the electron, and ε0 is the permittivity of the vacuum.
The boundary conditions for the continuous equations are defined as follows: for all outside boundaries, the corona charges are set to absorption, and all differential terms are reduced to zero. The boundaries of the building are divided into two types. The first consists of points of the corona discharge, which are regarded as forming a fixed boundary. They do not participate in previous continuity equations except in the case of the wind field, and the number of small ions depends only on the Kaptzov assumption. The second boundary is obtained when the number of small ions is approximated by using the forward difference method.
Model Settings
During the formation of a negatively charged thundercloud, the thunderstorm background E-field (Eb) changes relatively slowly and can be regarded as an electrostatic field. Since the thunderstorm cloud has a large range and a high distance from the ground, the E-field near the ground can be approximated as a uniform E-field with its direction perpendicular to the ground. Thus, according to Becerra (2013) and Guo et al. (2017), it is assumed that Eb increases linearly up to 20 kV/m in 10 s and then remains constant. The simulation domain was a 500 m × 500 m × 500 m region above the ground with a signal tower in the center. We did not consider the shape of the building and other complex characteristics in the simulation but were concerned only with the characteristics of discharge at the tip because they make a major contribution to the corona discharge. The building was represented as a cube, with a length and width of 10 cm and a height of 60 m, at the center of the simulation domain. Figure 1 shows a schematic diagram of the model.
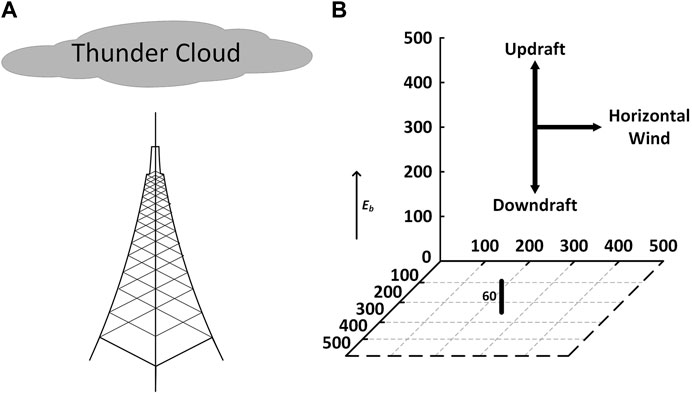
FIGURE 1. Signal tower (A) and model settings (B). All units of distance in (B) are meters.
The uniform 2D grid mesh struggles to simulate small tips in a large simulation domain for the 3D simulation of corona discharge. If the uniform mesh generation method is used on 3D simulation, it is hard to complete under the existing personal computer storage conditions. The proposed model uses variable-grid meshing to deal with this problem, where which has two advantages over the previous model. First, the 3D model can obtain specific data on the spatial parameters and compensate for the shortcomings of the 2D model, especially the values on the ground. Second, the variable-grid meshing technology can expand the simulation domain to a greater extent while simulating small tips, which makes the model more flexible and accurate than the one that uses uniform grids. The computation time required for such a large amount of data should not be ignored. We parallelized the calculation of the E-field to speed up the computation.
It is necessary to verify the calculation of the E-field of the model. We compared its result with that of the commercial software COMSOL based on a finite element simulation. To ensure the consistency of comparison, the minimum grid needed to be set to the same size for both as this mostly affects the E-field of the tip. The minimum grid in both models was 10 cm while the maximum grid in the variable-grid meshing-based model was 27.1 m. COMSOL used tetrahedrons to discretize the space, with a maximum mesh size of 20 m. A comparison of the variations in the E-field with the height above the tip is shown in Figure 2. When the environmental E-field was set to −10 kV/m, the results of COMSOL were consistent with those of the proposed model. This verifies the reliability of the 3D variable-grid meshing-based calculation of the E-field by the model.
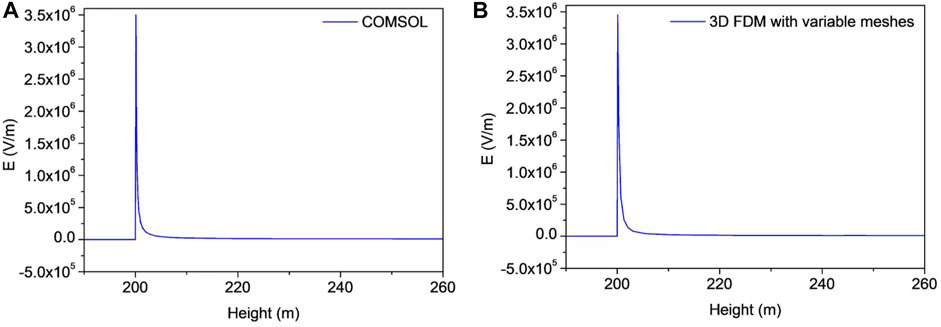
FIGURE 2. Variation in the E-field above the tip when the background E-field was −10 kV/m. (A) Result of calculation by COMSOL. (B) Result of calculation by the proposed model.
Given that the minimum grid at the tip was 10 cm, the temporal resolution needed to be less than 1,343 μs to match this spatial resolution and ensure the stability of the results of the differential form. We used a temporal resolution of 500 μs
Model Validation
We compared the proposed model with Becerra’s 2D symmetric model for corona discharge and Guo et al.’s 2D asymmetric model along two dimensions: the range of diffusion of small ions and the corona current. Figure 3 shows the distribution of small ions as calculated by the three models when the environmental E-field reached its peak value. Figures 3A,B show that the number of small ions at the tip and their range of diffusion calculated by the 3D model matched well with those of Becerra’s model. Figure 3C shows the top view of the distribution due to the advantage of the 3D simulation. Figure 3D shows the result of the 2D model. It encountered such problems as an overestimation of small ions below the tip and a smaller range of diffusion than the proposed method.
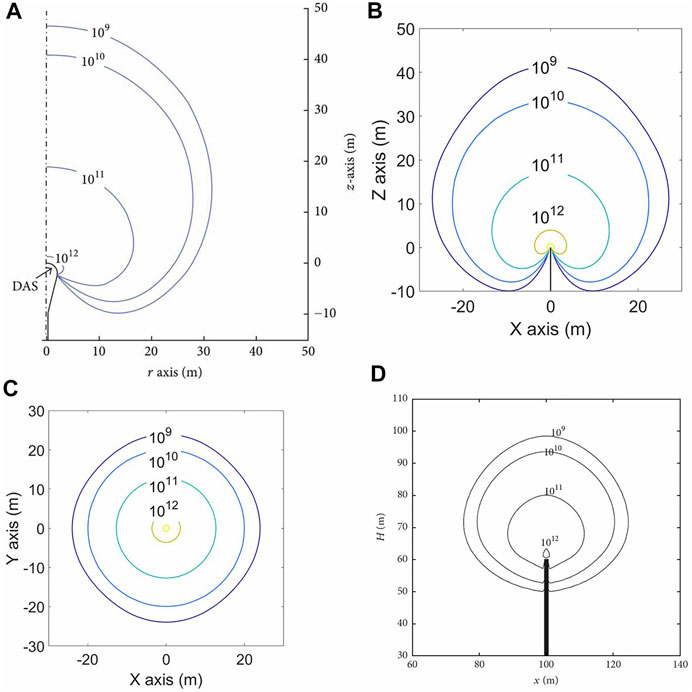
FIGURE 3. Comparison of the range of diffusion of small ions when the environmental E-field reached its peak. (A) shows the result of Becerra’s model, (B) and (C) show results of the proposed model, where directions are divided into the side view and the top view. (D) shows the result of Guo et al.‘s model.
Figure 4 shows a comparison of the relationship between the corona current and time according to the proposed model and Becerra’s model. The two models exhibited the same trend whereby the corona current and environmental E-field increased to their maximum values, after which the corona current slowly decreased while the environmental E-field remained constant. This comparison also verifies the correctness of the proposed 3D model.
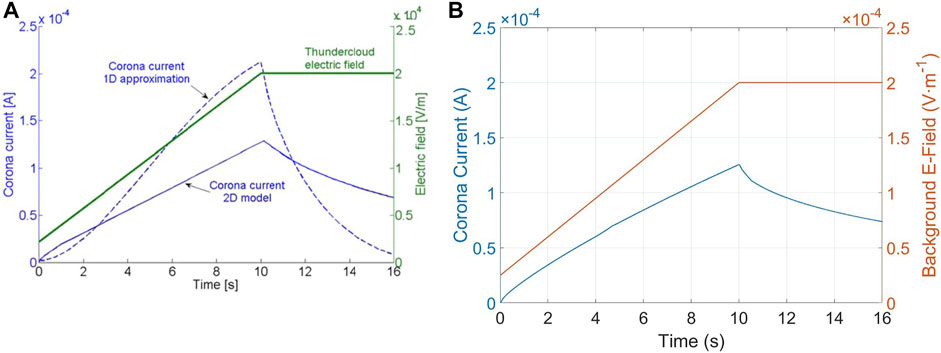
FIGURE 4. Comparison of corona currents at the tip under a certain environmental E-field obtained by using two models. (A) is the result of Becerra’s model, and (B) is the result of the proposed model.
Results
Effects of Wind on the Diffusion of Corona Charges
Due to the presence of the wind, the convective force for corona charges not only come from the E-field, but the wind also plays an important role here. Different wind conditions lead to different corona charge spatial distributions and then lead to different E-field spatial distributions. The authors discussed cases without any wind and those involving the presence of horizontal wind, updraft, and downdraft at a speed of 10 m/s. Of note is the fact that the speed of wind is one of the important factors in corona discharges which have been discussed via 2D numerical simulation shown in Guo et al. (2017). However, the aim of this study was to show the 3D numerical model has more preponderance than the 2D model in obtaining characteristics of corona charges and E-field distribution. Different wind directions lead to different sharpness of the corona charge distribution, while different speeds only lead to the different sizes of the sharpness. Therefore, the effects of wind on corona discharge were mostly focused on its direction in this study. Figure 5 shows the range of diffusion and density of the corona charges under different conditions when the E-field reached its maximum value. Because this is a 3D model, the side and top views are both provided to better represent the physical process.
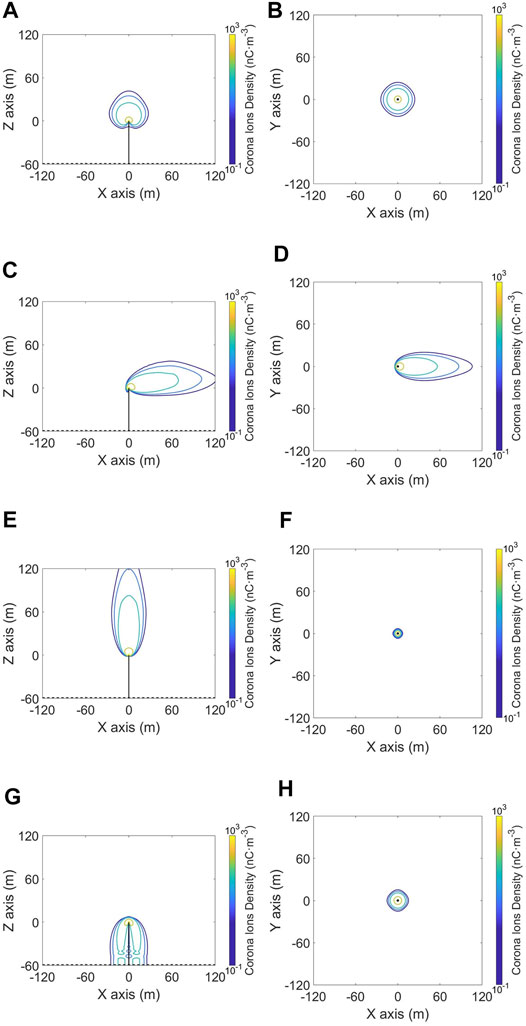
FIGURE 5. Contours of the density of corona charges produced at the tip of a 60-m rod when the thunderstorm background E-field reached its maximum value (20 kV/m). The results are given in the case of no wind (A,B), horizontal wind (C,D), updraft (E,F), and downdraft (G,H). The side views are given to the left and the top views to the right.
The first considered the maximum magnitude of corona charges at the tip, where this is also directly related to the corona current. The top charge reached its highest value of 1.59 × 10⁵ nC/m3 in the presence of horizontal wind, followed by 1.20 × 10⁵ nC/m3 in the case of the updraft, 1.19 × 10⁵ nC/m3 in case of the downdraft, and 1.18 × 10⁵ nC/m3 in the absence of wind. The horizontal wind had a greater effect on the diffusion of ions than the other conditions, and their corona currents might have increased accordingly.
We combined the side and the top views and took the range of corona charge density greater than 0.1 nC/m3 as an example. The results showed that in the absence of wind, the distribution of corona charge was symmetrical and was mainly concentrated in the range of 60 m from the tip. With the occurrence of wind, the corona charges had a strong tendency to follow its direction. The presence of wind thus changed the direction of motion of the corona charges by adding a new dynamic. The presence of the downdraft constituted a special case. The corona charges accumulated above the ground and below the tip in this case. Moreover, in the case of horizontal wind conditions, the corona charge diffusion range in the horizontal direction was larger than the others; it reached 120 m away from the tip along the horizontal wind direction (from west to east) while 60 m in the normal direction (from south to north) in this case. Therefore, the effects of wind on the diffusion of corona charges were significant. The range of diffusion could be achieved by the 3D numerical model developed in this study but could not be represented by the 2D models.
Characteristics of the E-Field Around a Building During Corona Discharges in Different Wind Conditions
The E-field around the building tip or at the ground nearby the building could be distorted by the corona charges released into the air during a thunderstorm. However, the degree and range of the E-field distortion would be affected by corona charges with different distribution characteristics in different wind conditions. Furthermore, the lightning monitoring results forecasted by using the ground E-field data in atmospheric electric field measurement early warning system would be affected. This E-field distortion around the building even affects the lightning stroking process on it. Therefore, this section will focus on analyzing the distortion characteristics of the corona charges to the environmental E-field under different wind conditions.
Figure 6 shows the distribution of the vertical component of the E-field around the tip in different conditions. The distortion of the E-field only brought by the building is also given (Figure 6A) for comparing with the corona conditions (Figures 6B–E). We found that no matter what kind of wind condition, the influence of corona charges on the environmental E-field cannot be ignored. During a thunderstorm and after the corona discharge occurred at the tip, the distortion of the building tip on the surrounding E-field was magnified by corona charges released to the air from the tip, whether it is the enhancement of the E-field above the tip or the shielding effect below the tip.
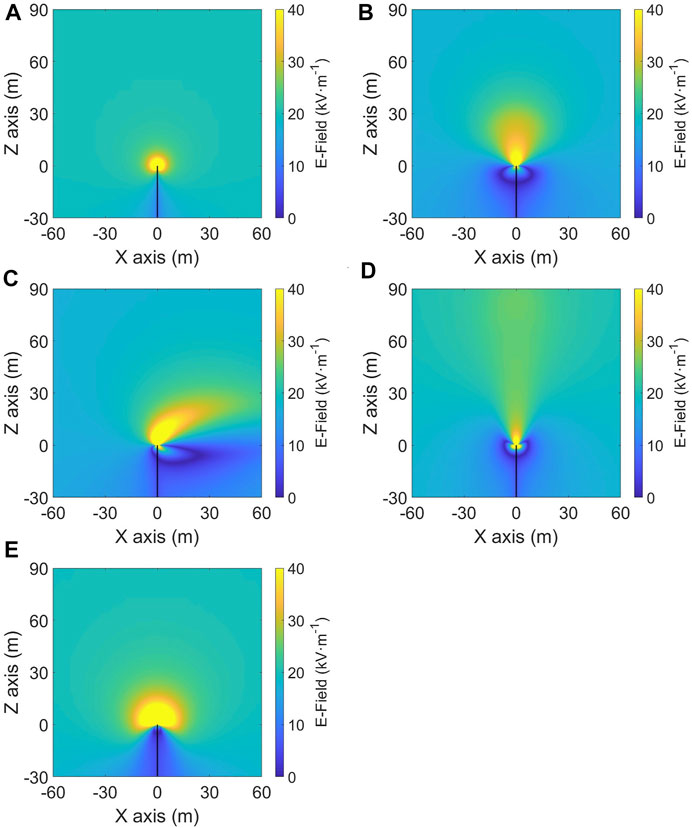
FIGURE 6. Contours of the vertical component of E-field when the thunderstorm background E-field reached its maximum value (20 kV/m). No corona discharge (A). No wind (B). Horizontal wind (C). Updraft (D). Downdraft (E).
Comparing the enhancement of corona charges on the E-field above the tip under different wind fields, it is found that in the absence of wind (shown in Figure 6B), the enhanced E-field above the tip spread roughly in a conical shape with a radius of 30 m. In the presence of horizontal wind (shown in Figure 6C), the E-field was enhanced in the upper-right direction, and its height remained constant at 30 m, but its horizontal range expanded to 60 m along the wind direction. The updraft extended the range of the enhanced E-field to 90 m above the tip (shown in Figure 6D), but the enhancement degree on the E-field was not much significant. Contrary to the case of the updraft, the range of the enhanced E-field above the tip is minimum in the downdraft (shown in Figure 6E), but the enhancement degree on the E-field was the greatest.
Comparing the shielding effect of corona charges on the E-field below the tip in different wind conditions, we found that the corona charges had a prominent shielding effect on the E-field below the tip and could even change its polarity in a small area close to the tip. Further study on the shielding effect of corona charges on the E-field below the building tip will be detailed in the following section.
E-Field Distortion Caused by Corona Charges in Different Wind Conditions
As mentioned earlier, the influence of the tip on the E-field needed to be eliminated to clarify the enhancement or shielding effect of the corona charge on it. We thus defined the coefficient of electric field distortion N as follows:
where Ecorona is the environmental E-field obtained by considering the corona corresponding to Figures 6B–E, and Eoriginal is the environmental E-field without the corona charge, as shown in Figure 6A. If N > 1, this means that the E-field was enhanced by corona discharges; if 0 < N < 1, it means that the E-field was shielded, and if N < 0, it means that the corona charges were too strong such that they prompted a negative enhancement in the E-field.
The aforementioned formula was used to draw Figure 7, which shows the distribution of the coefficient of distortion of the E-field, owing to different wind conditions. Table 1 also provides the relevant specific values. Red in the graphs below indicates an enhancement in the E-field (N > 1). The darker the color, the greater is the enhancement. Blue indicates the shielding of the E-field (N < 1); the darker the color, the weaker is the E-field. Gray means no distortion (N = 1), where the original environmental E-field persisted. It should be noted that the top view could not be obtained by the 2D model. It was, however, obtained by the proposed model and can provide content for supplementary discussions of the impact of distortion in the E-field on the ground.
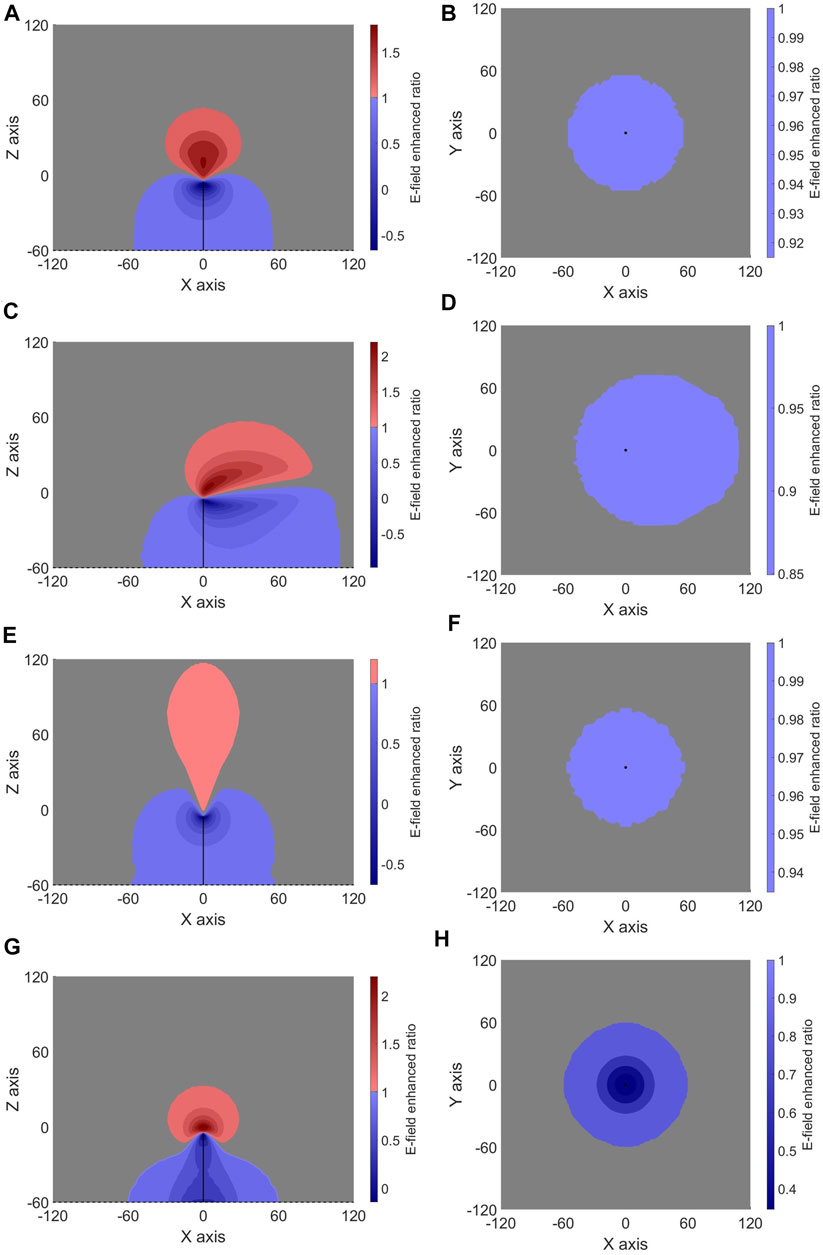
FIGURE 7. Contours of distortion caused by corona charges in the E-field (N) around the building tip when the thunderstorm background E-field reached its maximum value (20 kV/m). No wind (A,B). Horizontal wind (C,D). Updraft (E,F). Downdraft (G,H). The left side shows the side views, and the right side shows the top view.
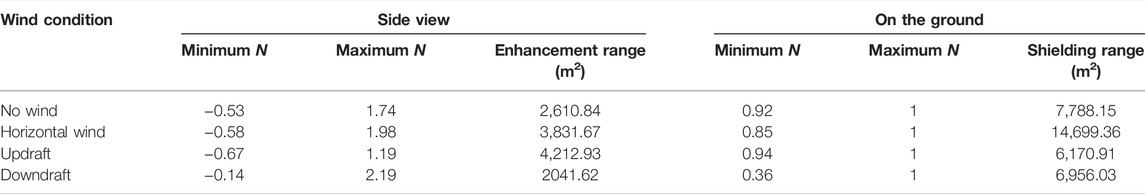
TABLE 1. Properties of distortion caused by corona charges in the E-field (N and the range of influence) under different wind conditions when the background E-field reached its maximum value.
Figure 7 and Table 1 both show that the enhanced E-field above the tip and shielded it below, but the degrees and ranges of these enhancements and shielding effects were different. In side views, downdraft has the greatest enhancement on the environmental E-field, updraft is the smallest, and the reverse E-field (Minimum N) below the tip caused by different wind conditions kept the opposite trend. Regarding the enhancement range, updraft has the largest range that reaches to 4,213 m2, while downdraft was the smallest only, reaching about 2042 m2.
As for the shielding effect on the environmental E-field at the ground level, we can see these shielding degrees were quite different in different wind conditions. Corona charges have the greatest shielding effect at the ground level in N = 0.36 near the bottom of the building in the downdraft, while having a weak shielding effect in other wind conditions relatively. About the shielding range on the ground level, in a horizontal wind condition, it was the largest about 14,699 m2 and nearly twice the size of others, while in the updraft condition, it was the smallest about 6,171 m2.
Consequently, the E-field around the building tip or at the ground nearby the building was distorted in different degrees and ranges by corona charges from the tip with different distribution characteristics in different wind conditions, especially in a downdraft and in the horizontal wind during thunderstorms. This might be one of the reasons why for a certain building with the same lightning current, the strike distances were often different in observations (Rakov et al., 2018; Qi et al., 2019; Jiang et al., 2020). Therefore, in the process of leader initiation simulations, the influence of the corona discharge should not be ignored, while the existing leader initiation simulations (Becerra and Cooray, 2006; Cooray et al., 2014; Tan et al., 2016; Guo et al., 2019) ignored their effects mostly. In addition, when correcting the measurement results of the ground atmospheric E-field and using its data as lightning warning studies (D'Alessandro, 2003; Aranguren et al., 2009; Ferro et al., 2012), we not only consider the influence of the building itself to the atmospheric E-field but also take the shielding effect of the corona charges and different wind fields to the ground E-field into consideration.
Conclusions and Discussion
The influence of corona charges generated at the tip of a building on the grounded E-field during corona discharge and the effects of this on the subsequent lightning strike have long been a subject of interest in research. The influence of wind on corona discharge has been discussed numerically, but few studies have considered the influence of the direction of the wind in this context by using a 3D model. This study examined the influence of a specific wind field on corona discharge in the presence of thunderstorm clouds. The authors considered the density of the corona charges, the environmental E-field, and the distortion in it by establishing a 3D numerical model. The following conclusions can be drawn as follows:
1) The 3D model established here has advantages over the 2D model in terms of the acquisition of the relevant parameters, such as the spatial distribution characteristics of corona charges and the environmental E-field.
2) The presence of the wind field (horizontal wind, updraft, and downdraft with 10 m/s) increased the density of corona charges at the tip. The horizontal wind had the greatest effect, followed by the downdraft and updraft.
3) The corona charges distorted the E-field around the tip. The maximum enhancement in the E-field above the tip was in the case of a downdraft and was 2.19 times its normal value in the case of no corona, followed by that owing to the horizontal wind. The minimum enhancement was obtained by the updraft, that of only 1.19 times. On the contrary, the spatial range of the enhancement was the largest in the case of the updraft and the smallest in the case of the downdraft. Moreover, the corona charges had a prominent shielding effect on the spatial E-field below the tip and could even change its polarity in a small area close to the tip.
4) The corona discharge had a non-negligible shielding effect on the E-field on the ground. The shielding effect was the strongest in the case of a downdraft, which reduced the E-field to only 0.36 times its value without the corona. In the case of an updraft, the corona discharge had the weakest ability to shield the E-field on the ground. The range of shielding on the ground was the largest in the case of horizontal wind, up to 14,699.36 m2, followed by the cases without wind, a downdraft, and an updraft (6,170.91 m2).
The authors here developed a 3D model of corona discharge that provided some useful results for certain wind conditions. However, the subsequent lightning process also needs to be discussed in depth. Furthermore, we will examine corona discharges over multiple buildings and buildings with complex shapes in our future work in the area.
Data Availability Statement
The original contributions presented in the study are included in the article/Supplementary Material; further inquiries can be directed to the corresponding author.
Author Contributions
Original ideas and overall planning, XG. Model establishment and coding, ZJ. The original draft, XG and ZJ. All authors contributed to revising the manuscript and have agreed to its publication.
Funding
Natural Science Foundation of Jiangsu Province (BK20190147), Natural Science Fundamental Research Project of Jiangsu Colleges and Universities (19KJB170025), the Open Grants of the State Key Laboratory of Severe Weather (2021LASW-B04), and the Postgraduate Practice Innovation Project of Wuxi Graduate School of NUIST (WXCX202102).
Conflict of Interest
The authors declare that the research was conducted in the absence of any commercial or financial relationships that could be construed as a potential conflict of interest.
Publisher’s Note
All claims expressed in this article are solely those of the authors and do not necessarily represent those of their affiliated organizations, or those of the publisher, the editors, and the reviewers. Any product that may be evaluated in this article, or claim that may be made by its manufacturer, is not guaranteed or endorsed by the publisher.
References
Aleksandrov, N. L., Bazelyan, E. M., Carpenter, R. B., Drabkin, M. M., and Raizer, Y. P. (2001). The Effect of Coronae on Leader Initiation and Development under Thunderstorm Conditions and in Long Air Gaps. J. Phys. D. Appl. Phys. 34 (22), 3256–3266. doi:10.1088/0022-3727/34/22/309
Aleksandrov, N. L., Bazelyan, E. M., Drabkin, M. M., Carpenter, R. B., and Raizer, Y. P. (2002). Corona Discharge at the Tip of a Tall Object in the Electric Field of a Thundercloud. Plasma Phys. Rep. 28 (11), 953–964. doi:10.1134/1.1520289
Aleksandrov, N. L., Bazelyan, E. M., and Raizer, Y. P. (2005b). Initiation and Development of First Lightning Leader: The Effects of Coronae and Position of Lightning Origin. Atmos. Res. 76 (1-4), 307–329. doi:10.1016/j.atmosres.2004.11.007
Aleksandrov, N. L., Bazelyan, E. M., and Raizer, Y. P. (2005a). The Effect of a Corona Discharge on a Lightning Attachment. Plasma Phys. Rep. 31 (1), 75–91. doi:10.1134/1.1856709
Aranguren, D., Montanya, J., Solá, G., March, V., Romero, D., and Torres, H. (2009). On the Lightning Hazard Warning Using Electrostatic Field: Analysis of Summer Thunderstorms in Spain. J. Electrost. 67 (2-3), 507–512. doi:10.1016/j.elstat.2009.01.023
Becerra, M., and Cooray, V. (2006). A Simplified Physical Model to Determine the Lightning Upward Connecting Leader Inception. IEEE Trans. Power Deliv. 21 (2), 897–908. doi:10.1109/TPWRD.2005.859290
Becerra, M., Cooray, V., Soula, S., and Chauzy, S. (2007). Effect of the Space Charge Layer Created by Corona at Ground Level on the Inception of Upward Lightning Leaders from Tall Towers. J. Geophys. Res. 112 (D12), 1103–1118. doi:10.1029/2006JD008308
Becerra, M. (2013). Glow Corona Generation and Streamer Inception at the Tip of Grounded Objects during Thunderstorms: Revisited. J. Phys. D. Appl. Phys. 46 (13), 135205. doi:10.1088/0022-3727/46/13/135205
Chauzy, S., and Raizonville, P. (1982). Space Charge Layers Created by Coronae at Ground Level below Thunderclouds: Measurements and Modeling. J. Geophys. Res. Oceans 87 (C4), 3143–3148. doi:10.1029/JC087iC04p03143
Chen, S. S. (2018). Distribution of Corona Space Charge Generated from the UHVDC Overhead Transmission Line during a Thunderstorm. Master Degree Thesis. Wuhan: Huazhong University of Science & Technology.
Cooray, V., Kumar, U., Rachidi, F., and Nucci, C. A. (2014). On the Possible Variation of the Lightning Striking Distance as Assumed in the IEC Lightning Protection Standard as a Function of Structure Height. Electr. Power Syst. Res. 113, 79–87. doi:10.1109/ICLP.2012.634430510.1016/j.epsr.2014.03.017
D'Alessandro, F. (2003). The Use of 'Field Intensification Factors' in Calculations for Lightning Protection of Structures. J. Electrost. 58 (1-2), 17–43. doi:10.1016/s0304-3886(02)00178-x
Ferro, M. A. D. S., Yamasaki, J., Pimentel, D. R. D. M., NaccaratoSaba, K. P., and Saba, M. M. F. (2012). Lightning Risk Warnings Based on Atmospheric Electric Field Measurements in Brazil. J. Aerosp. Technol. Manag. 3 (3), 301–310. doi:10.5028/jatm.2011.03032511
Guo, X., and Zhang, Q. (2017). Effects of Geometrical Parameters of Two Height-Unequal Adjacent Objects on Corona Discharges from Their Tips during a Thunderstorm. Atmos. Res. 190, 113–120. doi:10.1016/j.atmosres.2017.02.010
Guo, X., Zhang, Q., and Zhang, J. (2017). Improvement of Corona Discharge Model and its Application on Simulating Corona Discharge in the Presence of Wind. Math. Probl. Eng. 2017, 1–10. doi:10.1155/2017/9853439
Guo, Z., Li, Q., Bretas, A., and Rakov, V. A. (2019). A Simplified Physical Model of Negative Leader in Long Sparks. Electr. Power Syst. Res. 176, 105955. doi:10.1016/j.epsr.2019.105955
Jiang, R., Lyu, W., Wu, B., Qi, Q., Ma, Y., Su, Z., et al. (2020). Simulation of Cloud-To-Ground Lightning Strikes to Structures Based on an Improved Stochastic Lightning Model. J. Atmos. Solar-Terrestrial Phys. 203 (2), 105274. doi:10.1016/j.jastp.2020.105274
Lu, X., Zhang, Y. J., Lu, W. T., and Wang, D. H. (2010). Networking Observation and Data Analysis of Corona Current Near Ground. Meteorol. Sci. Technol. 38, 746–751. doi:10.19517/j.1671-6345.2010.06.017
Qi, Q., Wu, S., Su, Z., Lyu, W., Chen, L., and Zhang, Y. (2019). Shielding Effect of Surrounding Buildings on the Lightning-Generated Vertical Electric Field at the Top of a Tall Building. IEEE Trans. Electromagn. Compat. 61, 174–182. doi:10.1109/TEMC.2018.2790346
Qie, X. S. (1996). Numerical Calculation of Evolution of Corona Ions Produced from the Ground under Thunderstorm. Acta Geophys. Sin. 39 (s1), 43–51.
Qie, X., Soula, S., and Chauzy, S. (1994). Influence of Ion Attachment on the Vertical Distribution of the Electric Field and Charge Density below a Thunderstorm. Ann. Geophys. 12 (12), 1218–1228. doi:10.1007/s00585-994-1218-6
Rakov, V. A., Mareev, E. A., Tran, M. D., Zhu, Y., Bogatov, N. A., Kostinskiy, A. Y., et al. (2018). High-Speed Optical Imaging of Lightning and Sparks: Some Recent Results. IEEJ Trans. PE 138, 321–326. doi:10.1541/ieejpes.138.321
Soula, S. (1994). Transfer of Electrical Space Charge from Corona between Ground and Thundercloud: Measurements and Modeling. J. Geophys. Res. Atmos. 99 (D5), 10759–10765. doi:10.1029/93JD02596
Standler, R. B., and Winn, W. P. (1979). Effects of Coronae on Electric Fields beneath Thunderstorms. Q. J. Roy. Meteor. Soc. 105, 285–302. doi:10.1002/qj.49710544319
Tan, Y. B., Chen, C., Zhou, J. C., Zhou, B. W., Zhang, D. D., and Guo, X. F. (2016). A Parameterization Scheme for Upward Lightning in the Cloud Model and a Discussion of the Initial Favorable Environmental Characteristics in the Cloud. Sci. China Earth Sci. 59 (7), 1440–1453. doi:10.1007/s11430-016-5309-5
Yanhui, W., Xiangpeng, F., Tuo, W., Yingchang, M., Yali, L., and Guo, Z. (2021). Characteristics of Regular Pulse Bursts Generated from Lightning Discharges. Front. Environ. Sci. 9, 799115. doi:10.3389/fenvs.2021.799115
Zhang, Y. J., Lu, W. T., Chen, S. D., Zheng, D., Zhang, Y., Yan, X., et al. (2016). A Review of Lightning Observation Experiments during the Last Ten Years in Guangdong. Acta Geophys. Sin. 74 (5), 655–671. doi:10.11676/qxxb2016.051
Keywords: corona discharge, wind direction, 3D numerical simulation, charge distribution, electric field distribution, shielding effect
Citation: Guo X, Ji Z, Gao Y, Ding J and Zhang L (2022) 3D Corona Discharge Model and Its Use in the Presence of Wind During a Thunderstorm. Front. Environ. Sci. 10:946020. doi: 10.3389/fenvs.2022.946020
Received: 17 May 2022; Accepted: 26 May 2022;
Published: 05 July 2022.
Edited by:
Lijuan Shen, University of Toronto, CanadaReviewed by:
Jinbo Zhang, Jiangsu University of Science and Technology, ChinaYi Yang, Hebei Normal University, China
Copyright © 2022 Guo, Ji, Gao, Ding and Zhang. This is an open-access article distributed under the terms of the Creative Commons Attribution License (CC BY). The use, distribution or reproduction in other forums is permitted, provided the original author(s) and the copyright owner(s) are credited and that the original publication in this journal is cited, in accordance with accepted academic practice. No use, distribution or reproduction is permitted which does not comply with these terms.
*Correspondence: Xiufeng Guo, Z3VveGZfODhAMTYzLmNvbQ==