Development of a water resource allocation model based on the dynamic exploitable amount of groundwater and its application in the Jinghe County, Xinjiang
- State Key Laboratory of Simulation and Regulation of Water Cycle in River Basin, China Institute of Water Resources and Hydropower Research, Beijing, China
An exploitable amount of groundwater in arid regions is related to changes in water resource utilization patterns, and the traditional water resource allocation model assumes a constant exploitable amount of groundwater. In this study, a water resource allocation model consisting of a water resource optimal allocation module, an exploitable amount analysis module, and a mutual feedback iterative module connecting the abovementioned two modules is established based on the dynamic exploitable amount of groundwater. The proposed model is applied to Jinghe County, Xinjiang, which is one of the most arid regions in the world. The results show that the actual exploitable amount of groundwater in 2035 will be 181.54 million m³ when changes in the exploitable amount of groundwater in response to changes in the water resources utilization patterns are considered, which is 43.99 million m³ lower than the current amount, and the groundwater supply will be 167.82 million m³. However, the groundwater supply based on the current exploitable amount of groundwater (225.53 million m3) will be 188.29 million m3, which is 6.75 million m3 higher than the actual exploitable amount of groundwater and thus may lead to groundwater overdraft. This is mainly attributed to the reduction in the exploitable amount of groundwater with the reduction in farmland, and it is estimated that the exploitable amount of groundwater would be decreased by about 110,000 m3 with the reduction of 1 km2 farmland. The results of this study underline the need to consider changes in the exploitable amount of groundwater in the allocation and management of water resources in arid regions, and the model developed in this study can provide an effective tool for rational allocation of water resources in arid regions.
1 Introduction
It is vital to balance water supply and demand for water resource management in arid regions where water resources are very limited (Singh, 2014; Wu et al., 2016). As precipitation is limited or even absent in such regions, groundwater is considered to be the most common and reliable water source because of its easy availability and low cost (Haque, 2018; Bloomfield et al., 2019; Cuthbert et al., 2019). However, many problems are likely to be encountered for long-term over-exploitation of groundwater, such as groundwater recession, land subsidence, and groundwater contamination (Park and Aral, 2004; Rahmati et al., 2019). A reduction in stream flow that is hydraulically connected to groundwater may impact the aquatic and riparian ecosystems and consequently lead to a range of ecological and environmental problems (Huang et al., 2018; Flores et al., 2020). Over recent years, rapid economic and social development, urbanization, over-exploitation of water resources, and climate change have placed additional stress on water resources (De Fraiture and Wichelns, 2010; Sarpong et al., 2020) and significantly changed the relationship between recharge and discharge of groundwater, making it more difficult for groundwater utilization and protection (Ghimire et al., 2021). Thus, many concerns have been raised about how to protect groundwater and ensure the safety of water supply.
In regions that rely heavily on groundwater for water supply, it is essential to optimize the allocation of surface water and groundwater in order to utilize the limited water resources more effectively and efficiently (Liu et al., 2020; Sampathkumar et al., 2021). The exploitable amount of groundwater is an important boundary condition for water resource allocation (Kun et al., 2014), and thus it is vital for rational exploitation of groundwater and optimal allocation of water resources (Liu et al., 2008; Haiyuan et al., 2013). In general, the exploitable amount of groundwater is assumed to be constant in different level years for the sake of simplicity in water resource allocation models because of the large storage capacity and the multi-year regulation of the aquifer (Li et al., 2006; Xiang et al., 2016; Yang et al., 2016). However, this assumption may not be valid in real-world scenarios because surface water and groundwater interact dynamically (Frey et al., 2021), and the exploitable amount of groundwater varies substantially with many factors such as the underlying surface conditions and water resource utilization practices (Shekhar and Pandey 2015; Wang et al., 2021). In arid regions where there is limited natural recharge and groundwater is recharged mainly by surface water (Wu et al., 2021; Zhang et al., 2021), water resource utilization patterns may have greater impacts on the exploitable amount of groundwater (Wang et al., 2021). For instance, groundwater recharge can be affected by changes in irrigation practices (e.g., implementation of water-saving irrigation), ecological water replenishment of rivers and lakes, reconstruction of water supply and drainage networks, maintenance and reinforcement of canal systems, etc. (Jayakumar and Lee 2016; Wang et al., 2016; Wakode et al., 2018; Xie et al., 2019). However, although the dynamic changes of the exploitable amount of groundwater are taken into account in the joint allocation of surface and subsurface water (Liu, 2007; Haiyuan et al., 2013; Afshar et al., 2021), little is known about the causes and effects of such changes.
The Xinjiang Uygur Autonomous Region of China (Xinjiang for short) is one of the driest regions globally, and the limited water sources make it difficult to coordinate economic development and ecological sustainability. It can be said that water is the most critical strategic resource in Xinjiang. Because of the ecological degradation resulting from irrational resources of water resources in past years, groundwater exploitation is now strictly controlled to ensure the ecological safety of the region. Many attempts have been made to reduce the demand for water resources by reducing cultivated land and divert water from other sources instead of groundwater. The water resource utilization pattern is changing, which may lead to changes in the exploitable amount of groundwater. Thus, it is no longer appropriate to use the average exploitable amount of groundwater as the constraint of groundwater supply in the future.
In this study, a water resource allocation model is established based on the dynamic exploitable amount of groundwater in response to changes in water resource utilization pattern. The model includes the water resource optimal allocation module and the exploitable amount analysis module, and they help realize the interaction through the mutual feedback iterative module. A case study is performed in the Jinghe County, Xinjiang, China, where there are strict requirements on river and lake ecological protection. The model is used to calculate the exploitable amount of groundwater and the optimal water resource allocation scheme in different level years in the future. The influencing factors of the exploitable amount of groundwater and the inflow of water from the river to the lake are identified and quantified. This study may provide technical support for rational allocation of regional water resources.
2 Materials and methods
2.1 Model framework
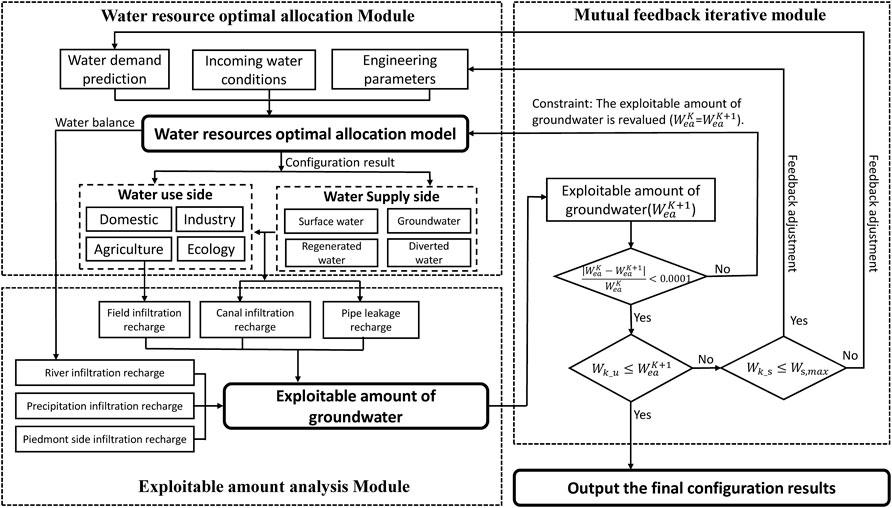
The proposed water resource allocation model based on the dynamic exploitable amount of groundwater consists of three modules, namely, the water resource optimal allocation (WROA) module, mutual feedback iterative (MFI) module, and the exploitable amount analysis (EAA) module. The exploitable amount of groundwater derived from the EAA module is input into the WROA module and repeatedly checked and adjusted by the MFI module. In this way, the three modules are coupled to achieve optimal allocation of water resources in response to changes in the exploitable amount of groundwater. The framework of the proposed model is shown in Figure 1.
2.2 Model construction
2.2.1 Water resource optimal allocation module
The WROA module is based on water balance in both natural and artificial water cycles using administrative districts as the calculation unit. The objective of the module is to minimize water shortage and water loss, in which groundwater supply is constrained by the exploitable amount of groundwater determined in the MFI module, and it is calculated at a monthly time step using Windows GAMS2.5 software developed by the World Bank and the United States General Corporation. First, important nodes (e.g., water conservancy projects, calculation units, and channel intersections) in the planning year are set according to the water resource utilization practices, which are connected through transmission and drainage lines to form a network system. Second, water demand and hydrological data for each calculation unit in different scenarios and planning years are input. Third, the objective functions, constraints, equilibrium equations, and initial parameters of the model are set, where the initial exploitable amount of groundwater is set to the multi-year average of recent 15–20 years. Finally, the monthly optimal allocation of water resources is obtained for each calculation unit in a given planning year by optimization calculation.
(1) Objective function
where fi(x), i = 1,…,3 is the objective function, in which f1(x) is the objective function for water loss of wetlands and lakes, f2(x) is the objective function for water shortage, and f3(x) is the objective function for water loss of reservoirs; and wi is the weight of objective i, which is used to indicate the priority of different objectives.
where
where
where
(2) Constraints
where
(3) Water balance equations
Reservoirs:
Nodes:
Calculation units:
where
2.2.2 Exploitable amount analysis module
The EAA module is used to determine the exploitable amount of groundwater by the groundwater exploitation coefficient method, in which groundwater recharges from different sources, including rainfall infiltration recharge, groundwater lateral recharge, river infiltration recharge, pipe leakage, canal infiltration, and field infiltration, are calculated using water resource allocation obtained in the WROA module as the input. The equation of the groundwater exploitation coefficient is described as follows:
The general equation of groundwater recharge:
The equation of groundwater lateral recharge:
where
2.2.3 Mutual feedback iterative module
The MFI module is used to determine whether or not the exploitable amount of groundwater output by the EAA module should be updated based on the error, which is fed back to the WROA module as a constraint. Once the error is acceptable, the next step is to determine whether there exist over-exploitation of groundwater and under-utilization of water supply capacity. The water demands and water resource utilization practices would be adjusted if necessary until all requirements are met. The feedback and iterative calculation between the WROA and EAA modules make it possible to obtain the optimal water resource allocation and the dynamic exploitable amount of groundwater.
1) Error of the exploitable amount of groundwater
where K is the number of iterations, K = 1,2,…,n and
2) Conditions for water supply to satisfy the availability constraint
where
2.3 Study area and data
2.3.1 Study area
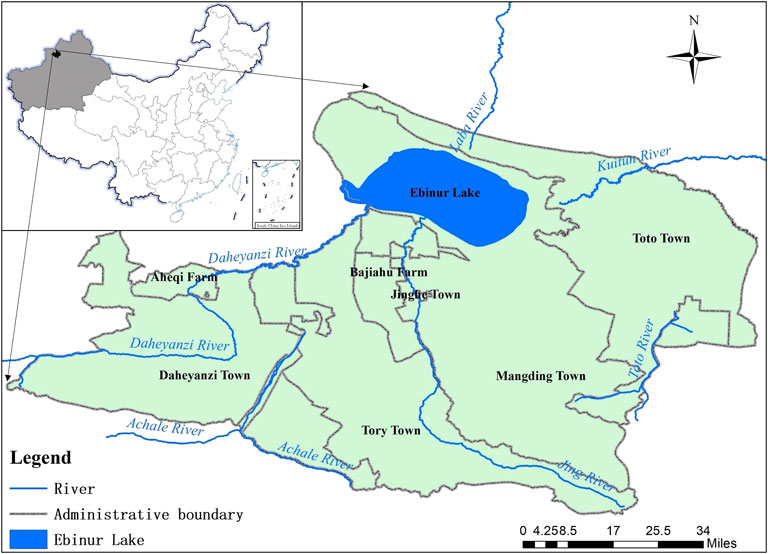
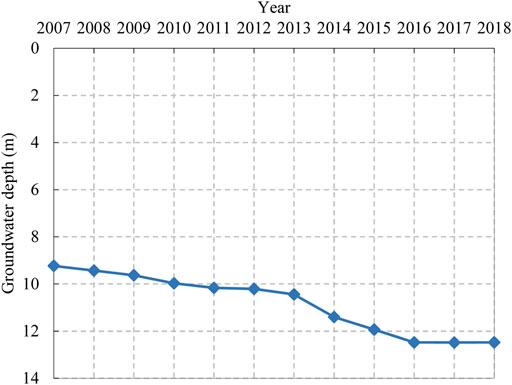
The Jinghe County (44°02′–45°10′N, 81°46′–83°51′E; Figure 2) is located in the northwest of Xinjiang, China, with a total area of 10,559 km2. The county is known as a traffic hub connecting the economic belt of the northern slope of Tianshan Mountain and a major town on the northern route of the ancient “Silk Road”. The annual average amount of water resources is 9.4 billion m3, the annual average precipitation is 243.8 mm, the average evaporation of the water surface is 1,650.3 mm, and the drought index is as high as 6.77. As surface water is lacking in the region, groundwater is used as the main source of water for various purposes. In 2018, the groundwater supply was 312 million m3, accounting for 50.6% of the total water supply. Agriculture is the largest local water user, and agricultural irrigation accounts for 94% of the total water consumption, 96% of which is derived from groundwater supply. Due to the large-scale exploitation and utilization of groundwater, the groundwater level declines continuously, and the groundwater level is decreased by about 3.24 m from 2007 to 2018 (Figure 3). Ebinur Lake, the largest saline lake of Xinjiang, is the rail lake of the Jing River. This region, which is one of the main sources of salt dust in Central Asia (Liu et al., 2015), plays a critical role in the climate and ecological system of Xinjiang and Central Asia (Abuduwaili et al., 2010; Liu et al., 2011). The rapid social and economic development of Jinghe County leads to an increase in the water intake from the Jing River and a decrease in the inflow from the Jing River to Ebinur Lake and consequently the shrinking of the lake area. In the 2010s, the area of Ebinur Lake was only 1/3 of that in the 1950s. Wetland desertification and vegetation degradation are also observed. These ecological issues have become of particular concern to the local government (Zhang et al., 2010).
Water resources play a crucial role in sustainable development of this area. In order to prevent groundwater recession and ecological degradation, the local government determines to accelerate the reduction of farmland, optimize the planting structure and industrial layout, and adjust the water resource allocation patterns. Given the potential impacts of these measures on the exploitable amount of groundwater, there is a need to better understand how to explore groundwater in a safer and more efficient manner for the Jinghe County.
2.3.2 Data
The socio-economic data were collected from the Jinghe County Statistical Yearbook; the water supply data were collected from the Jinghe County Water Resources Bulletin; and the long-series runoff data, engineering parameters, and other hydrological data were collected from the Jinghe County Water Resources Bureau. Atmospheric precipitation infiltration recharge coefficient, river infiltration recharge coefficient, canal leakage recharge coefficient, and field infiltration recharge coefficient in the EAA module were obtained from the experiment of Dong and Deng (2005).
2.3.3 Model parameter settings
According to the generalization method of water resource allocation (Wei and Wang, 2007), the status quo, water conservancy project plans, and water resource allocation practices in the Jinghe County, the study area is divided into three water resource regions, eight calculation units, three reservoir nodes, 12 county- or district-level water plants, six groundwater sources, one node for water transfer, three basin control sections, and 22 water diversion and catchment nodes, which is schematically shown in Figure 4. The year of 2018 is taken as the current level year (base year), and the years of 2025, 2030, and 2035 are taken as the planning level years. The monthly runoff data for the period 1956–2016 are used for reservoirs and rivers.
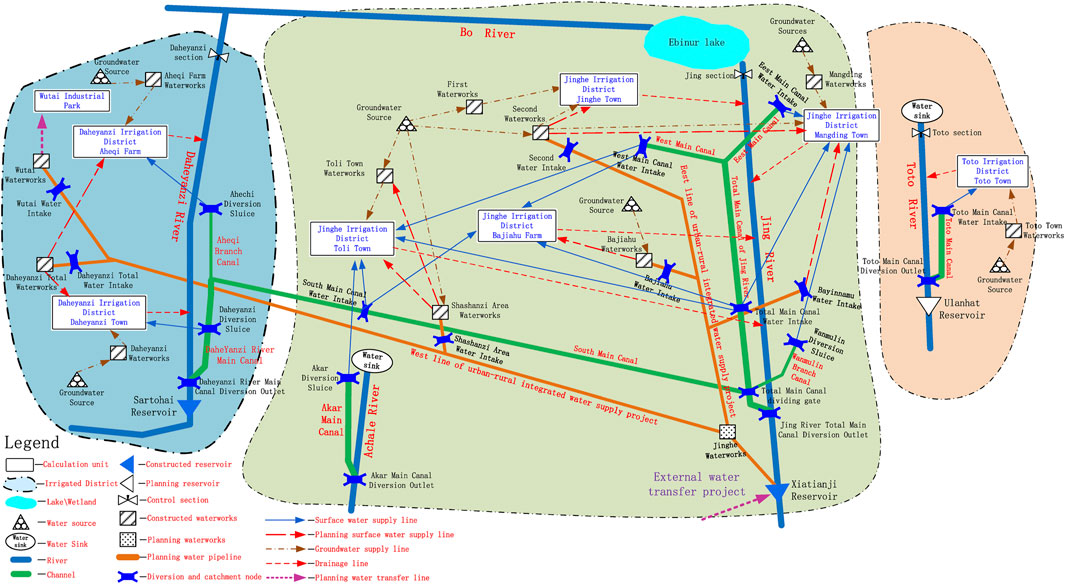
FIGURE 4. Status quo, water conservancy project plans, and water resource allocation practices in Jinghe County.
2.3.4 Water demand schemes
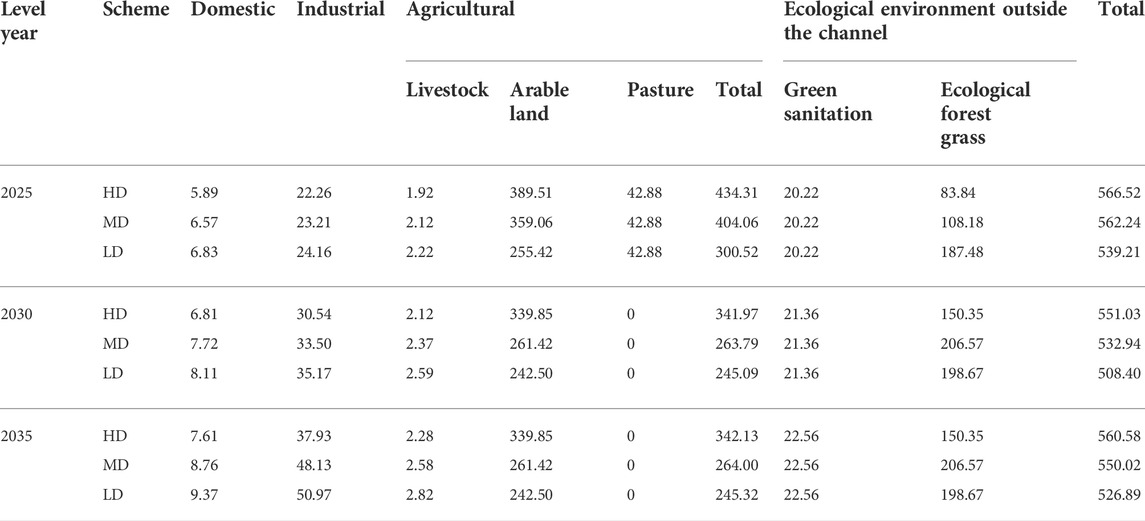
In this study, two socio-economic developmental scenarios (high and moderate) are considered based on the National Economic and Social Development of the Jinghe County. These two scenarios differ in terms of socio-economic growth rates, including urbanization rate (55.8 and 50.5%), population growth rate (3.9 and 2.5%), and growth rate of industrial value added (8.4 and 7.8%). Three farmland reduction scenarios are considered according to the ratio of farmland reduction, and two water saving scenarios (intensive and moderate) are considered based on the improvement of future water use efficiency. The combination of these three scenarios yields three schemes of high water demand (HD), medium water demand (MD), and low water demand (LD) (Table 1). The future water demands of different sectors are obtained using the index quota method (Table 2).
3 Results
3.1 Result comparison of three schemes
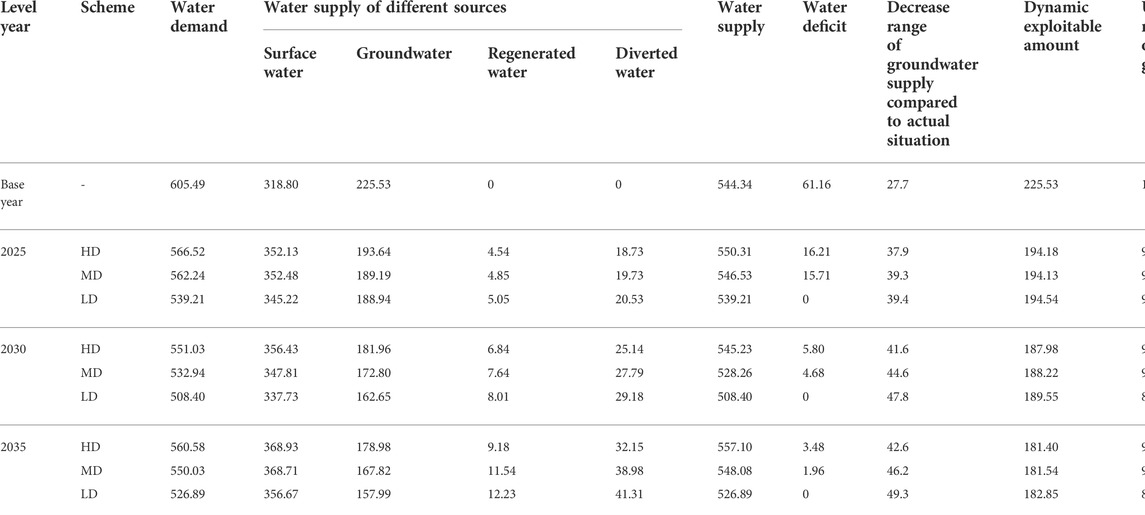
The water resource allocation for each water demand scenario in 2025, 2030, and 2035 is determined using the proposed model based on the dynamic exploitable amount of groundwater (hereafter referred to as the dynamic scenario). Table 3 shows that in 2035, the total water supply for Scheme HD is 557 million m³, 32.1% of which is supplied by groundwater. Groundwater supply proportion is decreased by 9.3% compared to that of the base year (41.4%), with a shortage of 3.48 million m³. The total water supply for Scheme MD is 548 million m³, 30.6% of which is supplied by groundwater, and it is decreased by10.8% compared to that of the base year, with a shortage of 1.95 million m³. The total water supply for Scheme LD is 527 million m³, 30.0% of which is supplied by groundwater, and it is decreased by 11.4% compared to that of the base year, achieving a balanced water supply and demand.
The comparison of the three schemes reveals that Scheme HD has no industrial adjustment, large water demand, and heavy water resource pressure in the future. Scheme LD has a large proportion of farmland reduction that may inhibit agricultural development and undermine food security. Compared with Scheme HD and Scheme LD, the water demand to forecast Scheme MD is fully connected with the planning indicators of national economic development and moderately related to farmland reduction. The replacement of local water sources is realized by increasing the use of regenerated water and introducing a moderate amount of diverted water. Groundwater is no longer over-exploited, leading to a good balance between water supply and demand. The degree of water shortage is affordable for the planned development of industrialization and urbanization of the county and has only a moderate impact on agriculture that is the dominant economic sector of the county. Therefore, Scheme MD is recommended for water resource allocation.
3.2 Water resource allocation results of the recommended scheme
Table 3 shows that water demand in the base year is 605.49 million m³, and the total water supply is 544.34 million m³, 58.6 and 41.4% of which are from local surface water and groundwater, respectively. No regenerated water or diverted water is used. By 2025, the total water supply will be 54.653 million m³, 60.9, 34.6, 0.9, and 3.6% of which are local surface water, groundwater, regenerated water, and diverted water supply, respectively. By 2030, the total water supply will be 528.26 million m³, 60.6, 32.7, 1.4, and 5.3% of which are local surface water, groundwater, regenerated water, and diverted water supply, respectively. By 2035, the total water supply will be 548.08 million m³, 62.4, 31.8, 2.2, and 7.4% of which are local surface water, groundwater, regenerated water, and diverted water supply, respectively. Thus, there will be a significant increase in the use of regenerated water and diverted water in the future. No significant increase is observed in local surface water supply due to the decrease in future water demand. Regenerated and diverted water are mainly used to replace groundwater, which ensures no over-exploitation of groundwater and complementary utilization of multiple water sources.
3.3 Groundwater utilization results of the recommended scheme
Table 3 shows that the groundwater supply under the recommended scheme is 189.19, 172.80 , and 167.82 million m³ in 2025, 2030, and 2035, respectively, which decreased by 39, 45, and 46% compared with the actual situation, and the utilization rate of groundwater development is 97.5, 91.8, and 92.4% respectively, which meet Jinghe County’s policy of groundwater protection and controlled exploitation of groundwater.
At the same time, changes in water resource development and utilization patterns have an impact on the exploitable amount of groundwater in the study area. After iterative adjustment, the exploitable amount of groundwater under the recommended scheme is 194.13, 188.22, and 181.54 million m³ in 2025, 2030, and 2035, respectively. In order to explore the sources that affect the exploitable amount of groundwater, further analysis and discussion will follow.
4 Discussion
4.1 Comparison between the dynamic scenario and constant scenario
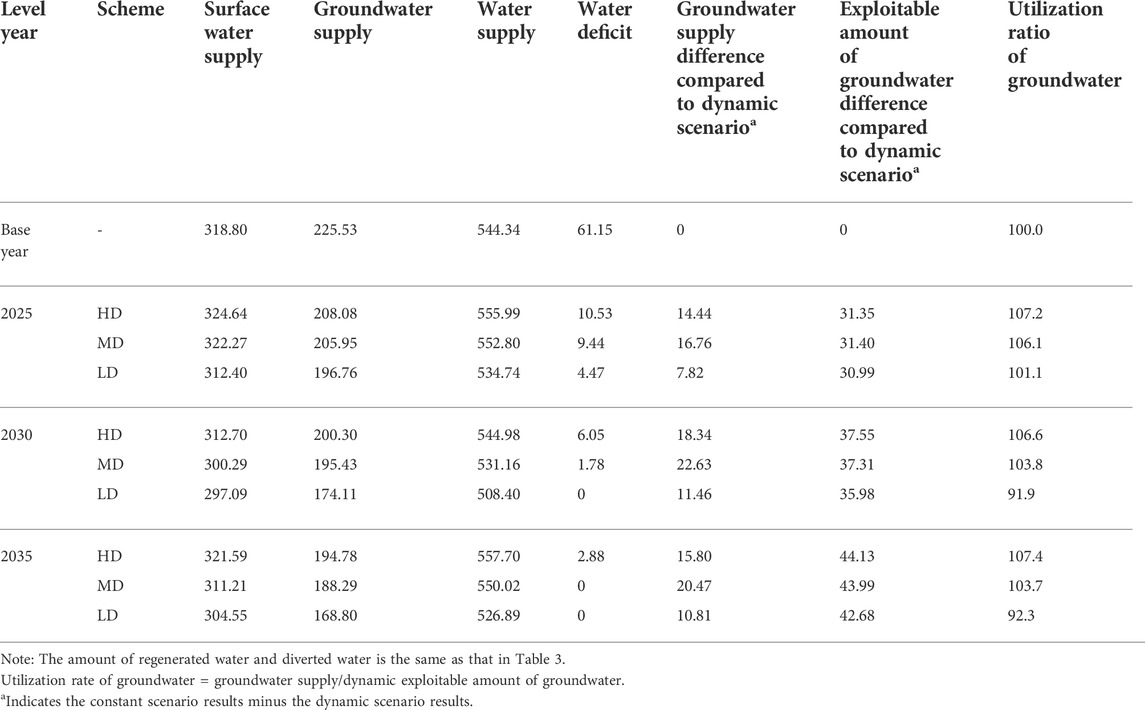
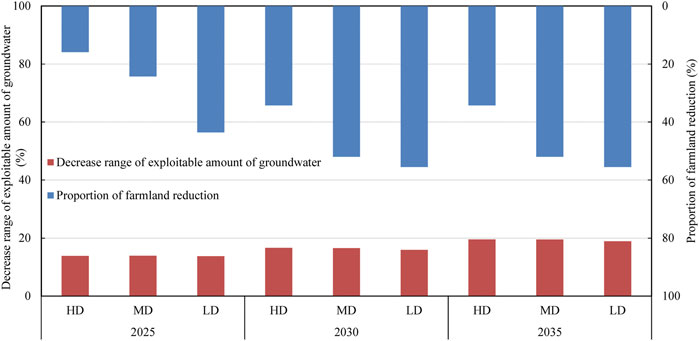
The optimal allocation of water resources is also carried out assuming no change in the exploitable amount of groundwater for each level year (hereafter referred to as constant scenario), and the corresponding results are obtained and compared with those of the dynamic scenario. Table 4 shows that by 2025, 2030, and 2035, the total water supply of the recommended scheme (MD) under the constant scenario will be 552.8 , 531.16 , and 550.02 million m³, respectively. Compared with the dynamic scenario, the water supply is larger and the water shortage is smaller. Surface water supply is lesser and groundwater supply is greater. Both regenerated water and diverted water supply are equal according to the engineering design capacity. The constant scenario does not consider changes in the exploitable amount of groundwater and uses the exploitable amount of groundwater of the base year as 225.53 million m³ for the years of 2025, 2030, and 2035. The exploitable amount of groundwater under the dynamic scenario is decreased by 31.4 , 37.31 , and 43.99 million m³ in 2025, 2030, and 2035 compared with that in the base year, with a reduction rate of 14, 17, and 20%, respectively. Because exploitable amount as the constraint condition of groundwater exploitation in the constant scenario is larger than that in the dynamic scenario, the groundwater supply in the constant scenario is larger. Tables 3, 4 show that the groundwater supply of MD under the constant scenario is 196.76 , 174.11 , and 168.8 million m³ in 2025, 2030, and 2035, and the utilization rate of groundwater is 106.1, 103.8, and 103.7%, respectively. It is concluded that changes in water resource development and utilization patterns can significantly affect the exploitable amount of groundwater in the study area. If water resources are allocated without considering changes in the exploitable amount of groundwater, groundwater over-exploitation will occur, and the lower the ratio of farmland reduction is, the larger the over-exploitation ratio will be.
4.2 Effects of groundwater recharge on the exploitable amount of groundwater
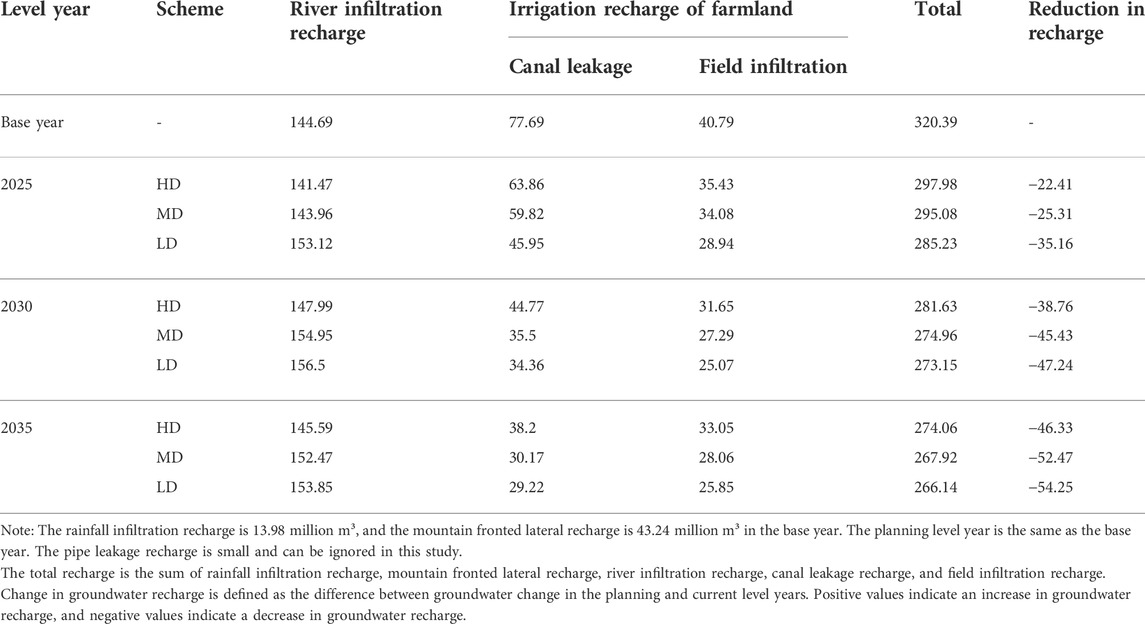
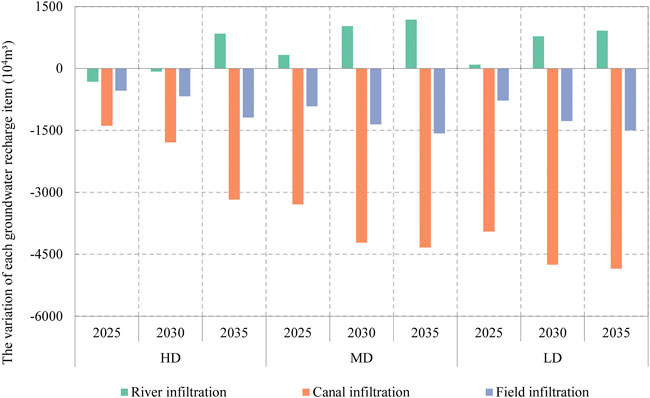
Groundwater is recharged mainly by surface water in the Jinghe County. The variation of groundwater recharge from different sources and their effects on the exploitable amount of groundwater are shown in Table 5 and Figures 5–6. It is found that groundwater recharge under the recommended scheme is reduced by 25.31 , 45.43 , and 52.47 million m3 in 2025, 2030, and 2035 compared with that in the base year, respectively, with a reduction rate of 8, 14, and 16%, respectively. However, the recharge from canal leakage and field infiltration shows a decreasing trend, while that from river channel infiltration shows an increasing trend. Canal leakage has the greatest impact on groundwater recharge, which accounts for about 70% of the total reduction in groundwater recharge. This is because farmland irrigation leads to channel leakage recharge through channel water delivery, and the irrigation water reaches the field to generate field infiltration recharge. The reduction of farmland in the county leads to a substantial decrease in water demand for irrigation, which leads to less water supply for irrigation and eventually less channel leakage and field infiltration according to the principle of supply–demand balance. It is estimated that groundwater recharge would be decreased by about 120,000 m3, and the exploitable amount of groundwater would be decreased by 110,000 m3 with 1 km2 farmland reduction. The larger the area of farmland reduction, the smaller the groundwater recharge, and the greater the impact on the exploitable amount of groundwater. According to local requirements, the rate of farmland reduction is high at first; thus, farmland reduction has a more significant effect on the exploitable amount of groundwater in early periods. The decrease in local surface water supply and the increase in diverted water lead to an increase in the amount of water to be transferred through rivers and consequently an increase in the infiltration from river channels.
It is also noted that the proportion of farmland reduction in different schemes has no significant effect on the reduction in the exploitable amount of groundwater. This is because in order to prevent the deterioration of ecological environment, a small amount of water is still used for irrigation of forest and grassland returned from farmland in Jinghe County, which is smaller than that for the irrigation of farmland but still generates irrigation recharge.
In summary, farmland reduction is considered to be the main cause of decrease in the exploitable amount of groundwater in Jinghe County. However, the impact of water supply patterns should also be considered.
4.3 Variation and influencing factors of the inflow of Ebinur Lake under the recommended scheme
According to the Water Resources Protection Plan of the Bo River and Jing River Basin (YREC 2019), at least 178 million m3 of water should be introduced into the lake from the river per year in order to ensure the ecological sustainability of the lake. The inflow of Ebinur Lake under the dynamic scenario and constant scenario is shown in Table 6. It is found that due to the decrease of socio-economic water requirements and changes of water supply sources, the discharge from the Jing River to Ebinur Lake is increased and the minimum inflow (178 million m3) can be satisfied in all scenarios. The discharge will be increased by 200 m3 of the dynamic scenario per thousand cubic meter of water demand reduction in the Jinghe County. Water diversion is also increased, and reclaimed water is used as an alternative to conventional water sources. As a result, less local surface water is used and the amount of downstream flow is increased. It is also found that water discharge is lower in the dynamic scenario. This is because the exploitable amount of groundwater in the dynamic scenario is lower than that in the constant scenario, and consequently less groundwater is supplied, which results in an increase in supply from surface water and consequently a decrease in the discharge of the river downstream.
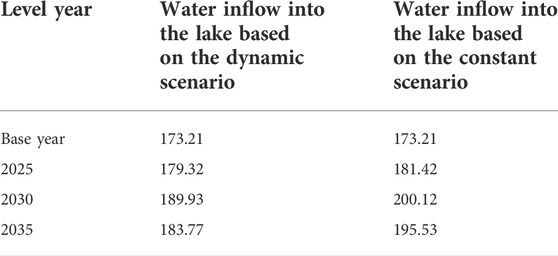
TABLE 6. Inflow of water from the Jing River to Ebinur Lake under different boundary conditions of the recommended scheme (unit: 106 m3).
5 Conclusion
It is important to accurately determine the exploitable amount of groundwater for rational allocation of water resources. In this study, a water resource allocation model is proposed based on the dynamic exploitable amount of groundwater, which takes into account the effects of water resource development and utilization on the recharge and discharge of groundwater. The proposed model overcomes the shortcomings of the traditional water resource allocation, where the exploitable amount of groundwater is assumed to be constant. The model is applied to water resource allocation in Jinghe County of Xinjiang, and the following conclusions are obtained:
1) The total groundwater supply is estimated to be 168 million m3 in 2035, which is 58 million m3 lower than that in the base year, and the groundwater supply will be replaced by surface water, transferred water, and regenerated water. Under the recommended allocation scheme, the exploitable amount of groundwater is 182 million m3 in 2035, which is 44 million m3 lower that in the base year (226 million m3). The use of the current exploitable amount of groundwater in the planning level year may lead to over-exploitation of groundwater in future.
2) The decrease in the exploitable amount of groundwater in the Jinghe County is mainly attributed to the reduction in recharge, especially channel infiltration recharge, with the reduction of farmland. It is estimated that the groundwater recharge is decreased by about 120,000 m3 and the exploitable amount of groundwater is decreased by 110,000 m³ with the reduction of every 1 km2 of farmland.
3) Water demand decrease and replacement of water supply sources contribute to increasing water discharge from the Jing River to Ebinur Lake, and the minimum inflow requirement (178 million m3) is satisfied. The discharge is increased by about 200 m3 in the dynamic scenario as the water demand is decreased by 1,000 m3.
However, it is important to note that this study has focused on the effects of water resource development and utilization patterns on the exploitable amount of groundwater without considering the effects of climate change and underlying surface variations, which should be taken into consideration in future studies.
Data availability statement
The original contributions presented in the study are included in the article/Supplementary Material. Further inquiries can be directed to the corresponding author.
Author contributions
YL: construction of model, methodology, data curation, conclusion analysis, and writing—original draft. ZM: construction of model, methodology, supervision, and writing—review and editing. TW: supervision, writing—review and editing. XX: construction of model and writing—review and editing. YG: Writing-review and editing.
Funding
This work is supported by the National Natural Science Foundation for Young Scientists of China (No. 51609261), National Key R&D Program of China (No. 2021YFC3001000).
Conflict of interest
The authors declare that the research was conducted in the absence of any commercial or financial relationships that could be construed as a potential conflict of interest.
Publisher’s note
All claims expressed in this article are solely those of the authors and do not necessarily represent those of their affiliated organizations, or those of the publisher, the editors, and the reviewers. Any product that may be evaluated in this article, or claim that may be made by its manufacturer, is not guaranteed or endorsed by the publisher.
References
Abuduwaili, J., DongWei, L. I. U., and GuangYang, W. U. (2010). Saline dust storms and their ecological impacts in arid regions. J. Arid. Land 2 (2), 144–150. doi:10.3724/SP.J.1227.2010.00144
Afshar, A., Khosravi, M., and Molajou, A. (2021). Assessing Adaptability of cyclic and non-cyclic approach to conjunctive use of groundwater and surface water for sustainable management plans under climate change. Water Resour. manage. 35 (11), 3463–3479. doi:10.1007/s11269-021-02887-3
Bloomfield, J. P., Marchant, B. P., and McKenzie, A. A. (2019). Changes in groundwater drought associated with anthropogenic warming. Hydrol. Earth Syst. Sci. 23, 1393–1408. doi:10.5194/hess-23-1393-2019
Cuthbert, M. O., Gleeson, T., Moosdorf, N., Befus, K. M., Schneider, A., Hartmann, J., et al. (2019). Global patterns and dynamics of climate–groundwater interactions. Nat. Clim. Chang. 9 (2), 137–141. doi:10.1038/s41558-018-0386-4
De Fraiture, C., and Wichelns, D. (2010). Satisfying future water demands for agriculture. Agric. water Manag. 97 (4), 502–511. doi:10.1016/j.agwat.2009.08.008
Dong, X. G., and Deng, M. J. (2005). Groundwater resources in Xinjiang. Urumqi: Xinjiang Science Publishing House.
Flores, L., Bailey, R. T., and Kraeger-Rovey, C. (2020). Analyzing the effects of groundwater pumping on an urban stream-aquifer system. J. Am. Water Resour. Assoc. 56, 310–322. doi:10.1111/1752-1688.12827
Frey, S. K., Miller, K., Khader, O., Taylor, A., Morrison, D., Xu, X., et al. (2021). Evaluating landscape influences on hydrologic behavior with a fully-integrated groundwater–surface water model. J. Hydrology 602, 126758. doi:10.1016/j.jhydrol.2021.126758
Ghimire, U., Shrestha, S., Neupane, S., Mohanasundaram, S., and Lorphensri, O. (2021). Climate and land-use change impacts on spatiotemporal variations in groundwater recharge: a case study of the bangkok area, Thailand. Sci. Total Environ. 792, 148370. doi:10.1016/j.scitotenv.2021.148370
Haiyuan, L., Xinmin, X., and Kezhen, G. (2013). Study on exploitable quantity of groundwater based on water resources optimal allocation. J. Hydraulic Eng. 44 (10), 1182–1188. doi:10.13243/j.cnki.slxb.2013.10.002
Haque, S. E. (2018). “An overview of groundwater quality in Bangladesh, groundwater of South Asia,” in Groundwater of south Asia (Singapore: Springer), 205–232. doi:10.1007/978-981-10-3889-1_13
Huang, C. S., Yang, T., and Yeh, H. D. (2018). Review of analytical models to stream depletion induced by pumping: Guide to model selection. J. Hydrology 561, 277–285. doi:10.1016/j.jhydrol.2018.04.015
Jayakumar, R., and Lee, E. (2016). Climate change and groundwater conditions in the Mekong Region–A review. J. Groundw. Sci. Eng. 4 (2). doi:10.19637/j.cnki.2305-7068.2017.01.002
Kun, W., Longcang, S., and Bo, L. (2014). Connotations of safe yield of groundwater and determination of controlled groundwater level for safe exploitation. Water Resour. Prot. 6, 7–12. doi:10.3969/j.issn.1004-6933.2014.06.002
Li, Y. B., Xu, J. X., and Huang, Q. (2006). Association models of the earth's surface and underground water's union utilization in irrigation district. Journal-Shenyang Agric. Univ. 37 (6), 884. doi:10.3969/j.issn.1000-1700.2006.06.018
Liu, D., Abuduwaili, J., Lei, J., and Wu, G. (2011). Deposition rate and chemical composition of the aeolian dust from a bare saline playa, Ebinur Lake, Xinjiang, China. Water Air Soil Pollut. 218 (1), 175–184. doi:10.1007/s11270-010-0633-4
Liu, D., Abuduwaili, J., and Wang, L. (2015). Salt dust storm in the Ebinur Lake region: its 50-year dynamic changes and response to climate changes and human activities. Nat. Hazards (Dordr). 77 (2), 1069–1080. doi:10.1007/s11069-015-1642-9
Liu, J., Hu, Y., and Chen, H. (2020). Conjunctive use of surface water and groundwater in irrigation districts in China. Irrig. Drain. 69, 135–141. doi:10.1002/ird.2471
Liu, P. G., Shu, L. C., and Shang, M. T. (2008). Fuzzy-stochastic method for reliability analysis of groundwater allowable withdrawal. J. Hydraulic Eng. 39 (9), 1141–1145.
Liu, X. (2007). Study on water resources optimized allocation model-based on the dynamic translation between surface water and groundwater. Beijing: China Institute of Water Resources and Hydropower Research Beijing, 1–203.
Park, C. H., and Aral, M. M. (2004). Multi-objective optimization of pumping rates and well placement in coastal aquifers. J. Hydrology 290 (1-2), 80–99. doi:10.1016/j.jhydrol.2003.11.025
Rahmati, O., Golkarian, A., Biggs, T., Keesstra, S., Mohammadi, F., and Daliakopoulos, I. N. (2019). Land subsidence hazard modeling: Machine learning to identify predictors and the role of human activities. J. Environ. Manag. 236, 466–480. doi:10.1016/j.jenvman.2019.02.020
Sampathkumar, K. M., Ramasamy, S., Ramasubbu, B., Karuppanan, S., and Lakshminarayanan, B. (2021). Hybrid optimization model for conjunctive use of surface and groundwater resources in water deficit irrigation system. Water Sci. Technol. 84 (10-11), 3055–3071. doi:10.2166/wst.2021.279
Sarpong, K. A., Xu, W., Mensah-Akoto, J., Neequaye, J. K., Dadzie, A. A., and Frimpong, O. (2020). Waterscape, state and situation of China’s water resources. J. Geoscience Environ. Prot. 8 (10), 26–51. doi:10.4236/gep.2020.810003
Shekhar, S., and Pandey, A. C. (2015). Delineation of groundwater potential zone in hard rock terrain of India using remote sensing, geographical information system (GIS) and analytic hierarchy process (AHP) techniques. Geocarto Int. 30 (4), 402–421. doi:10.1080/10106049.2014.894584
Singh, A. (2014). Simulation–optimization modeling for conjunctive water use management. Agric. Water Manag. 141, 23–29. doi:10.1016/j.agwat.2014.04.003
Wakode, H. B., Baier, K., Jha, R., and Azzam, R. (2018). Impact of urbanization on groundwater recharge and urban water balance for the city of Hyderabad, India. Int. Soil Water Conservation Res. 6 (1), 51–62. doi:10.1016/j.iswcr.2017.10.003
Wang, W., Zhang, Z., Yin, L., Duan, L., and Huang, J. (2021). Topical Collection: Groundwater recharge and discharge in arid and semi-arid areas of China. Hydrogeol. J. 29 (2), 521–524. doi:10.1007/s10040-021-02308-0
Wang, X., Li, X., Xin, L., Tan, M., Li, S., and Wang, R. (2016). Ecological compensation for winter wheat abandonment in groundwater over-exploited areas in the North China Plain. J. Geogr. Sci. 26 (10), 1463–1476. doi:10.1007/s11442-016-1338-4
Wei, C. J., and Wang, H. (2007). Generalization of regional water resources deployment network chart. J. Hydraul. Eng. 9, 1103–1108. doi:10.3321/j.issn:0559-9350.2007.09.012
Wu, B., Du, M., Mu, Z., Gao, F., and Shen, R. (2021). Analysis on the variation of groundwater resources and influencing factors in Xinjiang plain area from 1956 to 2016. Adv. Water Sci. 32 (5), 659–669. doi:10.14042/j.cnki.32.1309.2021.05.002
Wu, X., Zheng, Y., Wu, B., Tian, Y., Han, F., and Zheng, C. (2016). Optimizing conjunctive use of surface water and groundwater for irrigation to address human-nature water conflicts: A surrogate modeling approach. Agric. Water Manag. 163, 380–392. doi:10.1016/j.agwat.2015.08.022
Xiang, L., Fan, Y., Liu, W., and Long, K. (2016). Model of water resources allocation based on idea of giving priority to water-saving. Water Resour. Prot. 32 (02), 9–13. doi:10.3880/j.issn.1004-6933.2016.02.003
Xie, X. M., Li, L. Q., Zhou, X. N., Wang, J. E., Liu, J. Q., and Wei, C. J. (2019). Water resources allocation model based on “double control” of groundwater and its application. Water Resour. Prot. 35, 6–12.
Yang, G., Guo, P., Li, R., and Li, M. (2016). Optimal allocation model of surface water and groundwater based on queuing theory in irrigation district. Trans. Chin. Soc. Agric. Eng. 32 (6), 115–120.
YREC (Yellow River Engineering Consulting Co.,Ltd) (2019). Comprehensive planning of bortala river and Jing River basin Zhengzhou: YREC (Yellow River Engineering Consulting Co., Ltd).
Zhang, F., Tashpolat, T., Kung, H. T., and Ding, J. (2010). The change of land use/cover and characteristics of landscape pattern in arid areas oasis: an application in Jinghe, Xinjiang. Geo-Spatial Inf. Sci. 13 (3), 174–185. doi:10.1007/s11806-010-0322-x
Keywords: dynamic change, exploitable amount of groundwater, groundwater, optimal allocation model, water resource allocation, Xinjiang
Citation: Lu Y, Ma Z, Wang T, Xie X and Gu Y (2022) Development of a water resource allocation model based on the dynamic exploitable amount of groundwater and its application in the Jinghe County, Xinjiang. Front. Environ. Sci. 10:946072. doi: 10.3389/fenvs.2022.946072
Received: 17 May 2022; Accepted: 09 August 2022;
Published: 19 September 2022.
Edited by:
Bin Guo, Shandong University of Science and Technology, ChinaReviewed by:
Junqiang Yao, China Meteorological Administration, ChinaLong Aihua, China Institute of Water Resources and Hydropower Research, China
Copyright © 2022 Lu, Ma, Wang, Xie and Gu. This is an open-access article distributed under the terms of the Creative Commons Attribution License (CC BY). The use, distribution or reproduction in other forums is permitted, provided the original author(s) and the copyright owner(s) are credited and that the original publication in this journal is cited, in accordance with accepted academic practice. No use, distribution or reproduction is permitted which does not comply with these terms.
*Correspondence: Zhenzhen Ma, mazz@iwhr.com
 Yao Lu
 Zhenzhen Ma*