- 1Department of Earth, Geographic, and Climate Sciences, University of Massachusetts, Amherst, MA, United States
- 2UMassAir, University of Massachusetts, Amherst, MA, United States
One of the key metrics for the effectiveness of wetland restoration is whether a restored wetland behaves hydrologically like a natural wetland. Restoration is designed to increase the water residence time on the surface of the site in order to capture and process nutrients, mitigate the impact of local flooding and drought, and provide a habitat for wetland species abundance and biodiversity. Quantifying the change in groundwater presence at the wetland’s surface will inform future freshwater wetland restorations across New England. The ability to produce a comprehensive map of the locations of groundwater discharge over a large area has the potential to provide insight into restoration practice, its success, and its effects on individual seeps over time. Identification, mapping, and measurement of groundwater discharge sites have long been a challenge, but new methodologies are developing with the advances in unmanned aerial systems (UAS). This study uses a UAS-mounted thermal infrared camera to map groundwater seeps on a 25-ha (62-acre) site in Plymouth, Massachusetts, before and after it underwent restoration to a freshwater wetland. Using the thermal map, we located and quantified the spatial extent that of groundwater seeps pre-restoration and the changes after restoration. The location and size of these seeps show that existing groundwater seeps remained immobile through restoration, but their surface expression grew, indicating that restoration removed barriers to surface expression and successfully increased residence time. This analysis using a thermal camera-enabled UAS allows for a temporal comparison over large spatial scales and provides insight into restoration impacts to groundwater expression on the surface of post-agricultural wetland sites.
1 Introduction
Southeastern Massachusetts is dominated by post-glacial deposits: glacial outwash, pitted plains, moraines, and kettle holes that were formed at the end of the Wisconsin glaciation. The Plymouth–Carver–Kingston–Duxbury (PCKD) groundwater aquifer is the second largest regional aquifer in the state and covers most of southeastern Massachusetts. The PCKD aquifer extends 140 square miles and flows northeast to the Atlantic Ocean through the coarse sand and gravel deposits that form the former outwash plains dotted with kettle lakes (Hansen et al., 1992). Many of those kettle holes evolved into peat bogs, including the site of this study.
Within this kettlehole landscape, a commercial cranberry industry developed. The production of cranberries has been a popular and profitable venture in southeastern Massachusetts for the past 150–170 years. Most cranberry farms in Massachusetts were built on the kettle hole peatlands that formed shortly after glacial retreat (Hatch and Ito, 2022; Stone et al., 2011). Cranberries (Vaccinium macrocarpon) are a wetland plant native to the northeast coast of the United States and Canada, found in bogs and peatlands which provide a wet acidic environment (Living Observatory, 2020). Cranberries likely grew wild in and around these kettle holes before they were commercially cultivated. However, to achieve commercial viability, these peatlands were altered significantly to grow a cranberry monoculture, deter pests, increase productivity, and streamline the harvesting process. Most of the physical alterations farmers made to the landscape centered around managing water: altering the surface to drain water from the farms during excess inflow and to flood the fields during harvest. This alteration included straightening existing stream channels, digging drainage ditches, and building water control structures like dams, berms, and retention ponds. To improve cranberry growth, farmers also layered sand on top of the original peat every 3–5 years (Living Observatory, 2020, and Hatch and Ito, 2022). These modifications resulted in layers of sand blanketing the original peat, with thin organic layers deposited in the intervening years between sand application. The total sand layer depth varies, but at our site is about 35 cm deep. In recent decades, the economic viability of cranberry farming in Massachusetts has declined due to increasing operating costs and growing competition from newer and more productive farms in the Midwestern United States and Canada. Cranberry farmers in Massachusetts are considering a “green exit”: ecological restoration as an alternative to selling their land to developers or leaving their farms fallow (Hoekstra et al., 2020 and Living Observatory, 2020).
Wetlands, and particularly coastal freshwater wetlands, are vital to increasing flood mitigation capacity in coastal areas and for drought resiliency (Zedler et al., 2000). Increased flooding is an emerging threat locally and globally and is expected to intensify with climate change. Local, state, and federal agencies, as well as academic institutions, are increasingly engaging in wetland restorations. Therefore, understanding the factors that contribute to the long-term sustainability and success of wetland restorations is vital to understanding the viability of such projects and establishing best practices for future projects. Additionally, freshwater wetlands are among the most biodiverse ecosystems, and provide a valuable habitat for migratory birds and anadromous fish such as herring and trout. Wetlands provide resiliency during droughts because their particular soil types hold water much longer than other soils. Groundwater also provides a buffering influence on wetland temperatures. Groundwater springs maintain relatively constant temperature of the surface water and saturated ground: groundwater will be cool in the summer and prevents areas from freezing in the winter. If increased biodiversity is a goal of the wetland restoration project, it is important to account for the additional temperature influence of groundwater within the wetland. The influx and residence time of groundwater impacts its influence on a wetland ecosystem during climate extremes. Groundwater inflow provides a constant supply of cool water– which is critical for sensitive fish and amphibians living in freshwater wetland habitats (Living Observatory, 2020). As climate change causes more extreme weather on the eastern coast, reliable cool freshwater inputs will become critical.
The effectiveness of a “green exit” wetland restoration depends on reliable underlying hydrology (Hoekstra et al., 2020). There is growing evidence that wetlands which are actively restored (i.e., sites that have been manually reconfigured to remove barriers, encourage wetland species growth, and promote natural hydrologic characteristics) grow to resemble natural wetlands faster, and more effectively, than those left alone to “rewild” themselves without human intervention (Zedler et al., 2000). Soil organic content and nitrate concentrations in actively restored wetlands return to natural levels faster than fallow, retired, or abandoned cranberry farms (Ballantine et al., 2017; Hoekstra et al., 2020). However, the rate at which flora and fauna regeneration approaches that of natural wetlands varies significantly at different sites. Natural wetlands also have significantly higher organic content in the soils, which has built up in anoxic conditions over decades to centuries (Mitsch et al., 2015). Conversely, there is little nitrogen available in natural wetlands. Former farms tend to have an excess of nitrogen, owing to the repeated application of fertilizer over the lifetime of the farm. In wetlands, there is higher plant density across the landscape than in a fallow cranberry farm. The abundance of plants in the wetland can allow for denitrification of the soil and upstream aqueous inputs (Living Observatory, 2020). Restoration’s impacts to flora, organic content, and water quality are active areas of study. However, wetland restoration effects on groundwater discharge have not been fully studied (Living Observatory, 2020). It is unknown how changes in the water table and groundwater flux affect the speed of this progression and how cranberry bog restoration differs in this regard from other freshwater wetland restorations.
Thermal infrared (TIR) imagery is a tool that can help answer these questions. TIR has been used to detect groundwater seeps in a variety of environments, including submarine discharge in oceans (Shaban et al., 2005; Duarte et al., 2006; Johnson et al., 2008; Danielescu et al., 2009; Peterson et al., 2009; Garcia-Solsona et al., 2010), freshwater lakes (Lewandowski et al., 2013), seas (Mallast et al., 2013), fluvial systems (Torgersen et al., 2001; Deitchman and Loheide, 2009; Schuetz and Weiler, 2011; Rautio et al., 2015), and even peatlands (Isokangas et al., 2019). More recently, TIR cameras have been mounted on unmanned aerial systems (UAS or drones) to achieve a more cost-effective solution to manned aircraft missions (Harvey et al., 2019).
The objective of this study is to use a UAS – enabled TIR camera to estimate the surficial extent of changes in groundwater seeps over time at a cranberry farm restoration. This study is an expansion of the work carried out by Hare et al. (2015) and Harvey et al. (2019), and importantly, adds new methods and quantification to this growing field. Hare et al. used a handheld TIR camera to identify groundwater seeps in a neighboring restored wetland. That study noted the difficulty and time-consuming nature of surveying a large area on foot with a TIR camera. Several days of work were needed to cover the site. Harvey et al. used TIR mounted on a commercial UAS to detect groundwater seeps at the same wetland. However, Harvey et al. (2019) and all previously cited studies using the TIR-enabled UAS represent single snapshots in time. To the best of our knowledge, this is the first study using UAS-enabled TIR to estimate changes in groundwater seeps. This tool provides a relatively cheap and cost-effective snapshot of a large area that can be repeated at regular intervals. When coupled, as we have done here, with field verification of groundwater temperatures, this method provides an effective and accurate map of groundwater seep-surface expression. This can be a useful tool to guide wetland restoration, monitor the progress of wetland restoration interventions specifically, and quantify changes in hydrologic landscapes generally.
2 Methods
2.1 Site description
Our study site, Foothills Preserve (Figure 1), is located on 61.3 acres of former peatland in Plymouth, Massachusetts. It was converted from a natural bog into a cranberry farm in 1854 and ceased production in 2015. The site was restored by the town of Plymouth between summer 2020 and spring 2021. To facilitate the development of a wetland, water control structures were removed, straightened channels were filled in and reconstructed to increase river meandering, and the land surface was disturbed (creating microtopography) to increase topographic variation and to break up the top cranberry plant mat and sand layers which were added during farming.
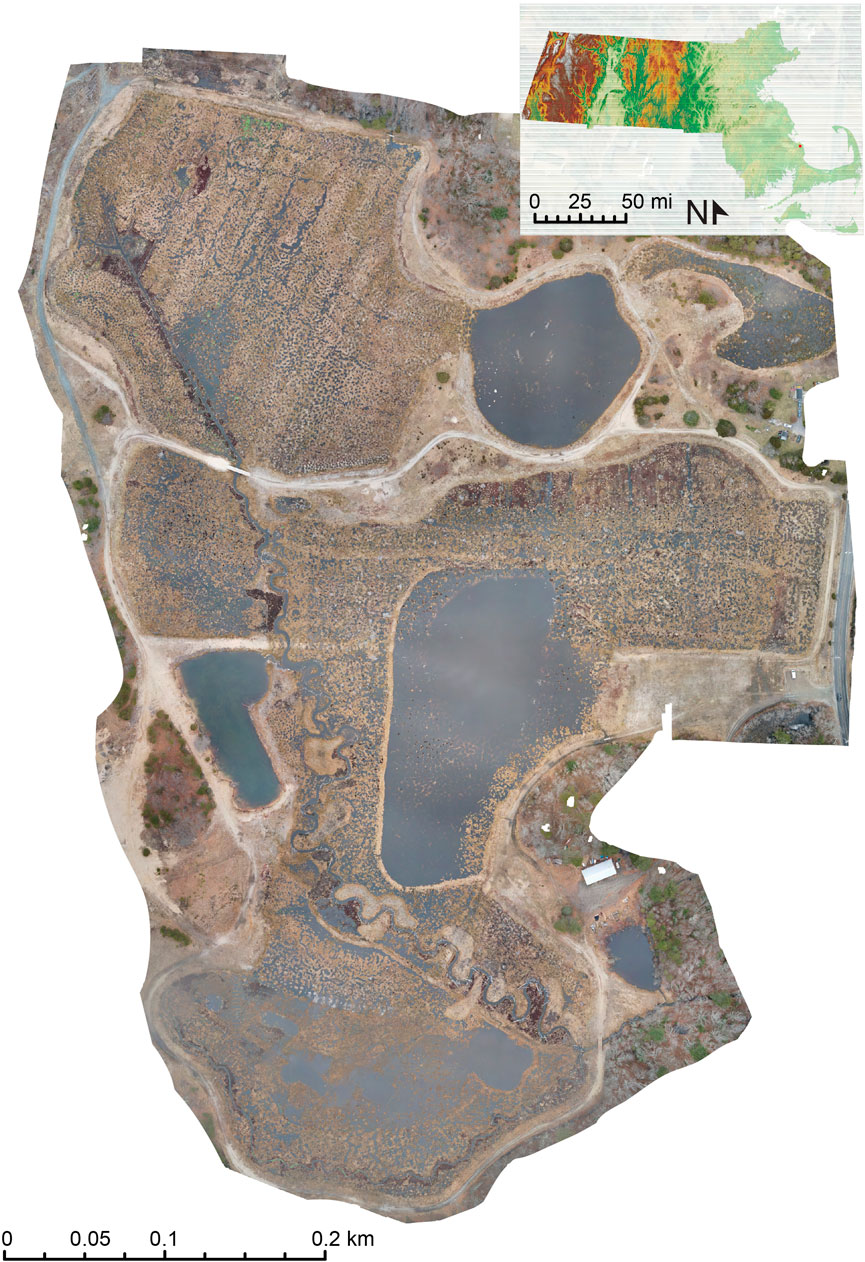
FIGURE 1. Orthomosaic image of Foothills Preserve (from the UAS, flown 17 March 2022) (inset) Location of Foothills Preserve on a digital elevation model (DEM) from MassGIS.
Foothills Preserve experiences significant groundwater upwelling (about 84% of the surface water leaving the site comes from groundwater) (Hatch and Ito, 2022, and Living Observatory, 2020). The groundwater flows in from the west, beginning in Myles Standish State Forest, and under the Pine Hills glacial moraine. These moraines formed during the Wisconsin glaciation and are surrounded by layers of well-sorted outwash and till, which serve as an effective recharge zone (Hansen et al., 1992). Most of the groundwater discharge enters the site from the west, upwelling along the western margin of the peatlands, and also discharges upward through peat pipes and fractures within the interior of the bog (these findings are similar to mechanisms identified by Hare et al. (2015) in the neighboring Tidmarsh Wildlife Sanctuary). Manomet Brook is the defining surface water feature for Foothills Preserve, running from north to south through the bog and discharging along the southeastern margin. Because this site and Tidmarsh Wildlife Sanctuary (once part of the same cranberry farming operation, restored in 2017 and acquired by Mass Audubon) remain accessible to the public and researchers, they provide continuity of observations for interdisciplinary research on cranberry bog restorations (Living Observatory, 2020) and serve as a template to study the success of wetland restoration in coastal New England. Therefore, understanding the hydrologic transformations at Foothills Preserve will have implications for further restorations in this and similar regions based on these design principles.
2.2 Pre-existing infrastructure
Instrumentation was installed at the site before 2020 for ongoing monitoring of site conditions (described in detail in Hatch and Ito, 2022). 14 piezometers were installed both in the stream and across the surface of the bog. They were screened into both the sand and peat layers and were used to establish water levels within the two soil layers before restoration began. Discharge data at the inlet and outlet of the site were collected using a flow meter to establish a pre-restoration water budget. The onsite weather station was installed in 2018. Among other parameters, it records soil moisture, precipitation, and soil temperature. Water samples of groundwater springs, stream discharge, and precipitation were collected and analyzed for their isotopic signature.
2.3 Sampling methods
Thermal infrared (TIR) or forward-looking infrared (FLIR) cameras only record surface temperature or “skin temperature.” For that reason, we chose our representative flights to be flown during the coldest time of the year, when the relatively warm groundwater is more buoyant than the colder surface water. The groundwater floats to the surface of the water bodies and is captured on the aerial TIR camera as the “skin temperature.” Additionally, to maximize the temperature difference between the groundwater and surface water, we began all flights at dawn, when the surface water was coldest (we did not have a waiver from the Federal Aviation Administration (FAA) at the time that UAS regulations stipulate is required for drone use at night).
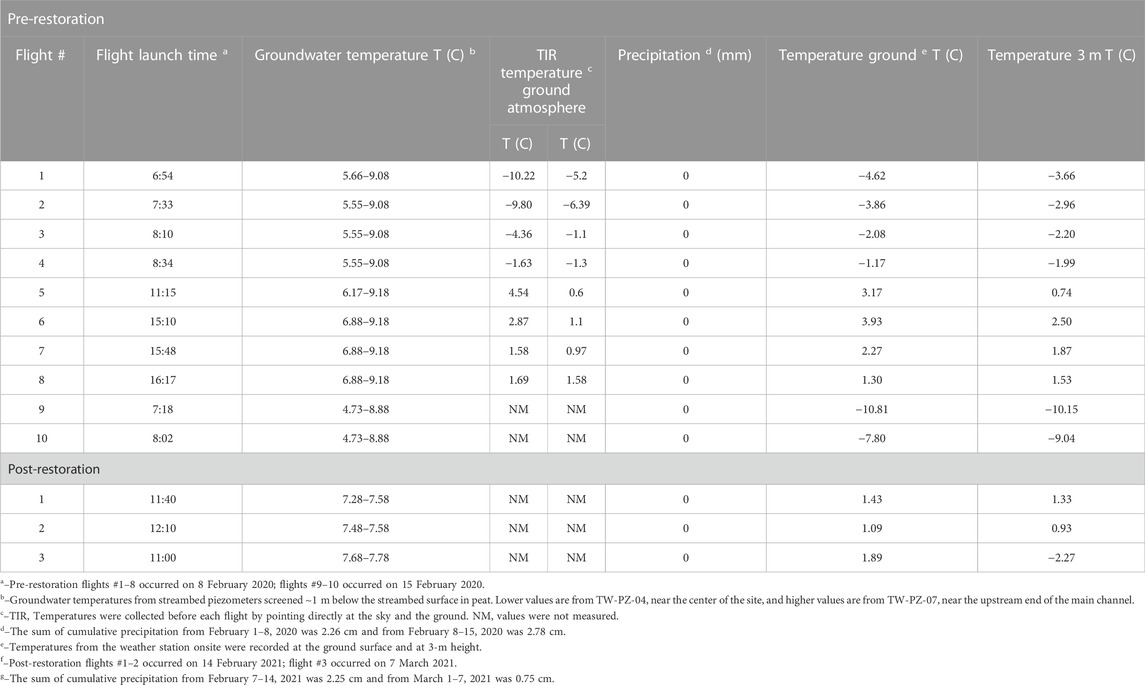
During the pre-restoration flight (8 February 2020), we flew a DJI Matrice 210 quadcopter. The attached camera was an FLIR Zenmuse XT which contains a thermal camera (temperature range −25° to 135°C) and an RGB camera that captures plain light images simultaneously. We noted that it is valuable to capture visual spectrum (red, green, and blue: RGB) photos simultaneously with TIR photos. An RGB map is often of higher resolution and serves as a visual reference for the TIR map during post-processing, such as confirming ground control points and identifying thermal points of interest. To cover the entire site, we flew a total of 10 flights (201 min). Due to battery constraints (capacity is significantly reduced in cold weather), the eastern portion of Foothills Preserve was completed in two flights on 15 February 2020, covering a combined total of 0.25 km2 (62 acres). On both days, the atmospheric temperature ranged from −6.39°C to 1.58°C during the survey (Table 1). Groundwater temperatures on the site fluctuated between 5°C and 13°C throughout the year, typically reaching a minimum in February, between 6–7°C. During our flights, the groundwater was measured in piezometers screened ∼1 m below the streambed at 7.3–9°C upstream, and 4.7–7.7°C near the middle of the site. A total of 14 ground control points (GCPs: wooden squares covered with white vinyl to increase thermal reflectance of colder sky temperatures) were distributed throughout the site and measured using a R10 Trimble Real-Time Kinematic Global Positioning System (RTK GPS) which has a horizontal accuracy of 8 mm. The RTK GPS paired with GCPs typically yields an accuracy of ±3 cm lateral and ±5 cm vertical offset. The white blocks have a low emissivity and stand out as black in TIR, making them easy to identify from aerial imagery. These points lower the spatial error from the drone during post processing. Between 12 and 15 ground control points has been shown to be sufficient to accurately locate imagery on a site our size and can increase the horizontal accuracy of the map up to 15 cm (Aguera-Vega et al., 2017; Yu et al., 2020).
We flew the post-restoration thermal survey on 14 February 2021. We used a DJI Matrice 100 quadcopter with an attached FLIR Zenmuse XT which has a 25-mm lens, a spectral band of 7.5–13.5 μm, and 640 × 512 pixel resolution. On this day, since much of the previous week had below freezing temperature (Figure 2), the standing surface water was frozen, but standing water with groundwater influence remained unfrozen. Due to snow cover, the same white ground control points that were used in 2020 could not be re-used as they would blend into the snow background. Instead, insulated, silver reflective pans of hot water, each containing two gel handwarmers to maintain water temperature, were placed at the ground control sites and surveyed using an RTK GPS. The temperature of the hot water pans was monitored throughout the flight time, and hot water was added as needed during the flights to maintain a temperature difference with the background snow. An additional flight was flown on 3 March 2021 to cover an additional area of the site missed on the previous date. This was flown with the same camera (FLIR Zenmuse XT) attached to a DJI Inspire 1 UAS. The same hot water ground control points were used, but snow was no longer found on the ground.
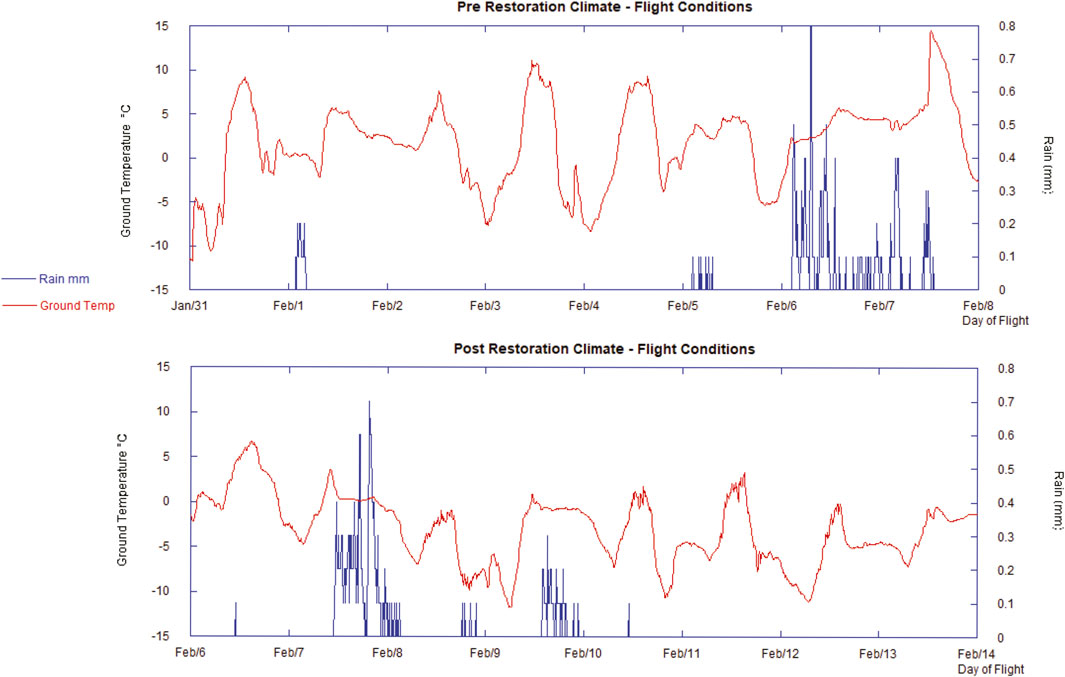
FIGURE 2. Plot of precipitation (mm, blue) and ground temperature (°C, red), leading up to the pre-restoration UAS flights at Foothills Preserve on 8 February 2020.
2.4 Site conditions
Prior to all UAS flights, weather and flying conditions must be carefully checked and verified. In addition, for thermal UAS imaging to succeed, weather conditions must be optimal for detection of a small thermal signal. This requires that air and ground temperatures be below freezing and ideally snow-free for a more variable surface. We flew the pre-restoration flight on 8 February 2020. The ground was covered in frost, but free from snow. Flowing water was unfrozen, but the surface of the standing water (i.e., the retention pond) was partially frozen. The cumulative rainfall in the preceding week was 2.26 cm, and the ground temperature during our flights according to our TIR sensor was between −10.2°C and 4.5°C (Table 1). These values correspond to values measured at our on-site weather station of between −4.6 and 3.9°C.
We flew the post-restoration flight on 14 February 2021. Foothills Preserve was covered in several inches of snow. The process of restoration significantly increased the land area submerged in standing water, with small pockets of surface water scattered throughout the site. Most of these shallow pools of standing water were covered in ice, but the groundwater-influenced pools were not frozen (Figure 3). Parts of the ground, newly exposed peat, and some dead vegetation were not buried in snow, and these areas gave off a warmer thermal signature. These exposed areas tended to be the northeastern sides of the hummocks created to build microtopography. The (TIR) ground temperature ranged between −1°C and 2.5°C (weather station = 0.7–2.4°C) during flight, and 2.25 cm of precipitation in the week leading up to the flight. These conditions are typical of winter weather in Plymouth, Massachusetts. Despite the presence of snow covering the site, the temperature and prior precipitation were similar to those of the pre-restoration flight.
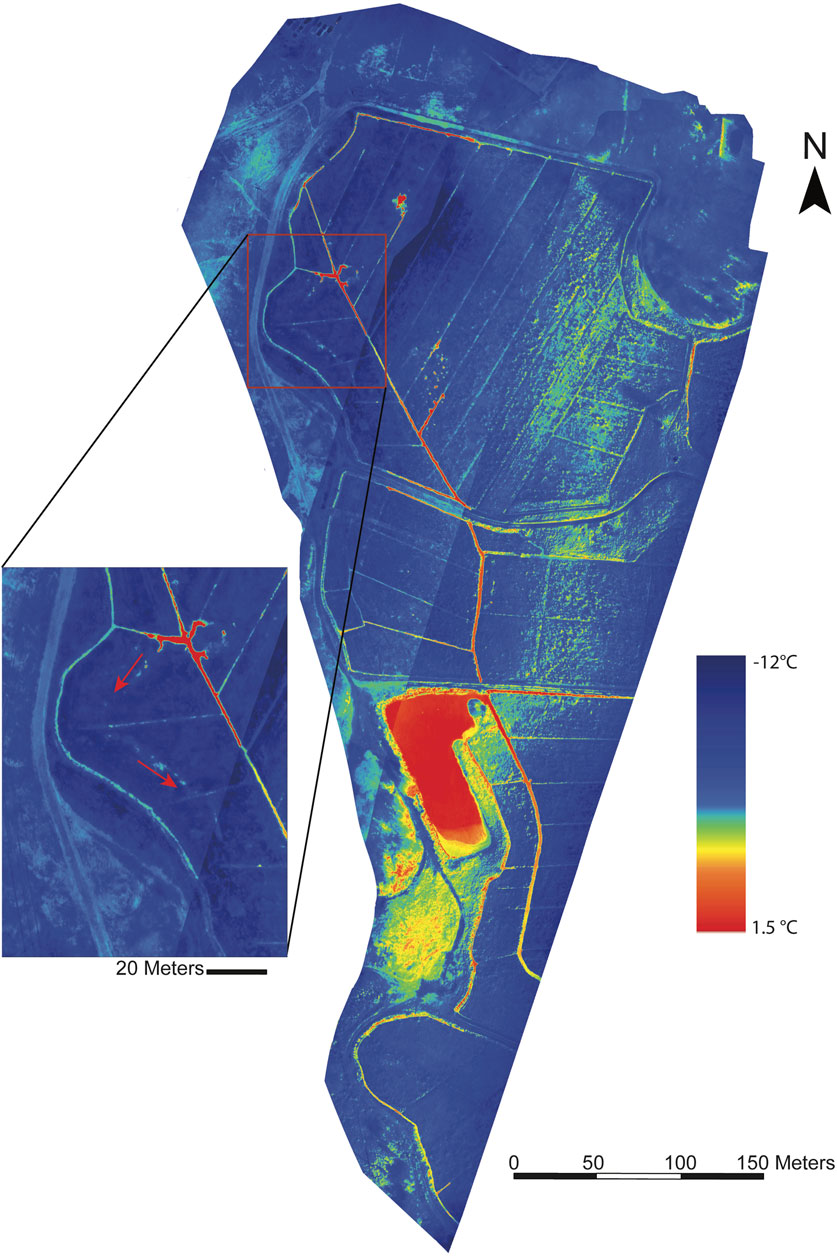
FIGURE 3. Orthomosaic image of pre-restoration UAS-derived thermal infrared imagery 8 February 2020. Ground surface is cold (blue), and discrete warmer groundwater springs show up as warm (red) dots and flow into surface ditches. The inset image shows the hypothesized location of the original stream channel, with red arrows indicating flow direction.
2.5 Analytical methods
The first step in image processing was clipping the edges of images taken from screenshots to a standard proportion. Second, we recalibrated all images using the software package FLIR Thermal Studio. Due to changes in the atmospheric temperature between flights, we processed each flight individually to maintain spectral sensitivity. The FLIR Zenmuse XT2 camera automatically calibrates every image to include the coldest and hottest temperatures within the frame. At our site, the coldest objects are tin roofs and the hottest include cars, telephone poles, and people. The presence of these objects in the image limits the image resolution between groundwater and surface water. Recalibration dampens the resolution of objects at the extreme ends of the thermal spectrum but increases the clarity of the groundwater seeps and other features on the bog’s surface.
Recalibrated images were imported into Agisoft Photoscan Metashape to orthomosaic into a single map. Flights flew at different times throughout the day, so the thermal signature of the ground surface varies by flight. So just as with recalibration, we processed each flight separately to retain image clarity. We used ESRI ArcMap 10.7.1 to stitch each orthomosaic together into a comprehensive thermal map of the entire site. By maintaining separation of the flights during the orthomosaicing process, we preserved the best possible thermal resolution, but generated thermal artifact lines between each flight that are visible in the complete thermal map (Figure 4). Since we conducted image analysis exclusively on individual flight maps, these artifacts do not affect our results.
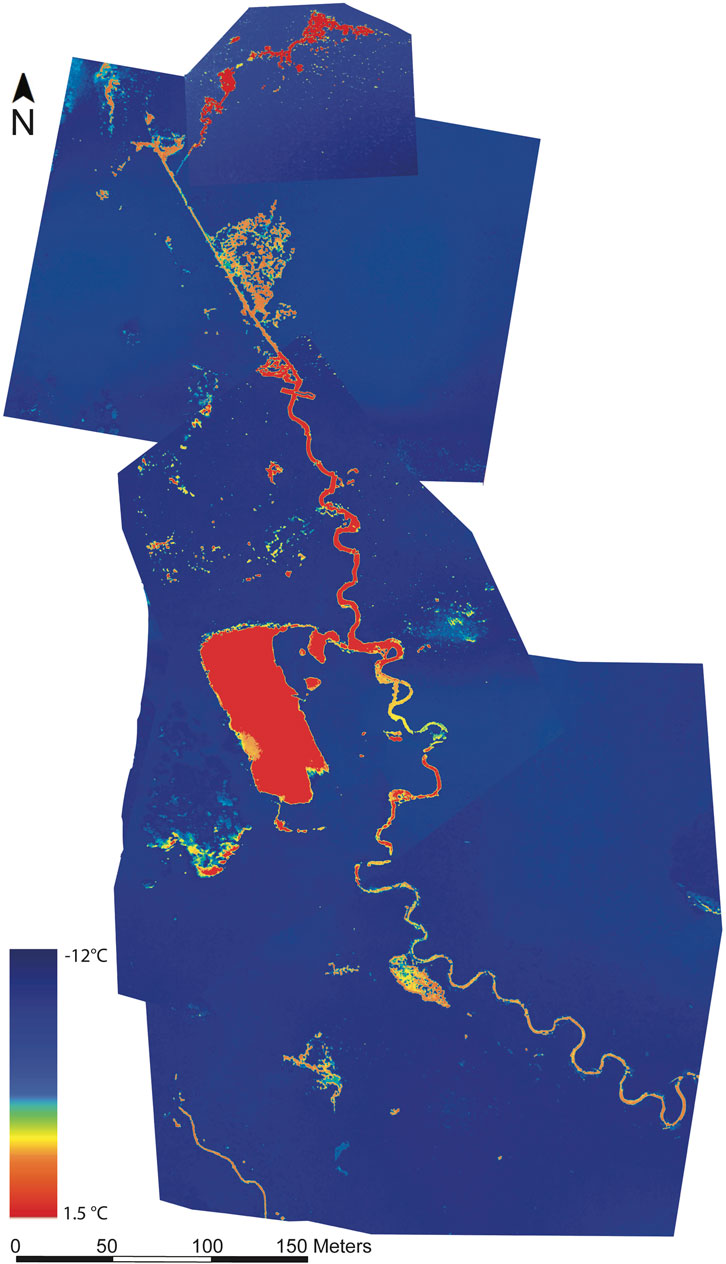
FIGURE 4. Orthomosaic image of post-restoration UAS-derived thermal infrared imagery 14 February 2021. Ground surface is cold (blue). Much of the surface has been altered with microtopography, allowing more free expression of warmer groundwater (red and orange) areas, which flow into the reconstructed meandering channel.
The post-restoration flight conducted on 14 February 2021 contains some images that were not georeferenced. We created synthetic ground control points for these images during post-processing by manually identifying unique recognizable features from the landscape. The extra ground control points were not ground-truthed but served to tie the un-georeferenced images to the georeferenced images. This method lowered the overall accuracy of the map, but allowed us to include a larger area.
2.6 Groundwater surface expression maps
One of the primary objectives of this study was to quantify the surficial extent of groundwater seeps expressing on the surface of the bog. Since groundwater is expected to mix with surface water upon discharge, we expected to detect the source seeps most clearly, as well as mixing zones with a significant groundwater component, though less clearly. To achieve this, we established a method for identifying groundwater, mixed surface-and-groundwater, and surface water/frozen groundwater. To quantify the area of groundwater presentation on the surface, we classified each pixel to correspond to only one of three possible temperature-bounded values for 1) groundwater, 2) groundwater-dominated surface water (from here on referred to as “groundwater dominant”), and 3) surface water/dry frozen groundwater (from here onward referred to as “other”). This classification served to enhance the groundwater signal and more distinctly delineate the bounds of groundwater-influenced ponded or surface water. Groundwater pixels were defined as pixels between 6 and 8°C. We defined groundwater dominant as waters with 50% or greater groundwater contribution. This was defined thermally. We used the thermal mixing equation as described in Dougherty et al. (1954):
where M1 is the mass of groundwater, M2 is the mass of the surface water (both set to 1 for a 50% mix), T1 is the temperature of the groundwater (8°C), T2 is the temperature of the surface water (1.75°C), and C is the heat capacity of water. All remaining pixels were classified as other. There are many different methods for pixel classification. Glaser et al. (2018) applied three of these methods to identify ground saturation along a groundwater stream using TIR imagery. They found that due to changing environmental conditions present in each image, none of the automated classification methods could be applied accurately across all the images. So, based on the recommendations of Glaser et al. (2018), the threshold for the groundwater value was defined manually for each flight to match the extent of known groundwater seeps (defined by recorded temperature and isotope sampling). Pixels representing areas of the ground that absorbed more sunlight (e.g., the eastern slope of the berms and exposed black peat) were cross-referenced with the RGB image and manually removed (Glaser et al., 2018). The total number of pixels for each flight was counted and converted to total area, with each pixel representing 10 cm × 10 cm.
For detailed analysis, five individual images were chosen. Two of these images represented previously known groundwater seeps, two images represented groundwater-fed stream channels, and one image represented an area of bog surface with no known groundwater influence. The groundwater surface expression shown in these images can be compared pre- and post-restoration to provide insight into how areas of the restored site change groundwater expression behavior after restoration.
3 Results
3.1 Technical results
Using hot water pans as ground control points from the two post-restoration 2021 flights produced a spatial resolution of 45 cm. The white vinyl-covered wood blocks, which were used as ground control in the pre-restoration 2020 flight, enabled a resolution of 22 cm. A total of 53 distinct groundwater seeps were identified within the study area pre-restoration. The number of distinct seeps decreased slightly to 38 post-restoration, though it is worth noting that many of these represent larger-sized combinations of distinct pre-restoration seep locations. The spatial accuracy of post-restoration seeps was mapped to 50 cm.
3.2 Groundwater
The overall surface expression (area) of groundwater on the landscape surface of the site increased post-restoration. Based on the observations from the pre-restoration flight, we focused the post-restoration flights on the northwest and southwest corners of the site to record changes in the groundwater seeps previously identified. For the area covered by both flights, the surface expression of groundwater-dominant areas increased by 102.5 square meters. Within the representative individual images analyzed, there was a wide variation in the amount of increase for groundwater-dominant areas (Figures 5–9). The individual images of known groundwater seeps (Figures 5, 6) show the greatest increase in groundwater-dominant surface areas. Images with no visible groundwater seeps pre-restoration also increased in groundwater-dominant surface areas. However, no new groundwater seeps contributed to that increase. Instead, the groundwater increase came from other established seeps which expanded their area of influence on the surface. Finally, images of the stream channel itself were the most diverse, not representing a clear trend of groundwater seep increase.
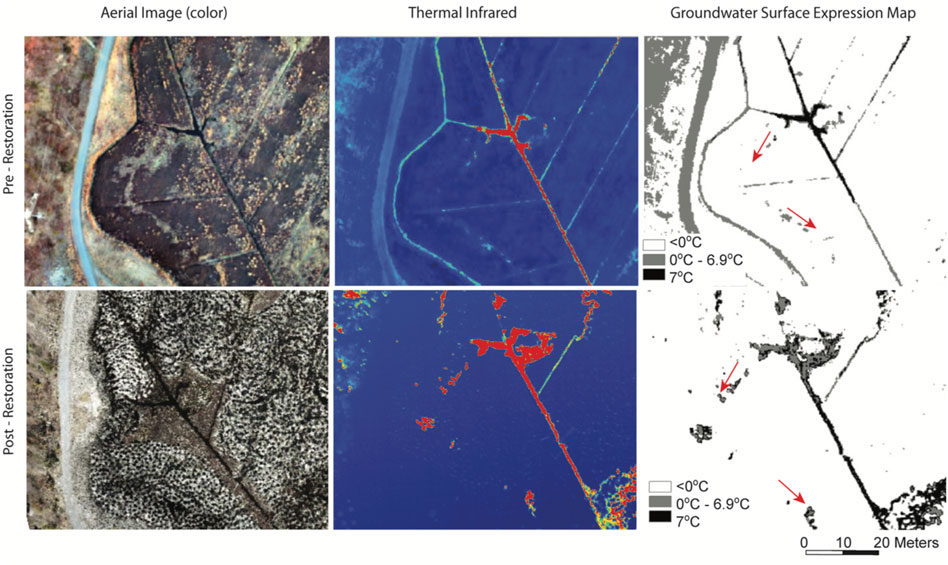
FIGURE 5. Comparative UAS imagery from pre-restoration (top row) to post-restoration at Foothills Preserve, from left to right: (left) plain light (RGB image), (center) thermal infrared, and (right) surface expression of groundwater (black = groundwater and gray = mixing zone). This area of a known groundwater seep was not (intentionally) altered during restoration and did not change the surface area. Red arrows indicate the hypothesized original stream channel flow direction (also shown in Figure 4).
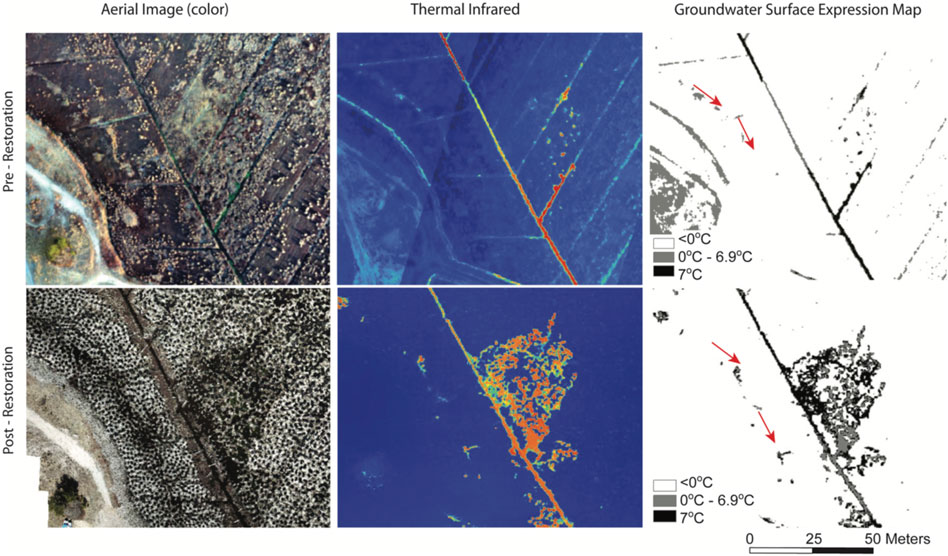
FIGURE 6. Comparative UAS imagery from pre-restoration (top row) to post-restoration at Foothills Preserve, from left to right: (left) plain light (RGB image), (center) thermal infrared, and (right) surface expression of groundwater (black = groundwater and gray = mixing zone). This area had discrete individual seeps before restoration, which merged into a single, much larger area seep complex during restoration. Red arrows indicate the hypothesized original stream channel flow direction.
Only one groundwater seep appeared post-restoration that was not present at the surface pre-restoration. The total count of individual groundwater seeps decreased after restoration (Figures 5–7). Large, individual seeps remained fairly constant in their surface area. The northernmost groundwater seep (Figure 5) is the same size after restoration is complete. It should be noted that the morphology of this seep and its surrounding area was minimally altered during restoration, as it was within a zone demarcated for exclusion from restoration disturbance. The westernmost channel (Figure 6) expresses as individual pocket seeps pre-restoration and appears connected as a small possibly intermittent channel post-restoration. The channel was not targeted for restoration, and no new channel was specifically dug along that route. Instead, like the area to the east of the channel shown in Figure 6, microtopography was dug throughout the area and two log plugs were installed just downstream, creating significant ponding. That disturbance allowed the existing groundwater seeps to discharge and pond more at the surface, creating enough flow to form their own connected channel.
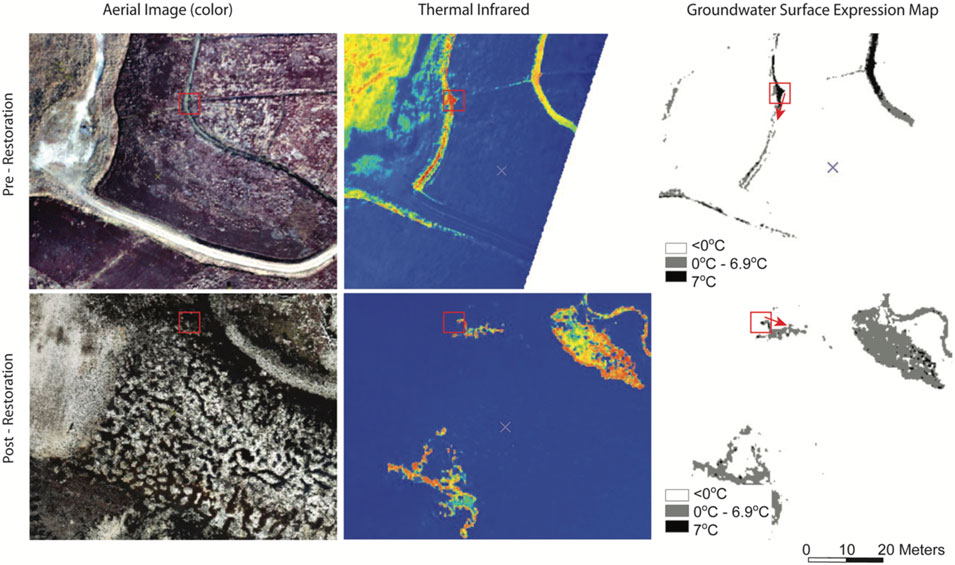
FIGURE 7. Comparative UAS imagery from pre-restoration (top row) to post-restoration at Foothills Preserve, from left to right: (left) plain light (RGB image), (center) thermal infrared, and (right) surface expression of groundwater (black = groundwater and gray = mixing zone). This figure shows an area where flowing springs discharged into ditches and channels before restoration. During restoration, the main channel was filled in, the berm was removed, and the surface was broken up and mixed to create microtopography. Springs located in this area grow into seep complexes after restoration, rather than having their geometry controlled by farm ditch structures. The seep direction changes from flowing south (pre-) to flowing east (post-restoration). The red arrows indicate flow direction.
3.3 Seep locations
Groundwater seep locations remained constant between the pre- and post-restoration surveys. The flow direction from some individual seeps changed. As the microtopography around a seep changed, it impacted the localized area into which a spring would discharge. Figure 7 (with a red square placed at the same location in each image for reference) shows seeps that discharged in one direction and now discharge in the opposite direction (arrows show flow direction). Here, seeps were intersected by ditches, or flowed along subsurface parallel flowpaths in agricultural sand layers prior to restoration, and discharged to the east or south into the pre-restoration channel. Post-restoration, that segment of straightened channel was filled in, and the same seeps now pond and flow to the north to join the new channel. Additionally, the total area of surface expression of individual seeps either remained constant or grew across all study areas (Figures 5–9). Before restoration, groundwater seeps were concentrated on the western half of the site, 8–111 m from the base of the Pine Hills. Post-restoration, no new seeps appeared within the extent of our study area.
Pre-cranberry farm stream channel: A pattern of groundwater seeps forms a chain along the western edge (Figures 4, 5). We interpreted this chain as the footprint of the original pre-farm stream channel. The process of restoration built microtopography over these seeps but did not re-dig a channel through the area of seeps. The main straightened stream channel was dug farther to the east, overlaying the footprint of the main farmed drainage channel. The post-restoration thermal map shows that the chain of groundwater seeps follows the pattern of other seeps throughout the bog: they increased their surface footprint. Given the disturbance of microtopography, the chain of seeps have not reconnected and have not re-formed a distinct stream.
4 Discussion
Our UAS flights were limited by a small window of ideal thermal conditions. With more time, and with the new December 2020 FAA regulations allowing flight at night (FAA rule 14 CFR Part 107, 2021), the potential thermal resolution of groundwater seep mapping (in the United States) can likely be improved beyond what we achieved in this study. Lopez et al. (2021) demonstrated potential new processing methods for achieving spatial accuracy comparable to that of RGB images. Nevertheless, this study demonstrates that groundwater seeps as small as 48 cm can be successfully identified and mapped using commercially available TIR cameras and commercial UAS and processed using established and readily available photogrammetry software.
The analysis of groundwater surface expression and manual generation of comprehensive maps using individual TIR images is a time-consuming process. However, at this juncture, automated mapping from UAS-enabled TIR imagery still contains too many variables to be effective at minimizing errors through automated methods such as those discussed in Glaser et al. (2018). Errors are generated by changing light, changing cloud cover, changing surface and air temperatures, and changing air transmissivity. These factors necessitate the need for ground-truthing and manual calibration of each groundwater surface expression map. Nevertheless, this method creates a higher-resolution close examination of a site than field mapping using the “squishy boot method” (Glaser et al., 2018).
Post-restoration imagery shows that the amount of standing water on the surface increases across the site, the area of surface expression of individual groundwater-source areas increases, and the groundwater-dominant areas increase in size. We acknowledge that both the pre- and post-restoration maps represent a snapshot in time. Time-dependence notwithstanding, the site experienced consistent conditions (Figure 2; Table 1), and those conditions (daily temperature and precipitation) are representative of late winter at the site. Furthermore, we assume that the total influx of groundwater to the site has not changed because of the restoration work. The restoration broke up the thick, dense cranberry mat on the surface, disrupted the permeable sand, surfaced pieces of peat-confining layers, and selectively plugged channels and ditches. The disruption of the peat confining layer was done to allow diffuse groundwater upwelling at the surface. The sand and peat soil mixing at the surface was designed to lower overall permeability at the surface and prevent fast drainage of the soil this process was designed to increase the amount of total groundwater surface expression within the root zone of the site and significantly increased the total amount of ponded water on the site surface. It also increased the thermal impact of the groundwater on surface water bodies. In post-restoration imagery, there is a stark distinction between ponded surface water that has a groundwater component and ponded water that does not. The ponded waters uninfluenced by groundwater are frozen, while the groundwater-influenced pockets remain open liquid water, some with sphagnum moss growing, even in winter.
Our most notable finding is the immobility of groundwater seeps. There were no new groundwater seeps (Figures 5–7) detected across the site, nor within each individual study area, and the seep source locations remained constant. The number of individual groundwater seeps actually decreased slightly. There are two possible explanations for this: first, the resolution of the post-restoration flight was lower, perhaps showing two groundwater seeps that were distinct in 2020 as one larger seep in 2021. Second, it is likely that as the surface expression of individual seeps grew post-restoration, their area overlaps with surrounding seeps, creating a single thermal signal. This is likely because during restoration reconstruction, microtopography creation does not access the bottom of the peat, where we estimate the peat pipes originate (Hare et al., 2015). This implies that restoration does not impact total groundwater discharge, which is not its intent, but it successfully increased its surface expression, variability, and root-zone wetness needed for wetland plants to thrive. The goal of the restoration to trap groundwater onsite at the surface was met. Furthermore, if we assumed that total groundwater discharge has not significantly changed, we can use the groundwater-dominant area as a proxy for groundwater residence time. Therefore, since restoration, the residence time of the groundwater on the site significantly increased–an important finding.
4.1 Groundwater surface expression maps
One unrestored area excluded from intervention (Figure 9), though small, provides unique insight into the effects of artificial microtopography as part of the restoration process. The saturated area shown in Figure 9 appeared to grow by 150 cm, much less than the groundwater seeps that were subjected to restoration via the construction of artificial microtopography (Figures 5–8). From this, we can infer that groundwater seeps do not express as widely on the surface without the aid of microtopography and specifically without the breakup of the highly anisotropic cranberry mat, including less-permeable layers (Hatch and Ito, 2022). As a single sample, this finding should be taken with caution. It can, nevertheless, provide potential indications of groundwater seep behavior at other sites and is worthy of further investigation.
Groundwater seeps, if freed from the flat sand-and-soil layering that was created by cranberry farming practices, will create small ponds and meandering channels that link up of their own accord (Figures 5, 6). Artificial microtopography is all that is needed. The breakup of the surface allows surface flow and interconnection between groundwater seeps. These three examples demonstrate that artificial microtopography is an effective tool in increasing surface groundwater expression on a restored wetland.
The stream channel images (Figures 7, 8) are the most challenging to categorize unilaterally due to the extent of morphological changes within the channels post-restoration. As with the groundwater seep study sites, the locations of groundwater seeps adjacent to the stream channel remained constant, but the area of impact was altered by the restoration. Figure 8 shows one groundwater spring unconnected to the stream channel pre-restoration. Its surface area is small (approximately 60 cm). Post-restoration, the channel meanders much closer to that seep. The seep circumference has increased slightly (by approximately 25 cm) and contributes flow directly into the channel. By contrast, in Figure 7, the opposite phenomenon occurs. A small groundwater seep (<40 cm) discharges within the bed of the stream channel pre-restoration. During restoration, the stream channel migrated to the east, and the bank built up, completely separating the seep from the channel post-restoration. The area of influence for that seep now spreads along the surface away from the stream channel as groundwater reaches the surface and flows out but is no longer connected to the main stream channel. The juxtaposition of these two seeps, one newly connected to the stream channel and the other disconnected, will be of interest to wetland restoration planners. Whether the goal of the restoration is to incorporate groundwater seeps into the channel or to increase their influence across the surface of the site, their location must be considered before and during design.
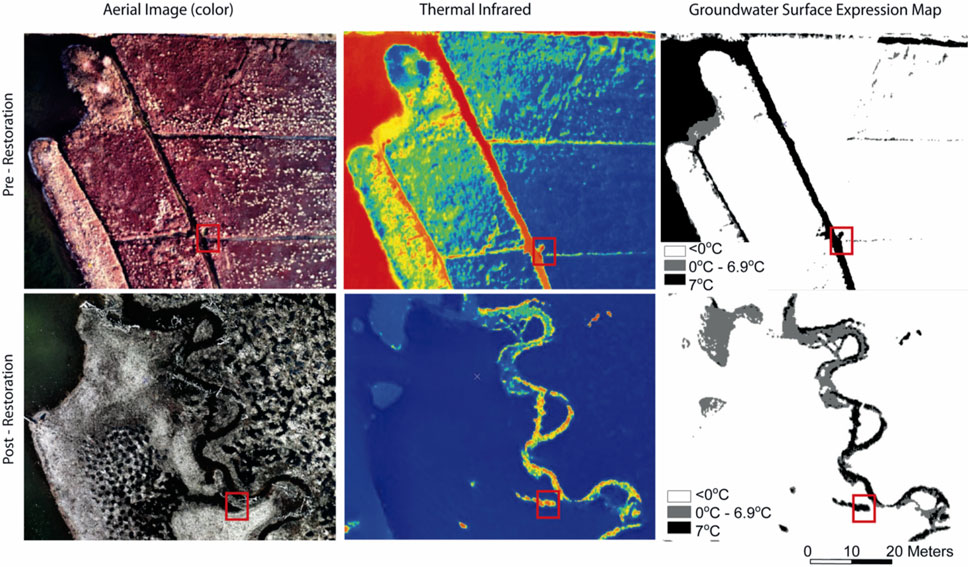
FIGURE 8. Comparative UAS imagery from pre-restoration (top row) to post-restoration at Foothills Preserve, from left to right: (left) plain light (RGB image), (center) thermal infrared, and (right) surface expression of groundwater (black = groundwater and gray = mixing zone). This figure shows an area where the channel was reconstructed from a series of ditches into a meandering channel. The red box indicates a single groundwater seep whose flow direction changed with the movement of the stream channel.
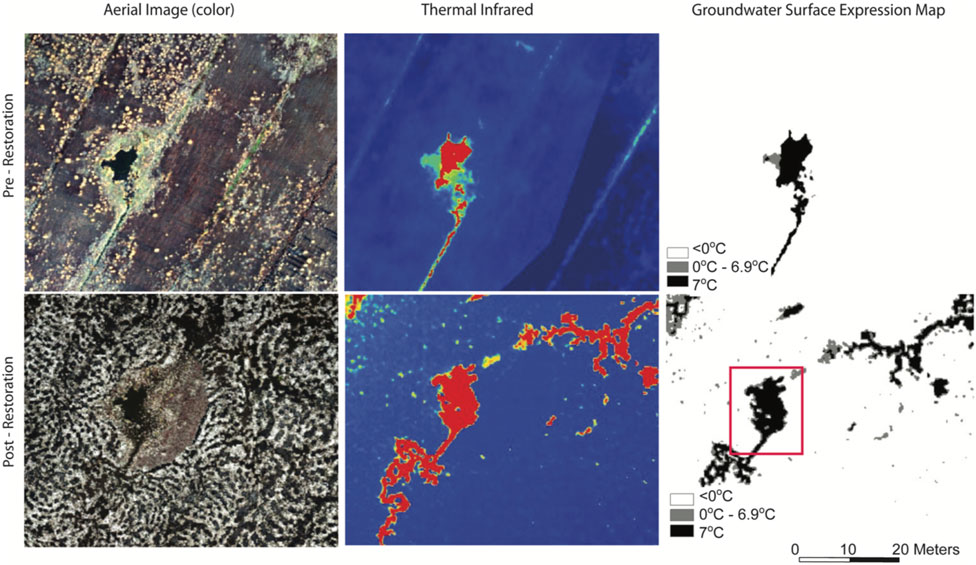
FIGURE 9. Comparative UAS imagery from pre-restoration (top row) to post-restoration at Foothills Preserve, from left to right: (left) plain light (RGB image), (center) thermal infrared, and (right) surface expression of groundwater (black = groundwater and gray = mixing zone). This figure shows a small area in the northeast part of Foothills Preserve that was not altered during restoration. Here, the flow into and out of this area reversed direction as a result of new interconnected flowpaths generated during restoration.
There are two further noteworthy points about stream morphology. The assumed original stream channel that may have existed prior to farming in the northwest portion of the study site (Figures 4, 5) did not create a continuous stream channel since restoration. Microtopography was created in the area, but no channel was dug through the original groundwater seeps. The seeps themselves increased their surface expression, as is consistent with groundwater seeps throughout the site. However, they did not grow enough in surface area to become interconnected. This implies that even if the surface is disturbed, old stream channels will not reestablish themselves without further intervention, despite groundwater influence. If these seeps were targeted for re-connection and that historical channel targeted for re-occupation during restoration interventions, we would likely see a different post-restoration pattern emerge that re-activated this channel.
However, restoration-designed stream channels do not maintain their designed morphology post-restoration. The post-restoration map suggests stream migration outside the designed channel, which includes cutting through the built stream channel and the creation of two oxbows (Figure 8). The stream channel built during restoration in summer 2020 was altered by streamflow and will continue to be altered. The two oxbows that were formed also indicate higher flows than predicted in the restoration design.
5 Conclusion
Handheld thermal imagery can be an effective tool to identify groundwater springs. However on a UAS, TIR imagery can be used to create a thermal map of a study site and its groundwater springs. Additionally, groundwater surface expression maps, adapted from the binary saturation maps described in Glaser et al., 2018, can be generated from TIR maps to estimate the total area of groundwater influence within the map boundaries. This methodology can be applied to any groundwater-fed system to estimate the extent of groundwater impact. Furthermore, due to the speed at which a large area can be covered, this methodology is an efficient way to track seasonal and yearly changes.
At Foothills Preserve, the process of wetland restoration successfully increased the total area of groundwater surface expression. Taking the increased groundwater surface expression as a proxy for residence time, the total groundwater residence time onsite also increased. By increasing the groundwater residence time, we assume that all water has a longer residence time as a result of the restoration process. This success indicates that this wetland will increase local climate resiliency to drought and flooding. It also bodes well for future cranberry bog restorations that will occur in the southeastern Massachusetts region.
Data availability statement
The original contributions presented in the study are included in the article/Supplementary Material; further inquiries can be directed to the corresponding author.
Author contributions
CH conceived the study idea, planned and managed the data collection, and supervised the project. RW and CLW flew the UAS and processed initial TIR imagery. RW established protocols for thermal orthomosaic image processing. CLW processed the groundwater surface expression maps and wrote the manuscript with input from CH.
Funding
This work was supported in part by the USDA National Institute of Food and Agriculture, McIntire-Stennis projects 1009642 and 1021302, and Mass DER ISA # FWEHYDMONEVUMA21A.
Conflict of interest
The authors declare that the research was conducted in the absence of any commercial or financial relationships that could be construed as a potential conflict of interest.
Publisher’s note
All claims expressed in this article are solely those of the authors and do not necessarily represent those of their affiliated organizations, or those of the publisher, the editors, and the reviewers. Any product that may be evaluated in this article, or claim that may be made by its manufacturer, is not guaranteed or endorsed by the publisher.
References
Aguera-Vega, F., Carvajal-Ramirez, F., and Martinez-Carricondo, P. (2017). Assessment of photogrammetric mapping accuracy based on variation ground control points number using unmanned aerial vehicle. Measurement 98, 221–227. doi:10.1016/j.measurement.2016.12.002
Ballantine, K., Anderson, T., Pierce, E., and Groffman, P. (2017). Restoration ofDenitrification in agricultural wetlands. Ecol. Eng. 106, 570–577. doi:10.1016/j.ecoleng.2017.06.033
Danielescu, S., MacQuarrie, K., and Faux, R. N. (2009). The integration of thermal infrared imaging, discharge measurements and numerical simulation to quantify the relative contributions of freshwater inflows to small estuaries in atlantic Canada. Hydrol. Process. 23 (20), 2847–2859. doi:10.1002/hyp.7383
Deitchman, R. S., and Loheide, S. P. (2009). Ground-based thermal imaging of groundwater flow processes at the seepage face. Geophys. Res. Lett. 36, L14401. doi:10.1029/2009GL038103
Dougherty, E. L., and Drickamer, H. G. (1955). A theory of thermal diffusion in liquids. J. Chem. Phys. 23 (2), 295–309. doi:10.1063/1.1741957
Duarte, T., Harold, F., Hemond, H. F., and Frankel, S. (2006). Donald frankel, and sheila FrankelAssessment of submarine groundwater discharge by handheld aerial infrared imagery: Case study of kaloko fishpond and bay, hawai’i: IR sensing of groundwater discharge. Limnol. Oceanogr. Methods 4 (7), 227–236. doi:10.4319/lom.2006.4.227
Garcia-Solsona, E., Garcia-Orellana, J., Masqué, P., Rodellas, V., Mejías, M., Ballesteros, B., et al. (2010). Groundwater and nutrient discharge through karstic coastal springs (castelló, Spain). Biogeosciences 7 (9), 2625–2638. doi:10.5194/bg-7-2625-2010
Glaser, B., Antonelli, M., Chini, M., Pfister, L., and Klaus, J. (2018). Technical note: Mapping surface-saturation dynamics with thermal infrared imagery. Hydrol. Earth Syst. Sci. 22 (11), 5987–6003. doi:10.5194/hess-22-5987-2018
Hansen, B., and Lapham, W. (1992). Geohydrology and simulated groundwater flow, plymouth-carver aquifer, southeastern Massachusetts. Plymouth, England: U.S. Department of the Interior–4204.
Hare, Danielle K., Briggs, A., Donald, O., David, F., Lane, J. W., and Lane, J. W. (2015). A comparison of thermal infrared to fiber-optic distributed temperature sensing for evaluation of groundwater discharge to surface water. J. Hydrology 530, 153–166. doi:10.1016/j.jhydrol.2015.09.059
Harvey, M. C., Hare, D. K., Hackman, A., Davenport, G., Haynes, A. B., Helton, A., et al. (2019). Evaluation of stream and wetland restoration using UASBased thermal infrared mapping. https://www.mdpi.com/2073-4441/11/8/1568.
Hatch, C. E., and Ito, E. T. (2022). Recovering groundwater for wetlands from an anthropogenic aquifer. Frontiers in Earth Science - Hydrosphere, Research topic: Novel approaches for understanding groundwater dependent ecosystems in a changing environment. Available at: https://www.frontiersin.org/articles/10.3389/feart.2022.945065/full.
Hoekstra, B. R., Neill, C., and Kennedy, C. D. (2020). Trends in the Massachusetts cranberry industry create opportunities for the restoration of cultivated riparian wetlands. Restor. Ecol. 28 (1), 185–195. doi:10.1111/rec.13037
Isokangas, E., Davids, C., Kujala, K., Rauhala, A., Ronkanen, A. K., and Rossi, P. M. (2019). Combining unmanned aerial vehicle-based Remote sensing and stable water isotope analysis to monitor treatment peatlands of mining areas. Ecol. Eng. 133, 137–147. doi:10.1016/j.ecoleng.2019.04.024
Johnson, A. G., CraigGlennPeterson, R, William, C., Burnett, R. N., Lucey, P. G., and Lucey, P. G. (2008a). Aerial infrared imaging reveals large nutrient-rich groundwater inputs to the ocean. Geophys. Res. Lett. 35 (15), L15606. doi:10.1029/2008GL034574
Lewandowski, J., Meinikmann, K., Ruhtz, T., Pöschke, F., and Kirillin, G. (2013). Localization of lacustrine groundwater discharge (LGD) by airborne measurement of thermal infrared radiation. Remote Sens. Environ. 138 (119–125). doi:10.1016/j.rse.2013.07.005
Living Observatory. Ballantine, K., Davenport, G., Deegan, L., Gladfelter, E., Hatch, C. E., et al. (2020). Learning from the restoration of wetlands on cranberry farmland: Preliminary benefits assessment. Living Observatory, 1–100. Available at: https://www.livingobservatory.org/learning-report.
López, A., Jurado, J. M., Ogayar, C. J., and Feito, F. R. (2021). An optimized approach for generating dense thermal point clouds from UAV-imagery. ISPRS J. Photogrammetry Remote Sens. 182 78–95. doi:10.1016/j.isprsjprs.2021.09.022
Mallast, U., Siebert, C., Wagner, B., Sauter, M., Gloaguen, R., Geyer, S., et al. (2013). Localisation and temporal variability of groundwater discharge into the dead sea using thermal satellite data. Environ. Earth Sci. 69 (2), 587–603. doi:10.1007/s12665-013-2371-6
Mitsch, W. J., Bernal, B., and Hernandez., M. E. (2015). Ecosystem services of wetlands. Int. J. Biodivers. Sci. Ecosyst. Serv. Manag. 11 (1), 1–4. doi:10.1080/21513732.2015.1006250
Peterson, R. N., Burnett, W. C., Glenn, C. R., and Johnson, A. G. (2009). Quantification of point-source groundwater discharges to the ocean from the shoreline of the big island, Hawaii. Limnol. Oceanogr. 54 (3), 890–904. doi:10.4319/lo.2009.54.3.0890
Rautio, A., Kivimäki, A. L., Korkka-Niemi, K., Nygård, M., Salonen, V.-P., Lahti, K., et al. (2015). Vulnerability of groundwater resources to interaction with river water in a boreal catchment. Hydrol. Earth Syst. Sci. 19 (7), 3015–3032. doi:10.5194/hess-19-3015-2015
Schuetz, T., and Weiler, M. (2011). Quantification of localized groundwater inflow into streams using ground-based infrared thermography: Quantification of groundwater inflow. Geophys. Res. Lett. 38 (3). doi:10.1029/2010GL046198
Shaban, A., Khawlie, M., Abdallah, C., and Faour, G. (2005). Geologic controls of submarine groundwater discharge: Application of Remote sensing to north Lebanon. Environ. Geol. 47 (4), 512–522. doi:10.1007/s00254-004-1172-3
Stone, B. D., Stone, J. R., DiGiacomo-Cohen, M. L., and Kincare, K. A. (2011). Surficial geologic map of the norton-manomet-westport-sconticut neck 23-quadrangle area in southeast Massachusetts. U.S. Geol. Surv. Open-File Rep. 2006–1260–F, 21 Sheets. Scale 1:24,000.
Torgersen, C. E., Faux, R. N., McIntosh, B. A., Poage, N. J., and DouglasNorton, J. (2001). Airborne thermal Remote sensing for water temperature assessment in rivers and streams. Remote Sens. Environ. 76 (3), 386–398. doi:10.1016/S0034-4257(01)00186-9
Yu, J. Jin, DongKim, W., Lee, E. J, and Son, S. W (2020a). Determining the optimal number of ground control points for varying study sites through accuracy evaluation of unmanned aerial system-based 3D point clouds and digital surface models. Drones 4 (3), 49. doi:10.3390/drones4030049
Keywords: thermal infrared (TIR), wetlands, groundwater–surface water interaction, UAS (unmanned aircraft system), UAV (unmanned aerial vehicle), photogrammetry, cranberries, restoration
Citation: Watts CL, Hatch CE and Wicks R (2023) Mapping groundwater discharge seeps by thermal UAS imaging on a wetland restoration site. Front. Environ. Sci. 10:946565. doi: 10.3389/fenvs.2022.946565
Received: 17 May 2022; Accepted: 05 December 2022;
Published: 01 February 2023.
Edited by:
Elena Moltchanova, University of Canterbury, New ZealandReviewed by:
Metin Turan, Yeditepe University, TürkiyeCopyright © 2023 Watts, Hatch and Wicks. This is an open-access article distributed under the terms of the Creative Commons Attribution License (CC BY). The use, distribution or reproduction in other forums is permitted, provided the original author(s) and the copyright owner(s) are credited and that the original publication in this journal is cited, in accordance with accepted academic practice. No use, distribution or reproduction is permitted which does not comply with these terms.
*Correspondence: C. Lyn Watts, Y3dhdHRzQHVtYXNzLmVkdQ==
 C. Lyn Watts
 Christine E. Hatch
 Ryan Wicks2