 Angzu Cai1,2,3
 Haixia Zhang
- 1College of Energy and Environment Engineering, Hebei University of Engineering, Handan, China
- 2Hebei Key Laboratory of Air Pollution Cause and Impact, Handan, China
- 3College of Environmental Science and Engineering, Tongji University, Shanghai, China
- 4China Construction Technology Group Co., Ltd. Shenzhen Branch, Shenzhen, China
- 5China Gezhouba Group Co., Ltd., Wuhan, China
- 6School of Information and Electrical Engineering, Hebei University of Engineering, Handan, China
Receptor models are rarely utilized in atmospheric deposition but are often used to identify pollutant sources and quantify their contributions. This article focuses on the soil in atmospheric deposition in a typical polluted city. Atmospheric deposition has become an important route for exogenous heavy metals’ input into ecosystems. In this study, the heavy metals in atmospheric deposition were determined in three monitoring points arranged in Handan City. According to the functional area, fluxes, sources, and accumulation in the soil were explored. The sources of heavy metals were identified by PMF (positive matrix factorization) and UNMIX. The accumulation of heavy metals in the soil was predicted. The results showed that the deposition fluxes in industrial areas were higher than other functional areas. The mean concentrations of 8 heavy metals (Cd, Cr, Cu, Mn, Ni, Pb, Zn, and As) in the atmospheric deposition exceed their background values. PMF identified five major sources and UNMIX analyzed four sources. Similar source apportionment results were acquired via PMF and UNMIX, which were the combustion of fossil fuels, steel-smelting emission, road dust, and industrial sources. Steel-smelter emission was the highest source contributor. Therefore, combining these two models was the most effective approach, and more attention should be paid to mitigating the pollution caused by the industrial activities. The prediction indicated that the accumulation of heavy metals from atmospheric deposition to the soil would increase in 30 years, the growth rate of Cd increased significantly. The results of this study could provide reference in reduction of heavy metal pollution in atmospheric deposition.
1 Introduction
In recent years, with the development of socio-economic activities in China, urban air pollution in many cities regions like the Beijing–Tianjin–Hebei region (BTH) has become serious. Atmospheric environment has been heavily contaminated by anthropogenic activities such as industrial emissions, vehicle transportation, and coal burning (Shi et al., 2011; Okubo et al., 2013; Hou et al., 2019). Heavy metal pollutants are discharged into the atmosphere and adsorb aerosols, eventually returning to the surface-soil environment through dry and wet atmospheric depositions. Atmospheric deposition is the main channel for metals to exchange between surface soils and atmosphere, etc. (Akhter and Madany 1993; Duan et al., 2010; Pan and Wang. 2015). Heavy metals in atmospheric deposition accumulate in soil, water bodies, and plants in different forms, which can cause serious effects on ecosystems and pose a threat to human health through intake and the food chain (Lee et al., 2013; Guo et al., 2018; Fausak et al., 2021). Low concentrations (0.25 μmol/L) of Cd promote an abnormal proliferation of hepatocytes to induce liver cancer, while high concentrations (>5 μmol/L) of Cd will lead to acute apoptosis in many organs and tissues (Yang et al., 2007; Kundu et al., 2013). It is very necessary to monitor the deposition fluxes and identify the source of heavy metals in atmospheric deposition.
Previous studies are limited primarily to the relationship between meteorological conditions and atmospheric deposition fluxes of heavy metals but a few studies focused on the relationship between heavy metal concentration in atmospheric deposition and their contents in soils (Liang et al., 2017; Feng et al., 2019). It is generally believed that the heavy metals in atmospheric deposition are not enough to cause harm to the ecological environment due to their small amount and density. Some researchers found that atmospheric deposition was an important source of heavy metals in the soil in China (Lu and Qiu, 2014; Sun et al., 2016; Wang et al., 2019a). Feng et al. (2019) conducted a study which showed that the input of different heavy metals by atmospheric deposition accounted for 38.66%–84.57% of the total input amount in China (Feng et al., 2019). Li et al. (2014) assessed the impacts of atmospheric deposition on the soil environment in the urban area of Nanjing and found that Pb in the surface soils was obviously affected by atmospheric deposition. Wang et al. (2019b) forecasted that the Cd concentration in the soil of Chongqing would increase 26% in 100 years from atmospheric deposition. According to the aforementioned research studies, heavy metals in atmospheric deposition accumulate in the soil and cannot be ignored.
Source apportionment of heavy metals in atmospheric deposition can serve as a basis for better management of air quality. Receptor models are commonly used for identifying heavy metal sources (Mijić et al., 2010; Jain et al., 2017; Guan et al., 2019). UNMIX is one of the receptor models recommended by USEPA, which uses self-modeling curve resolution (SCMR) to determine the results of source contribution and apportionment (Kim and Henry 2000; Henry 2003). PMF (positive matrix factorization) estimates the source component based on a weighted-least-squares method and decomposes sample data into ‘factor-contribution’ and ‘factor-component’ matrices. UNMIX and PMF have been wildly used for identifying the source apportionments of heavy metals in atmospheric particulate matter and soils due to their simplicity and relative accuracy (Sharma et al., 2016; Jain et al., 2017; Deng et al., 2018). Rai et al. (2020) qualified the 26 elements in airborne particles in Delhi and identified the nine different sources of elements in PM2.5/10 by using PMF. Rabha et al. (2022) used PMF for source apportionment which reveals the contributions of five significant sources of PM10 mass in the urban area of Jorhat, which found that coal combustion and vehicular emission followed by biomass burning, soil dust, and industrial emission were the main sources. To improve the precision, the application of different multivariate receptor models to source apportionment has been a hot topic in recent years. Jain et al. (2021) used three different multivariate receptor models (PCA-APCS, UNMIX, and PMF) and compared the results of those models to better understand the probable sources of PM2.5 and PM10 in New Delhi, which all confirmed secondary aerosols, vehicular emissions, biomass burning, and soil dust as the main sources. To the best of our knowledge, there was a lack of assessment of the differences in different receptor models for source apportionment of heavy metals in atmospheric deposition. In this study, we compared the results from UNMIX and PMF. This comparative analysis allows us to increase the coverage , and refinement, of heavy metals in atmospheric deposition source-apportionment while enhancing our understanding of the two receptor models.
Handan is a frequent and hardest hit area of atmospheric pollutants in China (Wang et al., 2014; Yang et al., 2018; Cai et al., 2021). Previous research on air pollution in Handan mainly focused on ambient, fine air-particulate matter and the soil. Zhang et al. (2021) and Cai et al. (2021) found that the industrial source was the main source of heavy metals in the soil and PM2.5 in the Handan urban area, which account for 53.77% and 47.94%, respectively. The local industrial dust really had significant impacts on the concentration of heavy metals in the environment. Hence, in this study, the main objectives were: 1) to determine the fluxes of monthly atmospheric deposition; 2) to detect the concentration of metals (Al, Fe, Cd, Cr, Cu, Mn, Ni, Pb, Zn, and As) and calculate the heavy metals fluxes in atmospheric deposition; 3) to identify the sources of heavy metals in atmospheric deposition, quantitatively estimate the source contribution, and compare the applicability of the PMF and UNMIX; and 4) to predict the accumulation of heavy metals in atmospheric deposition for soil.
2 Material and methods
2.1 Sampling site
Handan is located in North China Plain, bordering Shandong, Henan, Shanxi, and Hebei provinces. Moreover, Handan is one of the 10 cities with the most air-polluted cities in China. The total urban area in Handan is 419 sq. km, with a resident population of 9,413,990 in 2021. Handan is characterized by a typical temperate continental climate with an average annual temperature of 13.5°C. Heavy industry is the pillar industry of Handan. In 2018, the crude steel production was 4.12 × 10⁷ t, which accounted for 17.40% of the production in the Hebei Province and 4.50% of the total steel production in China. The steel production in Handan was equivalent to the scale of Brazil. The iron and steel industry consumes a large volume of raw material and energy for producing steel, such as coal, liquefied natural gas (LNG), and liquefied petroleum gas (LPG), and discharges various types of pollutants. In order to understand the spatial distribution characteristics of atmospheric deposition in Handan, 3 deposition-monitoring stations were established from a variety of functional zones: KY, DW, and HG, which represent education area, residential area, and industrial area, respectively (Figure 1). KY was located on the roof of the experimental building of Hebei University of Engineering (N36.57°, E114.50°), at 18 m above ground level. There are universities such as Hebei University of Engineering, Handan University, and Handan Polytechnic College near KY, which represents education area. DW was on the roof of the China Unicom Building (DW, N36.61°, E114.53°), about 160 m far away from heavy-traffic roads, where there were residential areas, restaurants, and shopping malls in the surrounding area. Thus, DW represents the residential area of Handan. HG was at the top floor of the sewage treatment station of HBIS Group HanSteel Company (N36.60°, E114.44°) at a height of about 15 m from the ground. There were some heavy industrial enterprises such as steel smelter, coking plant, and metallurgical machinery factory in the surrounding area of HG, which represents the industrial area.
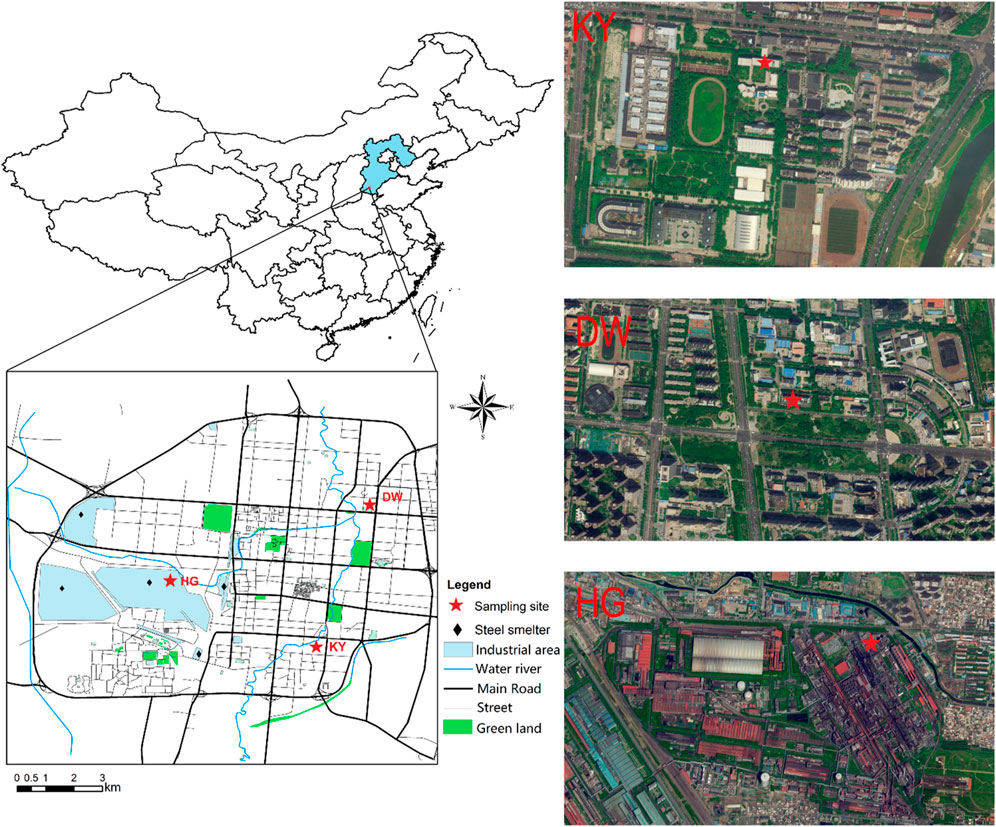
FIGURE 1. Location of the study area and distribution of sampling sites.
2.2 Sample collection
Automatic collection of deposition sampler (Tisch, United States, TE-78-100) was used to collect atmospheric deposition samples, equipped with PTFE barrels (r = 26 cm). The PTFE barrels were soaked in HCl for 24 h and thoroughly sterilized with 70% ethanol before use. Samples had been collected monthly (30 ± 2 days) for 2 years. After each rain event, the wet deposition was collected and filtered through a 0.45 μm filter membrane. The filtrates were heated to a constant weight (at 105°C ± 5°C) and combined to the dry depositions at the current month. Plant roots, insect cadavers, and other debris were removed before analysis. A total of 72 atmospheric deposition samples were collected from December 2017 to November 2019.
2.3 Chemistry analysis
Samples of atmospheric deposition were weighed to approximately 500 mg and placed in a PTFE digestion tank, to which3 ml HNO3, 3 ml HCl, and 1 ml HF were added. The tank was sealed and digested at 180°C for 2.5 h. After digestion, the tank was cooled to room temperature and opened. Then the digestion tank was heated again at 150°C by an electric warming plate (EH20A plus, LabTech, China) until the solution evaporated to almost dryness. The capacity was fixed to 100 ml by adding dilute HNO3 (3%) after cooled to room temperature. About 50 ml of the solution was transferred to reagent bottle for analysis. The contents of nine metals including Al, Fe, Cu, Mn, Zn, Cd, Cr, Pb, and Ni were measured by inductively coupled plasma mass spectrometry (ICPMS, XSERIES 2, Thermo Fisher Scientific, United States), as was measured by an atomic fluorescence spectrometer (AFS-230E, Runqee, China). A blank test without any sample was also conducted simultaneously.
2.4 Quality assurance and control
Quality assurance (QA) and control (QC) involved triplicate analyses of the samples and certified reference materials, which included the standard soil-reference materials (GSS-8 obtained from the National Standard Detection Research Center, Beijing, China). Rh was added as an internal standard to ensure instrument stability and to avoid matrix effects. To ensure the reliability and quality of the data, the recovery values of 10 metals of standard loess reference (GBW07408) ranged from 92% to 105%. The minimum detection limits (MDLs) for Cd, Cr, Cu Mn, Ni, Zn, Pb, and As were 0.03 mg/kg, 0.4 mg/kg, 0.02 mg/kg, 0.3 mg/kg, 0.6 mg/kg, 2.0 mg/kg, 2.0 mg/kg, and 0.4 mg/kg, respectively.
2.5 Atmospheric deposition flux
The atmospheric deposition flux was calculated as follows.
where
2.6 Source apportionment
2.6.1 Enrichment factor
The enrichment factor (EF) explains the metal enrichment degree in atmospheric deposition. A strong enrichment degree indirectly reflects the effectiveness of accumulation of allochthonous and autochthonous matter, and this accumulation is often identified with anthropogenic sources (Chen et al., 2019a). The EF value for elements in atmospheric deposition samples was thus calculated as follows (Hu, 2013):
where
2.6.2 PMF
PMF was developed by Paatero and Tapper (1994) and recommended by USEPA as a source apportionment model. PMF bases on the uncertainty profile to weight data point by point without source emission inventory. A dataset with n samples and m species will be decomposed as a matrix X with dimensions n × m when it is imported into the PMF model. The model decomposes the original matrix
where
2.6.3 UNMIX
The algorithms of UNMIX were based on non-negativity constraints and the singular value decomposition (SVD) method, which were used to reduce the dimension of data space identified the number of sources (Henry, 2003). More information details can be seen in the User Guide of UNMIX (Norris et al., 2007). UNMIX is expressed as:
where U is
Considering that the element’s concentration in atmosphere deposition were of excessive difference, which could influence the analysis result of UNMIX. Therefore, to eliminate the influence of the excessive difference of the heavy metal concentrations in the atmosphere deposition, min–max normalization was performed on the concentration data. The data had no dimension and ranged between 0 and 1.
2.7 Heavy metal accumulation
The heavy metal concentration in the soil around each atmospheric deposition sampling site can be seen in our previous study (Zhang et al., 2021). Here, we propose an assessment model to evaluate the accumulation of heavy metals from atmospheric deposition in the soil (more details are shown in Supplementary Material S1).
where
3 Results and discussion
3.1 Characteristic of atmospheric deposition
3.1.1 Total atmospheric deposition fluxes
The monthly change series of the total atmospheric deposition fluxes are shown in Figure 2. The atmospheric deposition fluxes reached the highest value in autumn and winter, followed by spring, and decreased to the lowest value in summer. The annual deposition fluxes in the three sampling sites were calculated and compared with other regions (Table 1). The fluxes of all the three sites were higher than Xiangtan but lower than those in Beijing, Yinchuan, and Suzhou (Yao et al., 2017; Feng et al., 2019; Kai et al., 2020; Li et al., 2021). However, atmospheric deposition fluxes in Handan were much higher than Korea and the United States (Yi et al., 2006; Lee et al., 2015). Overall, these results indicated that the Handan had elevated atmospheric deposition fluxes. Studies (Chen et al., 2019a; Feng et al., 2019) showed that atmospheric deposition fluxes were influenced by seasonal climate and weather patterns. Handan has a typical temperate continental climate, with abundant precipitation and high air humidity, and the urban vegetation flourishes in summer. Atmospheric particle was not easy to deposit, while autumn and winter have the characteristics of dry air, windy, sparse vegetation, and atmospheric particle which are relatively easy to sediment. So, atmospheric deposition fluxes were higher in autumn and winter than summer. There were differences in the atmospheric deposition flux in different functional areas. The monthly atmospheric deposition fluxes in the three functional areas were in the order of industrial area (6.08 g/m2) > residential area (4.37 g/m2) > educational area (4.05 g/m2). The atmospheric deposition fluxes in the industrial area were 39.13% and 50.12% higher than that in the levels in the residential area and educational area, which indicated that the amount of atmospheric deposition was mostly influenced by industrial activities. Particulate matter was discharged into the atmosphere through the chimney and entered the soil in the form of deposition, which maybe caused the large atmospheric deposition in this industrial area. The similar trend was also found in numerous Chinese studies. Chen et al. (2019b) studied the spatial and temporal variations of atmospheric deposition flux in the Lihe River watershed, the results showed that the annual total depositions for the four different land-use types followed the order: urban > suburban > rural > woodland, because urban areas have well-developed transportation and industrial activities. Yang et al. (2017) found that the annual deposition fluxes in different functional areas in Xi’an city were in the order: industrial > commercial area > residential area > cultural educational area > tourist areas.
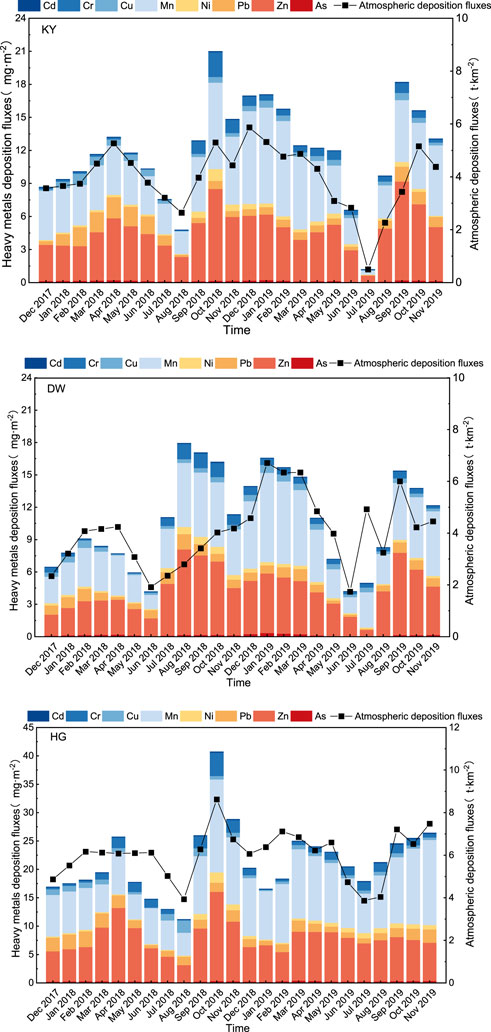
FIGURE 2. Fluxes of atmospheric deposition and heavy metals at KY, DW, and HG.
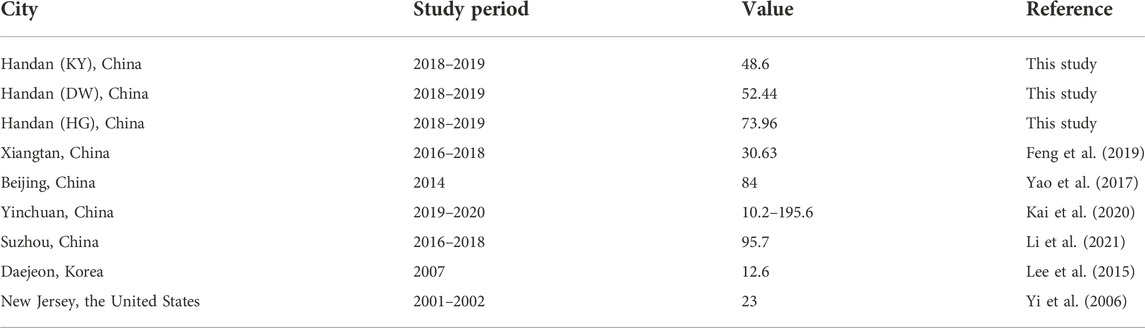
TABLE 1. Atmospheric particle mass dry-deposition fluxes within and outside China (t km−2·a−1).
3.1.2 Concentration of metals
The average concentrations of 10 metals in atmospheric deposition in 3 sampling sites over a 2-year period decreased in the following order: Fe (7.61 g/kg)>Al (3.53 g/kg) > Mn (1,259.09 mg/kg) > Zn (1,104.95 mg/kg) > Pb (223.97 mg/kg) > Cr (137.57 mg/kg) > Cu (107.35 mg/kg) > Ni (72.14 mg/kg) > As (39.51 mg/kg) > Cd (6.73 mg/kg). More detailed data of metal concentrations among these 3 sites can be seen in Supplementary Table S1. In addition to the Al, the concentration of the other nine metals exceeded the background value. The average concentration of Cd, Pb, and Zn in atmospheric deposition exceeded the soil background values of the Hebei Province by119.35, 10.92, and 14.37 times, respectively. These results indicated that human activities such as industries and traffic in urban area had strong effects in the concentration of heavy metals in atmospheric deposition. The time series of heavy metal concentration in atmospheric deposition are shown in Supplementary Figure S1. Concentration levels were higher in winter (Dec, Jan, and Feb) and spring (Mar, Apr, and May) than that in summer (Jun, Jul, and Aug) and autumn (Sep, Oct, and Nov). The prevailing wind direction in Handan is westerly and northwesterly in the winter. Handan lies on the east side of the Taihang Mountain and pollutants were difficult to diffuse by the hindrance.
Heavy metal concentrations were also different among the functional areas; the industrial area contained the highest concentrations of Cd, Cr, Cu, Mn, Pb, and As, while the residential area had the highest concentrations of Ni and Zn, whereas the educational area exhibited the lowest average heavy metal concentrations. For heavy metals in atmospheric depositions, industrial emissions were the major source, followed by vehicle emissions and coal burning in China. There are many smelters, machinery factories, and coking plants in the industrial area, and heavy transportation, which may cause the high concentration of heavy metals in atmospheric deposition.
3.1.3 Heavy metal fluxes in atmospheric deposition
The monthly heavy metal atmospheric deposition fluxes in three sampling sites are shown in Table 1 that heavy metal atmospheric deposition fluxes are in the order of Mn > Zn > Pb > Cr > Cu > Ni > As > Cd, which was consistent with previous studies (Hou et al., 2014; Chen et al., 2019a). The deposition fluxes of Mn and Zn were larger than other heavy metals, accounting for 48.98% and 33.11% of the total fluxes, respectively. All the eight kinds of heavy metal deposition fluxes in industrial areas were significantly higher than in living and educational areas, which exceeded the sum of deposition fluxes from KY and DW sampling sites. The effect of multiple pollution sources was particularly obvious in the industrial area in Handan. As a typical heavily polluted city in the North China plain, high elevated atmospheric deposition of Cd and Cr should be notable.
Although there were some differences in the fluxes of heavy metals among the three sites, the temporal distributions remained consistent. During the study period, the heavy metal fluxes in winter accounted for 37.69–62.88% (54.25% on average) of the annual amount. Chen et al. (2019b) and Feng et al. (2019) conducted studies that showed that atmospheric deposition fluxes were affected by seasonal climates and weather patterns (Chen et al., 2019a; Feng et al., 2019). Due to the temperate continental climate in Handan, abundant precipitation, high air humidity, and the flourishing urban vegetation in summer and autumn, the atmospheric deposition is not easy to blow up. While spring and winter have characteristics with dry air, windy, and sparse vegetation, the atmospheric deposition easily rises with the wind. Thus, atmospheric sedimentation fluxes are higher in spring and winter relative to summer and autumn.
3.1.4 Enrichment factors
Identifying the enrichment of heavy metals in atmospheric deposition could provide assistant information to anthropogenic sources. The greater the enrichment factors, the greater the degree of heavy metal enrichment. As presented in Figure 3, The nine studied heavy metals had average enrichment factors greater than 5, and the enrichment factors of Cd, Cu, Pb, Zn, and As were greater than 10, which indicated that the study area was impacted by anthropogenic activities. EF values for Cd were the highest (mean 398.33), which could be considered as a very severe enrichment. Cd was severely influenced by anthropogenic activities. EF values of Zn, Pb, Cu, and As were 54.19, 43.41, 22.10, and 11.74, respectively. Hence, these heavy metals were classified as severe enrichment. The mean EF values for Cr, Mn, and Ni were less than 10. It should be mentioned that the EF value of Cr in the industrial area was distinct when compared with the other two areas (Figure 3), this indicated that the iron and steel smelting activities imposed an environmental burden.
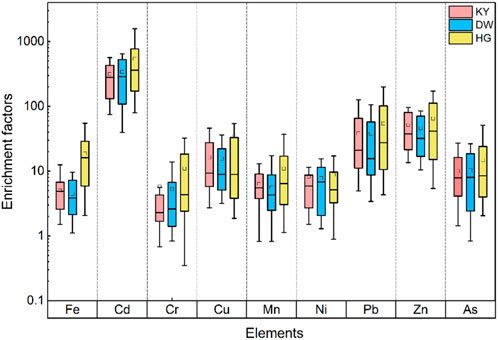
FIGURE 3. Enrichment factors of metals in atmospheric deposition.
We have found that the enrichment factors for different functional areas were quite different. The characteristics of enrichment factors were basically similar with the deposition fluxes. The enrichment factors of heavy metals in the industrial area were significantly larger than those of other functional areas. Chen et al. (2019a) also found that the mean EF of Cd in atmospheric deposition in the Taihu region was over 190 associated with industrial activities. The EF values of Cd in atmospheric deposition in Beijing were >32 (Guo et al., 2018), which were classified as re-suspended dust.
3.2 Source apportionment of PMF and UNMIX
3.2.1 Source identification
The PMF model calculates the signal-to-noise ratio (S/N) based on the concentration and uncertainty of the species. The S/N of metals data after initial loading was greater than 2, defined as strong. The factor numbers of the metals were debugged many times and were determined as five factors. The fitting coefficient of the observed/estimated concentration of the species was greater than 0.5. The difference between the Q value and the theoretical Q value was less than 10% and the residual values were between −3 and 3. The values of applicability diagnostic indicators for UNMIX (R2 = 0.80, S/N = 2.46) conformed to the user guides of UNMIX. No species was suggested and the four sources were analyzed by UNMIX. The source component results of metals from PMF and UNMIX are shown in Figure 4.
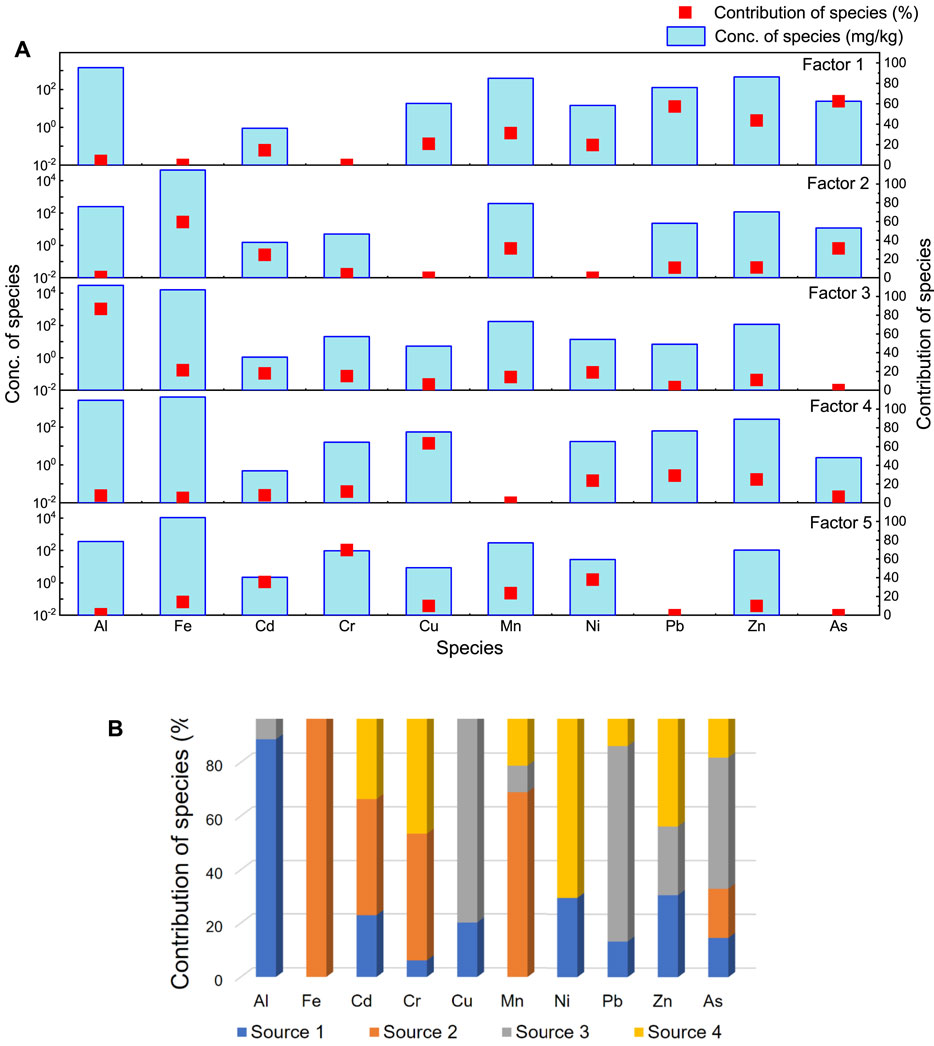
FIGURE 4. Source composition by PMF and UNMIX: (A) the source composition by PMF; (B) the source composition by UNMIX.
Factor 1 of PMF was strongly concentration-loaded with Pb, Zn, and As, which was significantly correlated with Source 3 (mainly Cu, Pb, Zn, and As) of UNMIX. Pb is an important heavy metal by the discharge of civil coal-combustion emissions and the combustion of fossil fuels (Ge et al., 2014; Cui et al., 2019). Zn was typical component of industrial and incinerator emissions (Tunno et al., 2015), as was the heavy metal characteristic of coal burning. Handan distributed a large number of coal-fired enterprises such as thermal power plants, smelters, and coke enterprises. Heating in winter and combustion of scattered coal in rural areas were also a contributor to the source. Therefore, the factor 1 of PMF and source 3 of UNMIX were considered as the combustion of fossil fuels (coal and oil) (CF).
Factor 2 of PMF had a significant correlation with source 2 of UNMIX, and the high-concentration loading were Fe, Cd, and Mn. Combined with the flux analysis and enrichment factors, the high Fe loading may point to the steel smelting process. Hansteel located in Handan produced 4.124 million tons of coarse steel, accounting for 17.4% of production in Hebei and 4.5% of the total national production in 2018, which was equivalent to the eighth largest steel-producing country in the world. Lu et al. (2006) analyzed the heavy metal sources in atmospheric particulates in Wuhan which showed that smelting and steel production were the main sources of Cd in industrial areas. Mn is easily enriched during iron ore formation due to a similar atomic radius, chemical morphology, and the same group as Fe (Xu and Tao, 2004). So, factor 2 of PMF and source 2 of UNMIX can be identified as steel smelting emission (SS).
Factor 3 of PMF was high-concentration loading with Al, and it correlated with source 1 of UNMIX, which can be identified as road dust. A previous study demonstrated that metals in road dust could come from different sources, such as fuel-combustion products, tire wear products, brake lining, road-building materials, crustal particles, etc. (Mijić et al., 2010). The physicochemical properties of Al are stable, meanwhile, the mean and median concentrations of Al in atmosphere deposition in the studied region do not exceed the corresponding soil background values in the Hebei province. The high concentration loading of Al can mainly arise from natural sources such as dust from local soils and pavement erosion (Ramírez et al., 2019; Mohammad et al., 2022). Al was one of the main crustal elements, which may have been present in dust re-suspended by traffic (Balachandran et al., 2000; Sharma et al., 2020; Jain et al., 2021). At the same time, with the urban expansion and internal construction, there were large areas of construction sites and bare land surfaces in the city; this was also an important source of dust. Consequently, we can argue that factor 3 of PMF and source 1of UNMIX were road dust (RD).
Factor 4 of PMF mainly loaded with Cu had no correlation with any source of UNMIX. Studies have indicated that the main source of particulate matter-bound Cu released into the atmosphere is from petrochemical, machining, and combustion of heavy oil (Sharma et al., 2016; Cai et al., 2019; Guan et al., 2019). The next probably atmospheric Cu source was coal combustion (Wang et al., 2019a; Yang et al., 2020). Meanwhile, Cu is used as tracers of the brakes of motor vehicles. Considering the high enrichment factor and atmospheric flux of Cu in the industrial area, therefore, the factor 4 of PMF might relate with heavy oil combustion and traffic emission (called mixed source, MS).
Factor 5 of PMF and Source four were characterized by the high concentration loading of Cd, Cr, Ni, and Zn. These metals were typical industrial-emission elements. Cd had the highest enrichment factor, which indicated that it was affected by extremely severe human activities (Rai et al., 2020; Rabha et al., 2022). At the same time, relevant studies have shown that metal processing and the chemical industry were an important contributor for Cd (Qing et al., 2007; Yang et al., 2016; Othman et al., 2019; Wu et al., 2021). The deposition fluxes of Cd and Cr in the industrial area were much higher than the other two functional areas, therefore, factor 5 of PMF and source four of UNMIX can be identified as industrial sources (IS).
Source proportion of different sources by PMF and UNMIX were shown in Figure 5. Road dust and industrial source identified by PMF and UNMIX were the main sources, which accounted for 41.29% and 40.22% (PMF), 31.17% and 30.22% (UNMIX), respectively (Figure 5). The steel smelting emission was the region’s pillar industry, which resulted in substantial fossil fuel combustion and the emission contained heavy metals. Vehicles driving in and out of the site were important sources of road-dust re-suspension. The PMF analysis identified one additional source, mixed source (dominated by Cu), which was not quantified by UNMIX. The differences are caused by the different theoretical procedures for source recognition employed by the receptor models, which mainly arises from a model’s constraints when selecting species for the designated variables observed.
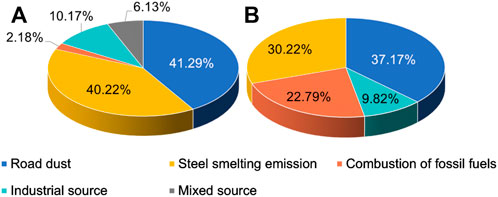
FIGURE 5. Source proportion of different sources by PMF and UNMIX: (A) the proportion of different sources by PMF; (B) the proportion of different sources by UNMIX.
3.2.2 Comparison of PMF and UNMIX
PMF and UNMIX had been proven to be useful and common receptor models for heavy metal source apportionment. In order to better understand the sources of heavy metals in atmospheric deposition, the results of the 2 receptor models were compared and assessed.
This study will provide more comprehensive information of heavy metal sources in the atmospheric deposition of a heavy industrial city. It is generally believed that the following conditions must be fully considered when comparing different models: the numbers and characteristics of identified sources, the contribution of each source to heavy metals, and the fitting degree between the measured and estimated values of the heavy metal concentration.
From the perspective of source identification, the source apportionment results of PMF and UNMIX were generally consistent in this study, both of them identified the combustion of fossil fuel, road dust, mixed source, and industrial source. In addition, PMF subdivided low-concentration metals such as Cu, Pb, Zn, and As to the combustion of fossil fuels and mixed source. UNMIX identified only four sources due to the UNMIX solution is greatly reliant on the selected species. UNMIX adds the contribution of the high-recognized source to compensate the low during operation, which is a relatively coarse means of down-weighting outliers. On the other hand, PMF tends to estimate the data error by weighting the uncertainty data of point-by-point least squares minimization scheme and retains as many species as possible to achieve a more accurate prediction effect. This is similar to previously published research studies (Jain et al., 2017; Guan et al., 2019; Jain et al., 2021).
The fitting degree of PMF and UNMIX is shown in Table 2. In general, the ratio of fitted values to measured values is distributed at about 1, indicating that the receptor model of species demonstrates a suitable predication performance. PMF and UNMIX models fitted the data well with r2 ranging from 0.63 to 0.99 (Table 1). PMF was better predicted by heavy metals with an agreement between predicted averagely and mean r2 = 0.89. The average E/M by PMF of all species was bigger than that of UNMIX, which demonstrates that PMF is more effective at identifying individuals. Overall, the applicability of PMF and UNMIX in source apportionment of heavy metals in atmospheric deposition was proved. PMF had better diagnostic accuracy in this study, which maximally retains the missing heavy metal data and below detection-limit values. Furthermore, PMF considers data uncertainty in its assessment of the quality and reliability of each data point. In this study, the concentrations of Cu were low, and the concentrations of Al and Fe were the highest, thus, of the two models, UNMIX had the highest steel-smelting emission and road dust-related contribution. Considering that the difference between the two models may be due to different algorithms, multiple models should be used to identified the pollutant sources in future research.
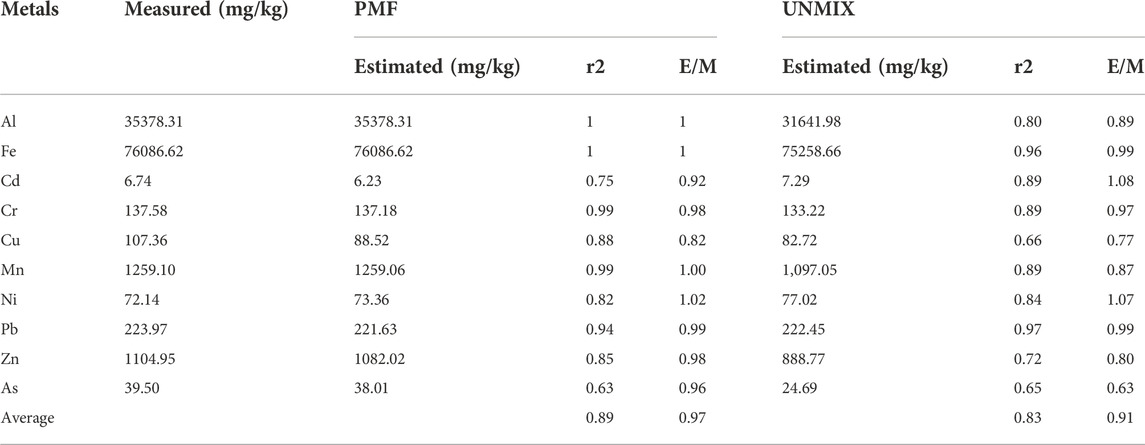
TABLE 2. Comparison of the fitting degree of PMF and UNMIX.
3.3 Accumulation in the soil
The input of heavy metal elements from atmospheric deposition into the soil would increase the content of heavy metals, because of the average concentrations of 8 heavy metals in atmospheric deposition is higher than the soil background value. We predicted the changes of heavy metal concentration in the soil in 30 years, which are shown in Figure 6A. Compared with the current concentration in the soil, the relative increase concentration of total heavy metals in the soil will increase 1.30% (KY), 1.73% (DW), and 2.33% (HG) after 30 years. The accumulation in HG was significantly higher than the other site, which indicted that industry and related activities in the industrial area caused pollution that is potentially accumulated in the soil. It is worth mentioning that the relative increased concentration of Cd was 97.59% (KY), 82.54% (DW), and 137.49% (HG) after 30 years (Figure 6B). The average Cd concentration in atmospheric deposition in the 3 sampling sites was 5 mg/kg, which was much higher than the current concentration in the soil. The annual atmospheric deposition fluxes of Cd ranged from 0.02 mg/m2 to 0.06 mg/m2 in the urban area of Handan. According to the specification of land quality geochemical assessment (DZ/T 0295-2016), when the annual Cd input is less than 3 mg/m2, the impact of atmospheric deposition on the soil environment quality can be ignored. However, the Cd concentration in atmospheric deposition which was much beyond the soil background value should be concerned in a long time. So, the city administration should take measures to release the heavy metal pollution and protect the urban environment.
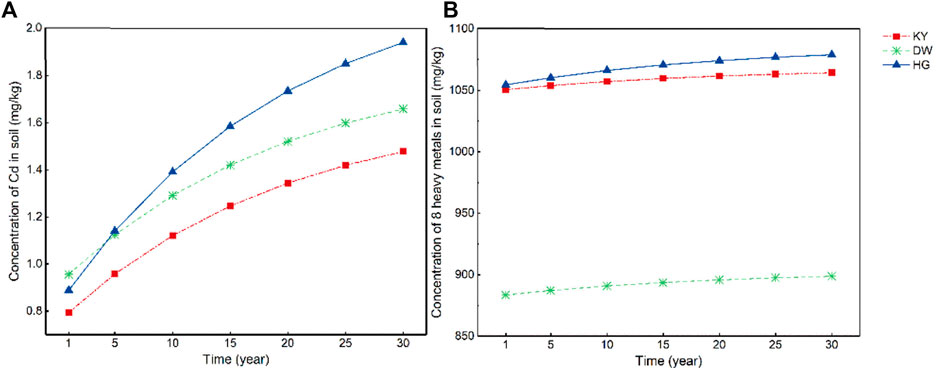
FIGURE 6. The concentration of heavy metals in the soil in the next 30 years: (A) concentration of Cd; (B) concentration of 8 heavy metals (Cd, Cr, Cu, Mn, Ni, Pb, Zn, and As).
3.4 Uncertainty and limitation
There are some limitations to this study that must be mentioned. For the estimated accumulation of heavy metals to the soil, results were based on the existing concentration level of heavy metals in atmospheric deposition. It must be mentioned that, with the implementation of measures such as reducing industrial emissions, we believe that the concentration level of heavy metals in atmospheric dust will decrease in the future. Hence, the actual accumulation would be overestimated. On the other hand, the basis of predictive accumulation model was the balance between inputs of soil-heavy metals and natural leaching migration. The input and output of heavy metals in the soil was dynamically changed in the actual environmental chemical process, this method may cause uncertainty and limitation into the source apportionment. Despite some limitations, our studies still supplied valuable information of the pollution level and accumulation for heavy metals in atmospheric deposition, which could provide some scientific information for regional atmospheric quality protection.
4 Conclusion
Based on a total of 72 atmospheric deposition samples collected from 3 sampling sites during 2 years in the Handan, fluxes, pollution characteristics, source apportionment, and accumulation of heavy metals were investigated. The atmospheric deposition fluxes of 8 heavy metals in the industrial area were higher than those of other functional areas. A total of five factors were analyzed by PMF and four sources were identified by UNMIX. The common results were combustion of fossil fuels, steel-smelting emission, road dust, and industrial sources. Steel-smelting emission and road dust accounted for a large proportion. Both PMF and UNMIX identified the heavy metal concentrations of atmospheric deposition with relative accuracy and their results were generally consistent. The total concentration of 8 heavy metals in the soil would increase slowly according to the predicting model. However, the concentration of Cd increased obviously due to its concentration in atmospheric deposition being much higher than that in the soil.
Data availability statement
The original contributions presented in the study are included in the article/Supplementary Material; further inquiries can be directed to the corresponding author.
Author contributions
Study concept and design: HZ; analysis and interpretation of data: AC; drafting of manuscript: AC and HZ; critical revision of the manuscript for important intellectual content: HZ, LW, and HZ; statistical analysis: AC; administrative, technical, or material support: HZ and LW, study supervision: HZ and LW. AC and HZ equally contributed to this work as co-first authors.
Funding
This work was supported by Hebei Provincial Department of Science and Technology (grant number 17273712D) and Hebei Provincial innovation funding project for postgraduate students (grant number CXZZSS2021086).
Acknowledgments
The authors wish to express their thanks to the editors and reviewers for their positive comments and suggestions to improve the quality of this manuscript.
Conflict of interest
YZ was employed by China Construction Technology Group Co. Ltd. Shenzhen Branch and XW was employed by China Gezhouba Group Co. Ltd.
The remaining authors declare that the research was conducted in the absence of any commercial or financial relationships that could be construed as a potential conflict of interest.
Publisher’s note
All claims expressed in this article are solely those of the authors and do not necessarily represent those of their affiliated organizations, or those of the publisher, the editors, and the reviewers. Any product that may be evaluated in this article, or claim that may be made by its manufacturer, is not guaranteed or endorsed by the publisher.
Supplementary material
The Supplementary Material for this article can be found online at: https://www.frontiersin.org/articles/10.3389/fenvs.2022.950288/full#supplementary-material
References
Akhter, M. S., and Madany, I. M. (1993). Heavy metals in street and house dust in Bahrain. Water Air Soil Pollut. 66 (1/2), 111–119. doi:10.1007/bf00477063
Balachandran, S., Meena, B. R., and Khillare, P. S. (2000). Particle size distribution and its elemental composition in the ambient air of Delhi. Environ. Int. 26 (1), 49–54. doi:10.1016/s0160-4120(00)00077-5
Cai, K., Li, C., and Na, S. (2019). Spatial distribution, pollution source, and health risk assessment of heavy metals in atmospheric depositions: A case study from the sustainable city of shijiazhuang, China. Atmosphere 10 (4), 222. doi:10.3390/atmos10040222
Cai, A., Zhang, H., Wang, L., Wang, Q., and Wu, X. (2021). Source apportionment and health risk assessment of heavy metals in PM2.5 in handan: A typical heavily polluted city in north China. Atmosphere 12, 1232. doi:10.3390/atmos12101232
Chen, L., Wang, G., Wu, S., Xia, Z., Cui, Z., Wang, C., et al. (2019b). Heavy metals in agricultural soils of the Lihe River watershed, east China: Spatial distribution, ecological risk, and pollution source. Int. J. Environ. Res. Public Health 16 (12), 2094. doi:10.3390/ijerph16122094
Chen, L., Zhou, S. L., Wu, S. H., Wang, C. H., and He, D. (2019a). Concentration, fluxes, risks, and sources of heavy metals in atmospheric deposition in the Lihe River watershed, Taihu region, eastern China. Environ. Pollut. 255, 113301. doi:10.1016/j.envpol.2019.113301
Cui, S., Zhang, F., Hu, P., Hough, R., Fu, Q., Zhang, Z., et al. (2019). Heavy metals in sediment from the urban and rural rivers in harbin city, northeast China. Int. J. Environ. Res. Public Health 16 (22), 4313. doi:10.3390/ijerph16224313
Duan, L., Song, J., Xu, Y., Li, X., and Zhang, Y. (2010). The distribution, enrichment and source of potential harmful elements in surface sediments of Bohai Bay, North China. J. Hazard. Mater. 183, 155–164. doi:10.1016/j.jhazmat.2010.07.005
Deng, J., Zhang, Y., Qiu, Y., Zhang, H., Du, W., Xu, L., et al. (2018). Source apportionment of PM2. 5 at the Lin'an regional background site in China with three receptor models. Atmos. Res. 202, 23–32. doi:10.1126/sciadv.aar8400
Fausak, L., Watkinson, A. D., Dy, K., and Lavkulich, L. (2021). Assessment of metal contamination in soil and vegetation along the arbutus greenway in vancouver, British columbia. Plant Soil 464 (15), 593–604. doi:10.1007/s11104-021-04983-0
Feng, W. L., Guo, Z. H., Peng, C., Xiao, X. Y., Shi, L., Zeng, P., et al. (2019). Atmospheric bulk deposition of heavy metal(loid)s in central south China: Fluxes, influencing factors and implication for paddy soils. J. Hazard. Mater. 371, 634–642. doi:10.1016/j.jhazmat.2019.02.090
Ge, S., Xu, X., Chow, J. C., Watson, J., Sheng, Q., Liu, W., et al. (2004). Emissions of air pollutants from household stoves: honeycomb coal versus coal cake. Environ. Sci. Technol. 38 (17), 4612–4618. doi:10.1021/es049942k
Guan, Q., Zhao, R., Pan, N., Wang, F., Yang, Y., and Luo, H. (2019). Source apportionment of heavy metals in farmland soil of Wuwei, China: Comparison of three receptor models. J. Clean. Prod. 237, 117792. doi:10.1016/j.jclepro.2019.117792
Guo, L. L., Lyu, Y. L., and Yang, Y. Y. (2018). Concentrations and chemical forms of heavy metals in the bulk atmospheric deposition of Beijing, China. Environ. Sci. Pollut. Res. 24 (35), 27356–27365. doi:10.1007/s11356-017-0324-4
Henry, R. C. (2003). Multivariate receptor modeling by N-dimensional edge detection. Chemom. Intelligent Laboratory Syst. 65 (2), 179–189. doi:10.1016/s0169-7439(02)00108-9
Hou, Q., Yang, Z., Ji, J., Yu, T., Chen, G., Li, J., et al. (2014). Annual net input fluxes of heavy metals of the agro-ecosystem in the Yangtze River Delta, China. J. Geochem. Explor. 139, 68–84. doi:10.1016/j.gexplo.2013.08.007
Hou, S. N., Zheng, N., Tang, L., Ji, X. F., Li, Y. Y., and Hu, X. Y. (2019). Pollution characteristics, sources, and health risk assessment of human exposure to Cu, Zn, Cd and Pb pollution in urban street dust across China between 2009 and 2018. Environ. Int. 128, 430–437. doi:10.1016/j.envint.2019.04.046
Hu, X., Ding, Z., Zhang, Y., Sun, Y., Wu, J., Chen, Y., et al. (2013). Size distribution and source apportionment of airborne metallic elements in nanjing, China. Aerosol Air Qual. Res. 13, 1796–1806. doi:10.4209/aaqr.2012.11.0332
Jain, S., Sharma, S. K., Choudhary, N., Masiwal, R., Saxena, M., Sharma, A., et al. (2017). Chemical characteristics and source apportionment of PM2.5 using PCA/APCS, UNMIX, and PMF at an urban site of Delhi, India. Environ. Sci. Pollut. Res. 24, 14637–14656. doi:10.1007/s11356-017-8925-5
Jain, S., Sharma, S. K., Vijayan, N., and Mandal, T. K. (2021). Investigating the seasonal variability in source contribution to PM2.5 and PM10 using different receptor models during 2013–2016 in Delhi, India. Environ. Sci. Pollut. Res. 28, 4660–4675. doi:10.1007/s11356-020-10645-y
Kai, J., Wang, C., Niu, Y., Li, C., and Zuo, Z. (2020). Distribution characteristics and source analysis of atmospheric fallout elements in Yinchuan City. Environ. Sci. Technol. 43 (12), 96–103. doi:10.19672/j.cnki.1003-6504.2020.12.013
Kim, B. M., and Henry, R. C. (2000). Application of SAFER model to the los angeles PM10 data. Atmos. Environ. 34 (1 1), 1747–1759. doi:10.1016/s1352-2310(99)00365-9
Kundu, S., Sengupta, S., and Bhattacharyya, A. (2013). NF-κB acts downstream of EGFR in regulating low dose cadmium induced primary lung cell proliferation. BioMetals 26 (6), 897–911. doi:10.1007/s10534-013-9666-7
Lee, P., Choi, B., and Kang, M. (2015). Assessment of mobility and bio-availability of heavy metals in dry depositions of Asian dust and implications for environmental risk, Chemosphere, 119, 1411–1421. doi:10.1016/j.chemosphere.2014.10.028
Lee, P. K., Youm, S. J., and Jo, H. Y. (2013). Heavy metal concentrations and contamination levels from asian dust and identification of sources: A case-study. Chemosphere 91, 1018–1025. doi:10.1016/j.chemosphere.2013.01.074
Li, S. Q., Yang, J. L., Ruan, X. L., and Zhang, G. L. (2014). Atmospheric deposition of heavy metals and their impacts on soil environment in typical urban areas of Nanjing. China Environ. Sci. 34 (1), 22–29. https://kns.cnki.net/kcms/detail/detail.aspx?FileName=ZGHJ201401005&DbName=CJFQ2014
Li, Y., Zhou, S., Jia, Z., Liu, K., and Wang, G. (2021). Temporal and spatial distributions and sources of heavy metals in atmospheric deposition in western Taihu Lake, China. Environ. Pollut. 284, 117465. doi:10.1016/j.envpol.2021.117465
Liang, J., Feng, C., Zeng, G., Zhong, M., Gao, X., Li, X., et al. (2017). Atmospheric deposition of mercury and cadmium impacts on topsoil in a typical coal mine city, Lianyuan, China. Chemosphere 189, 198–205. doi:10.1016/j.chemosphere.2017.09.046
Lu, W., Wang, Y. X., Querol, X., Zhuang, X., Alastuey, A., López, A., et al. (2006). Geochemical and statistical analysis of trace metals in atmospheric particulates in Wuhan, central China. Environ. Geol. 51 (1), 121–132. doi:10.1007/s00254-006-0310-5
Lu, Y. F., and Qiu, K. Y. (2014). The quantum of Pb, Cd and as in the ambient air of lead smelting enterprises and their effects on soils. Adm. Tech. Environ. Monit. 26 (3), 60–63. https://kns.cnki.net/kcms/detail/detail.aspx?FileName=HJJS201403023&DbName=CJFQ2014
Mijić, Z., Stojić, A., Perišić, M., Rajšić, S., Tasić, M., Radenković, M., et al. (2010). Seasonal variability and source apportionment of metals in the atmospheric deposition in Belgrade. Atmos. Environ. 44 (30), 3630–3637. doi:10.1016/j.atmosenv.2010.06.045
Mohammad, S. A., Sadat, F., and Mauro, M. (2022). Seasonal and spatial variations of atmospheric depositions-bound elements over Tehran megacity, Iran: Pollution levels, PMF-based source apportionment and risks assessment. Urban Clim. 42, 101113. doi:10.1016/j.uclim.2022.101113
Norris, G., Vedantham, R., Duvall, R., and Henry, R. C., (2007). EPA UNMIX 6.0 fundamentals and user guide. EPA/600/R07/089. Available at: https://nepis.epa.gov/Exe/ZyPURL.cgi?Dockey=P100CGV2.txt (Accessed November 14, 2022).
Okubo, A., Takeda, S., and Obata, H. (2013). Atmospheric deposition of trace metals to the Western North Pacific Ocean observed at coastal station in Japan. Atmos. Res. 129-130, 20–32. doi:10.1016/j.atmosres.2013.03.014
Othman, M., Latif, M. T., and Matsumi, Y. (2019). The exposure of children to PM2.5 and dust in indoor and outdoor school classrooms in Kuala Lumpur city Centre. Ecotoxicol. Environ. Saf. 170, 739–749. doi:10.1016/j.ecoenv.2018.12.042
Pan, Y. P., and Wang, Y. S. (2015). Atmospheric wet and dry deposition of trace elements at 10 sites in Northern China. Atmos. Chem. Phys. 15, 951–972. doi:10.5194/acp-15-951-2015
Paatero, P., and Tapper, U. (1994). Positive matrix factorization: A non-negative factor model with optimal utilization of error estimates of data values. Environmetrics 5 (2), 111–126. doi:10.1002/env.3170050203
Qing, Y. M., Turpin, B. J., Jong, H. L., Polidori, A., Weisel, C. P., Morandi, M., et al. (2007). How does infiltration behavior modify the composition of ambient PM 2.5 in indoor spaces? An analysis of RIOPA data. Environ. Sci. Technol. 41, 7315–7321. doi:10.1021/es070037k
Rabha, S., Subramanyam, K. S. V., Sawant, S. S., and Saikia, B. K. (2022). Rare-earth elements and heavy metals in atmospheric particulate matter in an urban area. ACS Earth Space Chem. 6 (7), 1725–1732. doi:10.1021/acsearthspacechem.2c00009
Rai, P., Furger, M., El Haddad, I., Kumar, V., Wang, L., Singh, A., et al. (2020). Real-time measurement and source apportionment of elements in Delhi's atmosphere, Sci. Total Environ., 742. 140332. doi:10.1016/j.scitotenv.2020.140332
Ramírez, O., Sánchez de la Campa, A. M., Amato, F., Moreno, T., Silva, L. F., and de la Rosa, J. D. (2019). Physicochemical characterization and sources of the thoracic fraction of road dust in a Latin American megacity. Sci. Total Environ. 652, 434–446. doi:10.1016/j.scitotenv.2018.10.214
Sharma, S. K., Choudhary, N., Kotnala, G., Das, D., Mukherjee, S., Ghosh, A., et al. (2020). Wintertime carbonaceous species and trace metals in PM10 in darjeeling: A high-altitude town in the eastern himalayas. Urban Clim. 34, 100668. doi:10.1016/j.uclim.2020.100668
Sharma, S. K., Mandal, T. K., Jain, S., SaraswatiSharma, A., and Saxena, M. (2016). Source apportionment of PM2.5 in Delhi, India using PMF model. Bull. Environ. Contam. Toxicol. 97, 286–293. doi:10.1007/s00128-016-1836-1
Shi, G., Chen, Z., Bi, C., Wang, L., Teng, J., Li, Y., et al. (2011). A comparative study of health risk of potentially toxic metals in urban and suburban road dust in the most populated city of China. Atmos. Environ. 45, 764–771. doi:10.1016/j.atmosenv.2010.08.039
Sun, C. Y., Zhao, W. J., Zheng, X. X., and Shu, T. T. (2016). Analysis on the spatial distribution of heavy metal in surface soil and the relationships to atmospheric dust in Beijing urban area. China Sci. 11 (9), 1035–1040. https://kns.cnki.net/kcms/detail/detail.aspx?FileName=ZKZX201609013&DbName=CJFQ2016
Tunno, B. J., Michanowicz, D. R., Shmool, J. L. C., Kinnee, E., Cambal, L., Tripathy, S., et al. (2015). Spatial variation in inversion-focused vs 24-h integrated samples of PM2.5 and black carbon across Pittsburgh, PA. J. Expo. Sci. Environ. Epidemiol. 26 (4), 365–376. doi:10.1038/jes.2015.14
Wang, J., Liu, B., Xiao, B. L., Li, Y. j., Zhang, T. S., Wu, H., et al. (2019a). Characteristics of heavy metals in atmospheric deposition and its impact on their accumulation in soil of chongqing. Soils 51 (6), 1160–1167. doi:10.13758/j.cnki.tr.2019.06.016
Wang, J., Su, J., Li, Z., Liu, B., Cheng, G., Jiang, Y., et al. (2019b). Source apportionment of heavy metal and their health risks in soil-dustfall-plant system nearby a typical non-ferrous metal mining area of Tongling, Eastern China. Environ. Pollut. 254, 113089. doi:10.1016/j.envpol.2019.113089
Wang, L. T., Wei, Z., Yang, J., Zhang, Y., Zhang, F. F., Su, J., et al. (2014). The 2013 severe haze over southern Hebei, China: Model evaluation, source apportionment, and policy implications. Atmos. Chem. Phys. 14, 3151–3173. doi:10.5194/acp-14-3151-2014
Wu, Q., Hu, W., Wang, H., Liu, P., Wang, X., and Huang, B. (2021). Spatial distribution, ecological risk and sources of heavy metals in soils from a typical economic development area, Southeastern China. Sci. Total Environ. 780, 146557. doi:10.1016/j.scitotenv.2021.146557
Xu, S., and Tao, S. (2004). Coregionalization analysis of heavy metals in the surface soil of inner Mongolia. Sci. Total Environ. 320, 73–87. doi:10.1016/s0048-9697(03)00450-9
Yang, P., Chen, H., Tsai, J., and Lin, L. (2007). Cadmium induces Ca2+ dependent necrotic cell death through calpain-triggered mitochondrial depolarization and reactive oxygen species-mediated inhibition of nuclear factor-kappaB activity. Chem. Res. Toxicol. 20 (3), 406–415. doi:10.1021/tx060144c
Yang, S., Liu, J., Bi, X., Ning, Y., Qiao, S., Yu, Q., et al. (2020). Risks related to heavy metal pollution in urban construction dust fall of fast-developing Chinese cities. Ecotoxicol. Environ. Saf. 197, 110628. doi:10.1016/j.ecoenv.2020.110628
Yang, S., Ma, Y. L., Duan, F. K., He, K. B., Wang, L. T., Wei, Z., et al. (2018). Characteristics and formation of typical winter haze in Handan, one of the most polluted cities in China. Sci. Total Environ. 613-614, 1367–1375. doi:10.1016/j.scitotenv.2017.08.033
Yang, W., Chen, Y., Zhao, J., and Hu, B. (2017). Spatial and temporal variation of atmospheric deposition pollution in Xi’an City. Environ. Sci. Technol. 40 (3), 10–14. doi:10.3969/j.issn.1003-6504.2017.03.002
Yang, Y., Chen, W., Wang, M., and Peng, C. (2016). Regional accumulation characteristics of cadmium in vegetables: Influencing factors, transfer model and indication of soil threshold content. Environ. Pollut. 219, 1036–1043. doi:10.1016/j.envpol.2016.09.003
Yao, L., Liu, Jin., Pan, Y., Tian, S., Wang, Z., Wei, X., et al. (2017). Atmospheric dry deposition fluxes and seasonal variations of particulate matter and lead in urban beijing. Environ. Sci. 38 (2), 423–428. doi:10.13227/j.hjkx.201601132
Yi, S. M., Totten, L. A., Thota, S., Yan, S., Offenberg, J. H., Eisenreich, S. J., et al. (2006). Atmospheric dry deposition of trace elements measured around the urban and industrially impacted NY–NJ harbor. Atmos. Environ. 40, 6626–6637. doi:10.1016/j.atmosenv.2006.05.062
Keywords: heavy metal, deposition flux, PMF, UNMIX, soil
Citation: Cai A, Zhang H, Zhao Y, Wang X, Wang L and Zhao H (2022) Quantitative source apportionment of heavy metals in atmospheric deposition of a typical heavily polluted city in Northern China: Comparison of PMF and UNMIX. Front. Environ. Sci. 10:950288. doi: 10.3389/fenvs.2022.950288
Received: 22 May 2022; Accepted: 07 November 2022;
Published: 21 November 2022.
Edited by:
Mohammad Saghir Khan, Aligarh Muslim University, IndiaReviewed by:
Zhonggen Li, Zunyi Normal College, ChinaSudhir Kumar Sharma, National Physical Laboratory (CSIR), India
Copyright © 2022 Cai, Zhang, Zhao, Wang, Wang and Zhao. This is an open-access article distributed under the terms of the Creative Commons Attribution License (CC BY). The use, distribution or reproduction in other forums is permitted, provided the original author(s) and the copyright owner(s) are credited and that the original publication in this journal is cited, in accordance with accepted academic practice. No use, distribution or reproduction is permitted which does not comply with these terms.
*Correspondence: Haixia Zhang, emhhbmdoYWl4aWFAaGViZXUuZWR1LmNu