 Hanxue Chen
 Caixia Zhang2
 Kedong Yin
- 1School of Economics, Ocean University of China, Qingdao, China
- 2College of Oceanic and Atmospheric Sciences, Ocean University of China, Qingdao, China
- 3Institute of Marine Development, Ocean University of China, Qingdao, China
The impact of global value chain (GVC) division of labor on carbon emissions embodied in exports has attracted extensive attention from scholars, but existing studies have not distinguished the heterogeneous impact of different GVC embedding patterns on the carbon emissions embodied in exports. This study examines the effects of two GVC embedding patterns (forward embedding and backward embedding) on carbon emissions embodied in exports using data from 46 sectors in China from 2000 to 2014. The results show that both the backward and forward embedding patterns are characterized by increasing forward participation which increases carbon emissions embodied in Chinese exports. By contrast, the forward embedding pattern is characterized by increasing the length of the forward production chain and increasing the global value chain location index to help reduce the carbon emissions embodied in exports. There is significant heterogeneity in the effect of forward and backward embedding patterns on the carbon emissions embodied in exports. Increasing the length of forward production chains can effectively reduce the carbon emissions embodied in exports in labor-intensive and technology-intensive sectors but has no significant effect on capital-intensive sectors. Therefore, the Chinese government should start to reduce the carbon emissions embodied in China’s exports by changing the GVC embedding pattern, improving the position of GVC embedding, and vigorously developing energy-saving and emission reduction technologies and clean industries, to help China achieve its CO2 reduction target in 2030.
1 Introduction and Literature Review
Since the 1990s, the international division of labor has changed significantly, and the global economy has entered the era of global value chains (GVCs) characterized by the fragmentation of the production process (Sun, 2019). After acceding to the World Trade Organization (WTO), China has actively integrated into GVCs with its advantages of abundant resources as well as cheap labor and has since achieved rapid economic growth (Wang and Chen, 2022). However, constrained by capital and technology conditions, China is mainly engaged in low-end links such as processing and assembly in the GVC division led by developed countries, obtaining limited domestic added value and bearing huge pressure on resources and environment, and even becoming a “pollution refuge” for developed countries (Li et al., 2021; Wang S. et al., 2022). Statistics from the International Energy Agency (IEA) show that China’s carbon emissions have surpassed those of the United States in 2007, making it the world’s top emitter. In 2021, China emitted 11.9 billion tons of carbon dioxide, accounting for 33% of the global carbon dioxide and exceeding the combined emissions of the United States and the European Union. A large amount of CO2 emissions will not only bring serious environmental pollution and affect the quality of life of the residents but also attract international discontent and threaten the stability of Chinese society. Facing the increasingly serious form of carbon emissions, the Chinese government proposed a “carbon peaking and carbon neutrality goal” in 2020, aiming to reach peak CO2 emissions by 2030 and achieve carbon neutrality by 2060.
Although carbon reduction efforts have long focused on reducing carbon emissions by controlling domestic production and consumption, a growing body of research has recently pointed out that the production process of commodities and the associated carbon emissions are shifting from commodity-consuming to commodity-producing countries through the global value chain as a form of division of labor (Liu et al., 2019; Ye et al., 2020; Li et al., 2022). Thus, changing the global distribution of carbon emissions and the domestic carbon emissions of trading participant countries (Wu et al., 2020; Tunc et al., 2022). The carbon emissions transferred by the production of imported and exported goods are also known as carbon emissions embodied in trade (Yan et al., 2020), which can be further divided into those embodied in imports and those embodied in exports. Carbon emissions embodied in imports are carbon dioxide emissions directly and indirectly emitted abroad from the production of imported products to meet domestic demand. By contrast, carbon emissions embodied in exports are the direct and indirect carbon dioxide emissions emitted domestically from the production of exported products to meet foreign demand (Wang et al., 2019). Therefore, studying the relationship between the embedded global value chain and the carbon emissions embodied in exports, as opposed to those embedded in imports, is more conducive to revealing the intrinsic reasons for the continuous growth of carbon emissions in China, which is vital for achieving carbon emission reduction targets.
Currently, scholars have developed three different views on the relationship between developing countries’ embedding in GVCs and carbon emissions embodied in trade (Liu and Zhao, 2020; Assamoi et al., 2020; Zhu et al., 2022). Based on factor endowment theory and the “pollution refuge hypothesis,” one view suggests that the embedding of developing countries in GVCs increases the carbon emissions embodied in exports (Xiao et al., 2020; Wang Z. et al., 2022). To take over industries that transfer from developed countries, developing countries will actively reduce the intensity of environmental regulations to gain a competitive advantage and deliver intermediate goods with a high intensity of environmental pollution in the production process to developed countries, thus increasing carbon emissions embodied in exports (Su and Thomson, 2016; Chen et al., 2021). Another perspective, based on technological innovation, argues that developing countries embedded in GVCs can gain technological spillover effects from developed countries, which can help reduce the carbon emission intensity embodied in their exports by learning advanced clean technologies and management experiences from developed countries (Liu and Zhao, 2020; Chen et al., 2021). It is also argued that the relationship between GVCs embedding and carbon emissions embodied in trade is not a simple linear one. As the position of GVCs increases, carbon emissions embodied in exports show an inverted U-shaped relationship (Zheng et al., 2022). When emerging economies initially participate in the GVC division of labor, GDP growth drives carbon emissions, but as the GVC continues to evolve, the energy intensity of exports from emerging economies gradually decreases, thereby reducing the carbon emissions embodied in exports (Hertwich, 2020; Xiao et al., 2020).
Although the relationship between GVC embedding and the carbon emissions embodied in exports of developing countries is highly controversial, the vast majority of scholars believe that developed countries’ embedding in GVCs can reduce the carbon emissions embodied in exports (Jiang and Liu, 2015; Meng et al., 2018; Shi et al., 2022). With their technological and capital advantages, developed countries can effectively reduce carbon emissions embodied in exports by occupying the high value-added and low-polluting segments of GVCs such as design and R&D, post-operational sales, and redirecting their demand for polluting industries to developing countries through imports or direct investment (Shi et al., 2021). The existing studies indicate that the difference in the impact on the carbon emissions embodied in exports between developed and developing countries after embedding GVCs may be closely related to the embedding patterns and GVC degree. Under different embedding patterns, export trade requires different intermediate inputs, and the resulting product inputs and pollution emission intensity differ significantly (Li et al., 2021). Developed countries mainly participate in the GVC division of labor in the forward embedding pattern which can transfer pollution-intensive production processes such as manufacturing and processing and assembly to developing countries through the export of intermediate products, which is conducive to reducing pollution emissions (Zhang et al., 2017; Wang and Yao, 2022). Developing countries, by contrast, are more likely to participate in the GVC division of labor in a backward embedding pattern, participating in the low-end production chain by importing foreign intermediate products, which is prone to higher pollution emissions (Su et al., 2020; Qian et al., 2022). However, the existing studies do not consider the impact of different GVC embedding patterns on the carbon emissions embodied in exports. Moreover, most of the existing studies measuring the embedding of GVCs use the GVC participation index proposed by Koopman et al. (2014) and Wang et al. (2017a). However, it should be noted that the index uses gross exports as the denominator, which may lead to an upward bias at the bilateral/sectoral level; therefore, the findings obtained from empirical studies based on the GVC participation index and GVC position index proposed by Koopman may not be accurate.
Over the past 40 years of reform and opening up, China’s embedding pattern in the GVC is gradually changing. Initially, China mainly relied on its labor and resource advantages to participate in the GVC division of labor in the form of processing trade, playing the role of “world factory” (Zhang and Wang, 2021). In recent years, with the strengthening of China’s economy and the improvement in its technological level, Chinese sectors are gradually moving up the value chain (Fei et al., 2020). Moreover, labor costs in China are gradually rising, and progressively more multinational companies are moving labor-intensive production processes to ASEAN countries such as Vietnam and Malaysia, where labor costs are lower (Morck and Yeung, 2016; Chaiyasoonthorn et al., 2019). Changes in China’s embedding pattern in the GVC may affect the trend of carbon emissions embodied in China’s exports. In this context, a comprehensive and systematic analysis of the relationship between different GVC embedding patterns and the carbon emissions embodied in China’s exports in various sectors is an important reference value for China to formulate carbon emission reduction policies, develop a low-carbon economy, and clarify the future transformation and upgrading direction of its participation in the GVC.
Given this, based on the GVC value added accounting framework, this study analyzes the impact of different GVC embedding patterns (forward embedding and backward embedding) on the carbon emissions embodied in China’s exports and examines the heterogeneous impact of GVC embedding on the carbon emissions embodied in exports in different sectors. Compared with the existing literature, this study makes several possible contributions. First, it distinguishes the effects of two GVC patterns (forward embedding and backward embedding) on the carbon emissions embodied in exports and examines the effects of these patterns, characterized by the degree of GVC participation and GVC position, on the carbon emissions embodied in exports. This provides an important reference for China to formulate carbon emission reduction policies and promote the green transformation of GVCs. Second, based on the latest WIOD (World Input-Output Database) data, this study adopts the GVC forward/backward participation and GVC forward/backward production chain length proposed by Wang et al. (2017a; 2017b) to carry out an empirical study, which can more accurately reflect the current situation of the refined division of labor in GVCs and help to comprehensively reveal the relationship between GVC embedding and the carbon emissions embodied in China’s exports. Third, this study also provides a comparative analysis of the heterogeneous effects of the different GVC embedding patterns on labor-, capital-, and technology-intensive sectors, providing rich and reliable evidence for the Chinese government to manage carbon emissions precisely.
The remainder of this paper is structured as follows. The second part explains the econometric models, indicators, and data. Subsequently, the third part presents the regression analysis and finally, the fourth part presents the conclusion and policy implications.
2 Model and Index
2.1 Econometric Model Design
Considering that the degree of GVC participation is the most widely used and representative GVC embedding indicator, this study constructs an econometric model with forward GVC participation and backward GVC participation as the core explanatory variables to identify the impact of China’s participation in GVC on the carbon emissions embodied in exports under the forward and backward embedding patterns, which are shown as follows.
where the subscripts k and t stand for sector and year, respectively. lneckt denotes the logarithm of carbon emissions embodied in exports in year t for sector k, lngvcbkt denotes the logarithm of GVC forward participation in year t for sector k, and lngvcbkt denotes the logarithm of GVC backward participation in year i for sector k. X stands for the control variable,
2.2 Variable Description
2.2.1 Carbon Emissions Embodied in Exports
Inter-regional input-output models can not only clearly portray the economic linkages between different industries in a region but also systematically analyze the environmental impacts embodied in the process of inter-regional trade exchange. Therefore, this study adopts the global multi-regional input-output model (MRIO) to calculate the carbon emissions embodied in exports of China in each sector. Firstly, a multi-regional input-output table is constructed for sector N of country G (Table 1). Zsr is an N×N-dimensional matrix of intermediate inputs representing the intermediate goods of country s used in the production of a sector in country r. Ysr is an N × 1-dimensional vector of final products representing the final product produced in country s, consumed in country r. Vs is a 1×N-dimensional row vector of value added in country s and Xs is an N × 1-dimensional column vector of total output in country s.
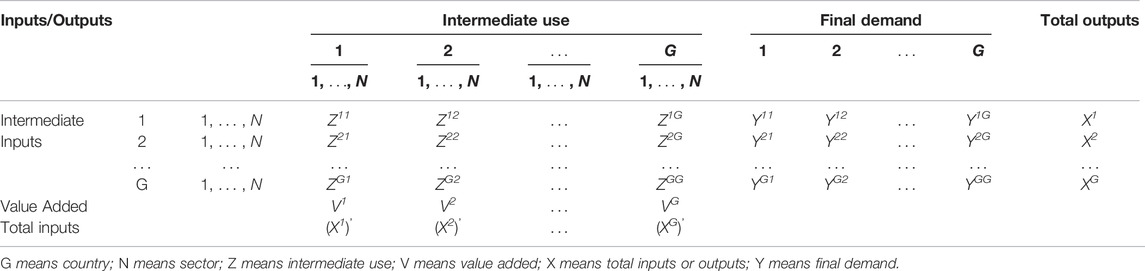
TABLE 1. Global multi-regional input-output table.
The MRIO model can be expressed as:
where the submatrix Asr = Zsr/Xr denotes the direct consumption coefficient of country r for intermediate goods in country s, that is, the matrix of demand for intermediate goods in country s per unit of output in country r. Asr is a matrix of order N×N; Ass = Zss/Xs denotes the matrix of direct consumption coefficients of intermediate goods in country s, that is, the demand relationship between sectors within country s. Yss denotes the product produced in country s and used by it to satisfy the domestic final demand (household consumption, government consumption, fixed capital formation, and inventory changes, etc.), and Ysr denotes the product produced in country s and used to satisfy final demand in country r, that is, the final good exported by country s to country r. According to Eq. 1, it is obtained that:
where Bsr=(I-Asr)−1 is the N×N Leontief inverse matrix, indicating that country r increases by 1 unit of final demand required to input s produced; Yr is the N × 1 column vector, indicating the final demand vector in country r. The matrix form of Eq. 2 can be simplified as follows:
where X and Y are both GN × 1 matrices, whereas A and B are both GN×GN matrices.
To measure the carbon emissions embodied in exports of a country under the GVC division of labor, a further vector of carbon emission factors needs to be introduced.
Element Csk is the total carbon emissions from country s to meet the output of unit final demand in sector k.
According to Table 1, it can be seen that the total output of country s can be used as intermediate inputs and final goods by either home or foreign countries, that is,
Domestic intermediate goods Intermediate goods for exports Domestic final goods Final goods for exports.
It follows that the total exports of country s include both intermediate and final goods exports, and the combination of Eq. 4 leads to the calculation of the ECs of carbon emissions embodied in exports of country s as:
Carbon emissions embodied in exports of intermediate goods carbon emissions embodied in exports of final goods.where Cs denotes the total carbon emission coefficient vector for country s. Using China as country s, the carbon emissions embodied in exports of China by sector from 2000 to 2014 can be calculated. To visualize the dynamic evolution of carbon emissions embodied in China’s exports from 2000 to 2014, we plotted Figure 1.
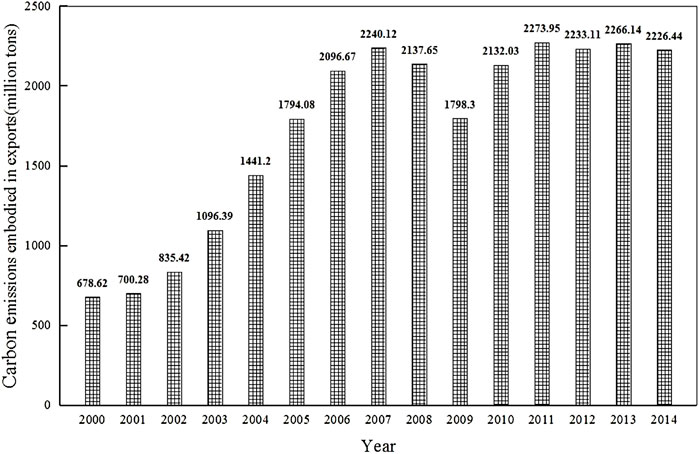
FIGURE 1. Carbon emissions embodied in China’s exports from 2000 to 2014.
As can be seen from Figure 1, the change in carbon emissions embodied in China’s exports has roughly gone through three stages. The first stage was from 2000 to 2007, when they grew rapidly from 678.63 Mt to 2240.12 Mt, an increase of 230%. This stage is mainly due to China’s accession to the WTO, which has led to more frequent trade with other countries worldwide and the rapid expansion of production in various sectors, consuming a large amount of energy and thus significantly increasing CO2 emissions. The second stage is from 2008 to 2009, which was affected by the international financial crisis, the global economy fell into a debt crisis, and willingness to consume decreased, so carbon emissions embodied in exports of China also showed a significant decline. The third stage is from 2010 to 2015, during which carbon emissions embodied in exports of China are stable at around 2200 Mt, with the little trend of change. This is mainly because with the implementation of various environmental regulatory policies in China, energy use efficiency in various sectors has been further improved, effectively reducing carbon emission intensity.
2.2.2 GVC Participation
Traditional indicators of GVC participation are more general and fail to exclude the influence of purely domestic production activities as well as traditional trade production activities. At the same time, Wang et al. (2017a) divide a country’s export trade flows into 16 segments, which more accurately reflect the refined professional division of labor in the GVCs. Therefore, this study measures the forward and backward participation in GVCs by sectors in China by drawing on the measure of Wang et al. (2017a). First, the decomposition model is constructed by combining the total output production function and general equilibrium conditions as follows:
Summing Eq. 8 in cross-sectional terms, a forward decomposition model of production is obtained as follows:
where V_D denotes value added used for the purely domestic production component, V_RT denotes domestic value added included in final product exports, V_GVC_R is intermediate exports absorbed by the importing country, V_GVC_D denotes domestic value added returned and absorbed by the home country, and V_GVC_F denotes intermediate exports absorbed by production in the direct importing country for export to a third country.
Similarly, by summing Eq. 8 vertically, the backward decomposition model of production is obtained as follows:
where Y_D and Y_RT have the same meaning as VA_D and VA_RT. They differ in that VA_D and VA_RT denote the summation of the value added of a sector of a country used for all downstream sectors, whereas Y_D and Y_RT denote the value added of a sector of a country that includes the value added of all upstream sectors. Y_GVC_R denotes the foreign value added imported from abroad for domestic consumption, Y_GVC_D denotes the returned domestic value added for the production of domestic final products; Y_GVC_F denotes the foreign value added in imported intermediate products for the production of domestic final products.
Thus, the forward participation in GVCs can be expressed as:
Forward participation reflects the share of domestic value added in exports of intermediate goods to sectoral value added, and a larger value indicates greater forward participation of GVC in the sector.
Backward participation in global value chains can be expressed as:
Backward participation reflects the share of domestic and foreign value added in imports of intermediate goods in the gross product, and a larger value indicates greater backward participation in GVCs in the sector. If a country’s sector mainly supplies raw materials or intermediate goods to other countries, it is located upstream of the value chain, and the forward participation of GVC will be greater than the backward participation. Conversely, if a country’s sector is mainly located in the downstream link and imports a large amount of intermediate goods, the backward participation in GVCs will be greater than the forward participation.
2.2.3 Control Variables
To overcome the influence of omitted variables on the empirical results, the following control variables are selected based on the existing relevant theoretical and empirical research results: 1) Total factor productivity (tfp). An increase in total factor productivity not only enhances production efficiency but also improves energy use efficiency and reduces carbon emissions embodied in exports (Mi et al., 2021); therefore, the estimated coefficient of this control variable is negative. In this study, the ACF method is used to measure the total factor productivity of each sector in China. 2) Capital intensity (lnkl). This indicator is expressed as the logarithm of the ratio of sectoral capital stock to the number of employees. The capital intensity indicator can reflect the structural characteristics of the sector to some extent, and generally speaking, sectors with higher capital intensity also have higher pollution intensity (Lannelongue et al., 2017); therefore, the estimated coefficient of capital intensity is positive. 3) Industry scale (lns). This indicator is expressed as the logarithm of the total industry output value. Many scholars have proved the influence of the scale effect on industrial pollution emission; however, different scholars have different views on the relationship between industry scale and industrial pollution emission. On the one hand, small-scale industries have fewer production activities and correspondingly fewer pollution emissions (Deng and Xu, 2017); on the other hand, large-scale industries with high environmental technology and strong pollution management capacity are conducive to reducing pollution emissions (Chaveesuk et al., 2021). Therefore, the sign of the regression coefficient of the industry scale cannot be determined. 4) Degree of trade openness (open). Increased trade openness has brought about serious resource consumption and environmental pollution problems while promoting rapid economic and trade development (Le et al., 2016). In this study, we use the share of exports of each sector in total output to characterize the degree of trade openness, and the expected sign is positive. 5) Energy consumption structure (lnes). China’s natural coal endowment has led to a coal-dominated energy consumption structure; therefore, this study uses the logarithm of the share of raw coal consumption in each sector in the total energy consumption of that sector to characterize the energy consumption structure. The higher the share of raw coal consumption, the higher the carbon emissions embodied in exports, and thus the expected sign of the energy consumption structure is positive. 6) Environmental regulation (env). A country’s environmental regulation policy has a significant effect on pollution emissions; the stricter the environmental regulation, the lower the pollution emissions, and the estimated coefficient of this control variable is negative. This study uses the opposite number of carbon dioxide emission intensity per unit of output in each sector to measure environmental regulation; the lower the carbon emission intensity, the stronger the environmental regulation.
2.3 Description of Data Sources
This study mainly uses three databases: 1) the UIBE (University of International Business and Economics) GVC Indicators database, which is a derivative database processed based on the original world ICIO (Intercountry Input-output Tables) table, mainly providing the results of current international trade in value-added trade accounting and indices related to the measurement of GVCs or international division of labor of production. The core explanatory variable of this study, the GVC participation index, is derived from this database. 2) the WIOD database, the latest version of which (2016 version) provides the World Input-Output Tables (WIOT) for 43 countries (regions) and a ROW (Rest of the World) zone composed of other countries, 56 sectors for 2000–2014, and the measurement of the explanatory variable carbon emissions embodied in exports of China in this study benefits from this database. Furthermore, the raw data for all control variables in this study are obtained from Socio-Economic Accounts in this database. 3) Environmental accounts data published by The Joint Research Centre of the European Commission. This account provides data on energy use and carbon emissions for 43 countries or regions and one ROW region comprising the remaining countries and 56 sectors from 2000 to 2016, and the country and region and sector breakdown of this account is fully consistent with the WIOD database. We use this database to measure the variable of carbon emissions embodied in exports. Because there are 10 sectors in the WIOT that do not export or import products, these sectors are excluded from the empirical analysis in this study. The final research sample used in this study comprises data from 46 sectors in China (see Supplementary Appendix SA) from 2000 to 2014, and the descriptive statistical information for each variable is shown in Table 2.
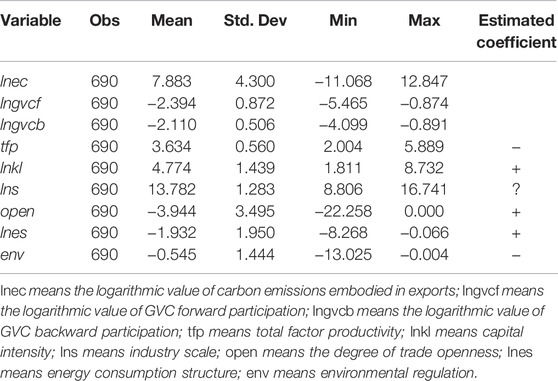
TABLE 2. Descriptive statistics.
2.4 Correlation Analysis of Forward and Backward GVC Participation and Carbon Emissions Embodied in Exports of China by Sector
Before the formal regression, we first examine the relationship between forward and backward GVC participation and carbon emissions embodied in exports by drawing a scatter plot, as shown in Figure 2. From Figure 2, it can be seen that there is a significant positive relationship between both the forward and backward GVC participation and carbon emissions embodied in exports of China.
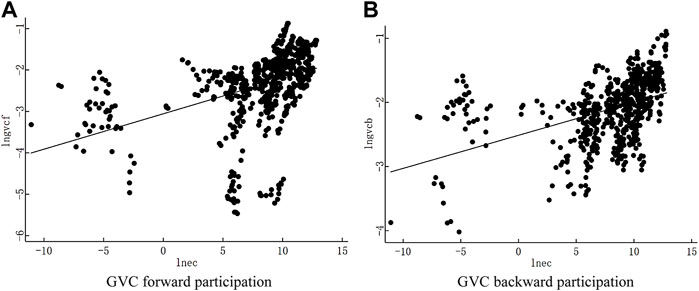
FIGURE 2. GVC forward and backward participation and carbon emissions embodied in China’s exports. (A) GVC forward participation (B) GVC backward participation
3 Empirical Analysis
3.1 Baseline Regression
We conducted a regression analysis of the bidirectional fixed effect model on Eq. 1, and the benchmark regression results are shown in Table 3. Only GVC forward participation is added in column 1) of Table 3. The regression results show that the estimated coefficient of GVC forward participation is significantly positive at the 1% level, indicating that increasing GVC forward participation will increase the carbon emissions embodied in exports of China. This may be because when China participates in the GVC division of labor in the forward embedding pattern, it can reduce the carbon emissions embodied in exports by exporting intermediate products to its trading partners and transferring production stages such as processing and assembly. The increase in forward participation implies that China is trading more with other countries. In this case, the “growth effect” of carbon emissions embodied in exports brought about by trade scale expansion is greater than the “environmental benefit effect” brought about by the forward embedding pattern. Therefore, with the increase of GVC forward participation, the carbon emissions embodied in China’s exports also increase.
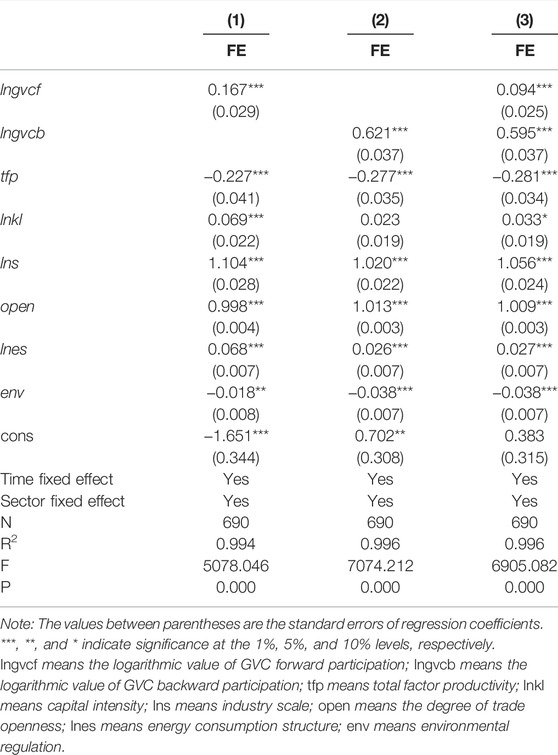
TABLE 3. Baseline regression results.
Column 2) of Table 3 shows the regression results of GVC backward participation, and the results indicate that for every 1% increase in GVC backward participation, the carbon emissions embodied in exports of China by sector will increase significantly by 0.621%. When China participates in the GVC division of labor in a backward embedding pattern, the main production task is to manufacture, process, and assemble imported foreign intermediate goods. Manufacturing, processing, and assembly production processes have lower technological content and added value, and consume more energy than production processes such as design and development and post-camp sales (Tokito, 2018; Duan et al., 2020). Therefore, the higher the backward participation of GVC, the larger the scale of processing trade, and the more energy needs to be consumed. Simultaneously, China still has an energy consumption structure dominated by non-clean energy sources such as coal, which will inevitably increase carbon emissions embodied in exports. Column 3) of Table 3 adds both forward and backward GVC participation, and the regression results still show that an increase in both forward and backward GVC participation increases the carbon emissions embodied in exports of China in all sectors, consistent with the previous research results. The comparison of the coefficients of forward and backward participation (0.094 < 0.595) show that the carbon emissions embodied in exports brought about by the forward embedding pattern are significantly smaller than those of the backward embedding pattern. This means that in the process of GVC embedding, which is an inevitable choice for pursuing economic development, more participation in the GVC division of labor in the forward embedding pattern can effectively reduce the burden of carbon emission reduction in China.
From the control variables, the regression coefficient of total factor productivity is significantly negative at the 1% level, indicating that the increase in total factor productivity is beneficial to reducing carbon emissions embodied in exports, which is consistent with our expectation. The coefficient of capital intensity is significantly positive, indicating that the higher the capital intensity of each sector, the higher the carbon emissions embodied in exports. This is also consistent with the current situation of Chinese industries, such as paper, printing, and production, and basic metal smelting and processing industries, which have a large amount of capital investment and technical equipment, and also have a large amount of pollution emissions in the production process (Liu et al., 2021). The coefficients of industry scale and trade openness are significantly positive at the 1% level, indicating that the larger the industry scale and the higher the degree of trade openness, the higher the carbon emissions embodied in exports. The effect of energy structure on carbon emissions embodied in exports is significantly positive at the 1% level, indicating that China’s coal-based energy consumption structure is not conducive to achieving carbon emission reduction targets, and China needs to increase the share of clean energy in energy consumption. The effect of environmental regulation on carbon emissions embodied in exports is significantly negative at the 1% level, indicating that strict environmental regulation policies are conducive to reducing carbon emissions embodied in exports.
3.2 Endogeneity Test
The existence of the endogeneity problem can make the regression results in this paper biased and inconsistent. To avoid the influence of potential endogeneity problems on the regression results, this study uses forward participation and backward participation at lag one and lag two as instrumental variables and performs endogeneity tests using two-stage least squares (2SLS), respectively. The setting of this instrumental variable is based on the following considerations: first, generally speaking, the higher the participation in GVCs in lagged periods 1 and 2, the higher the participation in GVCs in the current period, which satisfies the correlation assumption of the instrumental variable; second, the participation indices of lagged periods 1 and 2 are already determined historical variables, which can only affect the carbon emissions embodied in exports through the path of the current participation index, which satisfies the exogeneity assumption of the instrumental variable. Columns 1) and 2) of Table 4 report the regression results of 2SLS. The LM test results reject the null hypothesis that the instrumental variables are under identified, and the F-statistic value of the weak instrumental variable test results is much larger than the critical value of 10% significance level, indicating that the participation indices (lag 1 and lag 2) pass the under identified and weak instrumental variable tests. Fundamentally, the instrumental variables in this study are valid. More importantly, the instrumental variables’ regression results still support this study’s primary conclusion: an increase in GVC forward and backward participation increases the carbon emissions embodied in exports of China across sectors.
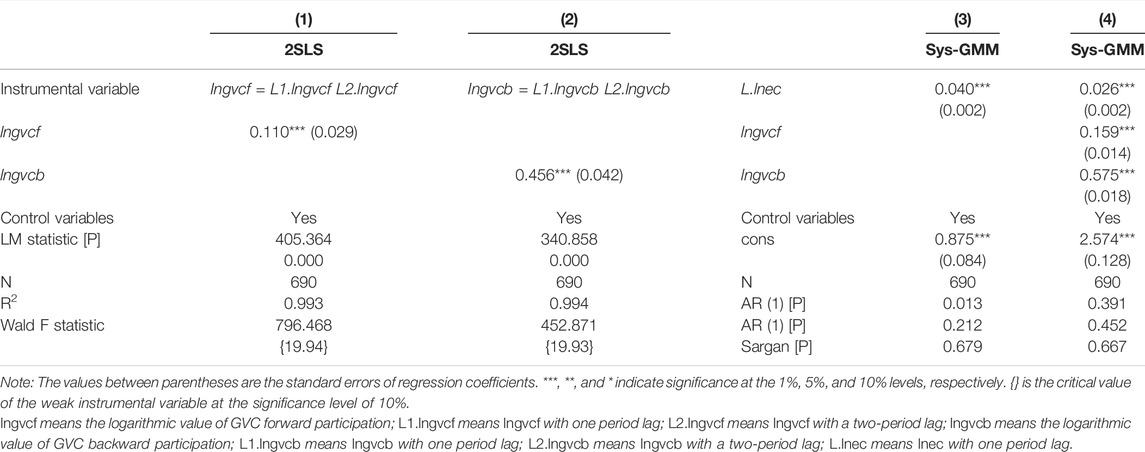
TABLE 4. Endogeneity test results.
In the baseline regression, we use a static panel model of fixed effects for the regression analysis, while the carbon emission behavior of each sector has some continuity, which leads to a potential model -setting bias problem. Therefore, this study introduces the first-order lagged term L. lnec of the explanatory variable as the explanatory variable for dynamic panel estimation. The systematic generalized method of moments (GMM) is an estimation method widely used in dynamic panel data estimation to deal with the endogeneity problem with higher estimation validity. Therefore, this study uses a systematic GMM model to further test the robustness of the baseline regression results, as shown in columns 3) and 4) of Table 4. The reasonableness of the dynamic panel setting is tested by the significance of the explanatory variables with one period lag, the results of the AR (1) and AR (2) tests of the systematic GMM, and the results of the Sargan test. The results show that the coefficient of L. lnec is significantly positive at the 1% level, reflecting that the carbon emissions embodied in exports have path-dependent characteristics and dynamic features, and the carbon emissions embodied in exports in the previous period have a significant positive impact on the carbon emissions embodied in exports in the current period. Both the Arellano-Bond test and over-identification test passed, indicating no autocorrelation in the error terms, that all instrumental variables are valid, and the model setting is reasonable. As shown in Table 4, the regression results after replacing the estimation method are still consistent with the baseline regression results, that is, the higher the forward and backward participation in GVCs, the higher the carbon emissions embodied in exports by sectors.
3.3 Further Analysis of GVC Embedding Patterns
The results of the baseline regression and endogeneity tests indicate that both the forward embedding pattern of GVCs characterized by increasing forward participation and the backward embedding pattern of GVC characterized by increasing backward participation increase the carbon emissions embodied in exports of China in all sectors. Therefore, the question remains, is the increase in carbon emissions embodied in exports an inevitable consequence of China’s embedding in GVC? Why are developed countries able to reap both economic and environmental benefits from the GVC division of labor? Considering that the metric characterized by GVC forward/backward participation only represents the degree of forward/backward embedding of GVCs, but not the position of forward/backward embedding of GVC. This study continues to use the forward and backward production chain length indicators constructed by Wang et al. (2017b) to characterize the location of the forward and backward GVC embedding in each sector in China as a way to examine the impact of the location of the forward and backward GVC embedding on the carbon emissions embodied in exports. The length of the production chain is defined as the average number of production stages in sector k in country s from the initial value added input to the consumption of the final good and can be expressed in a matrix as:
The equation expresses the total global output driven by one unit of value added, and the longer the production chain, the more times the value added of the industry is counted as total global output. After summing the column variables of Eq. 13, each sector’s forward production chain length in China can be obtained. This represents the number of production stages from the value added of inputs in one sector in China to the final consumption in other countries and sectors, which is decomposed to obtain the length of the GVC forward production chain:
where Xv_GVC is the total output created by the value-added brought by exporting intermediate products and V_GVC is the domestic value-added brought about by the export of intermediate products. The longer the GVC forward production chain, the more the value added of the sector is counted as total output in the GVC, and the more the number of production stages downstream of it, the more it is in the upstream of the GVC. By summing the row variables of Eq. 13, the backward production chain length of each sector in China can be obtained. This represents the number of production stages from the final consumption of a certain sector in China to the initially added value input, which can be decomposed to obtain the length of GVC backward production chain:
where Xy_GVC is the final output created in the country by foreign valueadded of intermediate products imported and Y_GVC is the foreign value-added of the import of intermediate products. The longer the GVC backward production chain is, the more upstream production stages it has, and the more downstream of the GVC it is. Meanwhile, the ratio of the length of GVC forward production chain to the length of the backward production chain is the GVC position index, that is,
A larger GVC position index indicates that the sector is closer to the upstream of the GVC. The regression analysis was conducted with the logarithm of the length of the GVC forward and backward production chain and the logarithm of the GVC position index as the core explanatory variables of Eq. 1, and the results are shown in Table 5.
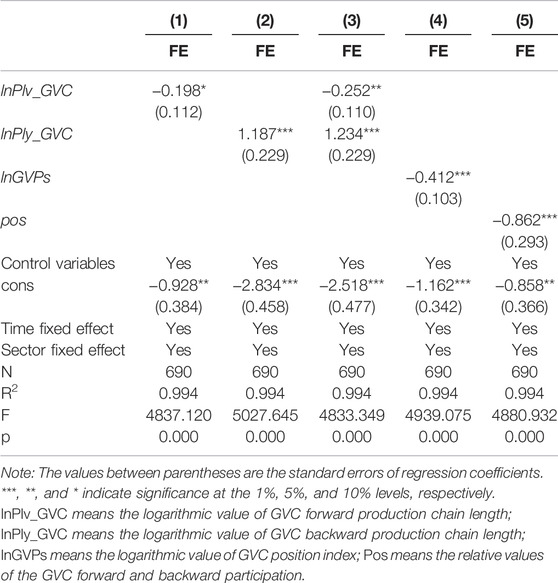
TABLE 5. Analysis of the length of forward/backward production chains and the position in the GVC.
Column 1) of Table 5 adds only the GVC forward production chain length, and the regression results show that the estimated coefficient of the GVC forward production chain length is significantly negative at the 10% level, indicating that increasing the forward production chain length can reduce the carbon emissions embodied in exports of China in all sectors. This is partly because when China participated in GVCs in the forward embedding pattern, it needed to provide intermediate products for other countries. The multinational company-led GVCs, with high quality and environmental standards, require each sector to upgrade its own low-carbon technology. By contrast, the increased length of the forward production chain means that China is moving up the value chain, with increased international inter-industry linkages and higher economic and technological complexity. This forward embedding pattern of GVCs through technology level upgrading is beneficial to reducing the carbon emissions embodied in exports of China in all sectors. Column 2) of Table 5 shows the regression results for GVC backward production chain length, and the results indicate that an increase in GVC backward production chain length increases the carbon emissions embodied in exports. The main reason is that the longer length of the GVC backward production chain indicates that China is in the downstream position in the GVC when its technology level is limited. Furthermore, it is easy to form a dependence on high technology intermediate products from developed countries and China is then locked into the low-end link of the GVC.
Column 3) of Table 5 adds both GVC forward production chain length and backward production chain length, and the regression results still show that GVC forward production chain length has a negative effect on carbon emissions embodied in exports, whereas GVC backward production chain length has a positive effect on carbon emissions embodied in exports. Column 4) of Table 5 reports the effect of the GVC position index on the carbon emissions embodied in exports, and the results show that the regression coefficient of the GVC position index is -0.412 and passes the 1% level of the significance test. This suggests that a country’s production process becomes “cleaner” as it moves up the global value chain, effectively reducing carbon emissions embodied in exports. This is consistent with our findings using GVC forward and backward production chain lengths. In column 5) of Table 5, we construct a proxy variable for the GVC position index (pos) using the relative values of the GVC forward and backward participation for robustness testing, and the results still support the conclusion that increasing the GVC position index helps to reduce the carbon emissions embodied in exports.
3.4 Sectoral Heterogeneity Analysis
The previous section systematically examined the impact of different GVC embedding patterns on the carbon emissions embodied in exports of China by sector. Next, we further explore the differences in the impact of different embedding patterns on the carbon emissions embodied in exports of China based on the perspective of sectoral heterogeneity. Drawing on Yang and Tian (2020), this study divides the sample into three sample groups according to factor intensity: labor-intensive, capital-intensive, and technology-intensive, and the detailed industry classification results are presented in Supplementary Appendix SA. The sub-sample regression results of adding GVC forward participation, GVC backward participation, GVC forward production chain length, GVC backward production chain length, and GVC position index are summarized in Table 6.
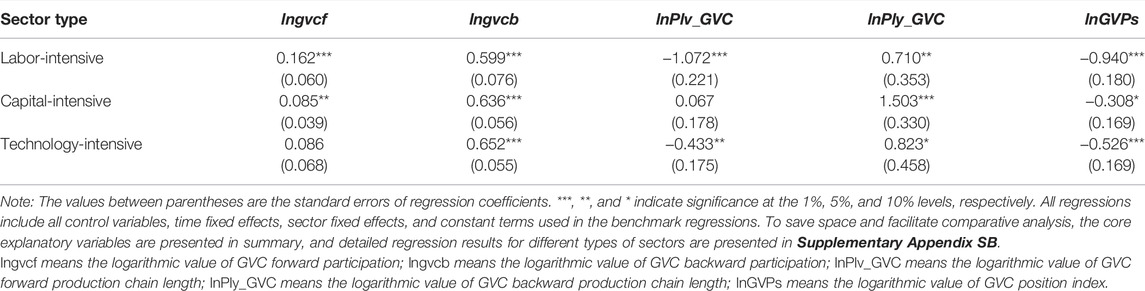
TABLE 6. Results of heterogeneity analysis for different types of sectors.
From Table 6, we find that the regression results for labor-intensive sectors are consistent with the full sample; increasing the GVC forward and backward participation and increasing the GVC backward production chain length all increase the carbon emissions embodied in exports in labor-intensive sectors. In addition, increasing the GVC forward production chain length and improving the GVC location index are beneficial to mitigate the carbon emissions embodied in exports in labor-intensive sectors. This means that although the labor-intensive sector is deeply involved in GVC for economic gains, it also poses serious resource consumption and environmental pollution problems for China. Labor-intensive sectors should make full use of the technology spillover effect brought by the import of raw materials and intermediate products from developed countries, upgrade their own clean technology level, and keep climbing up the value chain to reduce the carbon emissions embodied in exports. The difference between the regression results for the capital-intensive sector and the full sample is mainly in the indicator of the length of the GVC forward production chain, and the regression results show that the length of the GVC forward production chain does not have a significant effect on the carbon emissions embodied in exports in the capital-intensive sector. This may be because China’s capital-intensive sectors are closer to the upper reaches of the GVC than its labor-intensive sectors, but there is still a gap with the world’s advanced levels. Therefore, when the capital-intensive sector continues to move up the GVC, the dominant player in the GVC may “capture” the capital-intensive sector through technical and quality barriers to maintain its monopoly position, inhibiting the effect of carbon emission reduction in the length of the GVC forward production chain.
The difference between the regression results for the technology-intensive sector and the full sample is mainly in the indicator of GVC forward participation, which shows that increasing GVC forward participation does not significantly affect the carbon emissions embodied in exports of China in the technology-intensive sector. This is partly because the technology-intensive sector has a high level of cleanliness and low carbon intensity and partly because the technology-intensive sector has a strong ability to learn and absorb advanced energy-saving and emission reduction technologies from developed countries, which can break through the potential “capture effect.” In general, the backward embedding pattern of GVCs, either characterized by backward participation or by backward production chain length, makes a significant contribution to the carbon emissions embodied in exports in all sectors, whereas the increase in the GVC location index is beneficial to carbon reduction in all sectors. As for the forward embedding pattern, it varies depending on the attributes of the products provided by different intensity types of sectors. Labor-intensive and technology-intensive sectors can reduce the carbon emissions embodied in exports by increasing the length of the forward production chain, whereas capital-intensive sectors do not have this advantage.
4 Conclusion and Policy Implications
Based on the input-output data of 46 sectors in China from 2000 to 2014, this study systematically examines the impact of forward embedding and backward embedding on the carbon emissions embodied in exports. The results show that the GVC forward embedding pattern characterized by increasing forward participation will increase carbon emissions embodied in exports of China, and the GVC forward embedding pattern characterized by increasing the length of the forward production chain will reduce carbon emissions embodied in exports of China. Any form of backward embedding pattern will increase the carbon emissions embodied in exports, and the promotion of GVC will help reduce the carbon emissions embodied in exports. The heterogeneity test results show that increasing the length of the forward production chain can reduce the carbon emissions embodied in exports of labor- and technology-intensive sectors significantly. However, it has no significant impact on capital-intensive sectors. Improving the embeddedness of the global value chain can help reduce the carbon emissions embodied in the exports of all sectors.
Based on the above conclusion, this study puts forward the following policy recommendations:
First, changing the GVC embedding pattern. For a long time, China has participated in the GVC division of labor in the backward embedding pattern by virtue of its cheap labor and abundant natural resources, which brings lower trade benefits and non-negligible environmental costs. The foreign trade mode of “world factory” and “processing trade” has made it more difficult for China to reduce carbon emissions. Therefore, under the trend of the GVC division of labor, to achieve green and coordinated development of trade and environment, China should adjust its GVC embedding pattern from processing trade to general trade and service trade with smaller carbon emissions and higher value added to alleviate the pressure of carbon emissions embodied in exports brought by the scale effect. The public sector should also increase penalties for environmental pollution, phase out industries with high pollution and energy consumption, and promote technological upgrading and structural adjustment in industries with traditional resource and labor advantages to reduce the production of environmental pollutants.
Second, improving the position of GVC embedding. The upstream of GVCs is mainly engaged in R &D and design and other high-tech production activities, with low energy consumption and high added value of products, conducive to achieving win-win economic and environmental benefits. Therefore, for China to achieve high-quality economic growth, it must gradually upgrade its embedding position in the GVC. On the one hand, the government can encourage the development of new technology industries through tax breaks and other preferential policies to form R&D and brand advantages and embed them in the upstream links of GVC.
On the other hand, when deepening the GVC division of labor, each sector should make full use of the technology spillover effect and learning effect, continuously absorb advanced foreign clean technology and management experience, improve product quality, create brand advantages and national characteristics of Chinese products, as well as enhance the status of China’s embedding in the GVC to effectively reduce carbon emissions embodied in exports.
Third, focusing on developing energy-saving and emission reduction technologies and clean industries. Under the GVC division of labor, a country’s high or low innovation capacity determines the extent and position of its embedding in the GVC, as well as its economic and environmental gains in the GVC. Therefore, the government should sincerely implement an innovation-driven development strategy, increase investment in research and development of energy-saving and emission reduction technologies, and change the coal-based energy consumption structure. The government should also promote the integration of big data and artificial intelligence with the real economy, vigorously develop clean industries and artificial intelligence fields, and promote foreign trade transformation from high-energy-consuming industries to clean industries. Moreover, it is vital to accelerate the development of the domestic carbon emissions trading market, enhance cooperation among various sectors, and reduce the production of environmental pollutants.
This study provides a theoretical basis and policy reference for China to effectively reduce the carbon emissions embodied in exports from the GVC perspective and achieve the “carbon peaking and carbon neutrality goal.” Nonetheless, this study has the following limitations. First, when measuring the carbon emissions embodied in China’s export, this study adopts the traditional gross trade accounting framework and fails to exclude the “foreign component” from total trade, thus overestimating the actual embodied domestic emissions of China’s exports. In the future, we will actively explore the embodied carbon emissions accounting method based on the value-added trade accounting framework to eliminate the influence of imported intermediate products, and simultaneously exclude the double-counting part generated by intermediate products crossing the border several times, to more truly reflect the carbon emissions embodied in China’s export. Second, because of the data limitations, the time span chosen in this study to examine the impact of GVC embedding on the carbon emissions embodied in exports is 2000–2014, and the latest value chain division of labor cannot be analyzed. Lastly, this study does not propose an intrinsic framework of GVC embedding affecting carbon emissions embodied in exports from the perspective of a theoretical model, nor does it verify the mechanism of action of GVC embedding affecting carbon emissions embodied in exports. In future research, we will seek breakthroughs in these aspects.
Data Availability Statement
Publicly available datasets were analyzed in this study. This data can be found here: https://www.rug.nl/ggdc/valuechain/wiod/</.
Author Contributions
HC: conceptualization, methodology, data processing, and writing (original draft); CZ: data collection, validation, and writing (review and editing); KY: visualization, investigation, supervision, and writing (review and editing).
Funding
This study is supported by the National Social Science Found Major Projects of China (14ZDB151).
Conflict of Interest
The authors declare that the research was conducted in the absence of any commercial or financial relationships that could be construed as a potential conflict of interest.
Publisher’s Note
All claims expressed in this article are solely those of the authors and do not necessarily represent those of their affiliated organizations, or those of the publisher, the editors and the reviewers. Any product that may be evaluated in this article, or claim that may be made by its manufacturer, is not guaranteed or endorsed by the publisher.
Supplementary Material
The Supplementary Material for this article can be found online at: https://www.frontiersin.org/articles/10.3389/fenvs.2022.950869/full#supplementary-material
Reference
Assamoi, G. R., Wang, S., Liu, Y., Gnangoin, T. B. Y., Kassi, D. F., and Edjoukou, A. J. (2020). Dynamics between Participation in Global Value Chains and Carbon Dioxide Emissions: Empirical Evidence for Selected Asian Countries. Environ. Sci. Pollut. Res. Int. 27 (4), 16496–16506. doi:10.1007/s11356-020-08166-9
Chaiyasoonthorn, W., Khalid, B., and Chaveesuk, S. (2019). “Success of Smart Cities Development with Community’s Acceptance of New Technologies: Thailand Perspective,” in Proceedings of the 9th International Conference on Information Communication and Management, 106–111.
Chaveesuk, S., Khalid, B., and Chaiyasoonthorn, W. (2021). Digital Payment System Innovations: A Marketing Perspective on Intention and Actual Use in the Retail Sector. Innov. Mark. 17 (3), 109–123. doi:10.21511/im.17(3).2021.09
Chen, H., Wang, S., and Song, M. (2021). Global Environmental Value Chain Embeddedness and Enterprise Production Efficiency Improvement. Struct. Change Econ. Dyn. 58, 278–290. doi:10.1016/j.strueco.2021.06.004
Deng, G., and Xu, Y. (2017). Accounting and Structure Decomposition Analysis of Embodied Carbon Trade: A Global Perspective. Energy 137, 140–151. doi:10.1016/j.energy.2017.07.064
Duan, Y. W., Ji, T., and Yu, T. T. (2020). Reassessing Pollution Haven Effect in Global Value Chains. J. Clean. Prod. 284, 124705.
Fei, R., Pan, A., Wu, X., and Xie, Q. (2020). How GVC Division Affects Embodied Carbon Emissions in China's Exports? Environ. Sci. Pollut. Res. 27 (29), 36605–36620. doi:10.1007/s11356-020-09298-8
Hertwich, E. G. (2020). Carbon Fueling Complex Global Value Chains Tripled in the Period 1995-2012. Energy Econ. 86, 1–12. doi:10.1016/j.eneco.2019.104651
Jiang, X., and Liu, Y. (2015). Global Value Chain, Trade and Carbon: Case of Information and Communication Technology Manufacturing Sector. Energy Sustain. Dev. 25, 1–7. doi:10.1016/j.esd.2014.12.001
Koopman, R., Wang, Z., and Wei, S.-J. (2014). Tracing Value-Added and Double Counting in Gross Exports. Am. Econ. Rev. 104 (2), 459–494. doi:10.1257/aer.104.2.459
Lannelongue, G., Gonzalez-Benito, J., and Quiroz, I. (2017). Environmental Management and Labour Productivity: The Moderating Role of Capital Intensity. J. Environ. Manag. 190, 158–169. doi:10.1016/j.jenvman.2016.11.051
Le, T.-H., Chang, Y., and Park, D. (2016). Trade Openness and Environmental Quality: International Evidence. Energy Policy 92, 45–55. doi:10.1016/j.enpol.2016.01.030
Li, Q., Wu, S., and Li, S. (2022). Weighing China's Embodied CO2 Emissions and Value Added under Global Value Chains: Trends, Characteristics, and Paths. J. Environ. Manag. 316, 115302. doi:10.1016/j.jenvman.2022.115302
Li, X., Yu, Y., Shi, X., and Hu, X. (2021). Tracking the Domestic Carbon Emission Intensity of China's Construction Industry: A Global Value Chain Perspective. Front. Environ. Sci. 9, 728787. doi:10.3389/fenvs.2021.728787
Li, X., Yu, Y., Shi, X., and Hu, X. (2021). Tracking the Domestic Carbon Emission Intensity of China's Construction Industry: A Global Value Chain Perspective. Front. Environ. Sci. 9, 728787. doi:10.3389/fenvs.2021.728787
Liu, C. J., and Zhao, G. M. (2020). Can Global Value Chain Participation Affect Embodied Carbon Emission Intensity? J. Clean. Prod. 287 (4), 125069.
Liu, H., Lackner, K., and Fan, X. (2021). Value-added Involved in CO2 Emissions Embodied in Global Demand-Supply Chains. J. Environ. Plan. Manag. 64 (1), 76–100. doi:10.1080/09640568.2020.1750352
Liu, H. Z., Zong, Z., Hynes, K., and De Bruyne, K. (2019). Can China Reduce the Carbon Emissions of its Manufacturing Exports by Moving up the Global Value Chain? Res. Int. Bus. Financ. 51, 101101.
Liu, M., Tan, R., and Zhang, B. (2021). The Costs of “Blue Sky”: Environmental Regulation, Technology Upgrading, and Labor Demand in China. J. Dev. Econ. 150, 102610. doi:10.1016/j.jdeveco.2020.102610
Meng, B., Peters, G. P., Wang, Z., and Li, M. (2018). Tracing CO2 Emissions in Global Value Chains. Energy Econ. 73, 24–42. doi:10.1016/j.eneco.2018.05.013
Mi, Z., Zheng, J., Green, F., Guan, D., Meng, J., Feng, K., et al. (2021). Decoupling without Outsourcing? How China's Consumption-Based CO2 Emissions Have Plateaued. iScience 24 (10), 103130. doi:10.1016/j.isci.2021.103130
Morck, R., and Yeung, B. (2016). China in Asia. China Econ. Rev. 40, 297–308. doi:10.1016/j.chieco.2016.07.009
Qian, Z., Zhao, Y., Shi, Q., Zheng, L., Wang, S., and Zhu, J. (2022). Global Value Chains Participation and CO2 Emissions in RCEP Countries. J. Clean. Prod. 332, 130070. doi:10.1016/j.jclepro.2021.130070
Shi, D. D., Chen, Z. J., and Hajduk-Stelmachowicz, M. (2021). The Role of the Global Value Chain in Improving Trade and the Sustainable Competitive Advantage: Evidence from China's Manufacturing Industry. Front. Environ. Sci. 9, 779295.
Shi, Q., Zhao, Y., Qian, Z., Zheng, L., and Wang, S. (2022). Global Value Chains Participation and Carbon Emissions: Evidence from Belt and Road Countries. Appl. Energy 310, 118505. doi:10.1016/j.apenergy.2021.118505
Su, B., and Thomson, E. (2016). China's Carbon Emissions Embodied in (Normal and Processing) Exports and Their Driving Forces, 2006-2012. Energy Econ. 59, 414–422. doi:10.1016/j.eneco.2016.09.006
Su, H. Y., Li, T. Y., and Hou, F. M. (2020). Analysis of the Impact of China's Manufacturing Industry in the Global Value Chain on Carbon Emissions. Int. J. Environ. Pollut. 67 (2-4), 132–152.
Sun, Y.-Y. (2019). Global Value Chains and National Tourism Carbon Competitiveness. J. Travel Res. 58 (5), 808–823. doi:10.1177/0047287518781072
Tokito, S. (2018). Environmentally-Targeted Sectors and Linkages in the Global Supply-Chain Complexity of Transport Equipment. Ecol. Econ. 150, 177–183. doi:10.1016/j.ecolecon.2018.04.017
Tunç, G. İ., Akbostancı, E., and Türüt-Aşık, S. (2022). Ecological Unequal Exchange between Turkey and the European Union: An Assessment from Value Added Perspective. Ecol. Econ. 192, 107269. doi:10.1016/j.ecolecon.2021.107269
Wang, S.-H., Li, Z.-Z., and Song, M. (2019). How Embodied Carbon in Trade Affects Labor Income in Developing Countries. Sci. Total Environ. 672, 71–80. doi:10.1016/j.scitotenv.2019.03.456
Wang, S., Chen, H., and Yin, K. (2022a). The Employment Effect of Chinese Industrial Enterprises Embedded in Environmental Cost-Adjusted Global Value Chains. Environ. Sci. Pollut. Res. 29 (12), 18160–18176. doi:10.1007/s11356-021-17118-w
Wang, S. H., and Chen, H. X. (2022). Could Chinese Enterprises Real Benefit from Embedding in Global Value Chains? Environ. Dev. Sustain., 1–30.
Wang, S., He, Y., and Song, M. (2021). Global Value Chains, Technological Progress, and Environmental Pollution: Inequality towards Developing Countries. J. Environ. Manag. 277, 110999. doi:10.1016/j.jenvman.2020.110999
Wang, Y. F., and Yao, J. M. (2022). Complex Network Analysis of Carbon Emission Transfers under Global Value Chains. Environ. Sci. Pollut. Res. 1-23. doi:10.1007/s11356-022-19215-w
Wang, Z., Wei, S. J., Yu, X. D., and Zhu, K. F. (2017b). Characterizing Global Value Chains: Production Length and Upstreamness. New York: NBER Working Paper. No. 23261.
Wang, Z., Wei, S. J., Yu, X. D., and Zhu, K. F. (2017a). Measures of Participation in Global Value Chains and Global Business Cycles. New York: NBER Working Paper. No. 23222.
Wang, Z., Zhang, Y., Liao, C., Ai, H., and Yang, X. (2022b). What Contributes to the Growth of China's Embodied CO2 Emissions? Incorporating the Global Value Chains Concept. Appl. Econ. 54 (12), 1335–1351. doi:10.1080/00036846.2021.1976382
Wu, X. D., Guo, J. L., Li, C., Chen, G. Q., and Ji, X. (2020). Carbon Emissions Embodied in the Global Supply Chain: Intermediate and Final Trade Imbalances. Sci. Total Environ. 707, 134670. doi:10.1016/j.scitotenv.2019.134670
Xiao, H., Sun, K., Tu, X., Bi, H., and Wen, M. (2020). Diversified Carbon Intensity under Global Value Chains: A Measurement and Decomposition Analysis. J. Environ. Manag. 272, 111076. doi:10.1016/j.jenvman.2020.111076
Yan, Y., Wang, R., Zheng, X., and Zhao, Z. (2020). Carbon Endowment and Trade-Embodied Carbon Emissions in Global Value Chains: Evidence from China. Appl. Energy 277, 115592. doi:10.1016/j.apenergy.2020.115592
Yang, H. X., and Tian, H. G. (2020). Technological Progress of China's Manufacturing Industry and Global Value Chain Position Evolution: A Double Threshold Model of Technological Advancement and Participation. Financ. Trade. Res. 31 (11), 27103130–27103140.
Ye, C., Ye, Q., Shi, X., and Sun, Y. (2020). Technology Gap, Global Value Chain and Carbon Intensity: Evidence from Global Manufacturing Industries. Energy Policy 137, 111094. doi:10.1016/j.enpol.2019.111094
Zhang, K., and Wang, X. (2021). Pollution Haven Hypothesis of Global CO2, SO2, NOx-Evidence from 43 Economies and 56 Sectors. Ijerph 18 (12), 6552. doi:10.3390/ijerph18126552
Zhang, Z., Zhu, K., and Hewings, G. J. D. (2017). A Multi-Regional Input-Output Analysis of the Pollution Haven Hypothesis from the Perspective of Global Production Fragmentation. Energy Econ. 64, 13–23. doi:10.1016/j.eneco.2017.03.007
Zheng, L., Zhao, Y., Shi, Q., Qian, Z., Wang, S., and Zhu, J. (2022). Global Value Chains Participation and Carbon Emissions Embodied in Exports of China: Perspective of Firm Heterogeneity. Sci. Total Environ. 813, 152587. doi:10.1016/j.scitotenv.2021.152587
Keywords: embodied carbon emissions, global value chains, MRIO model, forward embedding, backward embedding
Citation: Chen H, Zhang C and Yin K (2022) The Impact of Global Value Chain Embedding on Carbon Emissions Embodied in China’s Exports. Front. Environ. Sci. 10:950869. doi: 10.3389/fenvs.2022.950869
Received: 23 May 2022; Accepted: 10 June 2022;
Published: 30 June 2022.
Edited by:
Muhammad Mohiuddin, Laval University, CanadaReviewed by:
Bilal Khalid, King Mongkut’s Institute of Technology Ladkrabang, ThailandYuting Dang, Tianjin University of Technology, China
Copyright © 2022 Chen, Zhang and Yin. This is an open-access article distributed under the terms of the Creative Commons Attribution License (CC BY). The use, distribution or reproduction in other forums is permitted, provided the original author(s) and the copyright owner(s) are credited and that the original publication in this journal is cited, in accordance with accepted academic practice. No use, distribution or reproduction is permitted which does not comply with these terms.
*Correspondence: Kedong Yin, eWlua2Vkb25nMTYzM0AxNjMuY29t