Abstract
The high-intensity development of a city encroaches on the ecological land, such as lakes, rivers, and forests, which changes the stable land relationship, resulting in ecological security problems, such as regional waterlogging and a decline in biodiversity. Identifying urban ecological systems and constructing ecological security patterns (ESP) are of great importance for urban ecological protection and spatial planning. The complexity of the ecological environment in landscape cities makes them more difficult for planning and construction than in plain cities. Additionally, they are more susceptible to torrential rains, mountain torrents, and river tides in the process of urbanization. This study introduced the functional wetland theory into the construction of the ESP and obtained a new set of methods for landscape cities. Based on the functional wetland theory, the “patch-corridor-matrix” model was used to combine the geographic information system (GIS) runoff and catchment analysis with the MSPA-MCR ecological corridor construction method to form a new wetland and habitat network by coupling the two together. Additionally, construction principles of protection priority, maximization of ecological benefits, guarantee of connectivity, and targeted design to guide the construction of landscape cities were put forward. This study takes the central urban area of Fuzhou as an example to show the application path of this method.
1 Introduction
Construction land continues to occupy the ecological landscape in the process of rapid urbanization, and the integrity of the ecosystem is under tremendous pressure (Li et al., 2011; Bai et al., 2014; Fahrig, 2019). In highly urbanized areas, habitat patches have decreased, landscape fragmentation has intensified, and connectivity between habitat patches has reduced, thereby destroying the ecosystem structure, hindering the circulation of the ecological flow, and weakening the function of the urban ecosystem (Zhou and Wang, 2011; Yang et al., 2018).
Urban ecological security has been attracting the attention of scholars in relevant fields, including urban ecological security evaluation (Xie and Li, 2004; Zhou and Wang, 2005; Li et al., 2019; Ke et al., 2021; Wen and Hou, 2021; Cheng et al., 2022) and pattern (Peng et al., 2017; Peng and Zhou, 2019; Gao et al., 2020; Lu et al., 2021; Nie et al., 2021; Wang S. et al., 2021; Gao et al., 2022; Gou et al., 2022; Li et al., 2022; Wei et al., 2022), “anti-planning” (Yu et al., 2005, 2009), and ecological infrastructure planning (Tubridy, 2020; Romero-Duque et al., 2020; Huang et al., 2022). Among them, the ecological security pattern (ESP), which uses the principles and methods of landscape ecology and geographic information system (GIS) technology to quantitatively describe the landscape structure in space, shows strong application potential in the field of urban planning.
The ESP is a spatial configuration scheme that responds to the problems of the ecological environment and maintains the continuity and stability of ecological security based on the principle of comprehensive benefit optimization (Li et al., 2019, Wang et al., 2021a,b). With the intensification of the contradiction between social development and ecological protection, studying the ESP has become crucial. Chinese research on this topic was formally proposed in the 1990s (Yu, 1996), initially referring to the use of GIS and spatial modeling to analyze interactions between landscape patterns, ecological processes, and disturbance factors and identify spaces conducive to protecting biodiversity and sustainable regional development (Kong et al., 2009). At present, the construction model of the urban ESP is continuously improving, and a variety of indicators and methods are available.
Urban ESP construction primarily focuses on points, lines, planes, and other spaces that have a considerable impact on the safety of environmental processes. The research has initially formed the basic paradigm of “source determination-corridor identification-strategic point setting.” Among them, the MSPA-MCR method is the most commonly used (Wang S. et al., 2021; Nie et al., 2021; Wei et al., 2022) and provides a scientific reference for urban ecological planning and spatial layout. The close relationship between anthropogenic activities and environmental protection is also reflected in the ESP research, which pays remarkable attention to the coupled response analysis of socio-economic development and ecological protection (Wei et al., 2022). However, there are great differences in natural conditions, economic development, and ecological problems in various cities. Therefore, it is impossible to have a general scheme for the specific construction of an ESP. For example, some studies in karst areas of southwest China considered desertification and ecosystem services with regional characteristics, which makes up for the lack of ESP construction in special areas (Gou et al., 2022).
This study analyzed landscape cities as research objects. Such cities have unique and rich landscape resources. In recent years, due to high-intensity development, mountain green space in landscape cities has been eroded and the water area has been reduced, resulting in the loss of the original inherent pattern of “mountain” and “water,” thus making it more vulnerable to natural disasters, such as rainstorms, mountain torrents, and river tides. Therefore, it is necessary to construct the ESP of the landscape cities and explore the suitability of construction land development under the guidance of ecological security objectives. Their particularity makes them more vulnerable to natural disasters, such as rainstorms, mountain torrents, and river tides. Apart from the consideration of landscape pattern and species migration, more attention needs to be paid to urban ecological security while constructing an ESP.
Convention wetlands are areas of marsh, fen, peatland, or water and can be natural or artificial and permanent or temporary, with static or flowing fresh, brackish, or salt water, including areas of marine water where the depth of low tides does not exceed 6 m (Jackson, 1976). It is one of the three great ecosystems on Earth and has the highest ecological activity. Compared with other ecosystems, it can provide greater ecological capacity under the same conditions. Wetland ecosystems include not only water bodies but also substrates, such as soil and vegetation, that conserve water bodies. For ecological security, urban wetland system research is more practical than that of a water body.
The functional wetland theory is based on the empirical experience of several design cases (Zheng and Gong, 2007, 2010, and 2020). Aiming at the sharp contradiction between urban construction and wetland protection, it systematically summarizes a set of ecological planning and design methodology theories, emphasizing the coupling between the planning structure and the ecological structure and the coupling between anthropogenic settlement environment operation and the ecological cycle. Based on the original wetland resources of the construction site, the ecological attributes are strengthened through manual combing to make it conform to the landscape ecological advantage pattern and, thus, achieve the free survival of wetlands, the ecological return of water resources, the elimination of floods, and the construction of landscapes.
Some studies have taken ecological water security issues, such as floods, into account in ESP construction (Gao et al., 2022; Li et al., 2022). However, lack of awareness of the systematization of water bodies and the surrounding environment results in considering them only as a single ecological element. The functional wetland theory focuses on the watershed as a unit, starting from the systematic integrity of wetland patches, corridors, and matrix, and solves the problems of urban water ecological security, such as flood, and black and smelly water. Introducing the functional wetland theory into ESP construction will have considerable ecological benefits. The primary method is to sort out and strengthen the existing and original wetland resources on the site by using the “patch-corridor-matrix” Foreman model based on GIS hydrological analysis. This spatial planning model is highly consistent with the traditional ESP of the “source-corridor-strategic point” model. Taking the central urban area of the landscape city of Fuzhou as an example, this study integrates the existing basic paradigm and functional wetland theory, improves the methodological framework for building an ESP, and provides a reference for ecological planning of other landscape cities. Specifically, the sub-objectives of this study are to 1) build a wetland network in line with the landscape ecological advantage pattern of the central urban area of Fuzhou, based on the GIS hydrological analysis and functional wetland theory, to alleviate waterlogging and black and smelly water bodies; 2) build a habitat network, improve regional ecological connectivity, and ensure species diversity by using the MSPA-MCR method to identify the ecological resources; and 3) couple the two networks according to certain ecological principles to form a new ESP. The optimized ESP is consistent with the state of natural land and has certain constraints and sustainability guidance for the existing and future new natural and artificial built environments.
2 Materials and methods
2.1 Study area
The landscape city was first proposed by Qian Xuesen as an ideal model based on the traditional Chinese concept of landscape. Wu Liangyong elucidated that a landscape city is an anthropogenic settlement environment, which integrates artificial and natural environments under the premise of natural conditions. In summary, a landscape city is a city that combines urban construction with nature and integrates natural landscapes into urban construction. There are many classic examples of cities built in natural landscape patterns in China, including Changsha, Chongqing, Nanjing, and Fuzhou. However, the acceleration of urbanization has made the artificial environment encroach on the natural environment, resulting in many ecological problems, such as floods and a decline in species diversity. Fuzhou is a city with mountains and rivers. Its central urban area is surrounded by mountains on three sides, and the middle river runs through it. It is rich in ecological resources; however, it is greatly affected by anthropogenic construction and has frequently occurring ecological problems. Thus, it is taken as a typical case of ESP construction in landscape cities. The central urban area of Fuzhou is located in the northeastern part of Fuzhou city, including five administrative districts, and this study combines the watershed units to redefine the study area (Figure 1).
FIGURE 1
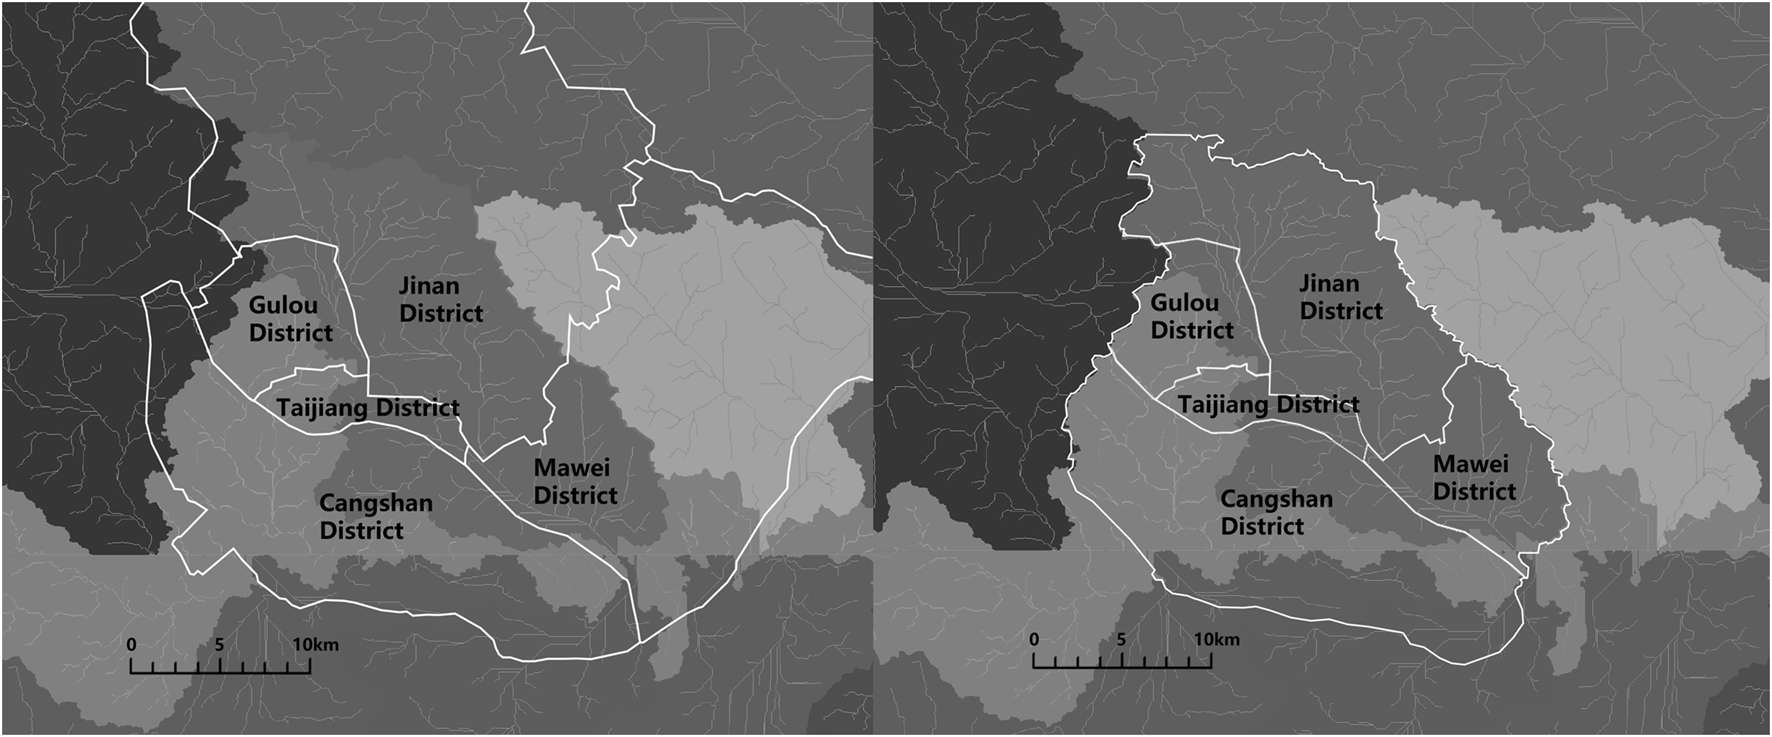
Redefinition of the central urban area of Fuzhou.
High-intensity construction and development led to the occupation of the original wetland water system space by construction land, and the water surface rate decreased (Figure 2A). Therefore, ecological problems, such as urban waterlogging and water pollution, occur frequently. Green ribbon corridors are lacking in central urban areas, and the width of urban green corridors is small, making it difficult to form internal habitats. There are many discontinuities, low connectivity, and a lack of loops in the green corridor network (Figure 2B), resulting in a series of ecological problems, such as habitat patch fragmentation and biodiversity decline.
FIGURE 2
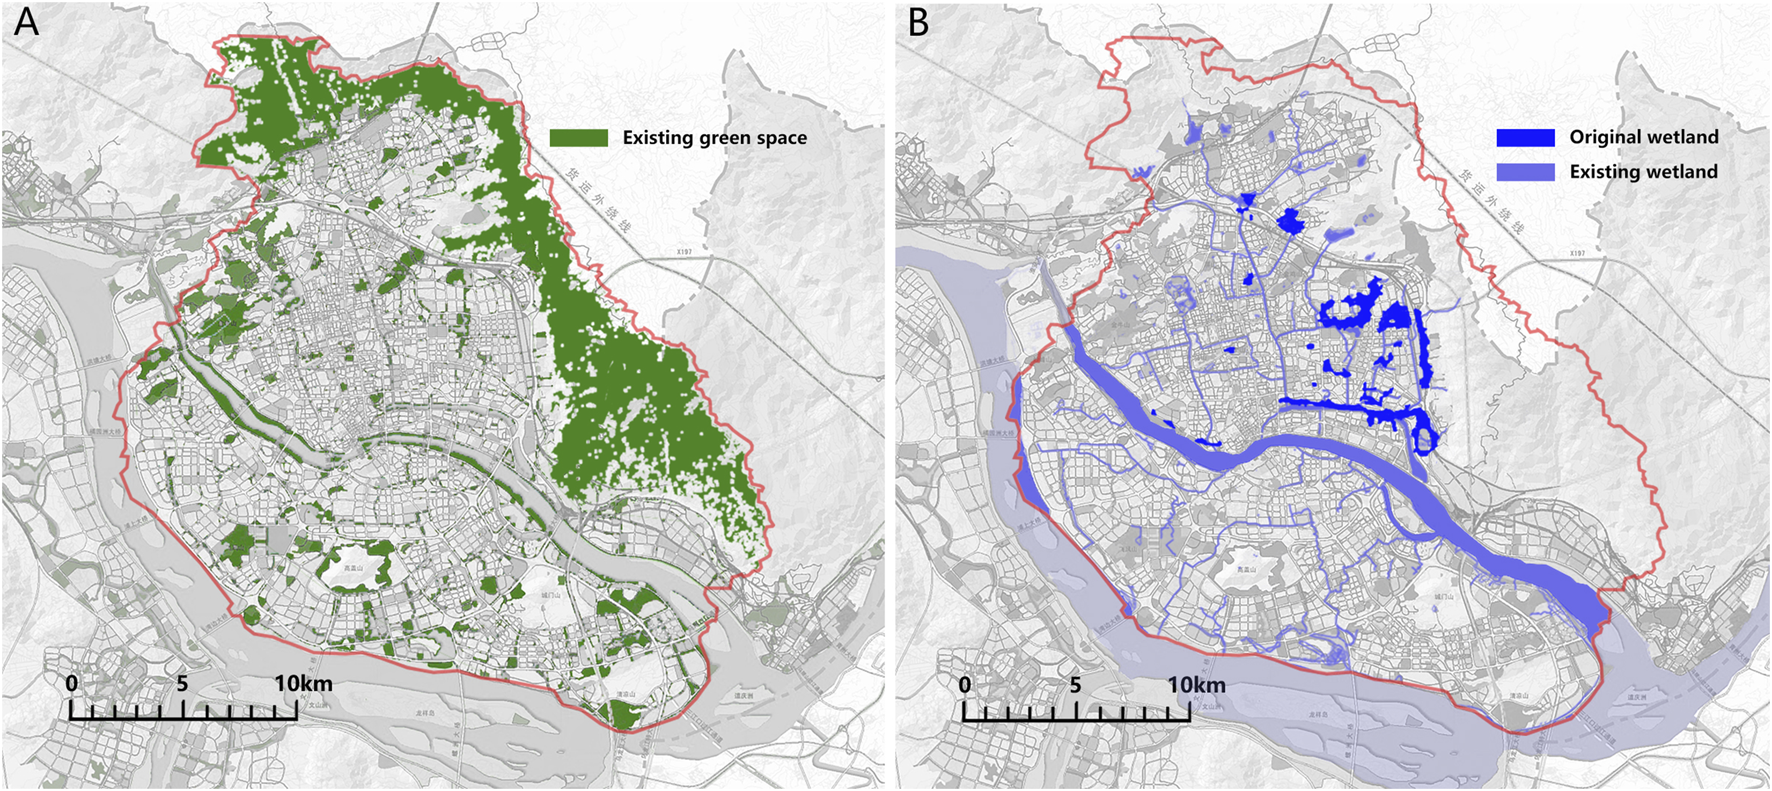
Blue and green space in the study area. (A) Original and existing wetland. (B) Existing green space.
Fuzhou has taken a series of measures to tackle these problems, such as building drainage stations, clearing obstacles, intercepting sewage, dredging, and other measures to deal with flood disasters (Liu, 2014; Zhang et al., 2018), and building green belts around the city and delimiting green lines in parks to connect the landscape pattern and protect biodiversity. However, these measures have not yet achieved the expected results and have only temporarily alleviated the urban problems. Moreover, they have failed in mitigating the root cause of the urban ecological structure.
2.2 Data sources and preparation
The Landsat satellite image for 2017 was downloaded from the Resource and Environmental Science Data Center of the Chinese Academy of Sciences1 at a spatial resolution of 30 m × 30 m. Land use data were obtained after extraction by using a mask. An Advanced Spaceborne Thermal Emission and Reflection Radiometer Global Digital Elevation Model (ASTER GDEM) with a spatial resolution of 30 m was downloaded from Geospatial Data Cloud2. The latest computer-aided design (CAD) file of Fuzhou central city was downloaded for extracting the current wetlands. Based on these data, the runoff, river network, ecological sources, comprehensive resistance base level, and cost distance, were obtained after the analysis of the GIS and Guidos Toolbox3.
2.3 Methods
Based on the general ESP construction method, this study introduces the functional wetland theory to form a new method framework that includes the following four steps (Figure 3): 1) identify and sort out the existing wetlands by using the CAD and satellite image map; 2) scientifically restore some occupied wetlands through the GIS hydrological analysis to form a wetland network with a “patch-corridor-matrix” model, which is coupled together to form a new ESP; 3) identify forest, wetland, and other ecological sources through the morphological spatial pattern analysis (MSPA) method; and 4) construct the comprehensive ecological resistance surface and generate the potential ecological corridor through the minimum cumulative resistance (MCR) method. The stepping stone is set in combination with the location of the ecological sources to form the habitat network of “source-corridor-stepping stone.”
FIGURE 3
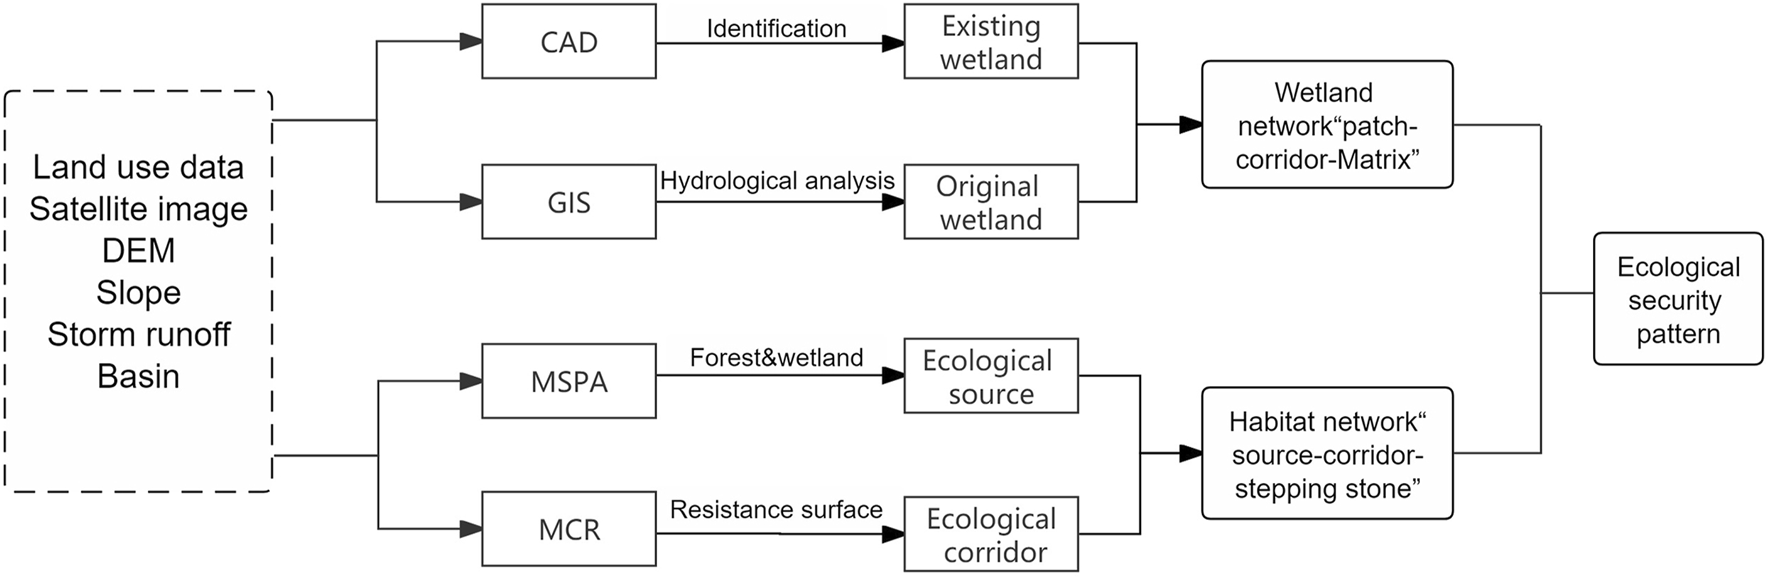
Methodological framework used in this study.
2.3.1 Runoff confluence by GIS analysis
First, GDEM v2 30-m resolution digital elevation data downloaded from the Geospatial Data Cloud were loaded in ArcMap, and the Spatial Analyst-Hydrology-Fill command was executed to fill the depression in the area. Then, the flow direction tool and the D8 algorithm were used to obtain the flow direction data (Figure 4A). Second, the ridge line between basins was identified, and the basin was depicted in the analysis window. The basin observed the regional convergence pattern directly and was used for redefining the boundary of the study area (Figure 4B). Third, flow grid data were obtained by the command of flow calculation. The flow grid was filtered by using the con condition function, and data greater than 800 were extracted. Then, the river network was generated (Figure 4C). Finally, the river network was divided into five classes by the command of river network classification (Figure 4D). River types were identified and classified according to the number of tributaries, and some characteristics of the river were inferred from the river level.
FIGURE 4
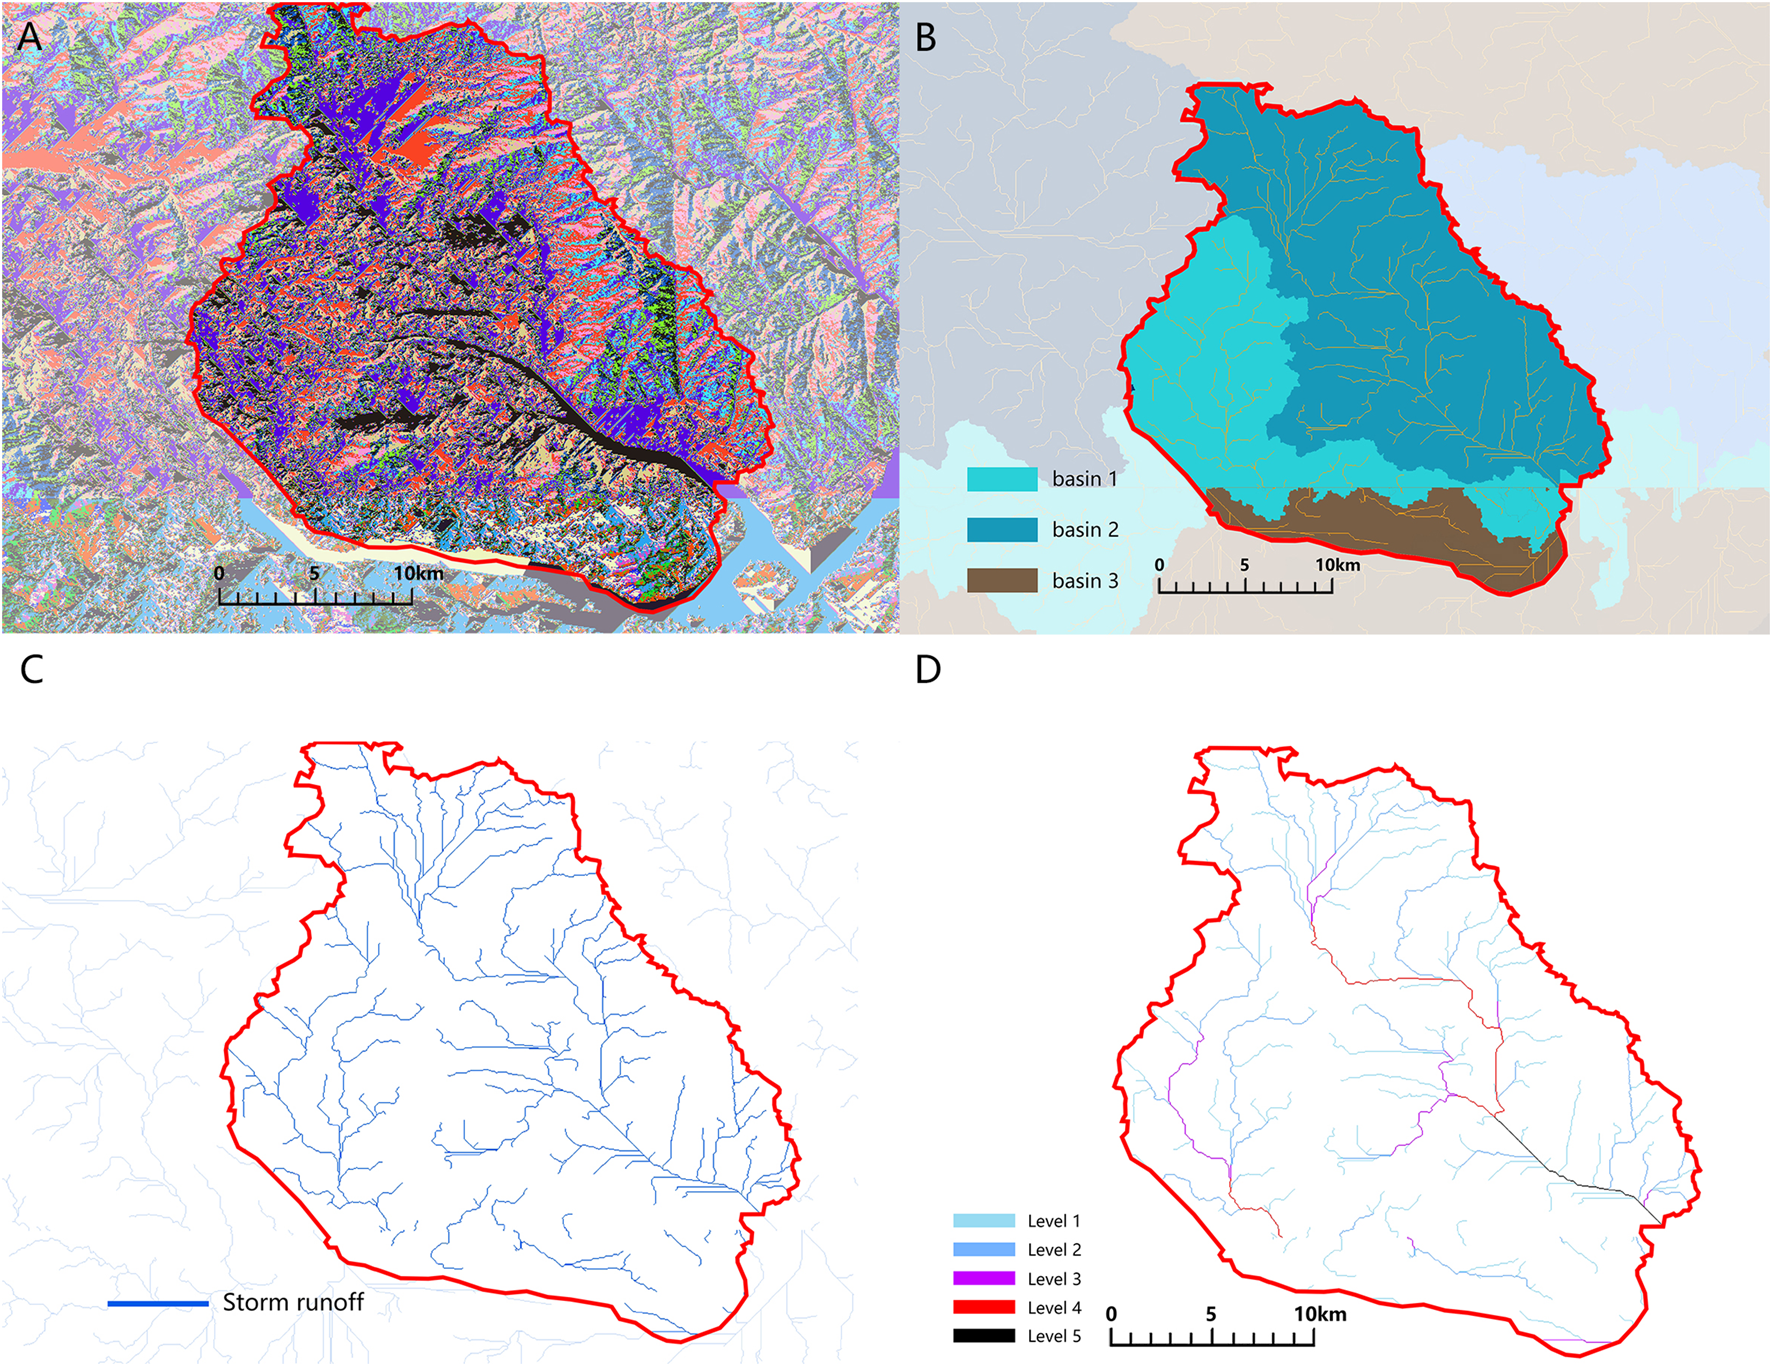
Hydrological analysis in the study area. (A) Flow direction, (B) drainage basin, (C) storm runoff, and (D) storm network classification.
2.3.2 Combination of the existing wetlands
According to the satellite image map of the central urban area and CAD data on Fuzhou in 2020, the existing wetland space was extracted. The wetland in this study was classified into wetland corridors and patches according to the spatial form. According to the scale, it was divided into three levels, and the ecological connection between the patch and corridor was investigated (
Figure 5).
1) Wetland patches. Primary wetland patches have a complete ecosystem from waterfowl to microorganisms, with not less than 10,000 m2 area. Secondary wetland patches have an area in the range of 500–10000 m2, with relatively complete ecological functions. Tertiary wetland patches refer to some isolated small ponds and low-lying land with an area of less than 500 m2 and do not have an independent ecological function of wetlands. This study discusses the construction of the ESP, primarily for the primary and secondary wetland patches. The tertiary wetland patches require designing on a smaller scale.
2) Wetland corridor. The water surface width of the primary wetland corridor is generally greater than 15 m, primarily connecting the primary and secondary wetland patches. A secondary wetland corridor has a water surface width in the range of 3–15 m and belongs to a secondary corridor, which is primarily connected with the secondary wetland patches. The tertiary wetland corridor is generally less than 3 m and is not considered an ecological corridor. Therefore, it is excluded in this study.
3) Wetland matrix. The wetland matrix supports the wetland system. It is primarily composed of revetment, urban green space, permeable ground, and the ecological interface of buildings, among which the green enclosure belt around the wetland plays a major role. Richness, width, density, and artificial degree of vegetation in the enclosure are the comprehensive factors affecting the ecological activity of a wetland.
FIGURE 5
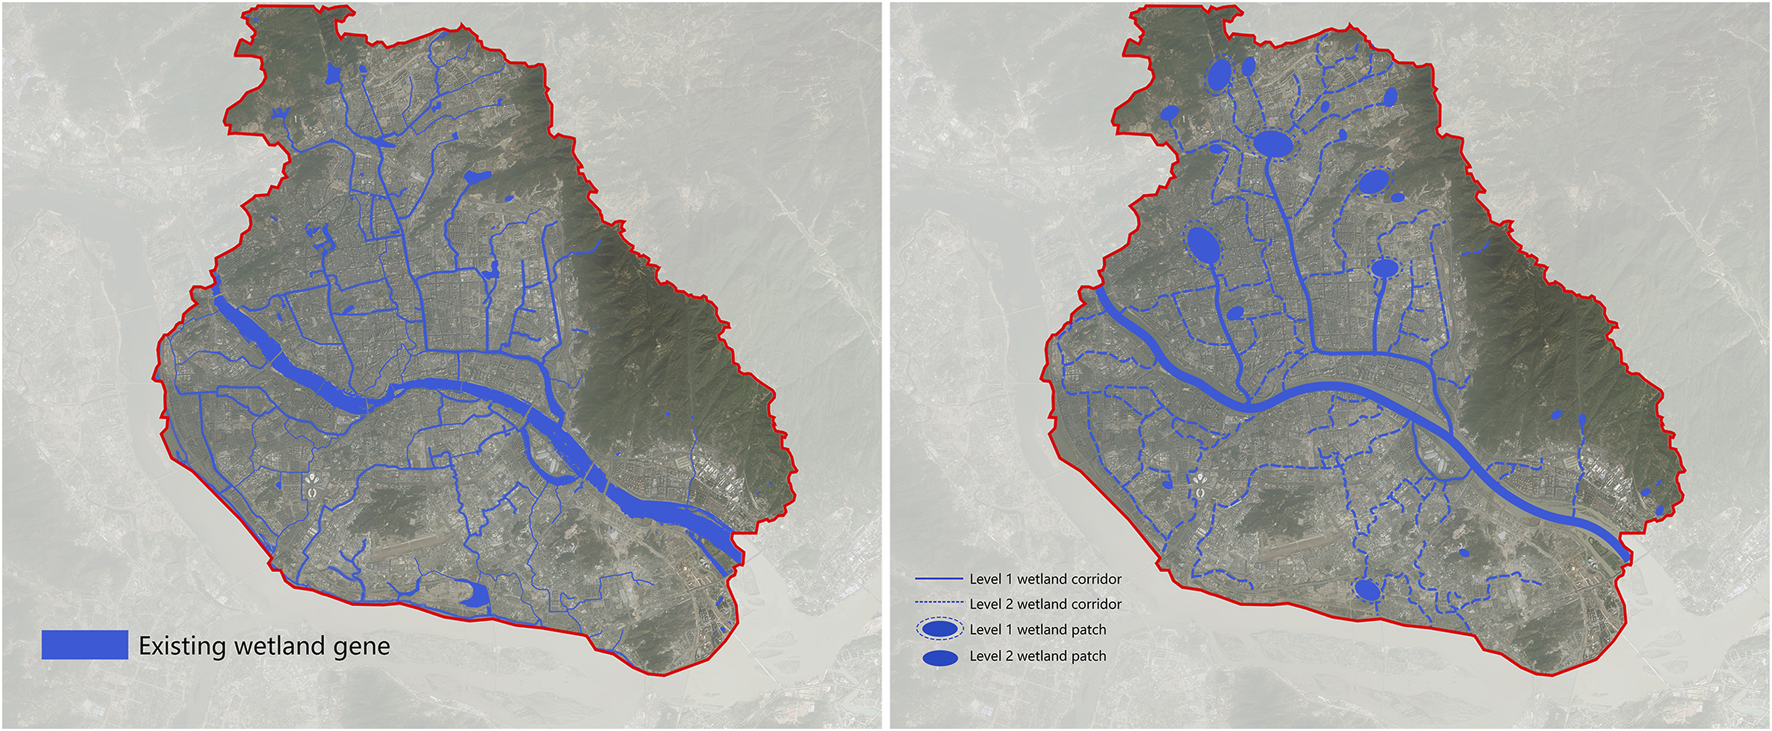
Existing wetland and classification.
2.3.3 Optimization of the wetland structure combined with GIS analysis results
1) Optimize and restore the existing and original wetland patches. As a downstream area, most of the key runoff nodes have high flood discharge pressure, which are not suitable for construction and development. The role of wetland patches is similar to that of rainwater detention ponds, which can reduce the impact of urbanization on aquatic ecosystems (Hess et al., 2022). Specifically, it can be used for downstream flow control (US EPA, 1990). This method has been widely used (Collins et al., 2010) because of its utility in flood control (Collins et al., 2010). Therefore, the original patches in the region should be expanded and optimized. If there is no water storage area in the runoff confluence area, the wetland patches should be reconstructed manually to enhance the regional capacity for dealing with flood disasters.
2) Retain and repair the existing and original wetland corridors. The inherent capacity of the wetland corridors can be used as a pipeline in the multi-functional infrastructure system (Zhai et al., 2021) to replace the flood drainage channel and optimize the ecological landscape. The central urban area of Fuzhou has a well-developed inland river system and rich wetland corridors; however, there are beheaded rivers in some parts. Therefore, restoration should be performed to connect some corridors and open the beheaded rivers for improving the integrity of the inland river system and enhancing the ability to resist floods and water self-purification.
3) Soften the wetland matrix and promote blue–green integration. Water diversion, sewage interception, dredging, and various other measures in Fuzhou have failed to solve the problem of black and smelly water, primarily because the overall channelization of inland rivers is serious in the central urban area of Fuzhou (Figure 6). The green space, as well as the wetland matrix, is hardened, and the water body does not have the required self-purification ability. Reasonable allocation of certain vegetation in the wetland can improve its water quality (Mallin et al., 2002; Chang et al., 2013). Therefore, to build a healthy and effective wetland network, it is necessary to soften the wetland matrix and ensure the width of the matrix and richness of vegetation, which is a necessary measure to promote the integration of blue and green.
FIGURE 6
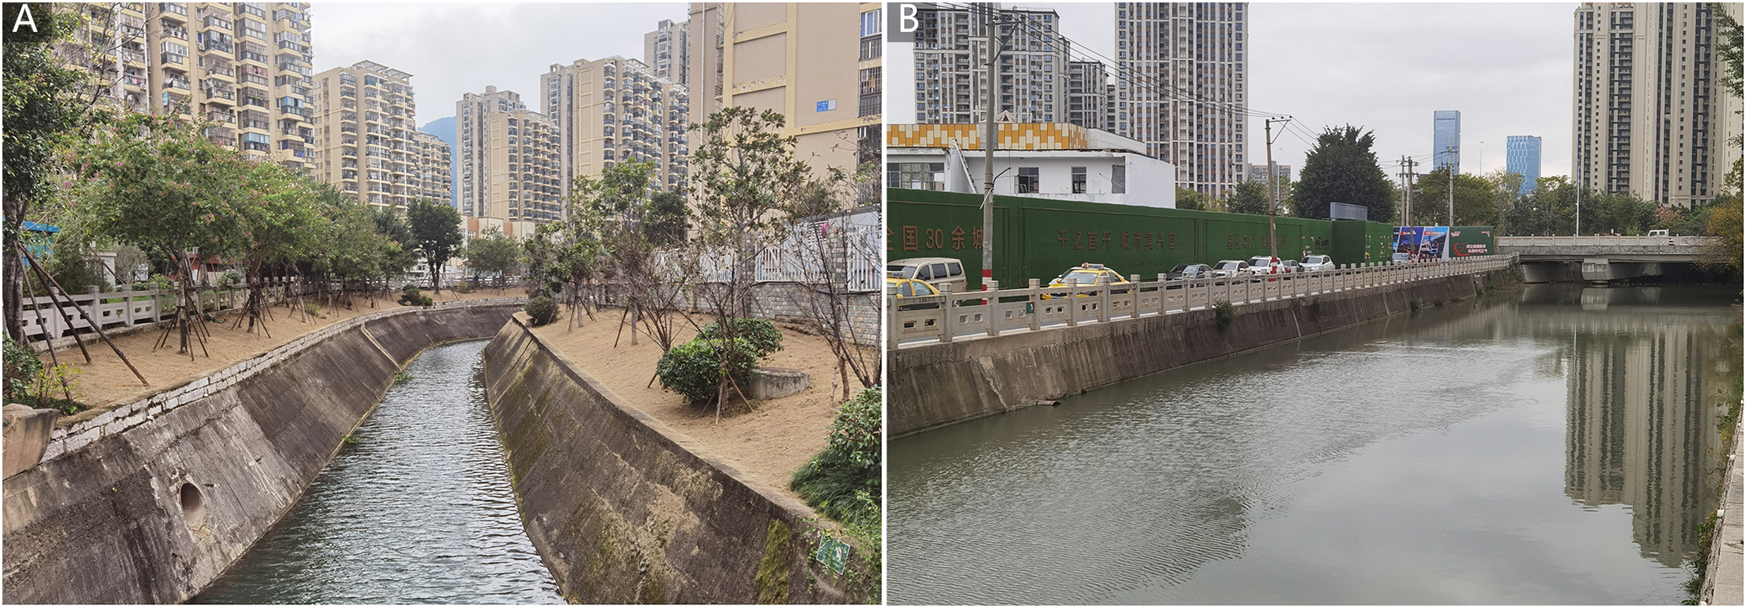
Existing wetland matrix. (A) Moyang River and (B) Huagong River.
2.3.4 Identification of an ecological source
Ecological sources are responsible for species diffusion and biodiversity maintenance. It has three primary functions: to provide key ecological services, maintain the continuity and integrity of the landscape pattern, and prevent various problems caused by ecosystem degradation. In this study, a more scientific MSPA method was used to identify the ecological source, which divides the landscape categories based on the land-use types. In the analysis, wetlands and forests with good ecological service functions were selected as the “prospect” and were processed into seven types of landscape elements by Guidos Toolbox software: the core, islet, perforation, edge, loop, bridge, and branch (Figure 7). The corresponding ecological significance of the landscape elements is shown in Table 1. The core area is the larger habitat patch in the foreground pixel, which can provide a larger habitat for species and is of great importance for biodiversity protection. It was extracted as an ecological source.
FIGURE 7

Morphological spatial pattern analysis of landscape types.
TABLE 1
| Landscape type | Ecological significance |
|---|---|
| Core | Large patches in foreground pixels that can provide larger habitat for species |
| Islet | Isolated and broken small patches in which the connection degree is lower, and the internal material and energy exchange is weak |
| Perforation | Transition between the core and non-green landscape patch area, namely, the internal edge of plaque |
| Edge | Transition between the core and primary area of non-green landscapes |
| Bridge | Long and narrow area that is connected with the core area and is of great importance to the biological migration |
| Loop | Corridors that connect the same core area. It is a shortcut for the same core species migration in the area |
| Branch | Area that is only connected at one end with the edge, bridge, loop, or perforation area |
Ecological significance of different landscape types.
2.3.5 Determination of the ecological resistance surface and construction of the corridor
The ecological resistance surface represents the degree of resistance of a land surface to the spatial dispersal and flow of species and ecological factors. It is closely related to natural and anthropogenic interference. The higher the ecological resistance, the more ecological services are lost in the dispersal and flow processes (Liu et al., 2014). Common resistance factors include the land-use type, topography (slope and elevation) (Peng and Zhou, 2019), distance factors (water, roads, residential areas, industrial sites, etc.) (Dai et al., 2021), and other environmental variables (Peng and Zhou, 2019).
Cities play a key role in protecting the biodiversity (Soanes and Lentini, 2019; Spotswood Erica et al., 2021). Species and habitats can be protected by creating and maintaining habitat corridors and improving the landscape connectivity (Nilon Charles et al., 2017; Knapp et al., 2021; Oke et al., 2021). Among them, the ecological corridor, as a channel for directly transferring material and energy between the ecological sources, is crucial for improving the connectivity of ecological restoration. Based on the ecological resistance surface and extracted ecological source data, this study used the minimum cost distance in the GIS to generate a reasonable species diffusion path. For some species with long migration distances, it was necessary to build stepping stones as a transition between the ecological sources. If there were enough stepping stones as migration space during species migration, the migration success and survival rate could be improved.
3 Results
3.1 Construction of the wetland network
The runoff confluence zone shown in the blue line of the GIS analysis results is crucial for protecting and restoring the wetland structure. The primary task in the wetland network construction is to connect regional wetland patches and corridors. The ecological connection between the primary and secondary wetland corridors and patches is the most important key in the ESP. This study increased and optimized 2 primary and 21 secondary wetland patches and 9 wetland corridors. Finally, a wetland network structure was formed (Figure 8).
FIGURE 8
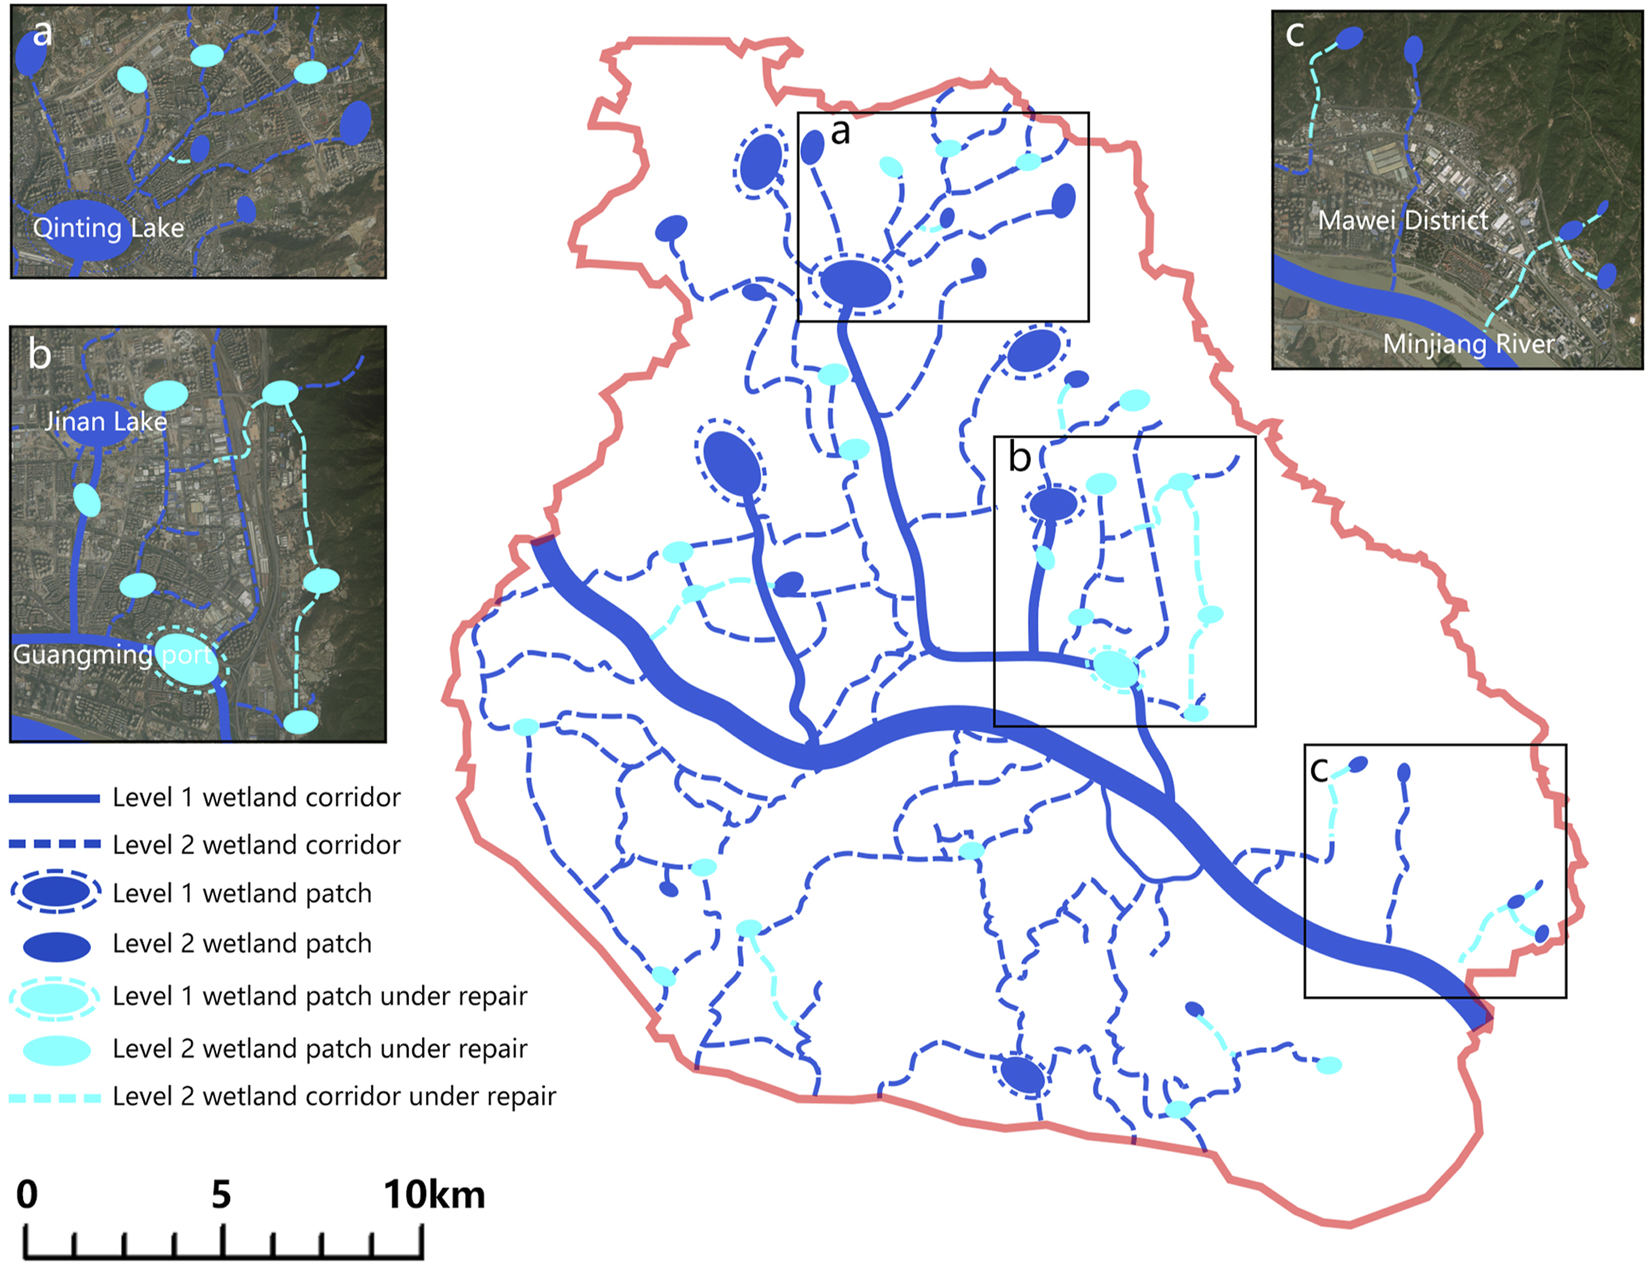
Wetland network importance and connectivity.
3.1.1 Results of wetland patches
The existing primary wetland patches are concentrated in the upper reaches of the inland river system in the north of the city. They primarily include Bayi and Dengyun reservoirs, Qinting, West, and Jin’an lakes, and other large lake reservoirs, which undertake the primary ecological service functions. Small lakes and reservoirs are present as secondary patches, such as Douding, Guoxi, and Yangting reservoirs, as well as some small wetland parks and residential lakes.
Qinting Lake, a primary wetland patch, is located at the confluence of the runoff from the northern mountains. Excavating and reasonably expanding the patch area of the lake can effectively enhance the flood storage capacity of the Beicheng District. Secondary patches at the foot of the mountain to the north of Qinting Lake (Area a, Figure 8) and the east of the Moyang River (Area b, Figure 8), combined with the runoff location, should be added to assist the primary wetland patches in carrying the water storage function.
The expansion of the confluence area in the lower reaches of the Guangming Port (Area b, Figure 8) to form a primary patch can not only increase the regional water storage capacity but also repurify the inland river before it flows into the Minjiang River. The development intensity of Nantai Island is not large; however, there is a lack of wetland patches, which needs to be addressed to meet the requirements of ecology and landscapes.
3.1.2 Results of wetland corridors
Jin’an, Baima, and Fengban rivers, and the Guangming Port undertake the primary flood discharge and landscape functions of the region as the primary corridors. The remaining inland rivers in the Jiangbei District and Nantai Island belong to the secondary and tertiary wetland corridors. They assist the primary corridors in having better ecological benefits.
There are many isolated patches in the mountains of the Mawei District. The construction and development of the new urban area has led to the filling of the corridor between the patch and the Minjiang River. Natural disasters, such as mountain torrents and rainstorms, easily cause urban waterlogging. Several primary wetland corridors should be repaired in combination with the runoff and existing patch location (Area c, Figure 8). The runoff in the Jin’an District is dense; however, due to high-intensity construction and development, a large number of native wetlands and river channels are filled. Several primary wetland corridors should be repaired, such as the wetland corridor in the east of the Moyang River (Area b, Figure 8), to alleviate the flood detention and drainage pressure of the Jin’an River and the Guangming Port.
3.1.3 Optimization of the wetland matrix
The central urban area of Fuzhou has serious channelization of inland rivers, low vegetation richness, and poor self-purification capacity of water bodies. Considering the regional current situation, this study puts forward several strategies for the optimization of the wetland matrix based on the functional wetland theory. First, we should ensure the ecology of the wetland waterfront space, set up a buffer belt with sufficient width around the waterfront space, reduce the development intensity of the surrounding buildings, reduce anthropogenic interferences, and ensure the stability of animal and plant ecosystems. Additionally, the green corridor should be connected with other green spaces in the city and penetrate into the inner city. Second, we should build an ecological revetment with good self-purification ability, improve the vegetation richness of the waterfront areas, conserve the water sources, reduce flood impact, and enhance the ability of regional ecological regulation. Finally, attention should be paid to shaping the waterfront landscape, plants should be selected according to the regional characteristics, and consideration should be given to ecology, landscape, and people’s five senses to create an ideal wetland matrix model (Figure 9).
FIGURE 9
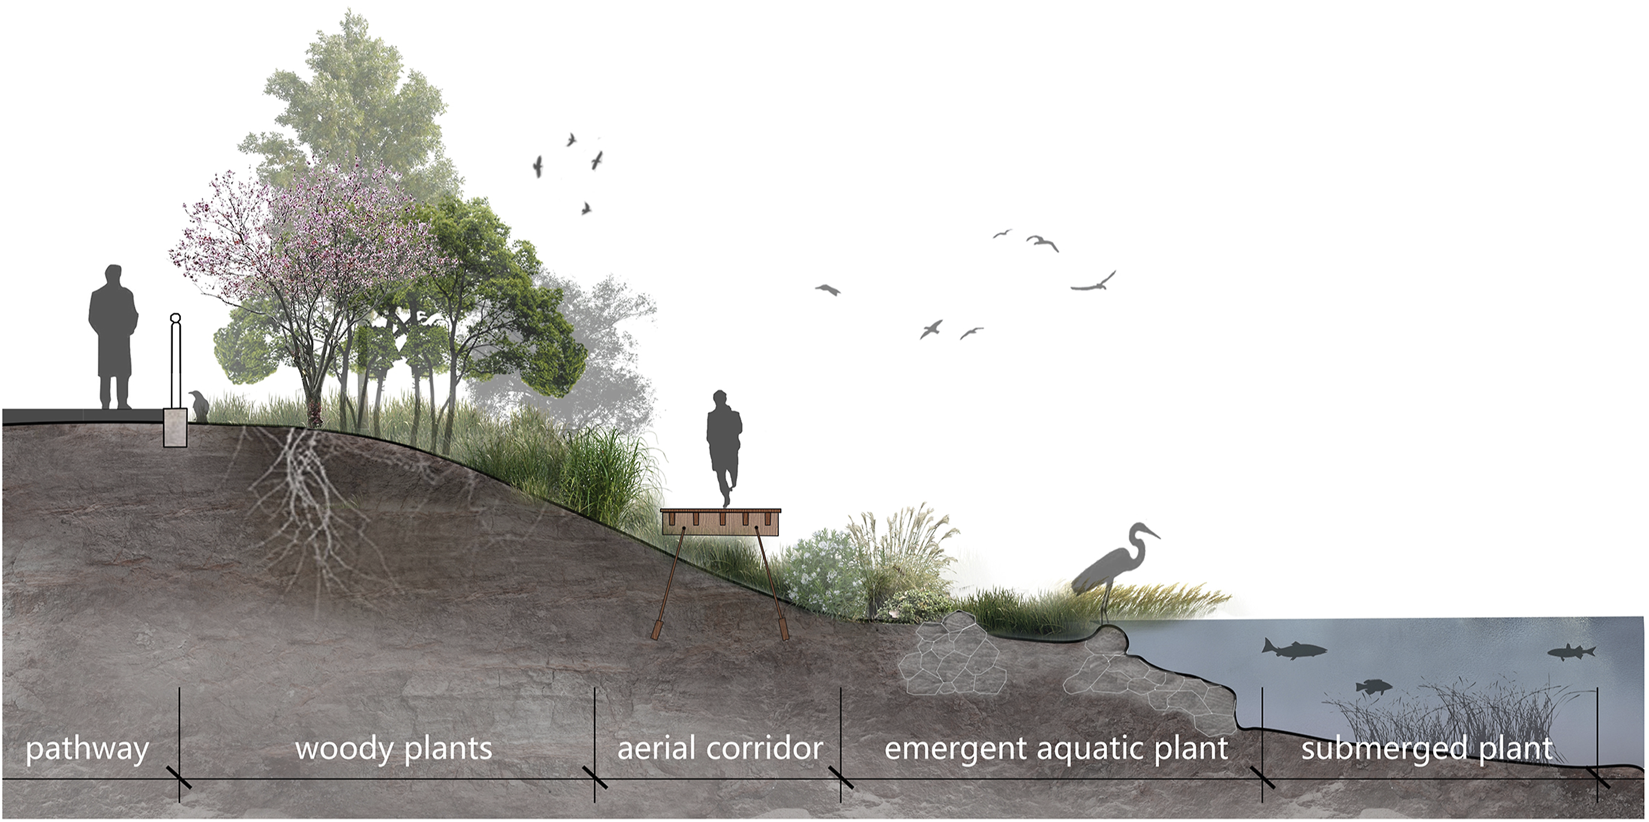
Ideal model of a wetland matrix.
3.2 Construction of the habitat network
The potential ecological corridor data were generated according to the ecological cost distance and the identification results of the ecological sources. According to the spatial distribution of ecological sources and intersections of the ecological corridors, 16 important and planned corridors and 19 stepping stone patches were planned and determined to generate the ecological network structure.
3.2.1 Identification results of the ecological sources
In this study, the prospects analyzed using the MSPA included forests, water bodies, and wetlands. Binary processing was carried out by using the reclassification tool in GIS. Foreground elements were assigned as 2, and background data were assigned as 1. To facilitate further data processing, it was necessary to ensure the consistency of the grid size, which was set to 30 m × 30 m. Subsequently, the obtained data were transferred to ArcGIS for unique value processing, and an area attribute table of the landscape types was obtained (Table 2). The values 17 and 117 in the attribute table were obtained for the “core area,” i.e., the area with the best ecological service function. There were 16 ecological sources suitable for expansion in the central urban area of Fuzhou. The area data were calculated and analyzed. The core area accounted for 24.92% of the whole central urban area (Table 3). Among them, the wetland and forest green space accounted for 3.68% and 21.24% of the total area, respectively.
TABLE 2
| Class | Color | RGB | Value [byte] internal/external | Count |
|---|---|---|---|---|
| 1) Core |

|
000/200/000 | 117/17 | 84,631 |
| 2) Islet |

|
160/060/000 | 109/9 | 5911 |
| 3) Perforation |

|
000/000/255 | 105/5 | 3989 |
| 4) Edge |

|
000/000/000 | 103/3 | 14,777 |
| 5a) Loop |

|
255/255/000 | 165/65 | 1757 |
| 5b) Loop in edge |
|
255/255/000 | 167/67 | 1247 |
| 5c) Loop in perforation |
|
255/255/000 | 169/69 | 562 |
| 6a) Bridge |

|
255/000/000 | 133/33 | 2408 |
| 6b) Bridge in edge |
|
255/000/000 | 135/35 | 1880 |
| 6c) Bridge in perforation |
|
255/000/000 | 137/37 | 84 |
| 7) Branch |

|
255/140/000 | 101/1 | 5080 |
| 8) Background |

|
220/220/220 | 0 | 210,182 |
Area attribute table of landscape types.
TABLE 3
| MSPA landscape type | Area (%) | MSPA landscape type | Area (%) |
|---|---|---|---|
| Core | 24.92 | Loop | 4.34 |
| Islet | 1.74 | Bridge | 1.29 |
| Perforation | 1.17 | Branch | 1.47 |
| Edge | 4.35 |
MSPA landscape types and area.
3.2.2 Construction of an ecological resistance surface
The landscape of the central urban area of Fuzhou includes wetlands, forests, cropland, grassland, shrubs, and construction land. The resistance of species moving through each landscape is different. Moreover, different topographic conditions have different effects on biological movement (
Bai and Guo, 2021). Therefore, the land use type, MSPA landscape type, slope, and elevation were selected as resistance factors in this study. Existing studies (
Meng et al., 2017;
Li et al., 2022) had the resistance weight value set as 0.4:0.15:0.15:0.15:0.15. High-intensity construction and development are the primary reasons for the decline in the urban green space and water surface rate due to the relatively small elevation difference and gentle slope in the central urban area of Fuzhou. As the ecological resistance of the land use type was high, the weight values of the land use type, MSPA landscape type, elevation, and slope were adjusted to 0.6:0.2:0.1:0.1. The weight setting of the ecological factors varies among different studies. Based on the previous studies, we modified the ecological factors by combining them with the regional characteristics of Fuzhou (
Table 4):
1) Land-use data were reclassified, and related studies were referred (Meng et al., 2017) to assign a value between 1 and 100 for different land use types. The weight was set as 0.6 to obtain r_ landuse.
2) MSPA landscape type data were transferred to the grid, and related studies were referred (Gao et al., 2019) to assign a value between 1 and 70 for different landscape types. The weight was set as 0.2 to obtain r_ mspa.
3) Digital elevation model (DEM) data were downloaded, embedded, projected, and reclassified. Previous studies were referred (Meng et al., 2017; Peng et al., 2021) to assign a value between 1 and 100 for different elevations. The weight was set as 0.1 to obtain r_ dem.
4) The grid was projected after downloading the DEM data. The DEM geographical coordinates were transformed into projection coordinates, and the slope data were converted and reclassified. Previous studies were referred (Meng et al., 2017; Peng et al., 2021) to assign the values of 1–100 for different slope ranges. The weight was set as 0.1 to obtain r_ slope.
TABLE 4
| Resistance indicator | Weight | Attribute | Resistance value |
|---|---|---|---|
| Land-use type | 0.6 | Wetland | 1 |
| Forest | 10 | ||
| Grassland | 15 | ||
| Shrubs | 20 | ||
| Croplands | 30 | ||
| Construction land | 100 | ||
| Unutilized land | 80 | ||
| MSPA landscape type | 0.2 | Core | 1 |
| Bridge | 10 | ||
| Branch | 25 | ||
| Loop | 30 | ||
| Islet | 50 | ||
| Edge | 60 | ||
| Perforation | 70 | ||
| Elevation/m | 0.1 | 0–40 m | 1 |
| 40–135 m | 10 | ||
| 135–240 m | 25 | ||
| 240–346 m | 50 | ||
| 346–443 m | 75 | ||
| >443 m | 100 | ||
| Slope/° | 0.1 | 0–5° | 1 |
| 5–15° | 10 | ||
| 15–25° | 50 | ||
| 25–35° | 75 | ||
| >35° | 100 |
Resistance value criteria for each resistance indicator.
Finally, combined with the grid calculator, the four resistance factors were weighted and stacked to form a comprehensive ecological resistance surface. The ecological cost distance of each region was calculated by using the upper comprehensive ecological resistance surface (Figure 10). The greater the cost distance, the greater the resistance and the more unsuitable it is to build an ecological corridor. Some areas of Jin’an, Taijiang, and Cangshan districts have a large cost distance and are not suitable for the construction of ecological corridors.
FIGURE 10
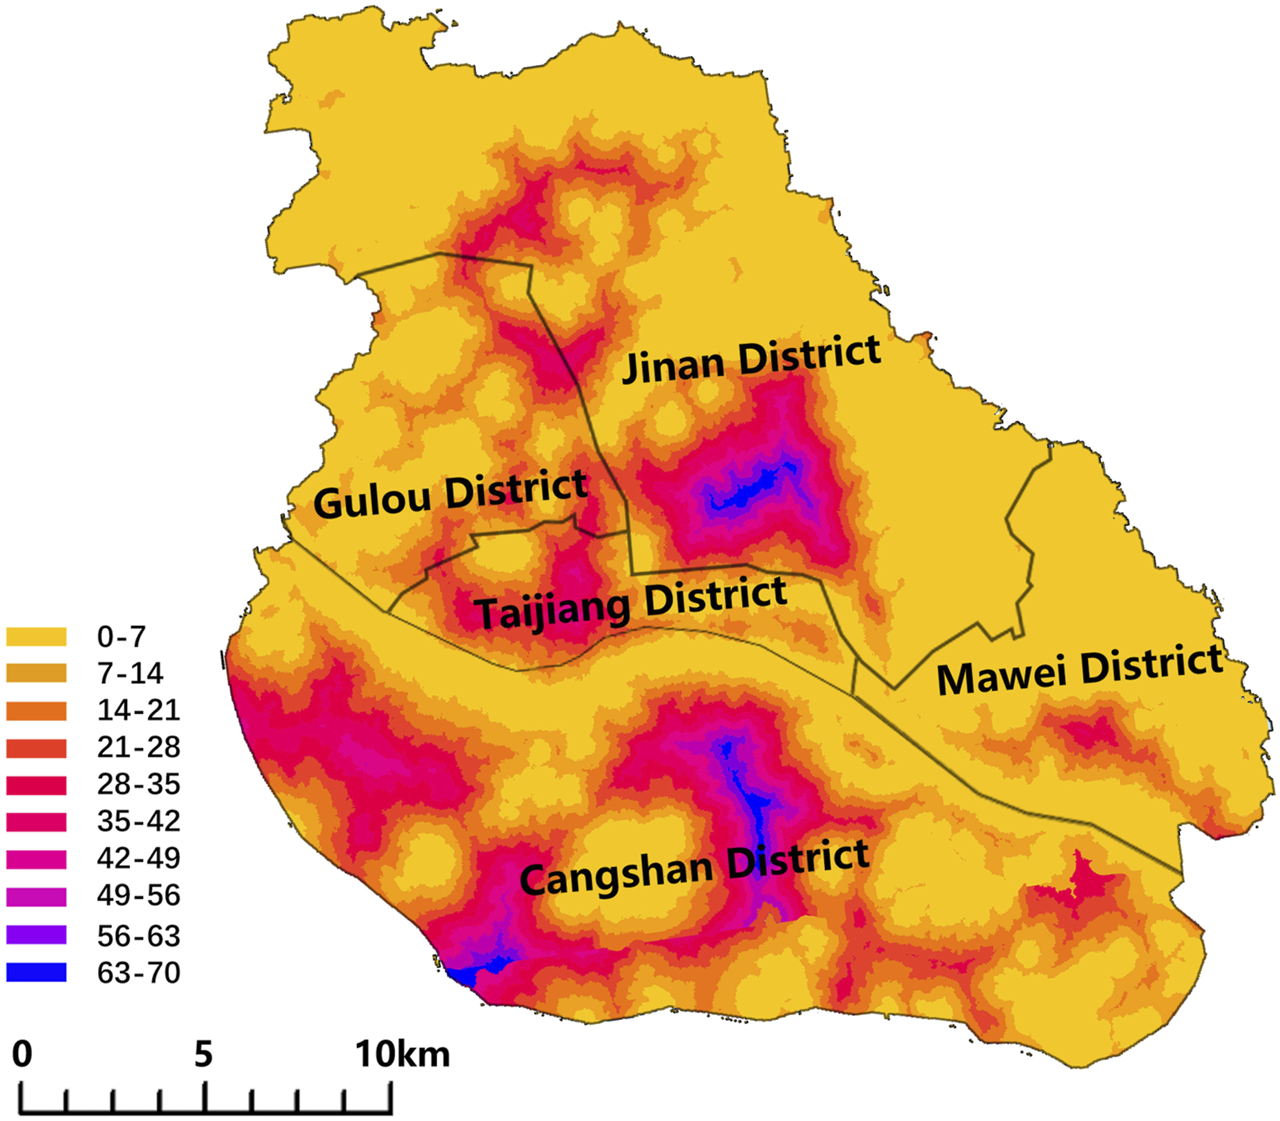
Ecological cost distance.
3.2.3 Extraction results of the ecological corridors
The potential ecological corridors analyzed by the GIS are divided into two types: important and planned ecological corridors. Important ecological corridors are used to directly connect ecological sources, and planned ecological corridors are used to assist their functions and provide shortcuts for species migration. Stepping stones are set between the corridors over long distances to improve the migration success and survival rate. The length of the longest important corridor was 12 km, including the Jin’an River, and the Guangming Port and its coastline, whereas the shortest was only 1.6 km in length and connected the Meifeng Mountain Park and the Minjiang River. The length of the longest planned corridor was 5.4 km. It is used as an auxiliary corridor between the sources in the southeast of the Cangshan District. The shortest was 1.1 km in length and connected the broken patches in the north of the Jin’an District. The ecological resistance of Taijiang and southern Jin’an districts and western Cangshan Island was large, and species migrated primarily through the Minjiang River and its coastline.
3.3 Construction of the ESP
3.3.1 Spatial form of the ESP
A scientific and reasonable ESP was formed by the coupling of the wetland (Figure 8) and habitat network structure (Figure 11). The hierarchical construction mode of the “patch-corridor-matrix” was followed, and the patch and corridor were divided into primary and secondary levels. Large lakes, reservoirs, mountain forests, and large parks were regarded as primary patches. Small lakes, reservoirs, and small parks were considered secondary patches. Wider rivers, shorelines, and greenways were used as primary corridors. Narrow rivers and green belts were used as secondary corridors.
FIGURE 11
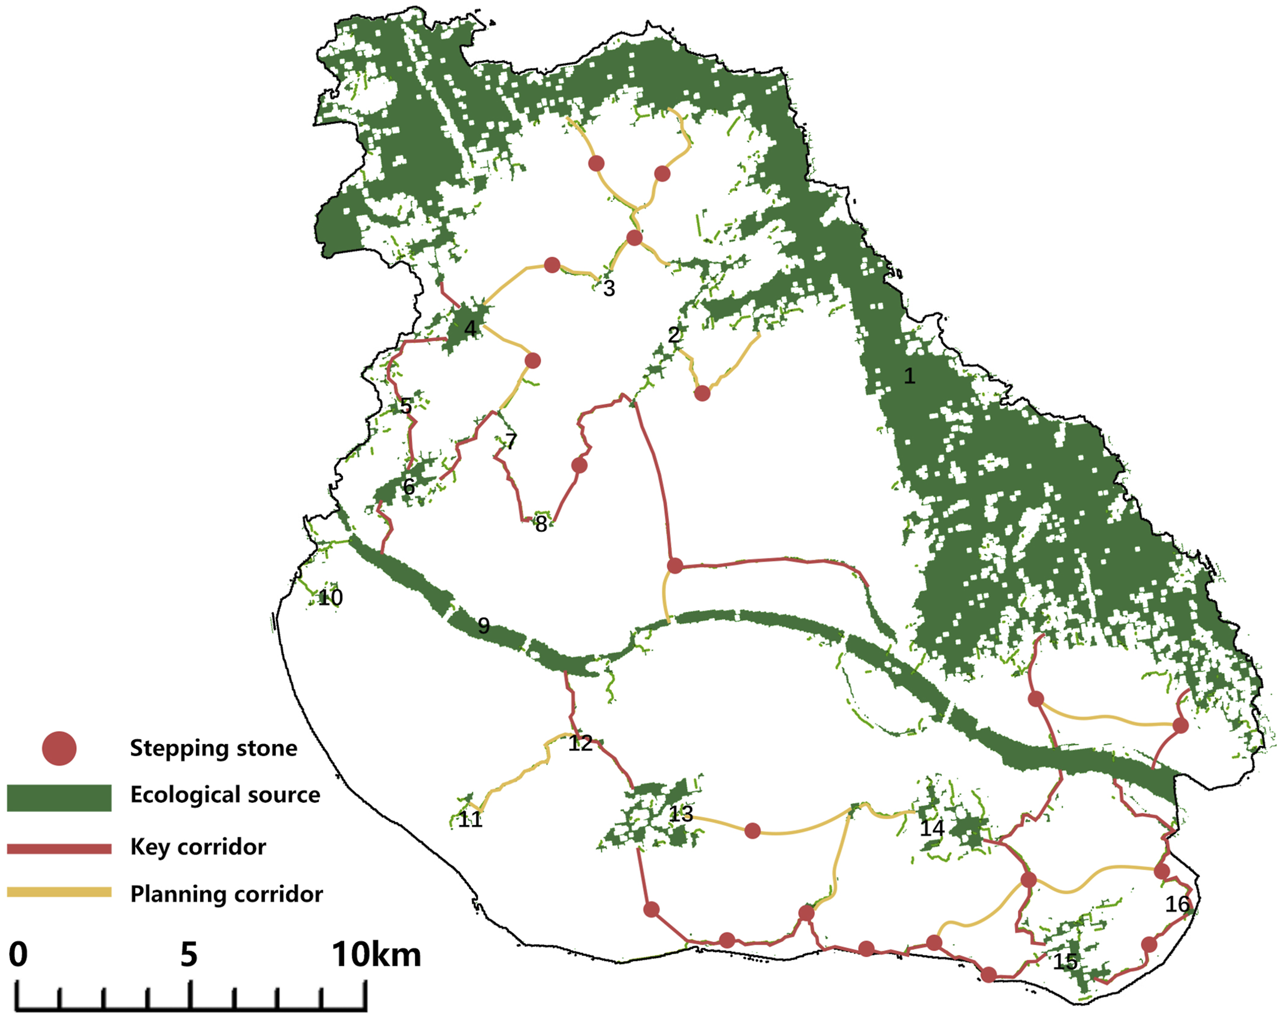
Ecological corridor importance and connectivity.
3.3.2 Construction principles of the ESP
1) Protection priority is the premise: Protect the existing important ecological sources, reasonably optimize and restore the wetlands and green space to meet the regional objective conditions, and restore the area to the state before development to better deal with natural disasters.
2) Maximization of ecological benefits is the core: According to 2002 authoritative data from the United Nations Environment Programme (UNEP), the ecological value of wetlands is seven times that of the tropical rain forest, which is much higher than that of the ordinary green space. Thus, the undeveloped ecological sources, stepping stones, and ecological corridors should preferably exist in the form of wetlands. If constrained by urban development, it can be set as a greenway to maximize the ecological benefits. In the process of transforming the built environment, we should give priority to wetlands, forests, and farmlands to improve the urban comprehensive ecological benefits.
3) Ensuring connectivity is the key: Connectivity is one of the most important indicators for evaluating the ecological landscape pattern. Strategically connecting wetlands, woodlands, natural heritage lands, and coastlines into a system is crucial for improving the overall ecology of the city.
4) Targeted design is the key point: Different ecological restoration principles are put forward according to the different characteristics of the lake reservoir, river, and offshore wetland and primary and secondary forest lands, for example, the lake reservoir-type wetland should primarily improve the water storage capacity, and the river-type wetland should build the landscape ecological coastline for ensuring the ecological base flow and improving the interaction between humans and nature.
3.3.3 Realistic conditions for the construction of the ESP
The central urban area of Fuzhou has high land tension and great development intensity and requires sufficient urban areas for the restoration of the ecological land. Moreover, the construction of the ecological network needs urban renewal projects to be effective. The reconstruction of old cities and the renovation of dilapidated houses in recent years in Fuzhou can be used as realistic conditions for redefining the scope of the blue–green line.
4 Discussion
Fuzhou is a typical mountainous city, and the construction of nearly 70% of its central urban area has posed a serious challenge to the landscape pattern, which requires an urgent balance between urban construction and ecological protection. Previous studies on ESP construction have mostly applied the MSPA-MCR method, and the differences between cities are mainly reflected in the resistance indicator and resistance value in the minimum cost distance analysis. In this study, the functional wetland theory was introduced into ESP construction to reflect not only the urban variability in terms of resistance indicator and resistance value but also the local hydrological conditions. In contrast to previous studies that considered water bodies as a single element, this study considered them as wetland systems from a watershed perspective. In the macroscopic ESP construction, the spatial relationship between the existing wetland and the original wetland is represented by the “patch-corridor-matrix” model in landscape ecology. On a smaller scale, the wetland should be specifically determined by water calculation and then adjusted according to the surrounding environment. In this study, two different networks were formed. One is a habitat network with the main purpose of reducing the migration resistance of organisms, and the other is a wetland network with the main purpose of reducing flooding, eliminating water pollution, and rationalizing the use of water resources. The results of both are in line with the “patch-corridor-substrate” model in landscape ecology, and there is a high similarity in spatial layout. The ecological value of wetlands is much higher than that of other land types, which is clearly mentioned in the United Nations Environment Programme (UNEP). Thus, the core construction principle of maximizing ecological benefits through wetlands was put forward in this study. For areas with low construction intensity, such as the Cangshan District, the dense habitat corridors and stepping stones in their southern part can exist in the form of wetlands, while for the northern urban areas with high development intensity, wetlands need to survive through urban renewal projects such as renovation of old houses.
5 Conclusion
This study was based on the functional wetland theory and used the “patch-corridor-matrix” model in the theory of landscape ecology, maximum protection, ecological priority, guarantee of connectivity, and targeted design principles to construct the ESP in accordance with the characteristics of the landscape type and solve the ecological water and habitat security problems to increase the ecological benefit and connectivity of the city. The results exhibited that there were 16 ecological sources, accounting for 24.92% of the study area, primarily located near the mountains in the north of the city and some parts of the Cangshan District. According to the hydrologic and landscape pattern analysis, 23 wetland patches, 9 wetland and 32 habitat corridors, and 19 stepping stones should be added. Among them, two primary-level wetland patches and 16 important habitat corridors should be emphatically targeted for conservation and restoration.
The structure of the functional wetland network of the “patch-corridor-matrix” model was highly consistent with that of the habitat network of the “source-corridor-stepping stone” model. However, there were partial differences; therefore, we should follow the principle of maximization of the ecological benefit for making urban space wetlands. The combination of the two conforms to the basic rules of landscape ecology and has good applicability for landscape cities requiring rapid renewal.
In recent years, China has put forward relevant policies to protect and restore the ecosystems of mountains, rivers, forests, fields, and lakes. The new ESP constructed in this study can be used to guide the ecological restoration of other landscape-type cities in the national land space and control the development intensity of the city. Future research should pay attention to the interaction between the study area and the surrounding environment. Specific patches, corridor scale, and landscape shaping should be combined with a smaller range of built environment and urban renewal projects. The expansion of scale may lead to an ecological network with a new pattern.
Statements
Data availability statement
The raw data supporting the conclusions of this article will be made available by the authors, without undue reservation.
Author contributions
XZ contributed to the conception, data collection, and software simulation of the study. GL and ZZ contributed to writing—review and editing. All authors discussed the results and contributed to specific knowledge of the relevant literature.
Funding
This study is supported by the National Natural Science Foundation of China (Grant No. 51578250) and National Natural Science Foundation of China (Grant No. 2022J01301).
Acknowledgments
The authors would like to thank Editage (www.editage.com) for English language editing.
Conflict of interest
The authors declare that the research was conducted in the absence of any commercial or financial relationships that could be construed as a potential conflict of interest.
Publisher’s note
All claims expressed in this article are solely those of the authors and do not necessarily represent those of their affiliated organizations, or those of the publisher, the editors, and the reviewers. Any product that may be evaluated in this article, or claim that may be made by its manufacturer, is not guaranteed or endorsed by the publisher.
Footnotes
1.^Resource and Environmental Science Data Center of the Chinese Academy of Sciences(https://www.resdc.cn).
2.^Geospatial Data Cloud (https://www.gscloud.cn).
3.^Guidos Toolbox: Graphical user interface for the description of image objects and their shapes.
References
1
Bai Xuemei Shi Peijun Liu Yansui (2014). Society: Realizing China's urban dream. Nature509, 158–160. 10.1038/509158a
2
Bai Y. Guo R. (2021). The construction of green infrastructure network in the perspectives of ecosystem services and ecological sensitivity: The case of Harbin, China. Glob. Ecol. Conserv.27, e01534. 10.1016/j.gecco.2021.e01534
3
Chang N-B. Zhemin X. Marimon Z. Islam K. Wanielista M. P. Wanielista Martin P. (2013). Exploring hydrobiogeochemical processes of floating treatment wetlands in a subtropical stormwater wet detention pond. Ecol. Eng.54, 66–76. 10.1016/j.ecoleng.2013.01.019
4
Cheng H. Zhu L. Meng J. (2022). Fuzzy evaluation of the ecological security of land resources in mainland China based on the Pressure-State-Response framework. Sci. Total Environ.804, 150053. 10.1016/j.scitotenv.2021.150053
5
Collins K. A. Lawrence T. J. Stander E. K. Marci L. Cole E. Kaushal S. S. et al (2010). Opportunities and challenges for managing nitrogen in urban stormwater: A review and synthesis. Ecol. Eng.11, 1507–1519. 10.1016/j.ecoleng.2010.03.015
6
Dai L. Liu Y. Luo X. (2021). Integrating the MCR and DOI models to construct an ecological security network for the urban agglomeration around Poyang Lake, China. Sci. Total Environ.754, 141868. 10.1016/j.scitotenv.2020.141868
7
Fahrig Lenore (2019). Habitat fragmentation: A long and tangled tale. Glob. Ecol. Biogeogr.28 (1), 33–41. 10.1111/geb.12839
8
Gao Jiangbo Du Fujun Zuo Liyuan Jiang Yuan (2020). Integrating ecosystem services and rocky desertification into identification of karst ecological security pattern. Landsc. Ecol.36, 2113–2133. 10.1007/s10980-020-01100-x
9
Gao Mengwen Hu Yecui Bai Yuping (2022). Construction of ecological security pattern in national land space from the perspective of the community of life in mountain, water, forest, field, lake and grass: A case study in guangxi hechi, China. Ecol. Indic.139, 108867. 10.1016/j.ecolind.2022.108867
10
Gao Yu Mu Haoke Zhang Yunlu Tian Ye Tang Dawei Xiong Li (2019). Research on construction path optimization of urban-scale green network system based on MSPA analysis method: Taking Zhaoyuan City as an example. Acta eco. Sin.20. 10.5846/stxb201905050907
11
Gou Mengmeng Li Le Ouyang Shuai Chang Shu Xiao Wenfa Wang Na et al (2022). Integrating ecosystem service trade-offs and rocky desertification into ecological security pattern construction in the Daning river basin of southwest China. Ecol. Indic.138, 108845. 10.1016/j.ecolind.2022.108845
12
Hess Kayla M. Sinclair James S. Reisinger Alexander J. Bean Eban Z. Iannone III et al (2022). Are stormwater detention ponds protecting urban aquatic ecosystems? A case study using depressional wetlands. Urban Ecosyst.25, 1155–1168. 10.1007/S11252-022-01208-9
13
Huang L. Wang J. Chen X. (2022). Ecological infrastructure planning of large river basin to promote nature conservation and ecosystem functions. J. Environ. Manag.306, 114482. 10.1016/j.jenvman.2022.114482
14
Jackson P. F. R. (1976). International wetlands convention in force. Environ. Conserv.1, 22. 10.1017/S0376892900017689
15
Ke Xiaoling Wang Xingyue Guo Haixiang Chang Yang Zhou Qi Amal Mougharbel (2021). Urban ecological security evaluation and spatial correlation research-----based on data analysis of 16 cities in Hubei Province of China. J. Clean. Prod.311, 127613. 10.1016/j.jclepro.2021.127613
16
Knapp Sonja Aronson Myla F. J. Carpenter Ela Herrera-Montes Adriana Jung Kirsten Johan Kotze D et al (2021). A research agenda for urban biodiversity in the global extinction crisis. BioScience3, 268–279. 10.1093/BIOSCI/BIAA141
17
Kong Fanhua Yin Haiwei Nakagoshi Nobukazu Zong Yueguang (2009). Urban green space network development for biodiversity conservation: Identification based on graph theory and gravity modeling. Landsc. Urban Plan.95 (1), 16–27. 10.1016/j.landurbplan.2009.11.001
18
Li J. Song C. Lu C. Wu J. Meng X. (2011). Impacts of landscape structure on surface urban heat islands: A case study of shanghai, China. Remote Sens. Environ.115 (12), 3249–3263. 10.1016/j.rse.2011.07.008
19
Li Qing Zhou Yong Yi Siqi (2022). An integrated approach to constructing ecological security patterns and identifying ecological restoration and protection areas: A case study of jingmen, China. Ecol. Indic.137, 108723. 10.1016/j.ecolind.2022.108723
20
Li S. Wu X. Zhao Y. Xu J. Da H. Xuejiao L. (2019). Quantitative analysis of the ecological security pattern for regional sustainable development: Case study of chaohu basin in eastern China. J. Urban Plan. Dev.145 (3). 10.1061/(ASCE)UP.1943-5444.0000508
21
Liu C. (2014). Research on the ideas of drainage and drainage in China. Water Supply Drainage, 3003, 106–108. 10.19853/j.zgjsps.1000-4602.2014.03.028Fuzhou
22
Liu W. Holst J. Yu Z. (2014). Thresholds of landscape change: A new tool to manage green infrastructure and social-economic development. Landsc. Ecol.29 (4), 729–743. 10.1007/s10980-014-0007-1
23
Mallin M. A. Ensign S. H. Wheeler T. L. Mayes D. B. (2002). Pollutant removal efficacy of three wet detention ponds. J. Environ. Qual.31 (2), 654–660. 10.2134/jeq2002.0654
24
Meng J. Wang X. Zhou L. (2017). Integrated landscape pattern optimization in arid region: A case study of middle reaches of heihe river. Acta Sci. Nat. Univ. Pekin.53, 3. 10.13209/j.0479-8023.2017.022
25
Nie Wenbin Shi Yan Martin John Siaw Fan Yang Wu Renwu Wu Xu. et al (2021). Constructing and optimizing ecological network at county and town Scale: The case of Anji County, China. Ecol. Indic.132, 108294. 10.1016/j.ecolind.2021.108294
26
Nilon Charles H. Aronson Myla F. J. Cilliers Sarel S. Cynnamon D. Frazee Lauren J. Goddard Mark A. et al (2017). Planning for the future of urban biodiversity: A global review of city-scale initiatives. BioScience4, 332–342. 10.1093/biosci/bix012
27
Oke C. Bekessy Sarah A. Niki F. Bush J. Fitzsimons James A. Garrard Georgia E et al (2021). Cities should respond to the biodiversity extinction crisis. npj Urban Sustain.1 (1), 11. 10.1038/S42949-020-00010-W
28
Peng J. Zhao H. Liu Y. Jiansheng W. (2017). Research progress and prospect on regional ecological security pattern construction. Geogr. Res.36, 407–419. 10.11821/dlyj201703001
29
Peng T. Liu J. Deng C. (2021). Ecological sensitivity evaluation of Fuzhou national forest park based on GIS andAnalytic hierarchy process method. Taiwan Agric. Res.2021 (01), 84–90. 10.16006/j.cnki.twnt.2021.01.014
30
Peng Wenfu Zhou Jieming (2019). Development of land resources in transitional zones based on ecological security pattern: A case study in China. Nat. Resour. Res.1, 43–60. 10.1007/s11053-018-9401-8
31
Romero-Duque L. P. Trilleras Jenny M. Fabiana C. Quijas S. (2020). Ecosystem services in urban ecological infrastructure of Latin America and the Caribbean: How do they contribute to urban planning?Sci. Total Environ.728, 138780. 10.1016/j.scitotenv.2020.138780
32
Soanes K. Lentini P. (2019). When cities are the last chance for saving species. Front. Ecol. Environ.17 (4), 225–231. 10.1002/fee.2032
33
Spotswood Erica N. Beller Erin E. Robin G. Letitia G. J. Heller Nicole E. Aronson Myla F. J. (2021). The biological deserts fallacy: Cities in their landscapes contribute more than we think to regional biodiversity. BioScience71 (2), 148–160. 10.1093/biosci/biaa155
34
Tubridy D. (2020). Green climate change adaptation and the politics of designing ecological infrastructures. Geoforum113, 133–145. 10.1016/j.geoforum.2020.04.020
35
Wang C. Li C. Wang M. Yang S. Wang L. (2021b).Environmental justice and park accessibility in urban China: Evidence from Shanghai,Asia pacific viewpoint. Wiley Online Libr., 63, 236–249. 10.1111/apv.12314
36
Wang Shuang Wu Maoquan Hu Mengmeng Chen Fan Wang Tao Xia Beicheng (2021c). Promoting landscape connectivity of highly urbanized area: An ecological network approach. Ecol. Indic.125, 107487. 10.1016/j.ecolind.2021.107487
37
Wang Ziyang Shi Peiji Zhang Xuebin Tong Huali Zhang Weiping Liu Yue (2021a). Research on landscape pattern construction and ecological restoration of jiuquan city based on ecological security evaluation. Sustainability10, 5732. 10.3390/su13105732
38
Wei Q. Halike A. Yao K. Chen L. Balati M. (2022). Construction and optimization of ecological security pattern in Ebinur Lake Basin based on MSPA-MCR models. Ecol. Indic.138, 108857. 10.1016/j.ecolind.2022.108857
39
Wen Jiafeng Hou Kang (2021). Research on the progress of regional ecological security evaluation and optimization of its common limitations. Ecol. Indic.127, 107797. 10.1016/j.ecolind.2021.107797
40
Xie H. L. Li B. (2004). A study on indices system and assessment criterion of ecological security for city. J. Beijing Normal Univ. Sci. (05), 705–710.
41
Yang Siqi Zhao Wenwu Liu Yanxu Zhai Ruijie (2018). Science of the total environment. Influ. land use change Ecosyst. Serv. trade-offs Ecol. Restor. area Dyn. scenarios Yanhe watershed, China644, 556–566. 10.1016/j.scitotenv.2018.06.348
42
Yu K. Li D. Liu H&Cheng J. (2005). Growth pattern of Taizhou City based on ecological infrastructure:A negative approach physical urban planning. City Plan. Rev.76 (09), 80+97–98.
43
Yu Kongjian (1996). Security patterns and surface model in landscape ecological planning. Landsc. Urban Plan.36 (1), 1–17. 10.1016/S0169-2046(96)00331-3
44
Yu K. Qiao Q. Yuan H. Yan B. LiD&Liu K. (2009). Land use planning guided by scientific development concept: “Inverse Planning”in land use planning of “dong san Xiang”. Beijing, China Land Sci.23 (03), 24–31.
45
Zhai Jun Ren Jing Miao Xi Tang Xiaonan Zhang Yixin (2021). Multiscale watershed landscape infrastructure: Integrated system design for sponge city development. Urban For. Urban Green.60, 127060. 10.1016/j.ufug.2021.127060
46
Zhang J. Wang X. Hou Y. Cai L. (2018). Study on the impact of urbanization progress on waterlogging in Fuzhou. Disaster Sci.33 (1), 146–151. 10.3969/j.issn.1000-811X.2018.01.026
47
Zheng Zhi Du Chenjiao Zheng Yin Gong Liu (2020). Residential area planning method of bay cities based on the construction of functional wetland :A case study of optimal ecological planning of a residential area in xinglin bay basin. Xiamen.Architectural J.2020 (08), 72–77. 10.19819/j.cnki.ISSN0529-1399.202008014
48
Zheng Zhi Gong Liu (2007). Exploration on ecological planning of small town residential area in Fujian. Archit. J.2007 (11), 26–28.
49
Zheng Zhi Gong Liu (2010). Integration of wetland and campus functions in southern Universities. Archit. J.2010 (10), 80–84.
50
Zhou W. Wang R. (2005). Methodology assessment of urban ecological security-a case study of beijing. Chin. J. Ecol.24 (7), 848–852. 10.13292/j.1000-4890.2005.0054
51
Zhou X. Wang Y. C. (2011). Spatial–temporal dynamics of urban green space in response to rapid urbanization and greening policies. Landsc. Urban Plan.100 (3), 268–277. 10.1016/j.landurbplan.2010.12.013
Summary
Keywords
landscape city, ecological security pattern, functional wetland theory, wetland network, habitat network
Citation
Zhang X, Liu G and Zheng Z (2022) Construction of an ecological security pattern based on functional wetland theory: A case study in a landscape city. Front. Environ. Sci. 10:955230. doi: 10.3389/fenvs.2022.955230
Received
28 May 2022
Accepted
10 October 2022
Published
28 October 2022
Volume
10 - 2022
Edited by
Chenyang Shuai, Chongqing University, China
Reviewed by
Tianlin Zhai, Henan Agricultural University, China
Yu Zhang, Chongqing University, China
Updates
Copyright
© 2022 Zhang, Liu and Zheng.
This is an open-access article distributed under the terms of the Creative Commons Attribution License (CC BY). The use, distribution or reproduction in other forums is permitted, provided the original author(s) and the copyright owner(s) are credited and that the original publication in this journal is cited, in accordance with accepted academic practice. No use, distribution or reproduction is permitted which does not comply with these terms.
*Correspondence: Zhi Zheng, 986164013@qq.com
This article was submitted to Environmental Systems Engineering, a section of the journal Frontiers in Environmental Science
Disclaimer
All claims expressed in this article are solely those of the authors and do not necessarily represent those of their affiliated organizations, or those of the publisher, the editors and the reviewers. Any product that may be evaluated in this article or claim that may be made by its manufacturer is not guaranteed or endorsed by the publisher.