 Liu Wangbao
- College of Geography Science, South China Normal University, Guangzhou, China
Taking the Tianhe District in Guangzhou, China, as a case and the urban street (road) as the basic research unit, this study analyzes the relationship between the built environment and street vitality to analyze the influencing factors of street vitality. The Tencent location service data are used to characterize street vitality, and the OLS and GWR models are used to construct the statistical relationship between the built environment and street vitality after establishing the urban built environment index. The results show that spatial heterogeneity is considered in the GWR model based on local geographic weighting, and its fitting effect is better than that of the OLS model, which can reveal the micro-local characteristics of the built environment’s effect on street vitality. Increasing the land-use mixing degree, new and old building mixing degrees, and land-use intensity (building density and volume ratio) can significantly increase street vitality, which proves to a certain extent that Jacobs’s relevant discussion is still highly practical for the Tianhe District.
1 Introduction
Urban vitality is a driving force in the rapid and healthy development of cities (Wang, 2019). Urban vitality is mainly manifested in various activities in the city, and its core is the people engaged in them. The degree of concentration of people can be regarded as an important measure of urban vitality (Jacobs, 1961). As the basic unit of urban life, streets not only undertake the function of urban transportation but are also an essential place for residents’ activities, where urban vitality is concentrated. People rely on streets to engage in social, leisure, and other functional activities; thus, streets are increasingly regarded as social spaces rather than just mobile spaces (Hass-klau et al., 1999). Jacobs believed that “streets have vitality, and cities have vitality” (Jacobs, 1961). However, influenced by the planning concept of modern urbanism, the traffic function of modern urban streets has been widely valued, but their social attributes as the place of activity and communication space for urban residents are easy to ignore.
Jacobs put forward four necessary and two basic conditions for street vitality (simplified as “six conditions for street vitality”). More precisely, the four necessary conditions are that “it should have multiple land use functions,” “most streets should be short and easy to pass,” “houses should be mixed-use buildings of different ages and conditions,” and “high-density population.” The two basic conditions are “accessibility” and “harm of border vacuums” (Jacobs, 1961). Among them, “multiple land use functions” refer to land use that needs to be mixed, and there are at least two or more types of land use in the streets and surrounding areas. A high degree of land-use mixing can ensure people flow and efficient use of facilities (Wei et al., 2016). Furthermore, “most streets should be short and easy to pass,” means that the streets should be short and have more intersections, which reduces the speed of cars and decreases the walking distance. “Housing should be a mixture of buildings with different ages and conditions,” means that the ages of buildings around the street should be diverse, which reflects the diversity of social groups and the community economy (King, 2013). The existence of old buildings helps cultivate urban diversity. The case study of Nanjing in China shows that the vitality of new streets is significantly lower than that of old streets (Xu et al., 2018). “High-density population” means that the density of urban development should be high enough, which is conducive to the concentration of human activities and enables realization and maintenance of the diversity of cities or streets when the first three conditions are met (Sung and Lee, 2015). In the study of the Barcelona case, urban vitality can be found in a wide variety of urban spaces only when population density is combined with physical features that promote intense and diverse human activity (G´omez-Var et al., 2022) “Accessibility” refers to the accessibility of public service facilities, especially urban parks and transportation stations. Urban parks are conducive to the distribution of pedestrian populations to enhance the urban vitality of the surrounding areas. Compared with large public spaces, small parks and squares are also important and potential social interaction spaces (De Nadai et al., 2016). Good accessibility to bus stations and rail transit stations induces residents’ activity behavior. “The harm of the junction vacuum zone” refers to the fact that ground railway lines, rivers, and highways inhibit the vitality of the surrounding cities. Jacobs argues that single-function areas along the railway, riverside areas, university campuses, highways, large parking lots, and large parks inhibit the vitality of the city due to the small number of users. Therefore, adding new functions along the “vacuum boundary” helps maintain the vitality of the city (Wang, 2019).
Existing literature has verified the applicability of the conditions of Jacobs’ street vitality in modern cities from different angles and regions (Ewing and Cervero, 2010; March et al., 2012). Studies have confirmed that Jacobs’s relevant discussion is suitable for Seoul, the contemporary Korean city from the two scales of the street, whereas neighborhood and mixed land use, density, block size, building age, and accessibility are significant influencing factors of street vitality (Sung et al., 2013; Sung and Lee, 2015). In the study of the Barcelona case, urban vitality could also be found in peripheral neighborhoods that do not necessarily coincide with historical fabrics (Delcl`os-Alio and Miralles-Guasch, 2018), and the study of the Santiago de Chile case reveals that the spatial form of revival urban vitality is characterized by a strong radial center–periphery dynamic interspersed with sub-centers of high vitality, mainly in the form of rural towns and villages (Fuentes et al., 2020). Compared to the urban vitality of Ho Chi Minh City and Shanghai, both cities realize a declining gradient of urban vitality from the urban cores to the suburbs; however, Shanghai also fosters several peaks of urban vitality in its sub-centers (Yue et al., 2021). Related studies show that block size, urban park accessibility, and street connectivity significantly affect urban vitality in contemporary American cities (Koohsari et al., 2013; Saelens and Handy, 2008). Furthermore, in recent years, with the rapid development of information and communications technology (ICT), location-based services and big data have provided an important database for fine measurement of street vitality. For example, mobile signaling data are used to measure six major cities in Italy, and Jacobs’s diverse urban conditions are considered suitable for investigating cities empirically (Nadai et al., 2016). Urban lighting data also represent an important means to measure urban vitality, improve the density of urban facilities the mixing degree of and enhance the rationality of spatial design, and optimize the distribution of public facilities to improve urban vitality (Jia and Song, 2020). Other studies mainly include the application of talking-data, location service data, (Niu et al., 2019), street view data (Rui et al., 2021), and POIs (Yue et al., 2017) to evaluate the impact of the built environment on street vitality and its temporal and spatial characteristics. In the case study of Seoul in South Korea, it is found that the Internet spatial connectivity in public places is potentially conducive to human physical interaction, especially among young people (Kim, 2018). However, in general, the mechanisms and local characteristics of the impact of the built environment on street vitality need to be further explored.
Since the reform and opening up, Chinese cities have experienced rapid urbanization, accelerated urban renewal, and emerging new urban areas. Whether Jacobs’ street vitality conditions are suitable for Chinese metropolises requires additional empirical cases. As a metropolis in southern China and the capital city of Guangdong Province, Guangzhou is similar to New York, the case discussed by Jacobs to some extent. New town development can better reflect the practical applications of modern urban planning concepts in urban planning and construction. Tianhe District has become the new center of Guangzhou since 2000 and is characterized by high development density, high land-use mixing, developed public transport systems, and diversified social space types. This is a suitable case to verify Jacobs’s relevant discussions.
Street vitality is affected and limited by the urban building environment that sustains human activities. This study attempts to establish a statistical relationship between the built-up environment indicators, which are similar to the six conditions of Jacobs’ street vitality, and the urban street vitality and analyze the applicability of Jacobs’ six conditions of street vitality to modern Chinese cities so as to prove the applicability of Jacobs’ related discussions in more cities. Taking the Tianhe District of Guangzhou as an example, this study used the location service intensity of Tencent, an important social APP in China, to measure the intensity of street activities and verify the applicability of Jacobs’s relevant discussions to Chinese cities by constructing a statistical relationship between the built environment variables that can reflect the six conditions of Jacobs’ street vitality and the intensity of street vitality.
2 Data and methodology
2.1 Research areas
In this case, Tianhe District (shown in Figure 1) has diversified spatial types. It has the Zhujiang New Town CBD. Colleges and universities are densely distributed in Wushan, Longdong, and other areas in this district. Science City and Smart city has developed into Guangzhou Science and Technology City, respectively. There are also typical urban villages, such as Shipai urban village and Tangxia urban village.
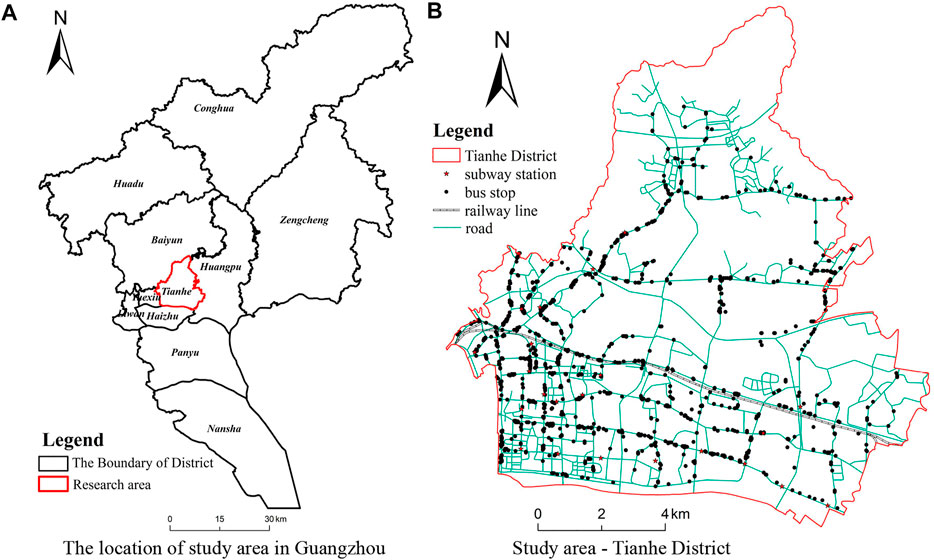
FIGURE 1. Study area-Tianhe District in Guangzhou. (A) Location of the study area in Guangzhou (B) Study area—Tianhe District.
2.2 Data sources
This study obtained Tencent location service data in Tianhe District from June 15 to 21 in 2015 (1 week). Tencent is one of the largest online social media platforms in China, with more than one billion users. With its huge number of users, Tencent location service data are collected according to 25*25 m grids and a 1-h interval, which can effectively describe street activities. Because there are obvious differences in street vitality intensity between weekdays and weekends, this study only selects weekdays as the research period.
The study only selects 3 a.m., 9 a.m., 12 a.m., 6 p.m., and 9 p.m. in a day as the research nodes. 3 a.m. basically represents the early morning, and the street vitality is found to be relatively low; 9 a.m. and 6 p m., respectively, represent the time on the way to work and off-duty time, which is the time period with the greatest intensity of street pedestrian flow, while 12 a.m. represents noon time and 9 p.m. represents residents’ evening activity time.
2.3 Variable settings
Urban roads are divided into four levels: expressway, trunk road, secondary trunk road, and branch road, for which the width of the road red line is controlled to be ≥40 m, 30–40 m, 25–40 m, and 12–25 m, respectively. Therefore, this study selects the 55-m buffer zone on both sides of the road center line as the measurement range of street vitality, which includes not only the scope of the road red line but also the buildings and open spaces on both sides of the street, which have a direct impact on the street vitality. Road network data are obtained from OSM (Open Street Map, OSM, www.openstreetmap.org). According to the six conditions of Jacobs’ street vitality, mixed use, block size, building ages, density, accessibility, and border vacuums are determined as the built environment variables affecting street vitality. Table 1 is the basic statistical analysis of each variable. The variables are defined as follows:
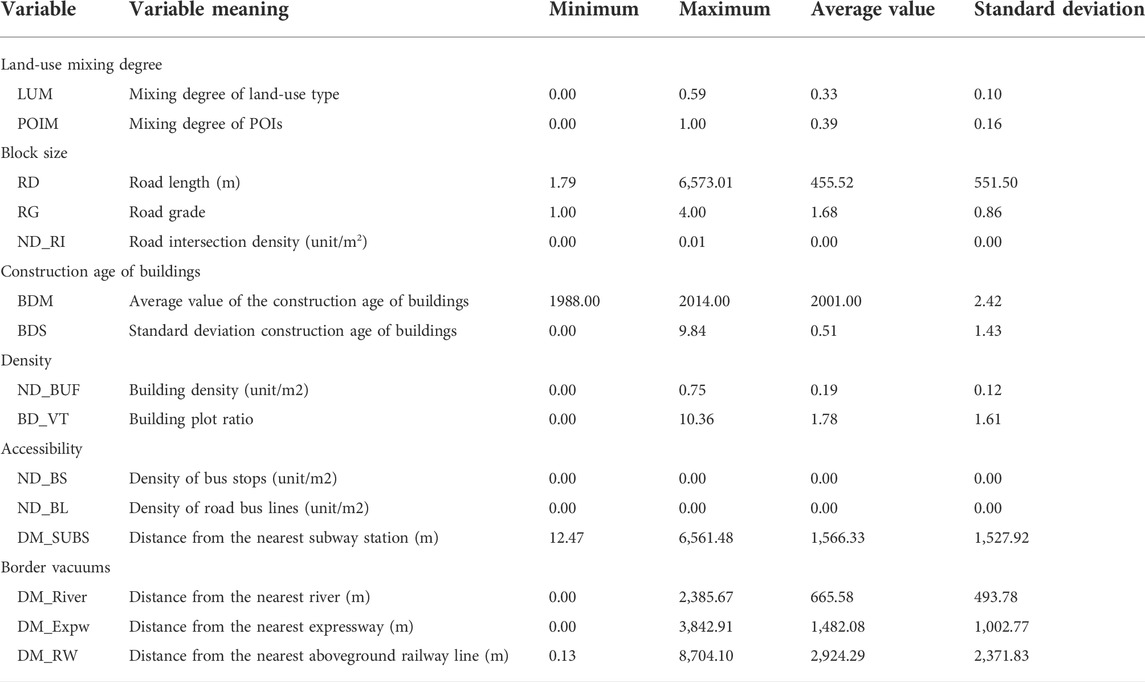
TABLE 1. Basic statistical analysis for built environment measures.
2.3.1 Land use mixing degree
It includes two variables, namely, the mixing degree of points of interest (POI) type (POIM) and the mixing degree of land use type (LUM) within the 200-m buffer zone of the road center line. The calculation formula of the mixing degree is
where diversity represents the POIs or land use mixing degree of the street, n represents the number of POI type or land use type of the section, and Pi represents the number ratio of POIs of a certain type. POIs are obtained from Gaode map (Gaode map is one of the important internet map suppliers in China). The website is ditu.amap.com, and the coordinates have been corrected. POIs are divided into 13 categories, namely, scenic spots, business housing, life services, finance, education, transportation facilities, accommodation, shopping, government offices, public facilities, medical treatment, sports, and catering services. The data of land use status released by government departments (2007) can be divided into 10 categories: R (residential), C (public facilities), M (industrial), W (storage), T (external transportation), S (road and square), U (municipal public facilities), G (green space), D (special), and E (water and other).
2.3.2 Block size
It is measured by the road’s characteristics, including three variables, namely, road length (RL), road grade (RG, i.e., expressway, trunk road, secondary trunk road, and branch road are measured by 4, 3, 2, and 1 respectively), and road intersection density (ND_RI, road intersection density within the 55-m buffer zone of the road center line).
2.3.3 Construction age of buildings
LocoySpider software (the website is locoy.com) is used to obtain the relevant information (including the housing construction age) of second-hand houses from China from the website of Lianjia (which is an important real estate intermediary in China, and the website is gz.lianjia.com). It includes two variables, namely, the average value (BDM) and standard deviation (BDS) of the construction age of second-hand houses in the buffer zone of 200 m from the road center line, which are used to measure the mixing degree of old and new buildings.
2.3.4 Density
It includes two variables, namely, the building plot ratio (BD_VT, i.e., the ratio of the sum of all building areas in the buffer zone to the area of the buffer zone) and building density (ND_BUF, i.e., the ratio of the sum of all building base areas in the buffer zone to the area of the buffer zone) in the buffer zone 200 m from the road center line. The base and floors of the building are obtained from the Gaode map.
2.3.5 Accessibility
It includes three variables, namely, the density of bus stops (ND_BS, i.e., the ratio of the number of bus stops on the road to the buffer area); the density of road bus lines (ND_BL, i.e., the ratio of the number of bus lines on the road to the buffer area); and the distance from the nearest subway station (DM_SUBS, expressed by the straight-line distance from the midpoint of the road to the nearest subway station).
2.3.6 Border vacuums
It includes three variables, namely, the distance from the nearest river (DM_River, i.e., the straight-line distance from the road center point to the nearest river); the distance from the nearest expressway (DM_Expw, i.e., the straight-line distance from the road center point to the nearest expressway); and the distance from the nearest above-ground railway line (DM_RW, i.e., the straight-line distance from the road center point to the nearest above-ground railway line).
2.4 Methodology
This study uses the ordinary least squares (OLS) model and the geographically weighted regression (GWR) model to analyze the statistical relationship between the built environment and street vitality. The GWR model allows the existence of different spatial statistical relationships in different geographical spaces, which can form regional geospatial statistical parameter estimations (Nadai et al., 2016).
The calculation formula of the OLS model is as follows:
where Y represents the street vitality intensity,
The calculation formula of the GWR model is as follows:
where
3 Impact of the built environment on street vitality
3.1 Ordinary least squares model analysis
SPSS software is used to analyze the dependent variables and 15 independent variables for zero-mean normalization and collinearity diagnostics. Table 2 shows that the variance inflation factor (VIF) of each variable is less than 4; therefore, there is no multicollinearity problem, and all indicators have passed the test. Table 2 also shows the impact of various variables on street vitality.
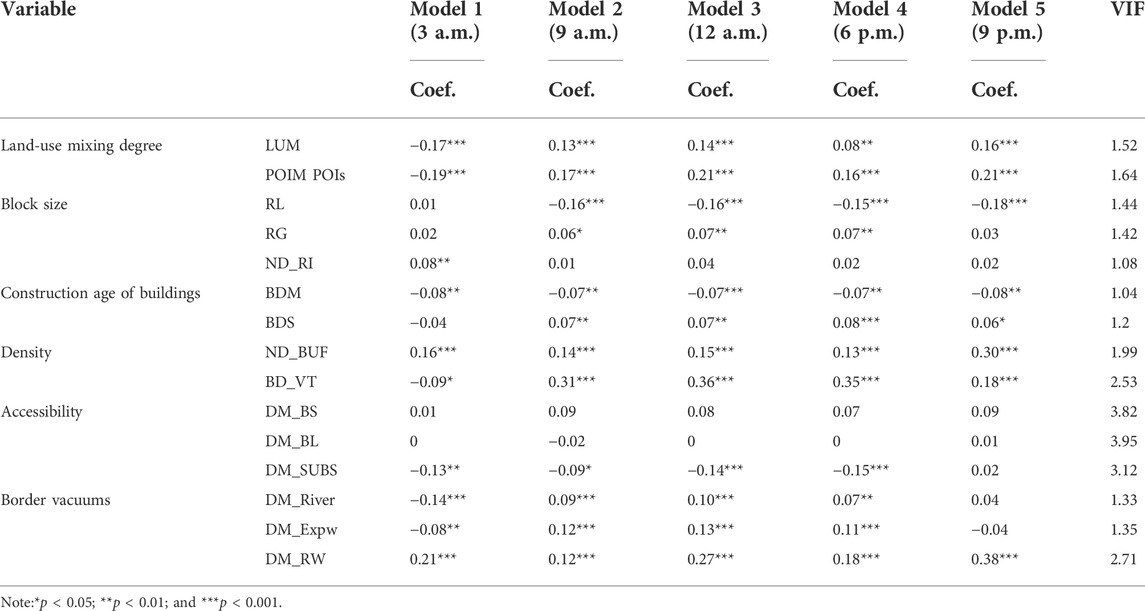
TABLE 2. Analysis results of OLS.
3.1.1 Land-use mixing degree
Jacobs argues that mixed land use is a necessary condition for maintaining urban vitality. Table 2 shows that the mixing degree of points of interest (POI) type (POIM) and the mixing degree of land use type (LUM) indicators in the Tianhe District of Guangzhou are significantly positively correlated with street vitality. Thus, the degree of land-use mixing can significantly improve street vitality, which is consistent with Jacobs’ judgement and is similar to the findings in the current literature that mixed use can improve urban vitality (Sung et al., 2013).
3.1.2 Block size
Table 2 shows a significant negative correlation between road length (RD) and street vitality, that is, the shorter the road, the greater the street vitality. The correlation between street grade (RG) and street vitality shows periodicity, and there is a significant positive correlation in the periods of 9 a.m., 12 a.m., and 6 p.m., but not in other periods, which is related to a large-scale increase in commuting demand in rush hours, resulting in the improvement of street vitality of high-grade roads. The findings are consistent with those of previous studies (Brunsdon et al., 1998).
3.1.3 Construction age of buildings
Building age (BDM) is significantly negatively correlated with street vitality, that is, the older the building age, the stronger the street vitality, indicating that the presence of old buildings is more conducive to increasing street vitality. The standard deviation of the building age (BDS) index, reflecting the mixing degree of new and old buildings, is significantly positively correlated with street vitality, indicating that the mixing of new and old buildings helps improve street vitality. The findings are similar to those of Jacobs and King (King, 2013).
3.1.4 Density
Table 2 shows that the two indicators, building volume ratio (BD_VT) and building density (ND_BUF), reflecting density, are significantly positively correlated with street vitality, indicating that high-density areas contribute to the improvement of street vitality, which is also consistent with Jacobs’ findings from previous studies (Cerin et al., 2007).
3.1.5 Accessibility
The density of bus stops (ND_BS) and the density of bus lines (ND_BL) have no significant relationship with street vitality, whereas the distance from the nearest subway station (DM_SUBS) has a significant negative correlation with street vitality, reflecting the characteristics that the farther away from the nearest subway station, the weaker the street vitality intensity is, which is related to the fact that the Tianhe District has a developed public transport system and a dense and relatively uniform distribution of bus stops and lines. Public transport facilities do not become a significant variable affecting street vitality, but subway traffic volume is large, and the distribution of subways is relatively uneven, which is a significant variable affecting street vitality.
3.1.6 Border vacuums
The variables such as the distance from the nearest river (DM_River), the distance from the nearest expressway (DM_Expw), and the distance from the nearest aboveground railway line (DM_RW) are significantly positively correlated with street vitality, indicating that the farther the distance is, the stronger the street vitality. This shows that the surrounding rivers, expressways, and aboveground railway lines represent a vacuum zone for urban development, which has a certain negative impact on street vitality and supports Jacobs’ conclusion to a certain extent.
3.2 Geographically weighted regression model results
3.2.1 Comparison of ordinary least squares and geographically weighted regression model results
The GWR model is based on an adaptive kernel and uses the AIC method to calculate the bandwidth. Table 3 compares the analysis results of the OLS and GWR models from the ACIC, R2, adjusted R2, and sigma values. 1) The ACIC, R2, and adjusted R2 of the GWR model outperformed those of the OLS model. For example, the fitting degrees (R2) of the GWR models at 9 a.m., 12 a.m., 8 p.m., and 9 p.m. reached 0.625, 0.746, 0.675, and 0.590, respectively, while the highest fitting degree (R2) of the OLS model was 0.488, especially at 12 a.m. The variables in the GWR model explained street vitality as high as 74.6%. 2) The AICC value of the GWR model was lower than that of the OLS model, further confirming that the fitting effect of the GWR model was better than that of the OLS model.
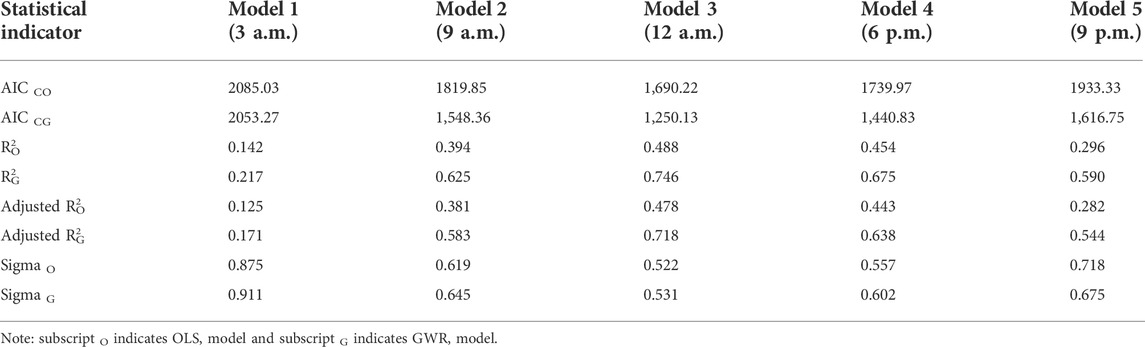
TABLE 3. Comparison of GWR and OLS models.
3.2.2Geographically weighted regression model analysis
To test the spatial non-stationarity of the impact of the built environment on street vitality, using the 25% quantile, 75% quantile, and mean value of the regression coefficient, we conducted the t-test and found the p value (significance) of the regression coefficient to evaluate the effect of the GWR model. Table 4 shows that the significant variables are similar to those of the OLS model. However, some variables show strong spatial heterogeneity of geographical impact, which is demonstrated by the difference between the 25 and 75% quantiles. The land-use mixing degree (LUM) variable is significant at 9 a.m., 12 a.m., and 9 p.m. However, there are directional differences between the 25 and 75% quantiles, that is, the spatial heterogeneity is obvious. For the density indexes such as plot ratio and building density that have significant effects, the 25 and 75% quantiles are the same direction difference. For the accessibility index, the distance from the nearest subway station (DM_SUBS) is 9 a.m., 12 a.m., 6 p.m., and 9 p.m., and the quantiles of 25 and 75% also have directional differences, which is similar to the variables of ‘the distance from the nearest river (DM_River).’
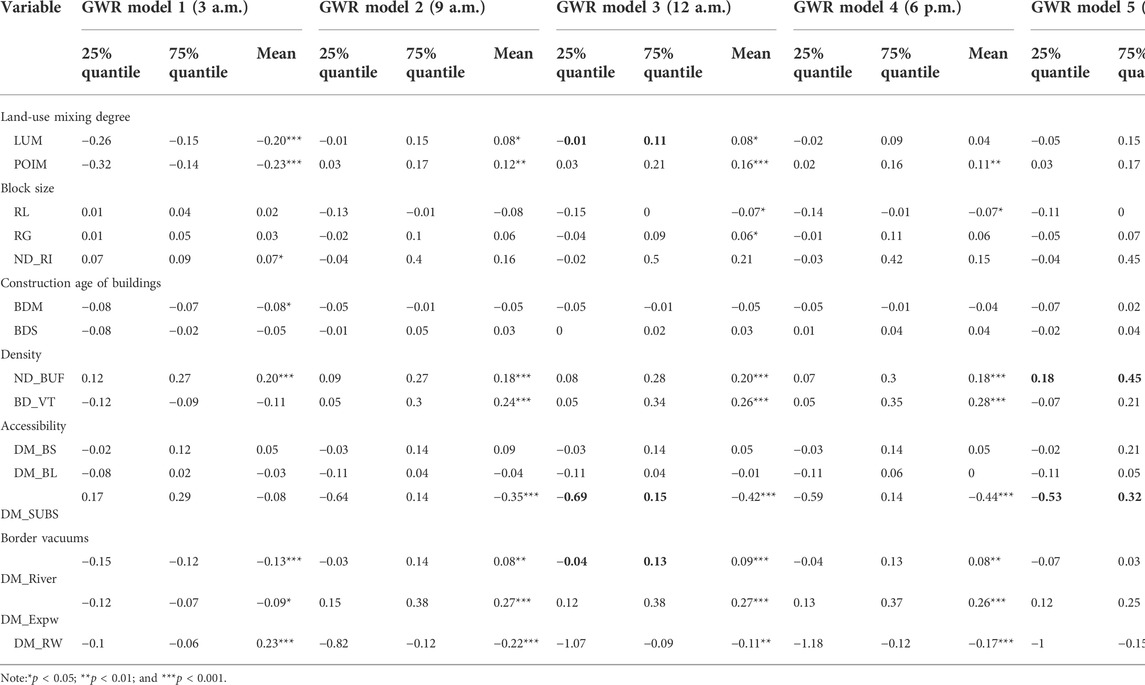
TABLE 4. Coefficients of GWR model estimation.
As can be seen from the abovementioned OLS and GWR model analyses, improving the mixed degree of land use around the street can help improve the street vitality. Both sides of Chinese urban streets are crowded with people and are also areas with high commercial value. Therefore, both sides of the streets are often areas with mixed commercial and residential functions, and there are also a certain number of public service buildings. The mixed land use function can effectively increase the population flow and traffic travel, thus enhancing the street vitality. The variables reflecting urban development capacity, including building volume ratio and building density, are basically positively related to street vitality. The higher the density, the higher the concentration of population and industrial activities, which is also conducive to improving street vitality. In recent years, Guangzhou has carried out a series of urban renewal and transformation processes, and a large number of old urban areas and “urban villages” have been transformed. As these areas are densely populated and highly mixed with old and new buildings, especially in areas with a high density of old buildings, the street vitality has increased significantly. Generally speaking, the expressway and railway lines will divide the city and restrict the travel of the population. Therefore, the vitality of the streets near the expressway or railway line is limited to a certain extent.
Therefore, this study selects variables with strong spatial heterogeneity of geographical influence to visually analyze their spatial impact (Figure 2), including the variables such as building volume ratio (BD_VT) (9 a.m.), distance from the nearest expressway (DM_Expw) (6 p.m.), building density (ND_BUF) (9 p.m.), and mixing degree of land-use type (LUM) (9 p.m.).
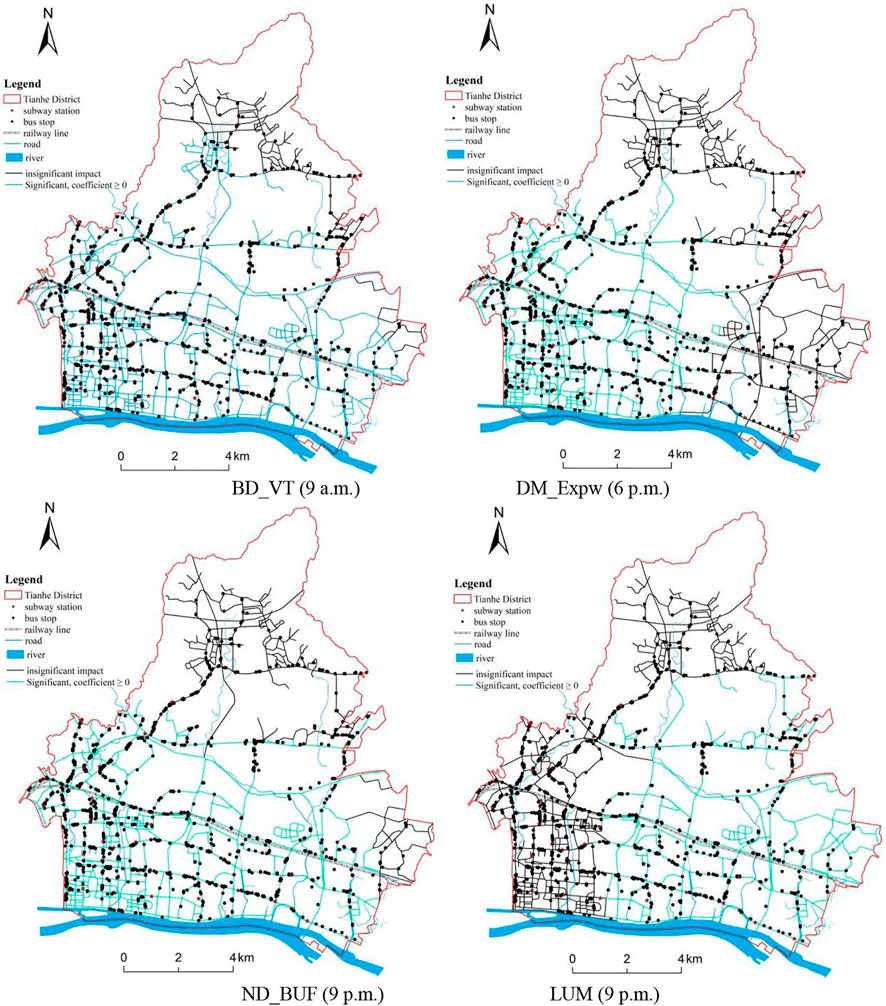
FIGURE 2. Spatio-temporal differentiation pattern of the influence of the built environment on street vitality.
The main results can be concluded as:
3.2.2.1 Influence of the building volume ratio (9 a.m.)
Table 4 shows that the quantiles of the 25 and 75% of the regression coefficients are 0.05 and 0.30, respectively, and the mean value is 0.24. Figure 2 shows that the part with the insignificant impact is mainly concentrated in the north part of the Tianhe District, where the building density is relatively low, whereas the spatial impact of most parts in the south of the Tianhe District is significant and positively correlated, indicating that the larger the building plot ratio, the greater the street vitality intensity, which is consistent with the results of the OLS model.
3.2.2.2 Influence of the distance from the nearest expressway (6 p.m.)
Table 4 shows that the quantiles of the 25 and 75% regression coefficients are 0.13 and 0.37, respectively, and the mean value is 0.26. Figure 2 shows that the influence of the north and east parts of Tianhe District is not significant, whereas that of the others is positive and significant.
3.2.2.3 Influence of building density (9 p.m.)
Table 4 shows that the quantiles of the 25 and 75% regression coefficients are 0.07 and 0.30, respectively, whereas the mean value is 0.18. Figure 2 shows that the impact of some areas in the north and east parts of the Tianhe District is not significant, whereas that of others is positive and significant, which is consistent with the analysis conclusion of the OLS model.
3.2.2.4 Impact of the mixing degree of land-use type (9 p.m.)
Table 4 shows that the quantiles of the 25 and 75% regression coefficients are 0.05 and 0.15, respectively, with a mean value of 0.09. Figure 2 shows that the negative part of the regression coefficient is not significant and is mainly distributed in the north and west parts of Tianhe District, and the significant part is positively correlated.
The main characteristics of the spatial heterogeneity pattern for the impact of the aforementioned four built-up environmental indicators on street vitality can be summarized as follows: in the central and southern parts of Tianhe District, generally including Wushan, Tangxia, Shipai, Tianyuan, Yuancun, Chepi, and other sub-districts, those built-up environmental indicators have basically a significant and positive impact on street vitality. These sub-districts are densely populated, with more colleges and universities, and the improvement of building volume ratio, land use mix, and the enhancement of regional urban development intensity and function mix can significantly increase street vitality. However, in the western part of the Tianhe District, i.e., the Zhujiang New Town CBD, the improvement of land use mixing degree does not significantly affect the street vitality. Affected by the high land prices, the CBD gathers high-end business offices, high-end residential buildings, and high-end commercial functions. However, the middle- and low-end businesses that can attract more people often cannot bear the high land prices and are unable to enter, resulting in the improvement of function mixing degree, which cannot significantly affect the street vitality. There are many mountains in the northern part of the Tianhe District, and the population flow is relatively small. The impact of each index on the street vitality in these areas is mainly insignificant. There are many “urban villages” in the eastern part of the Tianhe District, and the traffic is dense. The impact of each index on the street vitality in these areas is mainly insignificant.
4 Conclusion and discussion
This study proves that the six conditions of Jacobs’ street vitality are also applicable to the modern Chinese metropolis of Guangzhou. In particular, different from the existing studies on urban vitality, this study adopts the street scale and pays more attention to the significant impact of the built environment on both sides of the street on the vitality of the street. At the same time, the location service big data can more accurately describe the street vitality intensity, and so they have more analytical significance.
In general, the relevant conditions for maintaining urban vitality proposed by Jacobs, based on the background of the American metropolis in the 1950s, are also applicable to the modern Guangzhou metropolis (Tianhe) to a great extent. This shows that increasing the mixing degree of land use, the mixing degree of old and new buildings, and use intensity (building density and plot ratio) can significantly increase street vitality.
The GWR model, based on the local geographical weighting, considers spatial heterogeneity, and its fitting effect is significantly better than that of the OLS model. It can reveal the micro local characteristics of the impact of the built environment on street vitality and has important reference value for the optimization and adjustment of urban public transport, land use, and use intensity. The results reflect the temporal and spatial differences in the applicability of Jacobs’ relevant discussions in the Tianhe District. By analyzing the spatial differentiation characteristics of the impact variables on street vitality, the strong and weak areas of urban vitality in the Tianhe District can be distinguished to provide key reconstruction areas for urban planning in the future, improve the pedestrian environment, and improve urban vitality in a general way.
Improving the vitality of streets is an important goal of “people-oriented” modern urban planning. At present, the new spatial planning of Guangzhou is under planning. How to improve the street vitality of Guangzhou through urban planning and design, especially in the central urban area, is particularly important. Both sides of the street in the central urban area are high commercial value distribution areas, and enhancing the commercial and residential mixing degree on both sides of the street can improve the urban land use efficiency and street vitality. In the process of planning and design, it is necessary to pay more attention to the positive role of old buildings in improving the vitality of the street, and it is not necessary to uniformly demolish and rebuild the old buildings, but more consideration can be given to renewal and reconstruction. Appropriate retention of old buildings in the densely distributed areas of new buildings can also actively improve the vitality of the street. Paying full attention to the negative impact of expressways and railway lines on improving the vitality of streets, increasing commercial and residential density, and improving the traffic conditions around these urban development barrier facilities can effectively reduce the negative impact of these facilities on improving the vitality of streets. In general, modern urban planning and design of Guangzhou in the new period should strengthen the modern urban planning concept of “people-oriented” and take various planning and design measures to enhance the vitality of the streets.
Data availability statement
The raw data supporting the conclusion of this article will be made available by the authors, without undue reservation.
Author contributions
LW contributed to conception and design of the study. LW organized the database. LW performed the statistical analysis. LW wrote the first draft of the manuscript. LW wrote sections of the manuscript. LW contributed to manuscript revision, read, and approved the submitted version.
Conflict of interest
The author declares that the research was conducted in the absence of any commercial or financial relationships that could be construed as a potential conflict of interest.
Publisher’s note
All claims expressed in this article are solely those of the authors and do not necessarily represent those of their affiliated organizations, or those of the publisher, the editors and the reviewers. Any product that may be evaluated in this article, or claim that may be made by its manufacturer, is not guaranteed or endorsed by the publisher.
References
Brunsdon, C., Fotheringham, S., and Charlton, M. (1998). Geographically weighted regression. J. R. Stat. Soc. D. 47 (3), 431–443. doi:10.1111/1467-9884.00145
Cerin, E., Macfarlane, D., Ko, H. H., and Kca, C. (2007). Measuring perceived neighbourhood walkability in Hong Kong. Cities 24 (3), 209–217. doi:10.1016/j.cities.2006.12.002
De Nadai, M., Staiano, J., Larcher, R., Sebe, N., Quercia, D., and Lepri, B. (2016). “The death and life of great Italian cities: A mobile phone data perspective,” in 25th international world wide web conference. Editor B. Jacqueline (New York, United States: Association for computing machinery), 413–423. doi:10.1145/2872427.2883084
Delcl`os-Alio, X., and Miralles-Guasch, C. (2018). Looking at Barcelona through jane Jacobs’s eyes: Mapping the basic conditions for urban vitality in a mediterranean conurbation. Land Use Policy 75 (4), 505–517. doi:10.1016/j.landusepol.2018.04.026
Ewing, R., and Cervero, R. (2010). Travel and the built environment: A meta-analysis. J. Am. Plan. Assoc. 76 (3), 265–294. doi:10.1080/01944361003766766
Fuentes, L., Miralles-Guasch, C., Truffello, R., Delcl`os-Ali´o, X., Flores, M., and Rodríguez, S. (2020). Santiago de Chile through the eyes of Jane Jacobs. Analysis of the conditions for urban vitality in a Latin American metropolis. Land 9 (12), 498. doi:10.3390/land9120498
G´omez-Var, Irene, Delcl`os-Alio, Xavier, and Miralles-Guasch, Carme (2022). Jane Jacobs reloaded: A contemporary operationalization of urban vitality in a district in Barcelona. Cities 123, 103565–103615. doi:10.1016/j.cities.2022.103565
Hass-klau, C., Crampton, G., Dowland, C., and Nold, L. (1999). Streets as living space: Helping public spaces play their proper role. London: ETP/Landor.
Jia, J., and Song, J. (2020). Identifying the relationship between urban vitality and the “3D” characteristics of built environment: A case study of wuhan, China. Mod. Urban Res. (in Chinese) (8), 59–66. doi:10.3969/j.issn.1009-6000.2020.08.008
Kim, Y. L. (2018). Seoul’s Wi-Fi hotspots: Wi-Fi access points as an indicator of urban vitality. Computers, Environment and Urban Systems 72, 13–24. doi:10.1016/j.compenvurbsys.2018.06.004
King, K. (2013). Jane Jacobs and ‘the need for aged buildings’: Neighbourhood historical development pace and community social relations. Urban Studies 50 (12), 2407–2424. doi:10.1177/0042098013477698
Koohsari, M. J., Karakiewicz, J. A., and Kaczynski, A. T. (2013). Public open space and walking: The role of proximity, perceptual qualities of the surrounding built environment, and street configuration. Environment and Behavior 45, 706–736. doi:10.1177/0013916512440876
March, A., Rijal, Y., Wilkinson, S., and Firidin Ozgur, E. (2012). Measuring building adaptability and street vitality. Plan. Pract. Res. 27 (5), 531–552. doi:10.1080/02697459.2012.715813
Nadai, M., Staiano, J., Larcher, R., Daniele, Q., Nicu, S., and Bruno, L. (2016). “The death and life of great Italian cities: A mobile phone data perspective,” in International World Wide Web Conferences Steering Committee. 25th International ACM Conference on World Wide Web, Montréal Québec Canada, April 11 - 15, 2016. Geneva: ACM.
Niu, X., Wu, W., and Meng, L. (2019). Influence of built environment on street vitality and its spatiotemporal characteristics based on LBS positioning data. Urban Planning International (in Chinese) 34 (1), 28–37. doi:10.22217/upi.2018.495
Rui, S., Lin, Y., Xiao, Z., and Ye, Y. (2021). Spatio-temporal analysis of built environment and street vitality relationship based on street-level imagery: A case study of futian district, shenzhen. Scientia Geographica Sinica (in Chinese) 41 (9), 1536–1545. doi:10.13249/j.cnki.sgs.2021.09.005
Saelens, B. E., and Handy, S. L. (2008). Built environment correlates of walking: A review. Med. Sci. Sports Exerc. 40 (7), S550–S566. doi:10.1249/mss.0b013e31817c67a4
Sung, H., Kim, D., and Choi, C. (2013). Evidence of Jacobs’s street life in the great Seoul city: Identifying the association of physical environment with walking activity on streets. Cities 35, 164–173. doi:10.1016/j.cities.2013.07.010
Sung, H., and Lee, S. (2015). Residential built environment and walking activity: Empirical evidence of Jane Jacobs’ urban vitality. Transportation Research Part D Transport and Environment 41, 318–329. doi:10.1016/j.trd.2015.09.009
Wang, J. (2019). Inclusiveness and sharing, explicit and implicit mutual learning, livability predicted: Historical prospect and contemporary creation of urban vitality. Urban planning (in Chinese) 43 (12), 9–16. doi:10.11819/cpr20191203a
Wei, Y. D., Xiao, W., Wen, M., and Wei, R. (2016). Walkability, land use and physical activity. Sustainability (Switzerland) 8 (1), 65–16. doi:10.3390/su8010065
Xu, X., Xu, X., Guan, P., Ren, Y., Wang, W., and Xu, N. (2018). The cause and evolution of urban street vitality under the time dimension: Nine cases of streets in Nanjing City, China. Sustainability (Switzerland) 10 (8), 2797. doi:10.3390/su10082797)
Yue, W., Chen, Y., Thy, P., Fan, P., Liu, Y., and Zhang, W. (2021). Identifying urban vitality in metropolitan areas of developing countries from a comparative perspective: Ho Chi Minh city versus Shanghai. Sustainable Cities and Society 65, 102609. doi:10.1016/j.scs.2020.102609
Keywords: street vitality, Tencent location service data, Jacobs, the built environment, Guangzhou
Citation: Wangbao L (2022) Spatial impact of the built environment on street vitality: A case study of the Tianhe District, Guangzhou. Front. Environ. Sci. 10:966562. doi: 10.3389/fenvs.2022.966562
Received: 11 June 2022; Accepted: 16 September 2022;
Published: 05 October 2022.
Edited by:
Salvador García-Ayllón Veintimilla, Technical University of Cartagena, SpainReviewed by:
Fenglei Fan, South China Normal University, ChinaShaopei Chen, Guangdong University of Finance and Economics, China
Copyright © 2022 Wangbao. This is an open-access article distributed under the terms of the Creative Commons Attribution License (CC BY). The use, distribution or reproduction in other forums is permitted, provided the original author(s) and the copyright owner(s) are credited and that the original publication in this journal is cited, in accordance with accepted academic practice. No use, distribution or reproduction is permitted which does not comply with these terms.
*Correspondence: Liu Wangbao, d2JsaXVAc2NudS5lZHUuY24=