Abstract
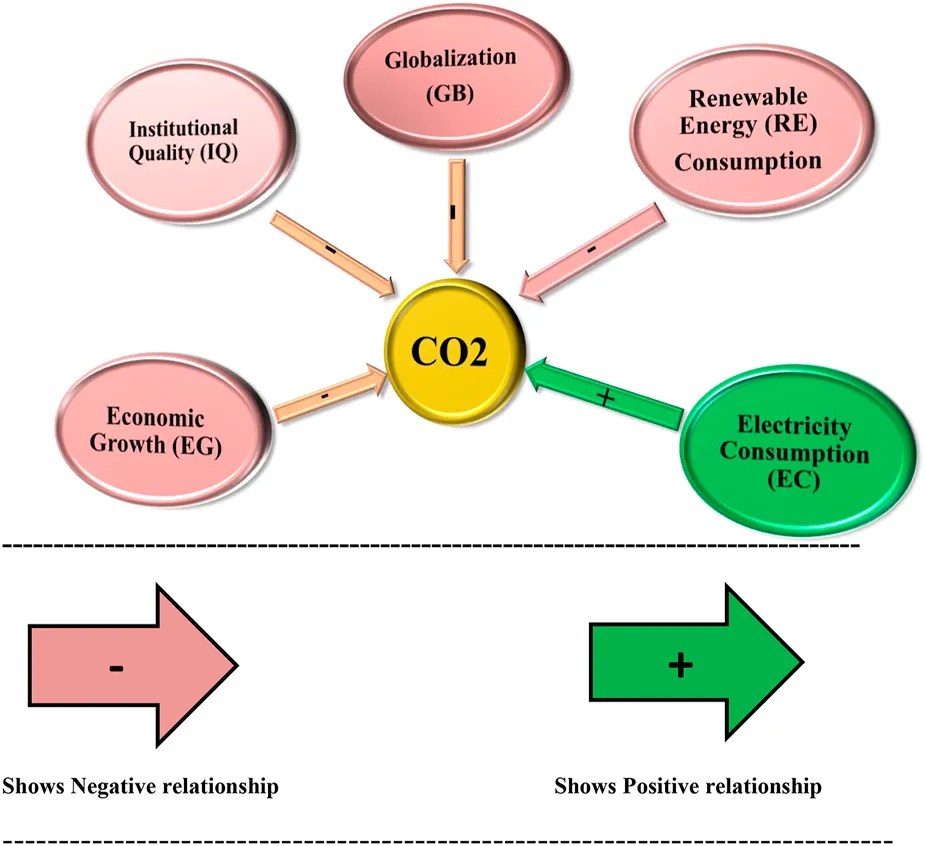
This research used the dynamic panel model and QR (Quantile Regression) to examine the effect of globalization (GB), Institutional Quality (IQ), Economic Growth (EG), Electricity Consumption (EC), and Renewable Energy (RE) consumption on Carbon dioxide (CO2) emission from 1991 to 2018 in thirty-six (OCED) countries. Panel unit root tests have been employed to examine the stationarity of the study variables; the results, which included the Harris and Tzavalis (Journal of econometrics, 1999, 91 (2), 201–226) and Levin et al. (Journal of Econometrics, 2002, 108 (1), 1–24) tests, indicate that all of the variables used are a combination of I (0) and I(I). Cointegration in the study variables has been examined using the cointegration tests devised by Westerlund, Kao, and Pedroni; the results suggest that cointegration exists in the research variables. Findings of the one-step difference GMM, One-step system GMM and two-step system GMM reveal that RE consumption, GB, and IQ negatively affect the CO2 emission in (selected OECD) countries that help to reduce CO2 excretion. In contrast, EC consumption and EG become responsible for the climatic and environmental loss. Further, this study checked the robustness by using SQR (Simultaneous quantile regression) and PQR (Panel Quantile Regression). The evaluated study findings of QR (Quantile Regression) reveal that RE consumption, GB, and IQ help to reduce the CO2 emission while EG and EC consumption becomes responsible for the climatic and environmental loss. Further recommendations are suggested based on the findings.
Introduction
Natural disasters are mainly caused by the climatic and environmental loss; both developing and developed countries are facing climatic and environmental loss (Baiardi and Morana, 2021) that are mainly caused by the reduction of resources (Kabir and Salim, 2019) such as soil, water, and air; the destruction of the ecosystems; habitat demolition; the destruction of wildlife and greenhouse gasses (Saud et al., 2020). Greenhouse gases are known main climatic and environmental loss element that adversely impacts the world. Riti et al. (2017a), Sheraz et al. (2022a) reveals that degradation of the climatic atmosphere is mainly caused by natural disasters such as floods, forest fires and hence negatively affect infrastructure, agricultural land and natural resources as well as human beings. OECD (2020) report also suggested that the main cause of greenhouse gases is CO2 emission around the globe. Canada is toped ranked country in CO2 emission by contributing 15.5% tones/capita followed by Australia, United States and Luxembourg, contributing 15.3, 14.9 and 14.8%, respectively, and it is steadily rising.
Khan and Hou (2021), Shen et al. (2022a) investigated the effect of consumption of traditional energy sources and IQ on CO2 emission in South African countries. Results showed that climatic atmosphere quality in African region improves with IQ. Salman et al. (2019), Shen et al. (2022b) examined the association between IQ and CO2 emission. Study findings reveal that CO2 emission and IQ are positively correlated. Authors concluded that effective institutions are important aspects of the legislation that will assist in taking a low level the climatic and environmental loss and enhance the EG. However, the study of Wu and Zhu (2021); Obobisa et al. (2022) reveals that CO2 emission has a negative effect by enhancement in the IQ from African perspective.
On the contrary, Hassan et al. (2019), Lei et al. (2021) investigated the effect of IQ on CO2 emission in Pakistan. Their results show that CO2 emission has a positive effect of IQ. Asongu and Odhiambo (2019), Chen X. et al. (2021); Quan et al. (2021) reveal that country follow rules and regulations regarding the climatic atmosphere with high IQ. Results indicate that the climatic atmosphere improves with an enhancement in IQ.
Sarkodie et al. (2020a); Chen Y. et al. (2021); Quan et al. (2022) showed that in African economies, RE consumption assists in reducing climatic and environmental loss. According to Pilatowska et al. (2020) by enhancing the climatic atmosphere, RE consumption helps health facilities, education, and the gender gap. Destek and Aslan (2020) and Sarkodie et al. (2020b) examined the impact of RE consumption on CO2 emission in China. Results demonstrate that biomass consumption of traditional energy sources takes a low-level CO2 emission.
Khan et al. (2019), Qin et al. (2022), Liu S. et al. (2022) investigated the effect of consumption of traditional energy sources on CO2 emission in Pakistan. Study findings reveal that energy consumption and CO2 emission are positively correlated. Similarly, another study by Khan et al. (2020) concluded that CO2 emission has a positive influence on the consumption of traditional energy sources and EG. Adedoyin et al. (2020), Munir et al. (2020), Liu Y. et al. (2022), Yin et al. (2022) also checked the impact of EG on CO2 emission and concluded that EG and CO2 are positively correlated in Asian countries.
Anwar et al. (2020) examined the effect of coal usage and EG on CO2 in Pakistan. They concluded that coal consumption and EG impact CO2 emission positively. Several distinct research studies Yoo (2006), Akinlo (2008), Khan et al. (2018), Bashir et al. (2019), Ali et al. (2019), Eyuboglu and Uzar (2020) and Wang Q. et al. (2020) investigated the relationship among energy consumption, EG, and CO2 excretion. Their study results conclude that the consumption of traditional energy sources becomes responsible for boosting the climatic and environmental loss. The study of Awodumi and Adewuyi (2020); Shang et al. (2021); Wang and Luo (2022) applied non-linear autoregressive distributed lag to evaluate the influence of consumption of traditional energy sources on the CO2 emission in African region.
Findings of the study reveal that consumption of traditional energy sources and CO2 excretion. Salahuddin et al. (2018) and Naz et al. (2019) studied the impact of EC, EG, and FDI on CO2 emissions in Kuwait. Results reveal that EC, EG, and FDI are positively correlated with CO2 excretion. Similarly, another study results of Salahuddin et al. (2018) demonstrate that Consuming EC and EG for industrial processes reduces CO2 emissions in GCC nations.
In many research studies, domestic credit to the private sector is used as a proxy to measure financial development (Komal and Abbas, 2015; Park et al., 2018) found; that many research projects employed stock market indicators as a proxy for financial progress. To reveal the presence of a climatic and environmental loss Kuznets curve (EKC), Shahbaz et al. (2017) analyzed the association between GB and CO2 excretion in China by employing time series data from 1970 to 2012. Their study result indicates that GB is positively related to CO2 emissions from excessive consumption in advanced economies are being shifted to developing economies, and emerging economies are willing to accept the problem of climatic and environmental deterioration in exchange for economic success.
Sheraz et al. (2021) showed that GB’s economic, political, and social aspects influence everyone around the world. The world’s developing countries are linked to developed countries with the goal of attracting funds for EG. In Pakistan, Khan et al. (2019a) used time-series data to assess the influence of GB on CO2 excretion. Findings indicate that GB and CO2 are positively linked with each other; moreover, developed countries are investing in Pakistan because of the country’s consistent and increasing investment opportunities for international investors, as well as its economic development. Early research focused on the effects of GB or IQ with other economic variables, while this study examines the effects of GB and IQ with other economic variables. This study used GB and IQ both variables together along with other economic variables to check their impact on CO2. However, several variables such as GB, IQ, EC consumption, RE consumption, and EG were entirely ignored in early studies that employed dynamic panel models to assess the impact of the stated variables on CO2 emissions, such as one-step difference GMM, one step system GMM, and two-step system GMM. To investigate the robustness, this study employed SQR and PQR. For the first time, panel data from 36 OECD countries (see Appendix Table A1) were used from 1991 to 2018. The basic concern of this research study is to see how GB, IQ, energy consumption, EC use, and EG affect CO2 emissions. Countries are chosen depending on their EG and energy consumption to conduct economic activities; pollution is a significant issue in many countries because of their high energy consumption, causing concern among policymakers and energy experts. This study employs cross-sectional dependence studies such as Kao cointegration Kao (1999), and Pedroni cointegration Pedroni (1999), Pesaran (2004), Westerlund (2005).
Literature review
Hdom (2019) used the ARDL model to examine the influence of EC production on CO2 emissions in South America from 1980 to 2010. The study’s findings reveal that EC and EG production are positively related to CO2 emissions in the short run, although RE consumption assists in environmental improvement. It is also suggested that sample countries should use RE in CO2 reduction. The study of Ridhosari and Rahman (2020) illustrates that EC consumption is a significant contributor to the growth in CO2 emissions. Hamdi et al. (2014) evaluated the relationship between EC consumption, EG, and FDI in Bahrain. Study findings reveal that EC consumption and EG are correlated with each other. Liddle and Sadorsky (2017) examined the effect of EC generation on CO2 emission. The study results reveal that 1% increase in EC production contributes to about 0.82% reduction in CO2 emission. Cowan et al. (2014) evaluated the effects of EC consumption on CO2 excretion. Results indicate that EC consumption contributes to the invalidity of the Granger causality test for measuring CO2 excretion.
Sheraz et al. (2022b) explored the role of intelligence on climatic and environmental degradation in BRI countries. Results show that IQ contributes in CO2 emission reduction. Furthermore, existing studies showed that CO2 emission and trade openness are positively correlated. Similarly, they also conducted another survey and revealed that IQ is a solution for a clean climatic atmosphere and that IQ is important to improve the quality of the climatic environment. Akif and Asumadu (2019) investigated how IQ affects CO2 emissions in newly industrialized countries. Results of the study demonstrated that IQ contributes to reducing CO2 emissions and that standards linked with the law help for the improvement of the climate.
Liu et al. (2020) examined the impact of GB in G-7 economies to verify the EKC hypothesis. Findings showed that GB helps to reveal the presence of the EKC hypothesis in G-7 economies. Further evaluated results show that EG is positively significant with environmental degradation, While the consumption of RE and environmental degradation are negatively associated with each other. Rehman et al. (2019) examined the effect of GB RE usage on CO2 emissions. Results demonstrated that GB and RE consumption helps to reduce the CO2 emission while negatively affected the environmental degradation and hence consumption of traditional energy sources becomes responsible to an enhancement the CO2 excretion. Zaidi et al. (2019) studied the effect of GB on CO2 emissions in the APEC (Asia Pacific Economic Cooperation). Results of the study validate that GBs contributes in the reduction of CO2 emission. Akadiri et al. (2019) evaluated the impact of GB on the CO2 emission. Results indicated that GB helps to lessen the CO2 emission in Turkey. Ziaei (2015) evaluated the impact of RE consumption on CO2 emission. Results demonstrated that RE consumption helps to take a low level the CO2 excretion. Godil et al. (2020) studied the impacts of IQ, traditional energy consumption, and RE use on CO2 emissions in South African countries. Results showed that RE consumption and IQ help in the reduction of CO2 emission in South Africa. Riti et al. (2017b) explored the correlation between financial development and RE use.
Study results revealed that financial development, population, and RE consumption is negatively related to CO2 emission while the results of traditional consumption of traditional energy sources increase the CO2 emission. In Asian economies, RE consumption and value-added agricultural production contribute in the reduction of CO2 emissions in Asian economies, while the finding of consumption of energy sources indicates a positive influence on climatic and environmental degradation (Liu et al., 2017).
Research methodology
This study examines the impacts of EG, RE, and EC consumption, as well as GB and IQ, on CO2 emissions in 36 OECD states using a balanced panel dataset from 1991 to 2018. The variables in this study have been chosen based on previously published research. CO2 emissions have been used as a proxy for measuring the degradation of the environment by W. Cowan et al. (2014), Paramati et al. (2017), Xu et al. (2020) employed EC consumption as a main indicator for climatic and environmental degradation; Dreher (2006); Cowan et al. (2014); Hafsaoui et al. (2019); Wang Z. et al. (2020) evaluated the effect of EG on CO2 emission. As a result of this investigation, the following fundamental equation is generated and initiated.
The letter t denotes time frame from 1991 to 2018, and the letter “i” denotes selected OECD countries that have been selected. Table 1 illustrate a detail description of the variables.
TABLE 1
| Variables | Description | Source |
|---|---|---|
| CO2 Excretion | Metric Tons per Capita | selected OECD |
| RE consumption | Total primary energy as a percentage | selected OECD |
| EC consumption | Gigawatt-Hours in Total | selected OECD |
| EG | Gross Domestic Product (GDP) (Constant 2010 USD) | WDI |
| IQ | Stability in government, democratic accountability, bureaucratic excellence, corruption, and law and order | ICRG |
| GB | KOFI GB Index | KOFI |
Variables Description.
Materials and Methods
This study evaluated the effects of RE consumption, EC consumption, EG, IQ, and GB on the emission of CO2 in sample countries. Study results have been validated using GMM (one-step difference and one and two-step system) models. SQR and PQR have been employed to evaluate the results’ robustness. Endogeneity, heteroskedasticity, serial correlation control, and heterogeneity. Are all concerns that the QR (Quantile Regression) and panel dynamic models intend to avoid (Baltagi, 2005; Kripfganz and Schwarz, 2019; Neagu and Teodoru, 2019).
The dynamic panel model, commonly known as the GMM model, is examined by employing instrumental models that have an advantage over the traditional two-stage least squares (2SLS) approach. GMM model is well suited model for dynamic panel model. GMM estimators are unbiased. Arellano and Bond (1991) examined the performance of several GMM, OLS, and WG estimators. They concluded that GMM estimators possess low variations and biasness by using stimulations. According to Fumio Hayashi (2011), GMM models employ orthogonality requirements to achieve successful estimation results in the presence of heteroscedasticity induced mostly by the unknown form. Therefore, for our formal analysis, we adopted a type of dynamic panel with lagged levels of CO2 excretions using Arellano and Bond (1991)’s GMM estimators. Based on Equations, the following is a proposed model for the GMM estimator (1).
In the above Eq 2 is the element that is to be investigated by controlling for a vector of core explanatory variables, specifies country-specific effects, reveal the error term. Additionally, are the elements to be capture the effect of RE consumption, EC consumption, EG, IQ and GB respectively. This study used a model to indicate the form of the dynamic panel data models proposed by Arellano and Bond (1991). The above-mentioned Eq 2 suggests the model that includes the lagged dependent variables of CO2 emission that is correlated with the error term.
Further robustness was checked with quantile regression. PQR and SQR have investigated the impact of RE consumption, EC consumption, EG, IQ, and GB on CO2 excretion. PQR equation is based on Eq 1.
The above PQR equations indicates that “I” denote sampled countries and t represents time period of 1991–2018. represents the unobserved specific effect, τ indicates the conditional distribution’s number of quantiles. The variables used to investigate the impact of these components i.e (RE consumption, EC consumption, IQ, EG, and GB) on CO2 excretion. In addition, the coefficients have been examined using the following equation to determine the τth quantile of the conditional distribution.
In Eq 4 Specifies to examine the function and I (.) is an indicator function.
The Pesaran (2004) CD test has been employed to determine cross-sectional dependency in this research. The HT (Harris- Tzavalis) test and the LLC (Levin-Lin-Chu) test have been employed to determine stationarity, respectively. Pedroni (1999), Pedroni (2004) and Westerlund introduced cointegration, which has been investigated using cointegration tests.
Results and discussion
Results of descriptive statistics have been reported in Table 2. Study findings reveal that the average CO2 emission is 8.435, with maximum and minimum values of 2.1 and 29, respectively. The descriptive statistics show that the least and biggest RE consumption amounts are 0.28 and 89.750, with an average of 14.366. The average quantity of EC consumed is 4.89, with low and high values of 3.003 and 6.622, respectively. The minimum and maximum EG values are -14.814 and 25.163, respectively, with a mean value of 2.631. The mean IQ value is 0.01 with a maximum value of 2.089 and a minimum value of -6.205; the mean GB value is 1.888 with a maximum value of 1.615 and a minimum value of 1.961.
TABLE 2
| Variable | Obs | Mean | Std. Dev | Min | Max |
|---|---|---|---|---|---|
| CO2 Excretion | 1,008 | 8.435 | 4.212 | 2.100 | 29.000 |
| RE consumption | 1,008 | 14.366 | 15.675 | 0.280 | 89.750 |
| EC Consumption | 1,008 | 4.890 | 0.682 | 3.003 | 6.6220 |
| EG | 1,008 | 2.631 | 3.229 | −14.814 | 25.163 |
| IQ | 1,008 | 0.010 | 1.637 | −6.205 | 2.0890 |
| GB | 1,008 | 1.888 | 0.057 | 1.615 | 1.9610 |
Descriptive statistics.
The correlations matrix has been established, as shown in Table 3. Findings reveal that CO2 emissions have a positive link with EC consumption, EG, IQ, and GB, but a negative relationship with RE consumption in selected OECD countries. The results of the correlations matrix reveal that RE consumption helps to minimize the climatic and environmental loss in several OECD countries. Still, EG and EC consumption cause a rise in the climatic and environmental loss.
TABLE 3
| Variables | (1) | (2) | (3) | (4) | (5) | (6) |
|---|---|---|---|---|---|---|
| CO2 Excretion | 1.000 | |||||
| RE consumption | −0.283 | 1.000 | ||||
| EC Consumption | 0.136 | −0.263 | 1.000 | |||
| EG | 0.024 | −0.008 | −0.110 | 1.000 | ||
| IQ | 0.358 | 0.258 | 0.004 | −0.095 | 1.000 | |
| GB | 0.213 | 0.015 | 0.173 | −0.078 | 0.457 | 1.000 |
Correlations Matrix.
The VIF has been applied to analyze the multicollinearity problem in the variables listed in Table 4. The VIF results show that there is no problem with multicollinearity in the variables. All variables have a significance level of more than 0.20, and the VIF values are less than 5, indicating that the variables are not multicollinear.
TABLE 4
| Variables | VIF | 1/VIF |
|---|---|---|
| IQ | 1.38 | 0.724,553 |
| GB | 1.32 | 0.757,890 |
| RE Consumption | 1.16 | 0.858,915 |
| EC Consumption | 1.12 | 0.889,623 |
| Economic Growth | 1.02 | 0.978,520 |
| Mean VIF | 1.2 |
VIF Test.
Note: VIF, is Variance Inflation Factor.
The analysis of the Levin-Lin-Chu and the Harris-Tzavalis Unit root tests on the Panel Unit root test is summarized in Table 5. CO2 emissions and RE consumption are not stationary at the level, but they become stationary at the first difference, but EC consumption, EG, IQ, and GB do not have a unit root problem at the level or the first difference. While consumption of RE, GB, and EC is not stationary at the level, it is stationary at the first difference, CO2, EG, and IQ are stationary both at the level and at the first difference.
TABLE 5
| Levin-lin-Chu | Harris-Tzavalis | |||
|---|---|---|---|---|
| At Level | At Difference | At Level | At Difference | |
| CO2 Excretion | −4.7878 | −21.6722*** | −2.2105* | −46.4064*** |
| RE consumption | 3.4798 | −19.3778*** | 2.9469 | −61.2288*** |
| EC Consumption | −11.4941*** | −21.9518*** | 0.9198 | −48.5811*** |
| Economic Growth | −20.4808*** | −34.4661*** | −29.4314*** | −61.0233*** |
| IQ | −11.4508*** | −23.2201*** | −7.1010*** | −43.3475*** |
| GB | −17.2299*** | −19.9598*** | 0.1097 | −34.9762*** |
Panel Unit Root Test.
Where *p < 0.05; **p < 0.01; ***p < 0.001.
The cross-sectional dependence findings are summarized in Table 6. The findings show that the research variables are stable, rejecting hypothesis H0. Cross-sectional reliance test demonstrates that every country has a cross-sectional dependency.
TABLE 6
| Variable | CD-Test | p-value | Corr | abs (corr.) |
|---|---|---|---|---|
| CO2 Excretion | 33.46 | 0.000 | 0.252 | 0.511 |
| RE consumption | 66.51 | 0.000 | 0.501 | 0.672 |
| EC Consumption | 77.17 | 0.000 | 0.581 | 0.668 |
| EG | 58.35 | 0.000 | 0.439 | 0.448 |
| IQ | 30.82 | 0.000 | 0.232 | 0.376 |
| GB | 126.19 | 0.000 | 0.95 | 0.95 |
Cross-sectional Dependence Test.
Table 7 presents the findings of the Westerlund, Kao, and Pedroni cointegration tests. The Westerlund, Kao, and Pedroni cointegration tests have been used to detect cointegration in the research variables. The cointegration results are significant, indicating that the tested variables are cointegrated.
TABLE 7
| Kao Cointegration Test | ||
| Statistic | p-Value | |
| MDF t (Modified Dicky Fuller) | −0.7524 | 0.2259 |
| DF (Dicky Fuller t) | −1.6763 | 0.0468 |
| ADF (Augmented Dicky Fuller t) | −1.7461 | 0.0404 |
| UMDF (Un-adjustable Modified Dicky Fuller t) | −3.2613 | 0.0006 |
| UDF (Un-adjustable Dicky Fuller t) | −3.1758 | 0.0007 |
| Pedroni Cointegration Test | ||
| MPP (Modified Phillips-Perron t) | 2.3093 | 0.0105 |
| PP (Phillips-Perron t) | −6.1605 | 0.000 |
| ADF (Augmented Dicky Fuller t) | −4.3362 | 0.000 |
| Westerlund Cointegration Test | ||
| Variance ratio | −1.8602 | 0.0314 |
Panel Cointegration Test.
The findings of GMM models are summarized in Table 8. The basic purpose of this research is to examine the impact of EC consumption, RE consumption, EG, IQ and GB on CO2 excretion in selected sample countries. The results of the GMM models reveal that RE consumption has a negative and considerable influence on CO2 emissions in OCED countries. The data show that in several OECD countries, consumption of RE reduces CO2 emissions.
TABLE 8
| One-step difference GMM | One-step system GMM | Two-step system GMM | |
|---|---|---|---|
| 0.790*** | 0.983*** | 0.971*** | |
| (37.84) | (214.35) | (151.47) | |
| RE consumption | −0.212*** | −0.108*** | −0.107*** |
| (−36.94) | (−101.33) | (−12.75) | |
| EC Consumption | 1.468*** | 0.220*** | 0.336 |
| (7.40) | (9.20) | (1.43) | |
| EG | 0.00698 | 0.0987*** | 0.103*** |
| (1.40) | (19.24) | (23.4*** | |
| IQ | −0.294*** | −1.238*** | −1.121*** |
| (−6.18) | (−110.12) | (−22.68) | |
| GB | −1.095 | −0.0872 | −0.303 |
| (−1.62) | (−0.28) | (−0.30) | |
| _cons | 8.472*** | 7.317*** | |
| (14.46) | (3.46) | ||
| AR(1) | 0.142 | 0.180 | 0.630 |
| AR(2) | 0.333 | 0.222 | 0.446 |
| N | 972 | 1,008 | 1,008 |
Dynamic Panel GMM Results.
t statistics in parentheses.
p< 0.05.
p< 0.01.
p< 0.001.
The analyzed data reveal that increases in RE consumption reduce CO2 emissions by 0.21, 0.10, and 0.10%, respectively. Results of the RE consumption are in line with those of earlier studies. Muhammad et al. (2021) investigated the effect of RE use on global climate and environmental degradation. They claimed that using RE contributes to lower CO2 emissions. Teng et al. (2020) investigated how RE consumption affects CO2 emissions. The results of the study show that the use of RE reduces CO2 emissions. Using time-series data, Usman et al. (2020) investigated the asymmetric effect of consumption of traditional energy sources on CO2 emission in Pakistan. They proved that consuming sustainable energy reduces CO2 emissions in Pakistan. The effect of RE consumption on CO2 emission is also investigated by Chiu and Chang (2009), Al-Mulali and Ozturk (2015), Shafiei and Salim (2013), and Bento and Moutinho (2016). They claimed that RE consumption contributes to keep CO2 emissions to a minimum level. Dogan and Seker (2016) investigated causes of climatic and environmental degradation. The data show that the use of RE aims to reduce climatic and environmental degradation, but traditional consumption of traditional energy sources increases climatic and environmental degradation. Jebli et al. (2016) investigated the effect of using RE on CO2 emissions. Results show that consumption of RE contributes to minimize CO2 emissions. Findings of the GMM (one-step difference and system) show EC consumption has a positive and considerable effect on CO2 emissions in a number of OECD countries. According to the investigated findings of power consumption, a one percent increase in EC consumption has a positive effect on CO2 emission and is responsible for increasing CO2 emission by 1.46 and 0.22%, respectively. Results on EC consumption are similar to those of the following researchers.
In a group of countries, Asongu et al. (2020) investigated the effect of consumption of traditional energy sources and urbanization on CO2 emissions. The data show that consumption of EC has a positive effect on CO2 emissions. According to, increased EC consumption increases CO2 emissions, which results in climatic and environmental degradation. Munir and Riaz (2020) looked at the asymmetric influence of consumption of traditional energy sources on CO2 emissions in South Asian economies. The data indicated that increased EC consumption in South Asian countries had a positive effect on CO2 emissions. Salahuddin et al. (2018) also concluded similar conclusions. They indicated that increasing EC usage causes more pollution.
EG is positively and significantly related to degradation of environment in selected OECD countries. According to findings of GMM model (one-step difference and one-step system), one percent increase in EG is responsible for increases in excretion of CO2 is 0.098 percent and 0.103 percent, respectively, in 36 OECD countries. Results on EG and CO2 emissions are consistent with prior studies. Muhammad et al. (2021) showed that global EG is significantly important for climatic and environmental degradation. Another recent study by Teng et al. (2020) found that economic activities have a positive effect on climatic and environmental loss. In Pakistan, Khan et al. (2019)Khan et al. (2019a), Khan et al. (2019b) employed a dynamic ARDL simulation time series model to demonstrate that economic activities reduce CO2 emissions. Economic activities boost CO2 emissions; they also say that EKC is beneficial to the world’s industrialized economies.
The findings of the GMM models in 36 OECD nations show that IQ has a negative and significant influence on CO2 emissions. One-step difference GMM, one-step system GMM, and two-step system GMM all show a 29, 1.23, 1.12% reduction in carbon emission by 1% increase in IQ, 1.23 percent, and 1.12 percent, respectively. According to Ibrahim and Law (2014), IQ strengthens the rules and regulations that support the reduction of CO2 emissions. IQ has a detrimental impact on CO2 excretion Ali et al. (2019). Intelligence contributes to the mitigation of climatic and environmental harm, according to Tamazian and Rao (2010), Lau et al. (2014), and Al-Mulali and Ozturk (2015). IQ has a positive impact on EG but a negative impact on climate change and environmental harm (Bhattacharya et al., 2017).
GB and CO2 are negatively and significantly correlated with each other in sample OECD countries. According to results of the GMM models. Teng et al. (2020) showed that GB has a negative effect on climatic and environmental degradation in the long run. GB (Balsalobre-Lorente et al., 2019), contributes in the reduction of climatic and environmental degradation. According to Shahbaz et al. (2019), as GB increases, climatic and environmental loss decreases. In Pakistan, Khan et al. (2019a) showed that GB increases climatic and environmental degradation. Study findings of Sheraz et al. (2021) and Twerefou et al. (2017) reveal that GB contributes in increased climatic and environmental degradation.
QR (Quantile Regression) i.e., SQR (Simultaneous quantile regression) and PQR (Panel Quantile Regression), were used to check the robustness of the evaluated results. Table 9 demonstrates results of the robustness check QR results.
TABLE 9
| SQR | QRPD | ||||
|---|---|---|---|---|---|
| Q25 | Q50 | Q75 | Q95 | ||
| RE consumption | −0.0920*** | −0.0787*** | −0.0617*** | −0.149*** | −0.0502*** |
| (−8.97) | (−11.31) | (−4.12) | (−18.15) | (−8.26) | |
| EC Consumption | −0.0477 | 0.479*** | 1.542 | 0.257 | 0.980*** |
| −0.34) | (4.25) | (1.61) | (1.21) | (19.82) | |
| EG | 0.0177 | 0.0209 | 0.119* | 0.0695 | −0.0383*** |
| (0.98) | (1.09) | (2.00) | (1.08) | (−3.24) | |
| IQ | −1.220*** | −1.160*** | −1.156*** | −1.223*** | −0.997*** |
| (−16.94) | (−16.29) | (-3.65) | (−9.18) | (−20.36) | |
| GB | −2.397* | 1.359 | −8.163 | 11.78 | −8.111*** |
| (−2.39) | (0.77) | (−1.05) | (1.67) | (−10.92) | |
| _cons | 12.01*** | 3.628 | 18.26 | −5.645 | |
| (5.97) | (1.17) | (1.42) | (−0.42) | ||
| Pseudo R2 | 0.2115 | 0.1724 | 0.1068 | 0.2360 | |
| N | 1,008 | 1,008 | |||
Robustness check QR (Quantile Regression) Results.
t statistics in parentheses.
p< 0.05.
p< 0.01.
p< 0.001.
The results of the SQR and PQR findings indicated that RE consumption and environmental loss are significantly negative correlated in sample countries. The results of the SQR show that increasing RE consumption CO2 reduces by one percent while climatic and environmental loss by 0.092%, 0.078%, -0.061%, and 0.149% in the selected OECD countries, respectively, from quantile 25 to quantile 95. On the contrary, results of the panel quantile regression indicate that 1% increase in consumption of RE reduces CO2 excretion by approximately 0.050% in the sample OECD nations.
According to the results of the simultaneous quantile regression, consumption of EC and environmental degradation are significantly and positively related to each other in the selected OECD countries with quantile 50. On the contrary, the panel QR yielded the same conclusions. According to results of the panel quantile regression, the consumption of EC consumption has a positive and substantial effect on climatic and environmental degradation in the selected OECD countries and accounts for 0.98% of the climatic and environmental degradation.
Results reveal that EG impacts climatic and environmental degradation positively and significantly in the OECD countries with quantile 75. According to the quantile 75 results, a 1% increase in economic development leads to 0.119% increase in climatic and environmental loss in selected OECD countries. While the results of the panel quantile regression reveal that EG in the selected OECD countries contributes to the mitigation of climatic and environmental degradation. Results show that employing advanced technology in economic activities helps to mitigate climatic and environmental degradation in developed countries throughout the world.
Results of the IQ and GB show that the selected OECD countries have a negative and considerable influence on climate and environmental degradation. Results of the SQR show that IQ contributes in the reduction of CO2 emissions in the OECD economies. The results of the panel QR reveal that in the selected OECD countries, IQ and GB contribute to mitigating climatic and environmental degradation. Further graphs for QR in Figure 1 for all variables are as follow.
FIGURE 1
Conclusion
The impact of GB, IQ, RE consumption, EG, and consumption of EC on CO2 excretion has been investigated in sample of OECD 36 countries. Quantile regression methods; PQR and SQR has been employed to analyze the relationship among study variables. To assess the stationarity of variables Panel Unit Root test; HT, and LLC tests have been used. The results of these tests reveal that at both the level and the first difference, the variables are stationary. Westerlund, Pedroni, and Kao tests results indicate that cointegration exists among variables.
According to study results of the GMM models, In OCED nations, RE usage has a negative and considerable impact on CO2 emissions. The findings show that using RE helps to cut CO2 emissions in a number of OECD nations. The investigated data show that increased consumption of RE reduces CO2 emissions by 0.21%, 0.10%, and 0.10%, respectively. The results of the GMM (one-step difference) and GMM (one-step system) show that EC usage has a favorable and significant influence on CO2 emissions in several OECD countries. According to the results of the EC consumption, 1% increase in EC consumption has a positive effect CO2 emission and is responsible for proliferation of 1.46 and 0.22%, respectively.
GMM system’s results indicate that EG has a significant and positive influence on climatic and environmental degradation in sample countries. According to results one percent increase in EG generates 0.098 and 0.103% rise in CO2 excretion in sample countries, respectively. Findings of GMM difference and system indicate that IQ has a negative and significant impact on CO2 emission. Results reveal that 1% increase in IQ contributes 29, 1.23, and 1.12% decrease in CO2 emission, respectively. According to these results, GB and CO2 emissions are negatively and insignificantly correlated with each other.
Quantile regression; SQR and PQR have been employed to confirm the robustness of the analyzed results. The evaluated findings of these results reveal that consumption of RE is negatively associated with climatic and environmental degradation. Results indicate that 1% increase in consumption of RE contributes 0.092%, 0.078%, -0.061 and 0.149% reduction in climatic and environmental degradation respectively from 25 to 95 quantile. On the contrary, findings of PQR indicate that a 1% increase in consumption of RE reduces 0.05% CO2 emission in the sample countries. Results of SQR indicate that EC consumption and environmental degradation are positively and significantly related to each other in sample countries with quantile 50. While PQR also reported similar results. These results indicate that EC consumption and environmental degradation are positively and significantly related with each other and contributes 0.98% climatic and environmental degradation in OECD countries.
The evaluated findings indicate that with quantile 75 EG and environmental degradation are positively and significantly correlated. It indicates that a 1% increase in EG becomes responsible for enhancing climatic and environmental degradation by about 0.119% in selected OECD countries. On the contrary, findings of PQR confirm that in sample countries, EG helps to reduce climatic and environmental degradation. Evaluated results demonstrate that use of high technologies for economic activities contributes in climatic and environmental degradation in developed countries. Results of IQ and GB demonstrate a negatively significant impact on climatic and environmental degradation. The study also confirms that IQ contributes in CO2 excretion reduction in selected OECD countries. Results of PQR (quantile regression) demonstrate that IQ and GB help to reduce climatic and environmental degradation.
According to the results of this study, consumption of EC for economic activities is the primary source of CO2 emission. A few OECD countries are attempting to protect EG by adopting a variety of energy resources to compete with the world’s developed countries, which is resulting in increased CO2 emissions and climatic and environmental degradation. The study findings call for formulating effective policies to encourage green financing for environmental upgradation. In order to address economic concerns and to achieve sustainable development goals, policymakers must introduce such policies that stimulate a sustainable climatic environment. To achieve the Sustainable Development Goals for cost-efficient and clean energy and water, and sanitation the OECD countries must enhance public-private partnerships in specialized energy projects for a sustainable environment. The use of fossil fuels for economic purposes has a positive effect on climatic and environmental degradation in several OECD countries. Policymakers in a number of OECD countries must stimulate investment in thermal, solar, and wind power. They must also enhance clean energy productivity and guarantee that everyone has access to clean energy in order to accomplish the SDGs by 2030. Policies that promote globalization, economic growth, institutional quality to support green infrastructure, and energy generation utilizing renewable energy sources are recommended. By expanding and upgrading infrastructure and technology-based energy resources, EG and a clean climate can be attained. A few OECD countries’ governments should support climate policies and regulations as well as give incentives for the investment to the investors and clean energy projects that will improve the environment. They are expected to promote strategic collaborations with other countries at different level to promote green innovations.
Statements
Data availability statement
Used data are publically available on the OECD Statistics website under https://stats.oecd.org/.
Author contributions
Globalization, Institutional Quality, Economic Growth, and CO2 Emission in OECD Countries: An analysis with GMM and quantile regression: NF Conceived and designed the analysis Collected the data Contributed data or analysis tools Performed the analysis Wrote the paper Other contribution: ZY Conceived and designed the analysis Collected the data Contributed data or analysis tools Performed the analysis Wrote the paper Other contribution: NG Conceived and designed the analysis Collected the data Contributed data or analysis tools Performed the analysis Wrote the paper Other contribution.
Conflict of interest
The authors declare that the research was conducted in the absence of any commercial or financial relationships that could be construed as a potential conflict of interest.
Publisher’s note
All claims expressed in this article are solely those of the authors and do not necessarily represent those of their affiliated organizations, or those of the publisher, the editors and the reviewers. Any product that may be evaluated in this article, or claim that may be made by its manufacturer, is not guaranteed or endorsed by the publisher.
References
1
AdedoyinF. F.GumedeM. I.BekunF. V.EtokakpanM. U.Balsalobre-lorenteD. (2020). Modelling coal rent, economic growth and CO2 excretions: does regulatory quality matter in BRICS economies?Sci. Total Environ.710, 136284. 10.1016/j.scitotenv.2019.136284
2
AkadiriS.AlolaA. A.AkadiriA. C.AlolaU. V. (2019). Renewable energy consumption in EU-28 countries: policy toward pollution mitigation and economic sustainability. Energy Policy132, 803–810.
3
AkifM.AsumaduS. (2019). Science of the total environment investigation of environmental Kuznets curve for ecological footprint: the role of energy and financial development. Sci. Total Environ.650, 2483–2489. 10.1016/j.scitotenv.2018.10.017
4
AkinloA. E. (2008). Energy consumption and economic growth: evidence from 11 sub-sahara African countries. Energy Econ.30 (5), 2391–2400. 10.1016/j.eneco.2008.01.008
5
Al-MulaliU.OzturkI. (2015). The effect of energy consumption, urbanization, trade openness, industrial output, and the political stability on the environmental degradation in the MENA (Middle East and North African) region. Energy84, 382–389. 10.1016/j.energy.2015.03.004
6
AliH. S.ZeqirajV.LinW. L.LawS. H.YusopZ.BareU. A. A.et al (2019). Does quality institutions promote climatic and environmental loss quality?Environ. Sci. Pollut. Res.26 (11), 10446–10456. 10.1007/s11356-019-04670-9
7
AnwarA.YounisM.UllahI. (2020). Impact of urbanization and economic growth on CO2 emission: a case of far east Asian countries. Int. J. Environ. Res. Public Health17 (7), 2531. 10.3390/ijerph17072531
8
ArellanoM.BondS. (1991). Some tests of specification for panel data: monte Carlo evidence and an application to employment equations. Rev. Econ. Stud.58 (2), 277. 10.2307/2297968
9
AsonguS. A.AgboolaM. O.AlolaA. A.BekunF. V. (2020). The criticality of growth, urbanization, electricity and fossil fuel consumption to environment sustainability in Africa. Sci. Total Environ.712, 136376. 10.1016/j.scitotenv.2019.136376
10
AsonguS. A.OdhiamboN. M. (2019). Inclusive development in environmental sustainability in sub-saharan Africa: insights from governance mechanisms. Sustain. Dev.27 (4), 713–724. 10.1002/sd.1936
11
AwodumiO. B.AdewuyiA. O. (2020). The role of non-renewable energy consumption in economic growth and carbon emission: evidence from oil producing economies in Africa. Energy Strategy Rev.27, 100434. 10.1016/j.esr.2019.100434
12
BaiardiD.MoranaC. (2021). Climate change awareness: empirical evidence for the European Union. Energy Econ.96, 105163. 10.1016/j.eneco.2021.105163
13
BaltagiB. H. (2005). Forecasting with panel data. J. forecast.27 (2), 153–173.
14
Balsalobre-LorenteD.DrihaO. M.BekunF. V.OsundinaO. A. (2019). Do agricultural activities induce carbon excretions? The BRICS experience. Clim. Environ. Loss Sci. Pollut. Res.26 (24), 25218–25234. 10.1007/s11356-019-05737-3
15
BashirM. J. K.NgC. A.SethupathiS.LimJ. W. (2019). “Assessment of the environmental, technical and economic issues associated with energy recovery from municipal solid waste in Malaysia,” in IOP Conference Series: Earth and Environmental Science268 (1), 012044 (IOP Publishing).
16
BentoJ. P. C.MoutinhoV. (2016). CO2 excretions, non-renewable and renewable electricity production, economic growth, and international trade in Italy. Renew. Sustain. Energy Rev.55, 142–155. 10.1016/j.rser.2015.10.151
17
BhattacharyaM.ChurchillS. A.ParamatiS. R. (2017). The dynamic impact of renewable energy and institutions on economic output and CO2 excretions across regions. Renew. Energy111, 157–167. 10.1016/j.renene.2017.03.102
18
ChenX.QuanQ.ZhangK.WeiJ. (2021a). Spatiotemporal characteristics and attribution of dry/wet conditions in the Weihe River Basin within a typical monsoon transition zone of East Asia over the recent 547 years. Environ. Model. Softw.143, 105116. 10.1016/j.envsoft.2021.105116
19
ChenY.KumaraE. K.SivakumarV. (2021b). Investigation of Finance industry on risk awareness model and digital economic growth. Ann. Oper. Res. 10.1007/s10479-021-04287-7
20
ChiuC. L.ChangT. H. (2009). What proportion of renewable energy supplies is needed to initially mitigate CO2 excretions in Selected OECD member countries?Renew. Sustain. Energy Rev.13 (6-7), 1669–1674. 10.1016/j.rser.2008.09.026
21
CowanW. N.ChangT.Inglesi-LotzR.GuptaR. (2014). The nexus of electricity consumption, economic growth and CO2 emissions in the BRICS countries. Energy Policy66, 359–368. 10.1016/j.enpol.2013.10.081
22
DestekM. A.AslanA. (2020). Disaggregated renewable energy consumption and environmental pollution nexus in G-7 countries. Renew. Energy151, 1298–1306. 10.1016/j.renene.2019.11.138
23
DoganE.SekerF. (2016). Determinants of CO2 emissions in the European Union: The role of renewable and non-renewable energy. Renew. Energy94, 429–439. 10.1016/j.renene.2016.03.078
24
DreherA. (2006). Does globalization affect growth? Evidence from a new index of globalization. Appl. Econ.38 (10), 1091–1110. 10.1080/00036840500392078
25
EyubogluK.UzarU. (2020). The impact of tourism on CO2 emission in Turkey. Curr. Issues Tour.23 (13), 1631–1645. 10.1080/13683500.2019.1636006
26
GodilD. I.SharifA.AghaH.JermsittiparsertK. (2020). The dynamic nonlinear influence of ICT, financial development, and institutional quality on CO2 emission in Pakistan: new insights from QARDL approach. Environ. Sci. Pollut. Res.27 (19), 24190–24200. 10.1007/s11356-020-08619-1
27
HafsaouiN. E. H.KhalloutA.AmiroucheB. (2019). Financial development and economic growth nexus: Evidence from Algeria lien entre développement financier et croissance économique: témoignages de l'Algérie. Finance Bus. Econ. Rev.3 (3), 814–844.
28
HamdiH.SbiaR.ShahbazM. (2014). The nexus between electricity consumption and economic growth in Bahrain. Econ. Model.38, 227–237. 10.1016/j.econmod.2013.12.012
29
HarrisR. D.TzavalisE. (1999). Inference for unit roots in dynamic panels where the time dimension is fixed. J. Econ.91 (2), 201–226. 10.1016/s0304-4076(98)00076-1
30
HassanS. T.BalochM. A.MahmoodN.ZhangJ. (2019). Linking economic growth and ecological footprint through human capital and biocapacity. Sustain. Cities Soc.47, 101516.
31
HayashiF. (2011). Econometrics. Princeton University Press.
32
HdomH. A. (2019). Examining carbon dioxide emissions, fossil & renewable electricity generation and economic growth: Evidence from a panel of South American countries. Renew. Energy139, 186–197. 10.1016/j.renene.2019.02.062
33
IbrahimM. H.LawS. H. (2014). Social capital and CO2 emission—output relations: a panel analysis. Renew. Sustain. Energy Rev.29, 528–534. 10.1016/j.rser.2013.08.076
34
JebliM. B.YoussefS. B.OzturkI. (2016). Testing climatic and environmental loss Kuznets curve hypothesis: the role of renewable and non-renewable energy consumption and trade in Selected OECD countries. Ecol. Indic.60, 824–831. 10.1016/j.ecolind.2015.08.031
35
KabirM.SalimR. (2019). Valuation of subsoil minerals in Bangladesh: an application of the system of environmental-economic accounting. Resour. Policy62, 193–204. 10.1016/j.resourpol.2019.03.020
36
KaoC. (1999). Spurious regression and residual-based tests for cointegration in panel data. J. econom.90 (1), 1–44.
37
KhanI.HouF. (2021). The impact of socio-economic and environmental sustainability on CO2 emissions: a novel framework for thirty IEA countries. Soc. Indic. Res.155 (3), 1045–1076. 10.1007/s11205-021-02629-3
38
KhanM. A.KongD.XiangJ.ZhangJ. (2019). Impact of institutional quality on financial development: cross-country evidence based on emerging and growth-leading economies. Emerg. Mark. Finance Trade56, 3829–3845. 10.1080/1540496x.2019.1588725
39
KhanM. K.KhanM. I.RehanM. (2020). The relationship between energy consumption, economic growth and carbon dioxide emissions in Pakistan. Financ. Innov.6 (1), 1. 10.1186/s40854-019-0162-0
40
KhanM. K.TengJ. Z.KhanM. I. (2019b). Effect of energy consumption and economic growth on carbon dioxide emissions in Pakistan with dynamic ARDL simulations approach. Environ. Sci. Pollut. Res.26 (23), 23480–23490. 10.1007/s11356-019-05640-x
41
KhanM. K.TengJ. Z.KhanM. I.KhanM. O. (2019a). Impact of globalization, economic factors and energy consumption on CO2 emissions in Pakistan. Sci. Total Environ.688, 424–436. 10.1016/j.scitotenv.2019.06.065
42
KhanN. H.JuY.HassanS. T. (2018). Modeling the impact of economic growth and terrorism on the human development index: collecting evidence from Pakistan. Environ. Sci. Pollut. Res.25 (34), 34661–34673. 10.1007/s11356-018-3275-5
43
KomalR.AbbasF. (2015). Linking financial development, economic growth and energy consumption in Pakistan. Renew. Sustain. Energy Rev.44, 211–220. 10.1016/j.rser.2014.12.015
44
KripfganzS.SchwarzC. (2019). Estimation of linear dynamic panel data models with time–invariant regressors. J. Appl. Econom.34 (4), 526–546.
45
LauL. S.ChoongC. K.EngY. K. (2014). Carbon dioxide emission, institutional quality, and economic growth: Empirical evidence in Malaysia. Renew. Energy68, 276–281. 10.1016/j.renene.2014.02.013
46
LeiX. T.XuQ. Y.JinC. Z. (2021). Nature of property right and the motives for holding cash: empirical evidence from Chinese listed companies. MDE. Manage. Decis. Econ.43, 1482–1500. 10.1002/mde.3469
47
LevinA.LinC. F.ChuC. S. J. (2002). Unit root tests in panel data: asymptotic and finite-sample properties. J. Econ.108 (1), 1–24. 10.1016/s0304-4076(01)00098-7
48
LiddleB.SadorskyP. (2017). How much does increasing non-fossil fuels in electricity generation reduce carbon dioxide excretions?Appl. Energy197, 212–221. 10.1016/j.apenergy.2017.04.025
49
LiuM.RenX.ChengC.WangZ. (2020). The role of globalization in CO2 emissions: a semi-parametric panel data analysis for G7. Sci. Total Environ.718, 137379. 10.1016/j.scitotenv.2020.137379
50
LiuS.LiuY.WangC.DangX. (2022a). The distribution characteristics and human health risks of high- fluorine groundwater in coastal plain: a case study in southern laizhou bay, China. Front. Environ. Sci.10, 901637. 10.3389/fenvs.2022.901637
51
LiuX.ZhangS.BaeJ. (2017). The impact of renewable energy and agriculture on carbon dioxide emissions: investigating the environmental Kuznets curve in four selected ASEAN countries. J. Clean. Prod.164, 1239–1247. 10.1016/j.jclepro.2017.07.086
52
LiuY.TianJ.ZhengW.YinL. (2022b). Spatial and temporal distribution characteristics of haze and pollution particles in China based on spatial statistics. Urban Clim.41, 101031. 10.1016/j.uclim.2021.101031
53
MuhammadB.KhanM. K.KhanM. I.KhanS. (2021). Impact of foreign direct investment, natural resources, renewable energy consumption, and economic growth on climatic and environmental loss: evidence from BRICS, developing, developed and global countries. Clim. Environ. loss Sci. Pollut. Res.28 (17), 21789–21798. 10.1007/s11356-020-12084-1
54
MunirK.RiazN. (2020). Asymmetric impact of energy consumption on climatic and environmental loss: evidence from Australia, China, and USA. Environ. Sci. Pollut. Res. Int.27 (11), 11749–11759. 10.1007/s11356-020-07777-6
55
MunirQ.LeanH. H.SmythR. (2020). CO2 emissions, energy consumption and economic growth in the ASEAN-5 countries: a cross-sectional dependence approach. Energy Econ.85, 104571. 10.1016/j.eneco.2019.104571
56
NazS.SultanR.ZamanK.AldakhilA. M.NassaniA. A.AbroM. M. Q.et al (2019). Moderating and mediating role of renewable energy consumption, FDI inflows, and economic growth on carbon dioxide emissions: evidence from robust least square estimator. Environ. Sci. Pollut. Res.26 (3), 2806–2819. 10.1007/s11356-018-3837-6
57
NeaguO.TeodoruM. C. (2019). The relationship between economic complexity, energy consumption structure and greenhouse gas emission: Heterogeneous panel evidence from the EU countries. Sustainability11 (2), 497.
58
OECD (2022). Air and GHG emissions (indicator) (Accessed July 22, 2022). 10.1787/93d10cf7-en
59
ObobisaE. S.ChenH.MensahI. A. (2022). The impact of green technological innovation and institutional quality on CO2 emissions in African countries. Technol. Forecast. Soc. Change180, 121670. 10.1016/j.techfore.2022.121670
60
ParamatiS. R.MoD.GuptaR. (2017). The effects of stock market growth and renewable energy use on CO2 emissions: evidence from G20 countries. Energy Econ.66, 360–371. 10.1016/j.eneco.2017.06.025
61
ParkY.MengF.BalochM. A. (2018). The effect of ICT, financial development, growth, and trade openness on CO2 emissions: an empirical analysis. Environ. Sci. Pollut. Res.25 (30), 30708–30719. 10.1007/s11356-018-3108-6
62
PedroniP. (1999). Critical values for cointegration tests in heterogeneous panels with multiple regressors. Oxf. Bull. Econ. Stat.61 (S1), 653–670. 10.1111/1468-0084.61.s1.14
63
PedroniP. (2004). Panel cointegration: asymptotic and finite sample properties of pooled time series tests with an application to the PPP hypothesis. Econ. Theory20 (3), 597–625. 10.1017/s0266466604203073
64
PesaranM. H. (2004). General diagnostic tests for cross section dependence in panels. University of Cambridge, Faculty of Economics. Cambridge Working Papers in Economics No. 0435.
65
PiłatowskaM.GeiseA.WłodarczykA. (2020). The effect of renewable and nuclear energy consumption on decoupling economic growth from CO2 emissions in Spain. Energies13 (9), 2124. 10.3390/en13092124
66
QinY.XiB.SunX.ZhangH.XuC.WuB.et al (2022). Methane emission reduction and biological characteristics of landfill cover soil amended with hydrophobic biochar. Front. Bioeng. Biotechnol.10, 905466. 10.3389/fbioe.2022.905466
67
QuanQ.GaoS.ShangY.WangB. (2021). Assessment of the sustainability of Gymnocypris eckloni habitat under river damming in the source region of the Yellow River. Sci. Total Environ.778, 146312. 10.1016/j.scitotenv.2021.146312
68
QuanQ.LiangW.YanD.LeiJ. (2022). Influences of joint action of natural and social factors on atmospheric process of hydrological cycle in Inner Mongolia, China. Urban Clim.41, 101043. 10.1016/j.uclim.2021.101043
69
RehmanA.ChandioA. A.HussainI.JingdongL. (2019). Fertilizer consumption, water availability and credit distribution: Major factors affecting agricultural productivity in Pakistan. J. Saudi Soc. Agric. Sci.18 (3), 269–274.
70
RidhosariB.RahmanA. (2020). Carbon footprint assessment at Universitas Pertamina from the scope of electricity, transportation, and waste generation: Toward a green campus and promotion of environmental sustainability. J. Clean. Prod.246, 119172. 10.1016/j.jclepro.2019.119172
71
RitiJ. S.ShuY.SongD.KamahM. (2017a). The contribution of energy use and financial development by source in climate change mitigation process: a global empirical perspective. J. Clean. Prod.148, 882–894. 10.1016/j.jclepro.2017.02.037
72
RitiJ. S.SongD.ShuY.KamahM. (2017b). Decoupling CO2 emission and economic growth in China: is there consistency in estimation results in analyzing environmental Kuznets curve?J. Clean. Prod.166, 1448–1461. 10.1016/j.jclepro.2017.08.117
73
SalahuddinM.AlamK.OzturkI.SohagK. (2018). The effects of electricity consumption, economic growth, financial development and foreign direct investment on CO2 emissions in Kuwait. Renew. Sustain. Energy Rev.81, 2002–2010. 10.1016/j.rser.2017.06.009
74
SalmanM.LongX.DaudaL.MensahC. N. (2019). The impact of institutional quality on economic growth and carbon emissions: evidence from Indonesia, South Korea and Thailand. J. Clean. Prod.241, 118331. 10.1016/j.jclepro.2019.118331
75
SarkodieS. A.AdamsS.LeirvikT. (2020a). Foreign direct investment and renewable energy in climate change mitigation: does governance matter?J. Clean. Prod.263, 121262. 10.1016/j.jclepro.2020.121262
76
SarkodieS. A.AdamsS.OwusuP. A.LeirvikT.OzturkI. (2020b). Mitigating degradation and emissions in China: the role of environmental sustainability, human capital and renewable energy. Sci. Total Environ.719, 137530. 10.1016/j.scitotenv.2020.137530
77
SaudS.ChenS.HaseebA.Sumayya (2020). The role of financial development and globalization in the environment: accounting ecological footprint indicators for selected one-belt-one-road initiative countries. J. Clean. Prod.250, 119518. 10.1016/j.jclepro.2019.119518
78
ShafieiS.SalimR. A. (2014). Non-renewable and renewable energy consumption and CO2 emissions in OECD countries: a comparative analysis. Energy policy66, 547–556.
79
ShahbazM.Balsalobre-LorenteD.SinhaA. (2019). Foreign direct Investment–CO2 emissions nexus in Middle East and North African countries: importance of biomass energy consumption. J. Clean. Prod.217, 603–614. 10.1016/j.jclepro.2019.01.282
80
ShahbazM.KhanS.AliA.BhattacharyaM. (2017). The impact of globalization on CO2 excretions in China. Singap. Econ. Rev.62 (04), 929–957. 10.1142/s0217590817400331
81
ShangK.ChenZ.LiuZ.SongL.ZhengW.YangB.et al (2021). Haze prediction model using deep recurrent neural network. Atmosphere12 (12), 1625. 10.3390/atmos12121625
82
ShenX.LiuB.HendersonM.WangL.JiangM.LuX. (2022a). Vegetation greening, extended growing seasons, and temperature feedbacks in warming temperate grasslands of China. J. Clim.35, 5103–5117. 10.1175/JCLI-D-21-0325.1
83
ShenX.LiuY.LiuB.ZhangJ.WangL.LuX.et al (2022b). Effect of shrub encroachment on land surface temperature in semi-arid areas of temperate regions of the Northern Hemisphere. Agric. For. Meteorology320, 108943. 10.1016/j.agrformet.2022.108943
84
SherazM.DeyiX.AhmedJ.UllahS.UllahA. (2021). Moderating the effect of globalization on financial development, energy consumption, human capital, and carbon emissions: evidence from G20 countries. Environ. Sci. Pollut. Res.28 (26), 35126–35144.
85
SherazM.DeyiX.MumtazM. Z.UllahA. (2022a). Exploring the dynamic relationship between financial development, renewable energy, and carbon emissions: a new evidence from belt and road countries. Environ. Sci. Pollut. Res.29 (10), 14930–14947. 10.1007/s11356-021-16641-0
86
SherazM.DeyiX.SinhaA.MumtazM. Z.FatimaN. (2022b). The dynamic nexus among financial development, renewable energy and carbon emissions: moderating roles of globalization and institutional quality across BRI countries. J. Clean. Prod.343, 130995. 10.1016/j.jclepro.2022.130995
87
TamazianA.RaoB. B. (2010). Do economic, financial and institutional developments matter for climatic and environmental loss loss? Evidence from transitional economies. Energy Econ.32 (1), 137–145. 10.1016/j.eneco.2009.04.004
88
TengJ. Z.KhanM. K.KhanM. I.ChishtiM. Z.KhanM. O. (2020). Effect of foreign direct investment on CO 2 excretion with the role of globalization, institutional quality with pooled mean group panel ARDL. Clim. Environ. Loss Sci. Pollut. Res.28, 1–12. 10.1007/s11356-020-10823-y
89
TwerefouD. K.Danso-MensahK.BokpinG. A. (2017). The climatic and environmental loss effects of economic growth and globalization in sub-saharan africa: a panel general method of moments approach. Res. Int. Bus. Finance42, 939–949. 10.1016/j.ribaf.2017.07.028
90
UsmanA.UllahS.OzturkI.ChishtiM. Z.ZafarS. M. (2020). Analysis of asymmetries in the nexus among clean energy and climatic and environmental loss quality in Pakistan. Clim. Environ. Loss Sci. Pollut. Res.27, 1–12. 10.1007/s11356-020-08372-5
91
WangH.LuoQ. (2022). Can a colonial legacy explain the pollution haven hypothesis? A city-level panel analysis. Struct. Change Econ. Dyn.60, 482–495. 10.1016/j.strueco.2022.01.004
92
WangQ.LinJ.ZhouK.FanJ.KwanM. P. (2020). Does urbanization lead to less residential energy consumption? A comparative study of 136 countries. Energy202, 117765. 10.1016/j.energy.2020.117765
93
WangZ.AsgharM. M.ZaidiS. A. H.NawazK.WangB.ZhaoW.et al (2020). The dynamic relationship between economic growth and life expectancy: contradictory role of energy consumption and financial development in Pakistan. Struct. Change Econ. Dyn.53, 257–266. 10.1016/j.strueco.2020.03.004
94
WesterlundJ. (2005). New simple tests for panel cointegration. Econom. Rev.24 (3), 297–316.
95
WuY.ZhuW. (2021). The role of CSR engagement in customer-company identification and behavioral intention during the COVID-19 pandemic. Front. Psychol.12, 721410. 10.3389/fpsyg.2021.721410
96
XuB.ZhongR.QiaoH. (2020). The impact of biofuel consumption on CO2 emissions: a panel data analysis for seven selected G20 countries. Energy Environ.31 (8), 1498–1514. 10.1177/0958305x20915426
97
YinL.WangL.HuangW.TianJ.LiuS.YangB.et al (2022). Haze grading using the convolutional neural networks. Atmosphere13 (4), 522. 10.3390/atmos13040522
98
YooS. H. (2006). The causal relationship between electricity consumption and economic growth in the ASEAN countries. Energy Policy34 (18), 3573–3582. 10.1016/j.enpol.2005.07.011
99
ZaidiS. A. H.ZafarM. W.ShahbazM.HouF. (2019). Dynamic linkages between globalization, financial development and carbon emissions: Evidence from Asia Pacific economic cooperation countries. J. Clean. Prod.228, 533–543.
100
ZiaeiS. M. (2015). Effects of financial development indicators on energy consumption and CO2 emission of European, East Asian and Oceania countries. Renew. Sustain. Energy Rev.42, 752–759. 10.1016/j.rser.2014.10.085
Appendix
TABLE A1
| Austria | Hungary | New Zealand |
| Australia | Italy | Netherland |
| Belgium | Iceland | Portugal |
| Chile | Ireland | Poland |
| Czech Republic | Israel | Swedenf |
| Canada | Japan | Slovak Republic |
| Denmark | Korea | Spain |
| Estonia | Lithuania | Switzerland |
| France | Luxembourg | Slovenia |
| Finland | Latvia | Turkey |
| Greece | Mexico | United States |
| Germany | Norway | United Kingdom |
List of countries.
Summary
Keywords
economic growth, institutional quality, globalization, renewable energy consumption, quantile regression
Citation
Fatima N, Zheng Y and Guohua N (2022) Globalization, institutional quality, economic growth and CO2 emission in OECD countries: An analysis with GMM and quantile regression. Front. Environ. Sci. 10:967050. doi: 10.3389/fenvs.2022.967050
Received
12 June 2022
Accepted
05 July 2022
Published
15 August 2022
Volume
10 - 2022
Edited by
Vishal Dagar, Great Lakes Institute of Management, India
Reviewed by
Muhammad Sibt E. Ali, Zhengzhou University, China
Muhammad Owais Khan, University of Agriculture, Pakistan
Updates
Copyright
© 2022 Fatima, Zheng and Guohua.
This is an open-access article distributed under the terms of the Creative Commons Attribution License (CC BY). The use, distribution or reproduction in other forums is permitted, provided the original author(s) and the copyright owner(s) are credited and that the original publication in this journal is cited, in accordance with accepted academic practice. No use, distribution or reproduction is permitted which does not comply with these terms.
*Correspondence: Nudrat Fatima, nudratfatima91@gmail.com
This article was submitted to Environmental Economics and Management, a section of the journal Frontiers in Environmental Science
Disclaimer
All claims expressed in this article are solely those of the authors and do not necessarily represent those of their affiliated organizations, or those of the publisher, the editors and the reviewers. Any product that may be evaluated in this article or claim that may be made by its manufacturer is not guaranteed or endorsed by the publisher.