 Yunfeng Zhang
 Ying Qin*
- School of Economics and Management, Anhui Polytechnic University, Wuhu, China
With the rapid growth in carbon emissions from transport, reducing these emissions is becoming as important as reducing emissions from production. We took a transporter as a member of the supply chain system and constructed a three-echelon supply chain composed of a manufacturer, transporter, and retailer. This study applies the Stackelberg game and Nash game to research the optimal carbon emission reductions, pricing, and social welfare when the government imposes a carbon tax on carbon emitters and consumers are environmentally conscious. The four scenarios were designed as follows: 1) non-cooperative decision-making (NN model), in which neither carbon emission reduction cooperation nor pricing cooperation takes place; 2) local-cooperative decision-making Ⅰ (CN model), in which only cooperation in the field of carbon emission reductions takes place; 3) local-cooperative decision-making Ⅱ (NC model), in which cooperation in the field of pricing without cooperation in the area of carbon emission reductions takes place; and 4) overall-cooperative decision-making (CC model), in which both cooperation in the field of carbon emission reductions and cooperation in the area of pricing take place. The results show that economic (as profit of the supply chain system), social (as pricing and social welfare), and environmental benefits (as the optimal carbon emission reductions) for the three-echelon supply chain will improve with the deepening of cooperation among the supply chain members. Carbon tax policies have different impacts on clean and polluting supply chains. High carbon tax can encourage clean supply chain to increase carbon emission reduction, but will lead to the reduction of carbon emission of polluting supply chain. A cross-shareholding contract is designed to coordinate the supply chain and achieve the optimal state of the overall cooperative decision. Finally, the paper provides suggestions on carbon emission reductions for enterprises and policymaking for the government.
Introduction
Recently, the rapid development of manufacturing and transportation has driven economic development and led to the frequent occurrence of multiple environmental problems, such as sea level rise, drought, and floods (Qiao et al., 2019). Among the different industrial sectors, manufacturing tends to be the major contributor to energy consumption and carbon emissions (Luo et al., 2016). Research has shown that manufacturing accounts for 29% of the total direct CO2 emissions from the industrial sector (Jin et al., 2017). In addition, as the second largest global CO2 industry, logistics and transportation mainly use fuel as the main power source, and the high demand for fuel also results in significant carbon emissions (Solaymani, 2019; Salvi and Subramanian, 2015). According to the European Environment Agency, logistics accounted for 27% of greenhouse gas emissions in the 28-nation European Union in 2016 (Kellner, 2020). To control energy consumption and carbon emissions in manufacturing, production, logistics, and transportation, accelerating the construction of low-carbon production and transportation is a serious challenge for the international community.
As the high carbon emission levels of the manufacturing and transportation industry have attracted global attention to low-carbon production and transportation, numerous countries have adopted carbon emission reduction policies and actively responded to the international community. Among these policies, the carbon tax policy is an environmental tax that charges the carbon emissions generated in the production and processing of products. It can effectively reduce greenhouse gas generation and fossil fuel consumption, and has been widely used worldwide (Zhou et al., 2018b). Therefore, it is of practical significance and research value to discuss the impact of carbon tax policy on the economic and environmental benefits of supply chain members. Under the pressure of the government’s carbon tax policy, an increasing number of manufacturing enterprises are using technological innovation to explore the space of energy conservation and emission reduction and promote the economic transition to green. For example, China’s Gree Electric Appliances has developed “zero-carbon source” air conditioning technology, which can reduce carbon emissions by 85.7% (Zou et al., 2021). The Haier water heater adopts waste heat recovery technology, which can recycle the heat in the wastewater following a shower, achieving energy savings of 25% (Qu et al., 2021). As an effective carbon emission reduction tool, carbon tax policy can effectively reduce carbon emissions and has a small negative impact on economic growth (Yang & Chen, 2018).
Manufacturing has made a breakthrough in carbon emission reductions, and the government and enterprises have made significant efforts to reduce carbon emissions in the transport industry. For example, the new European Transport White Paper set targets for the transport sector as a whole to cut the 1990 emissions levels by 60% by 2050, and the 2008 levels by 20% by 2030 (Liimatainen and Pöllänen, 2013). Under the guidance of the government’s low-carbon policy, enterprises are shifting from fossil fuels to new or renewable energy sources to reduce carbon emissions at the source (Fouquet, 2010). For example, Rolls-Royce, a manufacturer of commercial aircraft engines, will test its next-generation aero-engine using 100% sustainable aviation fuel, which significantly reduces CO2 emissions by more than 75%. In addition, automakers such as General Motors and Ford Motors are more focused on finding clean energy to replace internal combustion engines and reduce carbon emissions (Zhang et al., 2020). Although the contribution of logistics to global emissions reduction is well known, its impact on supply chain emissions and corporate profits has received little attention.
At present, the literature on supply chain operation optimization under a carbon tax policy mainly focuses on pricing decisions, low-carbon product production, supply chain coordination, and other aspects (Zhou et al. 2018a; Meng et al. 2018; Yang et al. 2017a). However, the role of transport in carbon abatement has been ignored. Based on this situation, this study introduced the transporter into the supply chain and constructed a three-echelon supply chain composed of a manufacturer, transporter, and retailer. The study also explored the influence of cooperation between supply chain member enterprises in different fields on supply chain decision making under a carbon tax policy. From the above considerations, this study mainly focused on the following issues: 1) How do changes in the carbon tax rate affect optimal carbon emission reduction decisions with the participation of the transporter? 2) What are the effects of different modes of cooperation among supply chain members on optimal supply chain decision-making? 3) Can cross-shareholding contracts effectively coordinate supply chains? If yes, how do cross-shareholding contracts affect the decisions and profits of supply chain members?
To explore the above issues, we construct new cooperation modes among supply chain members (carbon emission reduction cooperation and pricing cooperation), and considered four scenarios according to the degree of cooperation among supply chain members as follows: 1) the non-cooperative decision-making (NN model), in which neither the carbon emission reductions cooperation nor the pricing cooperation takes place; 2) the local-cooperative decision-making Ⅰ (CN model), in which only cooperation in the field of the carbon emission reductions takes place; 3) the local-cooperative decision-making Ⅱ (NC model), in which cooperation in the field of the pricing without cooperation in the area of the carbon emission reductions takes place; 4) the overall-cooperative decision-making (CC model), in which both cooperation in the field of the carbon emission reductions and cooperation in the area of the pricing take place. The optimal carbon emission reduction, pricing, profit, and social welfare of the supply chain under the four scenarios were obtained and compared. Different from previous research results, the level of carbon tax rate should be set according to the initial carbon emissions of the supply chain. Secondly, with the deepening of cooperation among supply chain members, the economic indicators of the three-level supply chain will be improved. Finally, cross-shareholding contract can not only coordinate the supply chain, but also achieve perfect coordination of the supply chain.
The remainder of this paper is organized as follows. Section 2 presents a review of the relevant literature. Section 3 presents a description and assumptions of the model. In Section 4, the model is established and the equilibrium solutions are obtained. In Section 5, the equilibrium solutions for four scenarios are compared. Section 6 presents the design of a cross-shareholding contract to coordinate a three-echelon supply chain. Section 7 presents a sensitivity analysis of the key supply chain parameters. In Section 8, we summarize our main conclusions and provide management insights.
Literature review
Carbon emission reductions under carbon tax policy
Domestic and foreign research on carbon emission reductions under a carbon tax policy has achieved abundant results. Drake et al. (2016) proved that carbon tax policy can improve the investment level of enterprises in emission reduction and is always beneficial to the environment. By establishing a three-party evolutionary game model, Sheng and Webber (2017) found that different types of carbon tax policies can produce different environmental benefits. Wang and Wang (2021) discussed the impact of differentiated carbon taxes on economic and environmental benefits, and their results showed that a higher base carbon tax rate would improve the investment level of emission reduction, which is always beneficial to the environment. Zhang et al. (2021a) proposed a two-channel model using a carbon tax system. They believed that the government could appropriately set the critical value of the carbon tax to guide manufacturing enterprises to improve their carbon emission reduction levels. Zhang et al. (2021b) found that the carbon tax rate can positively affect manufacturers’ green products; therefore, the carbon tax mechanism can effectively guide enterprises to achieve carbon emission reductions. Chen and Hao (2015) compared two manufacturers with different emission reduction efficiency under carbon tax policy, and found that the carbon tax levied on high-efficiency enterprises should be larger than that levied on low-efficiency enterprises. Sun et al. (2021) optimized the original tax scheme by establishing an equilibrium model to reduce carbon emissions and achieve a win-win situation of economic and environmental benefits. Rustico and Dimitrov (2022) suggested incentivizing companies to create a cleaner environment by establishing a tax policy that maximizes social welfare. By establishing a game model consisting of local governments and enterprises, Deng et al. (2021) found that carbon tax policy can encourage enterprises to innovate in green technology and impact government governance of the environment. Luo et al. (2022) studied the closed-loop supply chain under carbon tax policy. The results also showed that carbon taxes can effectively encourage manufacturers to invest in carbon reduction technologies or remanufacturing to reduce carbon emissions. Yu et al. (2020) discussed the influence of carbon tax policy on single- and double-chain systems. They suggested that when the distribution of the power structure in the supply chain is feasible, the government should reduce the carbon tax to promote supply chain emission reductions.
Carbon emission reductions through supply chain cooperation
Another type of literature in this study concerns the impact of supply chain cooperation on carbon emission reductions. Yang et al. (2017b) proved that vertical cooperation among supply chain members is conducive to improving carbon emission reduction rate and reducing retail price. Liu et al. (2021) found that cooperation among supply chain members can improve and motivate the investment of channel members in emission reduction and promotion, which is beneficial to the economic profits and social benefits of members. Zhang and Yu (2021) studied the cooperative emission reduction problem of a dual-channel supply chain and found that the equilibrium strategy under centralized decisions is superior to that under decentralized decisions. Li et al. (2019) explored the impact of different modes of cooperation of supply chain members on carbon emission reduction by establishing four cooperative and non-cooperative game structures. The results show that pricing and carbon emission reduction decisions are optimal under a two-way cooperative structure of cooperative promotion and carbon emission reduction. Zhang and Liu (2013) proposed that under cooperative decision-making, supply chain members would make more emission reduction efforts and obtain more economic profits. Wang et al. (2021) suggested that compared with the non-cooperative situation, supply chain members will make more emission reduction efforts and gain more economic profits in a cooperative situation. By constructing a three-echelon supply chain and applying a differential game model, Chen et al. (2022) found that product emission reduction in the cooperative mode is higher than that in the non-cooperative mode. Cooperative emission reduction is better for the supply chain to achieve its carbon reduction targets.
In summary, cooperation by supply chain members has a positive impact on carbon emission reduction and economic benefits. To promote cooperation among supply chain members to be implemented in practice, certain scholars deepened cooperation among supply chain members through coordination contracts. Wang et al. (2022a) conducted a comparative analysis of the optimal equilibrium decision without cost sharing and with cost sharing, and the results showed that in the cost-sharing scenario, manufacturers’ emission reduction levels and supply chain participants’ profits were both improved, thus making members reach a consensus on cost-sharing cooperation. Heydari et al. (2020) showed that cost-sharing and revenue-sharing contracts can effectively coordinate supply chains, not only enabling supply chain members to gain more profits but also making the environment cleaner. Ghosh and Shah (2015) discussed the impact of supply chain participants’ adoption of cost-sharing contracts on product greening level, price and profit. Wang et al. (2020) also believe that the joint emission reduction model is the optimal choice of supply chain and considers the influence of one- and two-way cost allocation contracts on the optimal strategy. Xu et al. (2018) studied and discussed the influence of centralization and decentralization on optimal decision making and proposed two types of price discount contracts to coordinate the supply chain.
Carbon emission reductions and consumer environmental awareness
The final category of literature related to this study concerns consumer environmental awareness. Domestic and foreign scholars have focused on two aspects of consumer environmental awareness: business strategy and consumer behavior. Kotchen (2005) proposed that consumers’ preference for low-carbon products could guide their pro-environment behaviors. Du et al. (2015) discussed the influence of consumers’ low-carbon preferences on enterprises’ production and operation decisions. When consumers have low carbon preference, consumers’ low carbon consumption preference increases channel profit and emission reduction effect simultaneously. Wang et al. (2022b) discussed the choice of manufacturers to produce low-carbon or ordinary products under the influence of consumers’ low-carbon preferences. When consumers have low-carbon preferences, manufacturers choose to produce low-carbon products with better economic and environmental benefits than that of ordinary products. Yang and Chen (2018) believed that manufacturers would invest in emission reduction as long as consumer environmental awareness or carbon taxes existed. Yang et al. (2022) found that when consumer environmental awareness is enhanced, manufacturers with lower carbon emissions would choose to expand production. Cheng et al. (2021) explored the influence of low- and high-emission manufacturers on optimal equilibrium decision-making in a closed-loop supply chain. They found that an improvement in consumer environmental awareness can increase the trade volume of low-emission manufacturers. Xue et al. (2022) believed that the higher the level of consumers’ low-carbon awareness is, the more effective it is to motivate enterprises to reduce carbon emission. In addition, the impact of consumers’ environmental awareness on their behavior has attracted academic attention. Ahmed et al. (2020) showed that consumers’ higher environmental awareness has a mediating and moderating effect on purchasing green products. Through investigation and research, Royne et al. (2011) found that consumers who pay special attention to environmental protection are more likely to spend more money on environmentally friendly products.
After reviewing the literature, we found that research on corporate carbon emission reduction under the carbon tax policy mainly focuses on the two-echelon supply chain composed of manufacturers and retailers, and rarely involves carbon emission reductions in the transportation process. Therefore, this study places transport emissions into the supply chain system and constructs a three-echelon supply chain composed of a manufacturer, transporter, and retailer. We discuss the effects of different cooperative relationships among supply chain members on carbon emission reductions under varying carbon tax policies and consumer environmental awareness levels. Our research results are expected to provide a reference for government carbon reduction policies and enterprises to ensure optimal operational decision making. Table 1 also summarizes the main differences between these models developed in three streams of research mentioned above and that developed in this study.
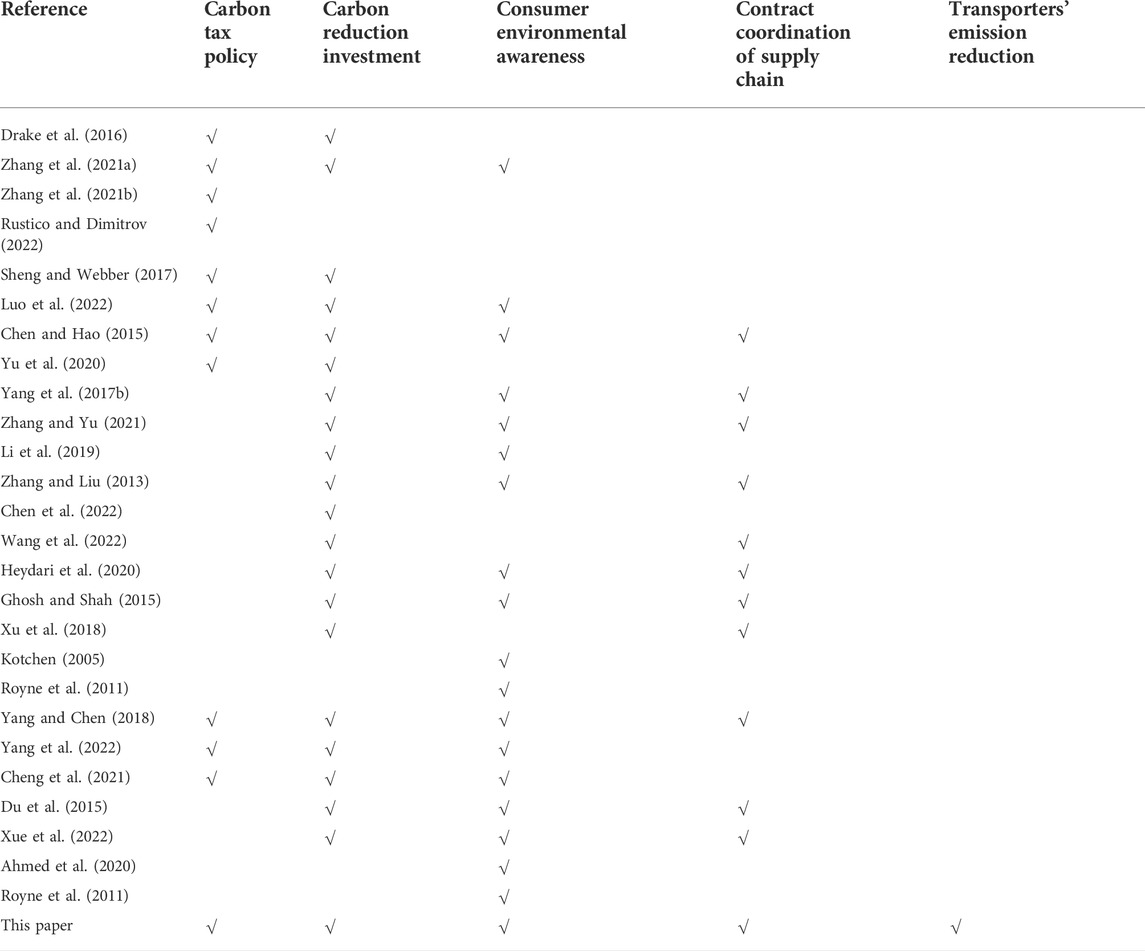
TABLE 1. Comparative study of relevant literature with this paper.
Model description and assumptions
Model description
This study combined the realistic background that the government imposes a carbon tax on carbon-emitting enterprises and consumer environmental awareness affects the market demand for low-carbon products, and investigated the optimal carbon emission reductions, pricing, and social welfare for a three-echelon supply chain composed of a manufacturer, transporter, and retailer. An operation chart of the three-echelon supply chain is shown in Figure 1.
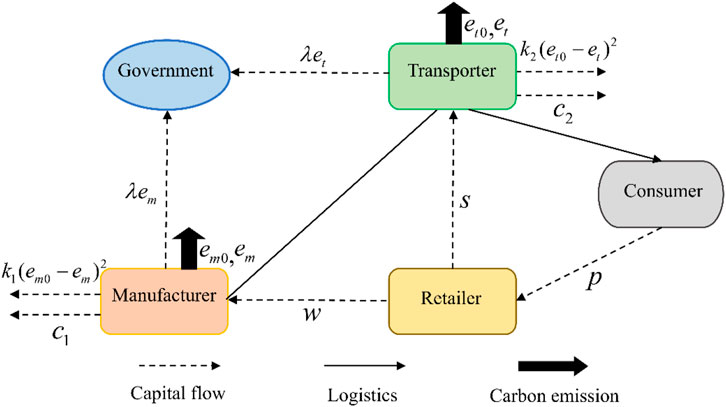
FIGURE 1. Operation chart of low-carbon supply chain.
Similar to the work of Xu et al. (2017), the manufacturer organizes production according to Make-to-order mode, and the cost per unit product is
Basic assumptions
Before the models are established, the following assumptions are made:
Assumption 1. Market demand has a linear relationship with the selling price
Assumption 2. The cost of carbon emission reductions for the manufacturer and transporter is related to the level of carbon emission reductions. Following He et al. (2021) and Song et al. (2017), we assume that the cost functions of carbon emission reductions for the manufacturer and transporter are
Assumption 3. To ensure that market demand
Assumption 4. Carbon emission reduction investment is a long-term investment project, and it is difficult to make substantial breakthroughs in the short term compared with pricing decision. Therefore, referring to the solution method of Xu et al. (2019), it is assumed that the order of optimal carbon emission reduction decisions takes precedence over pricing decisions.
Assumption 5. Consumer surplus is the difference between maximum price that consumers are willing to pay for a product and market price that they actually pay for the product (Cohen et al. 2016). Following Peng et al. (2020), consumer surplus function is expressed as
Assumption 6. For a more comprehensive measure of the supply chain system, social welfare will be investigated. According to Sun et al. (2021), the social welfare function comprises the profit of the supply chain system, consumer surplus, carbon tax revenue, and external negative effects of carbon emissions. If the original intention of the government to levy a carbon tax on carbon emission enterprises is to eliminate the external negative effect of carbon emissions on the environment, then the carbon tax income only offsets the environmental governance cost of carbon emissions; that is, the carbon tax revenue is equal to the external negative effect of carbon emissions. Therefore, the social welfare function is called
TABLE 2. Parameters and definition.
Model establishment and solution
The non-cooperative decision (NN model)
In the NN model, there is no cooperation among supply chain members, including the field of carbon emission reduction and pricing. The manufacturer and transporter independently determine the amount of carbon that they want to reduce. Subsequently, the manufacturer, retailer, and transporter decide the wholesale, selling, and freight prices, respectively. Non-cooperative decisions are a common phenomenon in reality. The supply chain members are completely rational “economic men”, and the pursuit of maximizing their own interests is the starting point of their decision-making. In the field of carbon emission reduction, the manufacturer and transporter decide the optimal carbon emission reductions with the goal of profit maximization. Therefore, the decision-making process can be regarded as a Nash game. In the pricing field, we construct a two-layer Stackelberg game model, namely, the Stackelberg game relationship between the manufacturer and the retailer and the Stackelberg game relationship between the retailer and the transporter. The first level game is expressed as “manufacturer-retailer” game, in which the manufacturer is the leader and the retailer is the follower. The manufacturer first determines the wholesale price, and the retailer then determines the selling price based on the wholesale price laid down by the manufacturer. The second-level game is expressed as the “retailer-transporter” game, in which the transporter is the provider of the transportation business and has the initiative to choose the partner, and is therefore regarded as the leader. After the retailer decides on the selling price, the transporter determines the freight price according to the retailer’s selling price. Figure 2 shows the order of decision-making and the game types of supply chain members at different decision-making stages for the NN model.

FIGURE 2. The order of decision-making and the game types of supply chain members for the NN model.
According to the above description, we start from the pricing field to analyze the decision-making process of supply chain members. The profit functions of the manufacturer, retailer, and transporter are as follows:
Using backward induction to solve the two-layer Stackelberg game model, we can obtain the expressions of
By solving the NN model, we can obtain the following.
Theorem 1. In the NN model, the optimal carbon emission reduction, selling price, market demand, supply chain profit, and social welfare are presented as follows:
Proof of Theorem 1 Please see Supplementary Appendix A.
Corollary 1. Regarding the optimal carbon emission reductions of the supply chain in the NN model, we have the following:
1) If
2) If
Where
Proof of. Corollary 1 Please see Supplementary Appendix B.From the optimal carbon emission reduction expression of the supply chain, we can find that the influence trends of the change of consumer environmental awareness on the optimal carbon emission reductions of the supply chain are similar to that of the carbon tax rate, so we will not repeat the analysis of this process.
The local-cooperative decision-making Ⅰ (CN model)
In the CN model, the manufacturer and transporter cooperate in the field of carbon emission reduction and jointly decide the optimal carbon emission reductions of the supply chain. When the manufacturer and transporter belong to the same group, similar situations often occur in real life. This is the case, for example, between Haier Group’s manufacturing plants and RRS Logistics. Supply chain members have no cooperation in any form in the area of pricing, and each decides on the price of the product or service for profit maximization. Obviously, the pricing decision-making process of local cooperative decision Ⅰ is consistent with that of non-cooperative decisions, which will not be described here. Figure 3 shows the order of decision-making and the game types of supply chain members at different decision-making stages for the CN model.
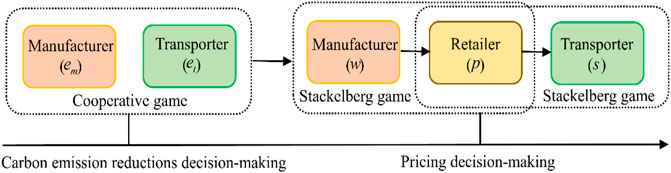
FIGURE 3. The order of decision-making and the game types of supply chain members for the CN model.
Subsequently, we can obtain the profit function of the manufacturer and transporter when they jointly undertake carbon emission reductions as follows:
By solving the CN model, we can obtain the following.
Theorem 2. In the CN model, the optimal carbon emission reduction, selling price, market demand, supply chain profit, and social welfare are presented as follows:
Proof of Theorem 2Please see Supplementary Appendix C.
Corollary 2. Regarding the optimal carbon emission reductions in the supply chain in the CN model, we have the following:
1) If
2) If
Where
Proof of. Corollary 2 Please see Supplementary Appendix D.
The local-cooperative decision-making Ⅱ (NC model)
In the NC model, supply chain members do not cooperate in carbon emission reduction. Carbon emission enterprises determine their optimal carbon emission reductions according to their profit maximization goals. In the area of pricing, the manufacturer and retailer cooperate to form a manufacturer-retailer alliance to jointly decide the selling price. For example, the Wensli Group is the licensed manufacturer and retailer of the “Beijing 2022 Winter Olympic Games,” which can produce and sell related silk products within the authorized scope. A Stackelberg game is played between the manufacturer and retailer alliance and the transporter, in which the manufacturer-retailer alliance is the leader of the Stackelberg game and the transporter is the follower of the Stackelberg game. Figure 4 shows the order of decision-making and the game types of supply chain members at different decision-making stages for the NC model.
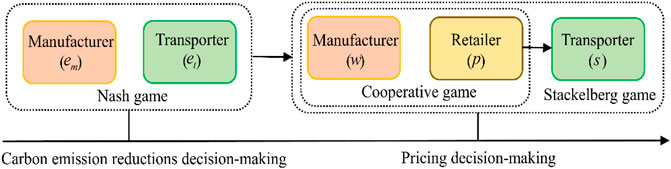
FIGURE 4. The order of decision-making and the game types of supply chain members for the NC model.
The decision-making model in the area of pricing is as follows:
Using backward induction to solve the Stackelberg game model, we can obtain expressions for
By solving the NC model, we can obtain the following.
Theorem 3. In the NC model, the optimal carbon emission reduction, selling price, market demand, supply chain profit, and social welfare are presented as follows:
Proof of Theorem 3Please see Supplementary Appendix E.
Corollary 3. Regarding the optimal carbon emission reductions of the supply chain in the NC model, we have the following:
1) If
2) If
Where
Proof of. Corollary 3 Please see Supplementary Appendix F.
The overall-cooperative decision-making (CC model)
In the CC model, the manufacturer, retailer, and transporter cooperate in both the field of carbon emission reduction and area of pricing. With the goal of maximizing profits for the supply chain system, supply chain members jointly determine the optimal carbon emission reductions of the supply chain and the selling price. For example, the Gree Group is known as a leader in China’s electrical appliance industry, with its main businesses including production, sales, and transportation. Figure 5 shows the order of decision-making and the game types of supply chain members at different decision-making stages for the CC model.
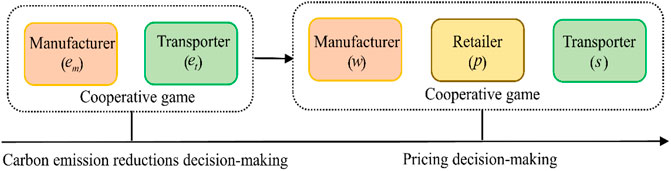
FIGURE 5. The order of decision-making and the game types of supply chain members for the CC model.
The profit function of the supply chain system in the pricing area is formulated as
Taking the second-order derivative of
By solving the CC model, we can obtain the following.
Theorem 4. In the CC model, the optimal carbon emission reduction, selling price, market demand, supply chain profit, and social welfare are presented as follows:
Proof of Theorem 4Please see Supplementary Appendix G.
Corollary 4. Regarding the optimal carbon emission reductions in the supply chain in the CC model, we have the following:
1) If
2) If
Where
Proof of. Corollary 4 Please see Supplementary Appendix H.From Corollaries 1, 2, 3, and 4, we know that when the initial carbon emission level of the supply chain system is low, a higher carbon tax rate stimulates enterprises to reduce carbon emissions. This is because at this time, the marginal cost of carbon emission reductions is small, and the amount of carbon tax saved by reducing one unit of carbon emissions is greater than the marginal cost of investing in carbon emission reductions. Out of the instincts of chasing profits, enterprises in the supply chain voluntarily choose to reduce carbon emissions. In this case, the carbon tax policy is more effective. Therefore, if the carbon emissions of enterprises are small, the government can appropriately raise the carbon tax rate to encourage enterprises to increase carbon emission reduction. When the initial carbon emissions level of the supply chain system is high, there is a threshold during the gradual increase in the carbon tax rate. When the carbon tax rate is lower than this threshold, the optimal carbon emission reductions in the supply chain increase with an increase in the carbon tax rate. When the carbon tax rate is higher than this threshold, the optimal carbon emission reductions of the supply chain decrease with an increase in carbon tax rate. However, this conclusion is counterintuitive. In general, the cost of carbon emission reductions continues to rise with the improvement in the carbon tax rate; thus, enterprises should be more inclined to reduce carbon emissions to avoid paying a high carbon tax. However, the actual situation is that the government increases the carbon tax rate to impose carbon emission reduction pressure on the enterprises, while the carbon emissions of the enterprises continue to rise. In other words, for enterprises with high carbon emissions, the effect of a carbon tax policy with a high rate is not ideal. The main reason for this phenomenon is that the marginal cost of carbon emissions reduction is increasing. If the initial carbon emission level of the enterprises is high, the cost of carbon emission reduction increases rapidly with the increase in carbon emission reductions, so that the increase in cost of reducing carbon emissions per unit exceeds the sum of the additional carbon tax and the benefit brought by increased market demand. In this case, enterprises will stop cutting carbon emissions.
Comparative analysis
Comparison of the NN and the CN models
Based on Theorems 1 and 2, we can further compare the NN model with the CN model in terms of optimal carbon emission reductions, selling price, market demand, supply chain profit, and social welfare.
Corollary 5. Comparing the NN and CN models, we obtain the following:
1)
2) If it meets
Proof of. Corollary 5 Please see Supplementary Appendix I.
Comparison of the NN and the NC models
Based on Theorems 1 and 3, we can further compare the NN model with the NC model in terms of optimal carbon emission reductions, selling price, market demand, supply chain profit, and social welfare.
Corollary 6. Comparing the NN and NC models, we obtain the following:
1)
2) When
Where
Comparison of the CC and the CN models
Based on Theorems 2 and 4, we can further compare the CC model with the CN model in terms of optimal carbon emission reductions, selling price, market demand, supply chain profit, and social welfare.
Corollary 7. Comparing the CC and CN models, we obtain the following:
1)
2) When
Where
Comparison of the CC and the NC models
Based on Theorems 3 and 4, we can further compare the CC model with the NC model in terms of optimal carbon emission reductions, selling price, market demand, supply chain profit, and social welfare.
Corollary 8. Comparing the CC and NC models, we obtain the following:
1)
2) When
Where
Supply chain coordination using a cross-shareholding contract (CSC model)
As mentioned above, with the deepening of cooperation among members of the supply chain, in addition to selling price, other key parameters of the supply chain, such as the optimal carbon emission reductions, market demand, profit of supply chain, and social welfare, have gradually improved. Consequently, for a supply chain system, overall cooperation among members of the supply chain is the best mode. However, the existence of the phenomenon of “double marginalization” makes it difficult to realize the ideal state under overall cooperation spontaneously, and must be coordinated by designing certain supply chain contracts. We consider the NC model to be an example, assuming that the manufacturer-retailer alliance and the transporter enter a cross-shareholding partnership, in which the two share each other’s profits in proportion to their shareholding. The manufacturer-retailer alliance holds shares of the transporter’s profit ratio
On this basis, the profits of the manufacturer-retailer alliance and the transporter are set as
The equilibrium solutions of the CSC model were solved by backward induction, and the optimal carbon emission reductions, selling price, market demand, supply chain profit, and social welfare were obtained.
Theorem 5. In the CSC model, the equilibrium solutions are given as follows:
Proof of Theorem 5Please see Supplementary Appendix M.
Corollary 9. In the CSC model: Only when it meets
Corollary 9 shows that under limited conditions, a cross-shareholding contract can realize supply chain coordination. At this moment, the supply chain’s profit under the cross-shareholding contract is greater than that before coordination. Furthermore, we can draw the following conclusions.
Corollary 10. In the CSC model: If it meets
Corollary 10shows that when the profit-sharing ratio of the cross-shareholding contract and
Numerical analysis
To better understand the impact of carbon tax rate change on the optimal decision making and profit of supply chain members, numerical examples are used. We assume that the parameter valves in this study are
The impact of carbon tax rate on the optimal carbon reductions
Figures 6A,B describe the impact of carbon tax rate change on the optimal carbon emission reductions of the clean and polluting supply chains, respectively. As shown in Figure 6A for a clean supply chain, carbon emission reductions of the NN, CN, NC models increase with an increase in the carbon tax rate, while carbon emission reductions of the CC model first increase rapidly with an increase in the carbon tax rate, and then carbon emission reductions stays unchanged when the carbon tax rate reaches a certain value. At this time, carbon emission reductions have been equal to the initial carbon emission of supply chain, and the supply chain has achieved zero carbon emission. There is no point if the government continues to raise the carbon tax rate. Because supply chain members do not emit carbon dioxide. In that case, the government will not get any carbon tax, consumer environmental awareness will have no impact on market demand, and supply chain members will not increase the investment in carbon emission reduction technology or equipment. As can be seen from Figure 6B, for the polluting supply chain, carbon emission reductions of the four models first increase and then decrease with an increase in the carbon tax rate. Therefore, to obtain the best effect of carbon emission reduction, the carbon tax rate cannot be increased blindly when the initial carbon emissions of enterprises are generally high. Due to the rapid increase in the marginal cost of carbon emission reduction, the effect of carbon emission reduction for polluting supply chain is not ideal. In our numerical example, the CC model with the largest carbon emission reduction among the four models only reduced about one-third of the supply chain’s initial carbon emission. From Figures 6A,B, we know that the carbon emission reduction of the CC model is more than the NN, CN, and NC models, no matter it is a clean or polluting supply chain. Consequently, from the perspective of carbon emission reduction, the overall-cooperative decision-making is the optimal decision-making mode.
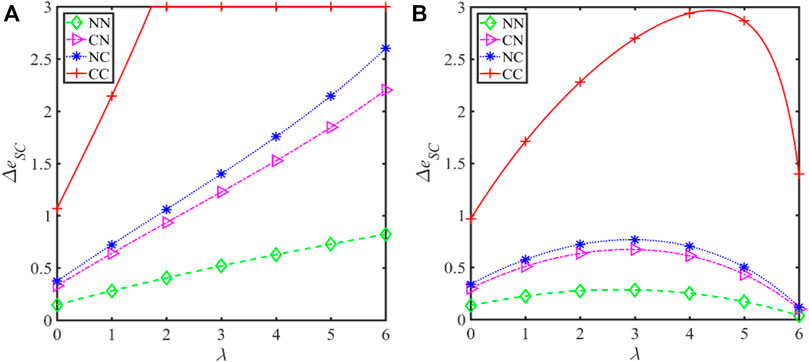
FIGURE 6. Impact of carbon tax rate on optimal carbon emission reductions. (A) Initial carbon emission
The impact of carbon tax rate on selling price
Figures 7A,B describe the impact of the carbon tax rate change on the selling price of the clean and polluting supply chains, respectively. As can be seen from Figure 7A, for a clean supply chain, with an increase in the carbon tax rate, the selling prices of the NN, CN, and NC models increase gradually, while the selling price of the CC model increases slowly at first, then decreases slightly, and finally remains constant. When the carbon tax rate gradually increases from zero, it will have many indirect effects on the profits of supply chain members. For instance, the carbon emission reduction cost will increase, the market demand will increase, and the carbon tax will first increase and then decrease. When the negative impact of carbon emission reduction cost increase and carbon tax increase on the supply chain profit is greater than the positive impact of demand increase on the supply chain profit, supply chain members can compensate part of the profit loss by increasing the selling price. Subsequently, with the reduction of carbon tax, the positive impact of market demand increase will gradually exceed the negative impact of carbon emission reduction cost and carbon tax, and supply chain members will reduce the selling price to maximize profits. Finally, when the supply chain achieves zero emission, the carbon emission reduction cost, carbon tax and market demand will remain unchanged, and the selling price will also remain constant. As shown in Figure 7B, for the polluting supply chain, the selling price increases with an increase in the carbon tax rate in the four models. When the carbon tax rate increased from scratch, due to the high initial carbon emission level of the polluting supply chain, the cost in carbon emission reduction and the carbon tax always has a great negative impact on the profit of supply chain. Although reducing carbon emissions can stimulate market demand and have a positive impact on supply chain profit, the positive impact is smaller than the negative impact mentioned above. Therefore, supply chain members need to constantly improve selling price to offset the profit loss caused by the increase of the carbon tax rate. From Figures 7A,B, we can see that the selling price in the CC model is lower than that in the NN, CN, and NC models, no matter it is a clean or polluting supply chain. Although supply chain members invest the largest carbon emission reduction cost in the CC model, the apportionment cost per unit product decreases with an increase in the market demand, so the carbon emission reduction cost that supply chain members need to transfer is reduced, and the selling price in the CC model is lower than other models. At this point, because consumers can obtain products at lower selling prices and carbon emissions, they are happy to see supply chain members cooperate with each other.
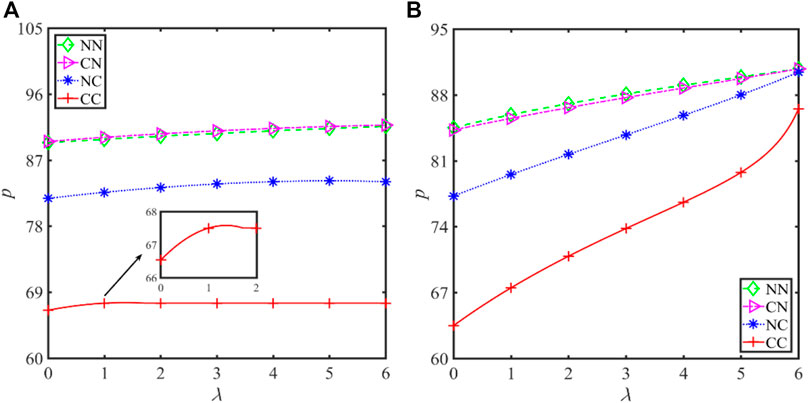
FIGURE 7. Impact of carbon tax rate on selling price. (A) Initial carbon emission
The impact of carbon tax rate on market demand
Figures 8A,B describe the impact of the carbon tax rate change on the market demand of the clean and polluting supply chains, respectively. As can be seen from Figure 8A, for a clean supply chain, with an increase in the carbon tax rate, the market demand of the NN, CN, and NC models almost remains unchanged, while the market demand of the CC model first a bit decreases, then gradually increases, and finally remains constant. The increase of carbon tax rate will promote the increase of carbon emission reduction, which will help improve the market demand. However, an increase in the selling price can cause the market demand to develop in the opposite direction. When the impact of carbon emission reduction on the market demand is greater than the impact of selling price on the market demand, the market demand will show a downward trend. For example, the carbon tax rate will increase from zero for a short period. On the contrary, the market demand will increase. When the supply chain achieves zero carbon emission, the carbon emission reduction and selling price will not change with an increase in the carbon tax rate, and the market demand will remain constant. As shown in Figure 8B, for the polluting supply chain, the market demand of the four models decreases with an increase in the carbon tax rate. In the process of gradual increase in the carbon tax rate, the negative impact of increasing selling price on the market demand always exceeds the positive impact of carbon emission reduction on the market demand, so the market demand keeps declining. From Figures 8A,B, we find that whether it is a clean or polluting supply chain, the market demand of the CC model is higher than that of the other models. Therefore, in terms of social production efficiency, the overall-cooperative decision-making is the best decision-making mode.
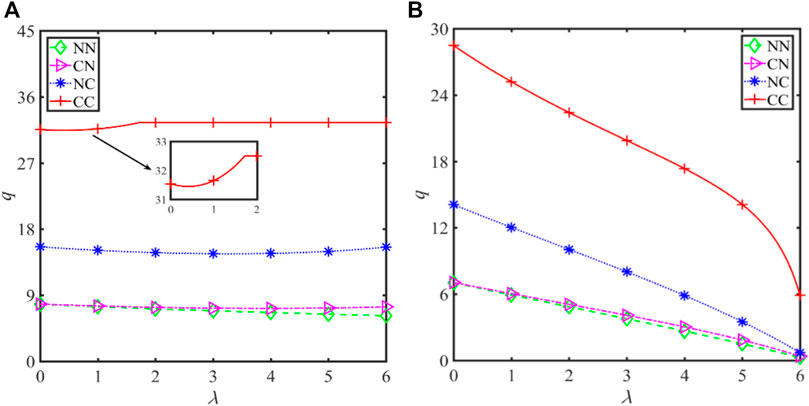
FIGURE 8. Impact of carbon tax rate on market demand. (A) Initial carbon emission
The impact of carbon tax rate on supply chain profit
Figures 9A,B describe the impact of the carbon tax rate change on the profits of the clean and polluting supply chains, respectively. As can be seen from Figure 9A, for a clean supply chain, with an increase in the carbon tax rate, the supply chain profits of the NN, CN, and NC models show a slow decline trend on the whole, but the profit of the CC model decrease gradually at first and then remain constant. We can see that in the clean supply chain, increasing the carbon tax rate will affect the supply chain profit, but the profit loss is not serious. As shown in Figure 9B, for the polluting supply chain, the supply chain profit of the four models rapidly decreases with an increase in the carbon tax rate. The reason is that with an increase in the carbon tax rate, supply chain members will pay a high carbon tax if they do not reduce carbon emissions. When supply chain members choose to implement carbon emission reductions to minimize carbon tax, they must pay more carbon emission reduction costs. It has to be one or the other. The above reasons lead to the rapid decline of supply chain profit curve with an increase in the carbon tax rate. Combining Figures 9A,B, we know that the supply chain profit of the CC model is large than that of the other models, whether it is a clean or polluting supply chain, and whether it is low carbon tax rate or high carbon tax rate. Therefore, from the perspective of economic benefits, the overall-cooperative decision is the most suitable for supply chain members.

FIGURE 9. Impact of carbon tax rate on profit of supply chain. (A) Initial carbon emission
The impact of carbon tax rate on social welfare
Figures 10A,B describe the impact of carbon tax rate change on the social welfare of the clean and polluting supply chains, respectively. As shown in Figures 10A,B, we find that increasing the carbon tax rate has almost the same impact on social welfare as it does on the profit of the supply chain system. Social welfare consists of the profits of the supply chain system and the consumer surplus. Consumer surplus is closely related to market demand, and the change characteristics of the market demand and profit curves of the supply chain system are very similar. These characteristics determine that the change trends of the social welfare and profit curves of the supply chain system affected by the change in the carbon tax rate are almost identical. The only difference is that the social welfare curve of the CC model in clean supply chain decreases first and then increases when the carbon tax rate is low. This phenomenon is caused by the fact that the market demand decreases first and then increases when the carbon tax rate is in the same range. As can be seen from Figure 10B, for the polluting supply chain, a high tax rate will lead to complete loss of the social welfare. Because the profit of the polluting supply chain and the market demand are close to zero at this moment. In combination with the above analysis, we know that imposing a high carbon tax on polluting supply chain will lead to a double loss of economic and social benefits. The impact of cross-shareholding ratio on coordination effect
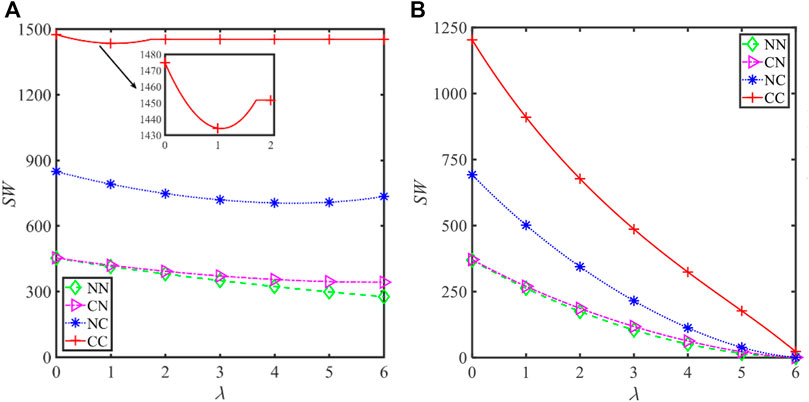
FIGURE 10. Impact of carbon tax rate on profit of social welfare. (A) Initial carbon emission
Let’s make
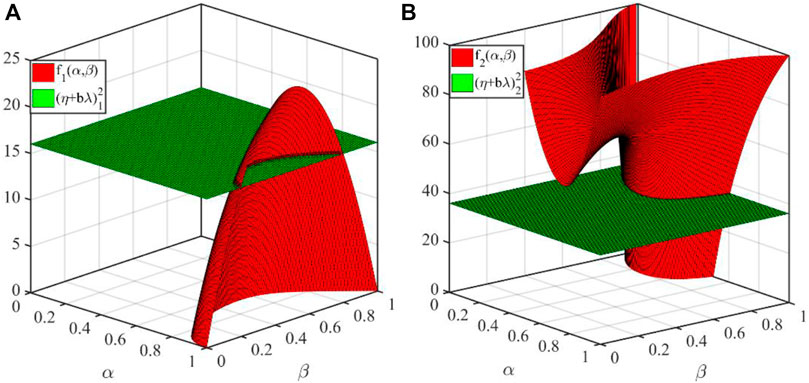
FIGURE 11. Impact of cross-shareholding ratio on coordination effect. (A) Horizontal surface
Main conclusions and managerial implications
Main conclusions
This study takes a three-echelon supply chain composed of a manufacturer, retailer, and transporter under the carbon tax system as the research object and analyzes the impact of the change in the carbon tax rate on supply chain decision-making in different fields. It was found that when the initial carbon emissions of the supply chain system are small, the carbon emission reductions of the supply chain system increase with an increase in the carbon tax rate when supply chain members do not cooperate, local cooperation, and overall cooperation. When the initial carbon emissions of the supply chain system are high, there is a threshold in the process of gradually increasing the carbon tax rate. When the carbon tax rate is less than this threshold, the optimal carbon emission reduction of the supply chain system increases with an increase in carbon tax rate. When the carbon tax rate is greater than this threshold, the optimal carbon emission reduction of the supply chain system decreases with an increase in carbon tax rate.
In the three-echelon supply chain, the optimal carbon emission reductions, market demand, supply chain profit, and social welfare indicators are gradually optimized with the deepening of cooperation among supply chain members. However, the selling price varies greatly under the influence of consumer environmental awareness and carbon tax rate. When consumer environmental awareness is low, the selling price of products gradually decreases with deepening cooperation among supply chain members. When the level of consumer environmental awareness is high, there is a certain range in the process of increasing the carbon tax rate, which makes a selling price with more cooperation among supply chain members higher than that with less cooperation among supply chain members. Regardless of whether the carbon tax rate is too high or too low, the selling price that makes supply chain members cooperate more deeply is lower than the selling price when supply chain members cooperate less.
In the supply chain model of contract coordination, when the cross-shareholding ratio meets a specific range, the profit of the supply chain system increases compared to that before cross-shareholding. The research shows that when certain conditions are met between the cross-shareholding ratio, carbon tax rate, and consumer environmental awareness, cross-shareholding contracts can achieve perfect coordination of the supply chain system. This is because the retailer bears part of the cost of reducing emissions for the manufacturer and transporter through cross-shareholding contracts. To a certain extent, the “free rider” phenomenon of the retailer will be eliminated, thus encouraging the manufacturer and transporter to improve their carbon emission reduction levels.
Managerial implications
This study explores the impact of cooperation modes in different fields on the optimal decision making and profit of supply chain members. The results show that a deeper degree of cooperation among supply chain members is beneficial to all members of the supply chain and can achieve a win-win situation. Therefore, from the perspective of the supply chain, it is wise for the manufacturer and transporter to invest in carbon emission reduction technologies to improve supply chain performance under the carbon tax policy. The retailer should maintain a positive attitude toward the potential risk of reduced market demand caused by the increase in carbon emissions in the supply chain system and cooperate with the manufacturer and transporter to achieve coordination of the supply chain system.
Additionally, the carbon tax policy adopted by the government varies with the initial carbon emission difference of the supply chain system. In a clean supply chain, it is not entirely beneficial for the government to reduce the carbon tax rate to encourage production. For the polluting supply chain, the government cannot simply increase the carbon tax rate to curb its carbon emissions. Therefore, the government raises the carbon tax rate on the clean supply chain and lowers the carbon tax rate on the polluting supply chain to encourage the improvement of supply chain profit and consumer surplus.
For the polluting supply chain, the carbon emission reductions are limited under the restriction of emission reduction cost. Therefore, when the carbon tax rate increases, the polluting supply chain will choose to produce less and emit less. however, this will also reduce the profits of supply chain members. The lack of competitiveness of polluting enterprises also leads to reduced demand for products in the market. In this case, the government should provide carbon emission reduction subsidies to polluting supply chains to induce manufacturers and transporters to reduce carbon emissions. In addition, improving consumer environmental awareness will also stimulate carbon emission reductions among supply chain members. For the polluting supply chain, when the policy effect of forcing supply chain members to reduce carbon emission by a high carbon tax rate is not ideal, the combination strategy of “levying low carbon tax + strengthening green marketing” may achieve better results.
Data availability statement
The raw data supporting the conclusions of this article will be made available by the authors, without undue reservation.
Author contributions
YZ conceived and designed the research question. YZ constructed the models and analyzed the optimal solutions. YZ and YQ wrote the paper. YZ and YQ reviewed and edited the manuscript. All authors read and approved the manuscript.
Funding
This work was supported by the National Natural Science Foundation of China (grant numbers 72071002, 71771002).
Acknowledgments
We would like to thank reviewers and the editor-in-charge for valuable time on the article. And we are grateful to all the foundations that support us.
Conflict of interest
The authors declare that the research was conducted in the absence of any commercial or financial relationships that could be construed as a potential conflict of interest.
Publisher’s note
All claims expressed in this article are solely those of the authors and do not necessarily represent those of their affiliated organizations, or those of the publisher, the editors and the reviewers. Any product that may be evaluated in this article, or claim that may be made by its manufacturer, is not guaranteed or endorsed by the publisher.
Supplementary Material
The Supplementary Material for this article can be found online at: https://www.frontiersin.org/articles/10.3389/fenvs.2022.969613/full#supplementary-material
References
Ahmed, N., Li, C., Khan, A., Qalati, S. A., Naz, S., and Rana, F. (2020). Purchase intention toward organic food among young consumers using theory of planned behavior: Role of environmental concerns and environmental awareness. J. Environ. Plan. Manag. 64, 796–822. doi:10.1080/09640568.2020.1785404
Cao, J., Zhang, X. M., and Zhou, G. G. (2015). Supply chain coordination with revenue-sharing contracts considering carbon emissions and governmental policy making. Environ. Prog. Sustain. Energy 35 (2), 479–488. doi:10.1002/ep.12246
Chen, D., Zhang, Y., Hong, X., Chen, Q. F., and Zhang, J. (2022). Non-cooperative game and cooperative operation of multi-level supply chain under background of carbon emission reduction. IEEE Access 10, 33015–33025. doi:10.1109/ACCESS.2022.3156639
Chen, X., and Hao, G. (2015). Sustainable pricing and production policies for two competing firms with carbon emissions tax. Int. J. Prod. Res. 53, 6408–6420. doi:10.1080/00207543.2014.932928
Cheng, P. Y., Ji, G. X., Zhang, G. T., and Shi, Y. Y. (2021). A closed-loop supply chain network considering consumer's low carbon preference and carbon tax under the cap-and-trade regulation. Sustain. Prod. Consump 29, 614–635. doi:10.1016/j.spc.2021.11.006
Cheng, Y. H., Sun, H., Jia, F., and Koh, L. (2018). Pricing and low-carbon investment decisions in an emission dependent supply chain under a carbon labelling scheme. Sustainability 10, 1238. doi:10.3390/su10041238
Cohen, M. C., Lobel, R., and Perakis, G. (2016). The impact of demand uncertainty on consumer subsidies for green technology adoption. Manage. Sci. 62, 1235–1258. doi:10.1287/mnsc.2015.2173
Deng, Y. L., You, D., and Zhang, Y. (2021). Research on improvement strategies for low-carbon technology innovation based on a differential game: The perspective of tax competition. Sustain. Prod. Consum. 26, 1046–1061. doi:10.1016/j.spc.2021.01.007
Drake, D. F., Kleindorfer, P. R., and Wassenhove, L. (2016). Technology choice and capacity portfolios under emissions regulation. Prod. Oper. Manag. 25, 1006–1025. doi:10.1111/poms.12523
Du, S. F., Zhu, J. A., Jiao, H. F., and Ye, W. Y. (2015). Game-theoretical analysis for supply chain with consumer preference to low carbon. Int. J. Prod. Res. 53, 3753–3768. doi:10.1080/00207543.2014.988888
Fouquet, R. (2010). The slow search for solutions: Lessons from historical energy transitions by sector and service. Energy Policy 38, 6586–6596. doi:10.1016/j.enpol.2010.06.029
Ghosh, D., and Shah, J. (2015). Supply chain analysis under green sensitive consumer demand and cost sharing contract. Int. J. Prod. Econ. 164, 319–329. doi:10.1016/j.ijpe.2014.11.005
He, P., Wang, Z., Shi, V., and Liao, Y. (2021). The direct and cross effects in a supply chain with consumers sensitive to both carbon emissions and delivery time. Eur. J. Oper. Res. 292, 172–183. doi:10.1016/j.ejor.2020.10.031
Heydari, J., Govindan, K., and Basiri, Z. (2020). Balancing price and green quality in presence of consumer environmental awareness: A green supply chain coordination approach. Int. J. Prod. Res. 59, 1957–1975. doi:10.1080/00207543.2020.1771457
Huang, Y. S., Fang, C. C., and Lin, Y. A. (2020). Inventory management in supply chains with consideration of logistics, green investment and different carbon emissions policies. Comput. Ind. Eng. 139, 106207. doi:10.1016/j.cie.2019.106207
Jiang, G., Ji, Y., Wu, Z., and Nabé, M. m. (2020). The optimal strategies in the supply chain with stochastic demand sensitivity to carbon emission. J. Control Decis. 8, 64–76. doi:10.1080/23307706.2020.1819451
Jin, M. Z., Tang, R. Z., Ji, Y. G., Liu, F., Gao, L., and Huisingh, D. (2017). Impact of advanced manufacturing on sustainability: An overview of the special volume on advanced manufacturing for sustainability and low fossil carbon emissions. J. Clean. Prod. 161, 69–74. doi:10.1016/j.jclepro.2017.05.101
Kellner, F. (2020). Generating greenhouse gas cutting incentives when allocating carbon dioxide emissions to shipments in road freight transportation. Available online. doi:10.2139/ssrn.3518014
Kotchen, M. J. (2005). Impure public goods and the comparative statics of environmentally friendly consumption. J. Environ. Econ. Manage. 49, 281–300. doi:10.1016/j.jeem.2004.05.003
Li, H., Wang, C. X., Shang, M., Ou, W., and Qin, X. H. (2019). Cooperative decision in a closed-loop supply chain considering carbon emission reduction and low-carbon promotion. Environ. Prog. Sustain. Energy 38, 143–153. doi:10.1002/ep.13092
Liimatainen, H., and Pöllänen, M. (2013). The impact of sectoral economic development on the energy efficiency and CO2 emissions of road freight transport. Transp. Policy 27, 150–157. doi:10.1016/j.tranpol.2013.01.005
Liu, Z., Lang, L. L., Hu, B., Shi, L. H., Huang, B. T., and Zhao, Y. J. (2021). Emission reduction decision of agricultural supply chain considering carbon tax and investment cooperation. J. Clean. Prod. 294, 126305. doi:10.1016/j.jclepro.2021.126305
Luo, R. L., Zhou, L., Song, Y., and Fan, T. J. (2022). Evaluating the impact of carbon tax policy on manufacturing and remanufacturing decisions in a closed-loop supply chain. Int. J. Prod. Econ. 245, 108408. doi:10.1016/j.ijpe.2022.108408
Luo, Z., Chen, X., and Wang, X. J. (2016). The role of co-opetition in low carbon manufacturing. Eur. J. Oper. Res. 253, 392–403. doi:10.1016/j.ejor.2016.02.030
Meng, X. G., Yao, Z., Nie, J. J., Zhao, Y. X., and Li, Z. L. (2018). Low-carbon product selection with carbon tax and competition: Effects of the power structure. Int. J. Prod. Econ. 200, 224–230. doi:10.1016/j.ijpe.2018.03.029
Peng, Q. Y., Wang, C. X., and Xu, L. (2020). Emission abatement and procurement strategies in a low-carbon supply chain with option contracts under stochastic demand. Comput. Ind. Eng. 144, 106502. doi:10.1016/j.cie.2020.106502
Qiao, Y. K., Peng, F. L., Sabri, S., and Rajabifard, A. (2019). Low carbon effects of urban underground space. Sustain. Cities Soc. 45, 451–459. doi:10.1016/j.scs.2018.12.015
Qu, S. J., Yang, H., and Ji, Y. (2021). Low-carbon supply chain optimization considering warranty period and carbon emission reduction level under cap-and-trade regulation. Environ. Dev. Sustain. 23, 18040–18067. doi:10.1007/s10668-021-01427-8
Raz, G., Druehl, C. T., and Blass, V. (2013). Design for the environment: Lifecycle approach using a newsvendor model. Prod. Oper. Manag. 22, 940–957. doi:10.1111/poms.12011
Royne, M. B., Levy, M., and Martinez, J. (2011). The public health implications of consumers' environmental concern and their willingness to pay for an eco-friendly product. J. Consum. Aff. 45, 329–343. doi:10.1111/j.1745-6606.2011.01205.x
Rustico, E., and Dimitrov, S. (2022). Environmental taxation: The impact of carbon tax policy commitment on technology choice and social welfare. Int. J. Prod. Econ. 243, 108328. doi:10.1016/j.ijpe.2021.108328
Salvi, B. L., and Subramanian, K. A. (2015). Sustainable development of road transportation sector using hydrogen energy system. Renew. Sustain. Energy Rev. 51, 1132–1155. doi:10.1016/j.rser.2015.07.030
Sheng, J. C., and Webber, M. (2017). Incentive-compatible payments for watershed services along the eastern route of China’s south-north water transfer project. Ecosyst. Serv. 25, 213–226. doi:10.1016/j.ecoser.2017.04.006
Solaymani, S. (2019). CO2 emissions patterns in 7 top carbon emitter economies: The case of transport sector. Energy 168, 989–1001. doi:10.1016/j.energy.2018.11.145
Song, J., Li, F., Wu, D. D., Liang, L., and Dolgui, A. (2017). Supply chain coordination through integration of innovation effort and advertising support. Appl. Math. Model. 49, 108–123. doi:10.1016/j.apm.2017.04.041
Sun, Y. Y., Mao, X. Q., Yin, X. A., Liu, G. Y., Zhang, J., and Zhao, Y. W. (2021). Optimizing carbon tax rates and revenue recycling schemes: Model development, and a case study for the bohai bay area, China. J. Clean. Prod. 296, 126519. doi:10.1016/j.jclepro.2021.126519
Wang, H., Wang, L., and Ding, Q. Y. (2022b). Manufacturers’ product line strategies and environmental impacts under carbon cap and trade policies. Environ. Sci. Pollut. Res. 29, 40781–40795. doi:10.1007/s11356-021-17909-1
Wang, J., Ma, R., Lu, X. M., and Yu, B. Q. (2022a). Emission reduction cooperation in a dynamic supply chain with competitive retailers. Environ. Dev. Sustain. doi:10.1007/s10668-021-02031-6
Wang, Y. J., and Wang, F. (2021). Production and emissions reduction decisions considering the differentiated carbon tax regulation across new and remanufactured products and consumer preference. Urban Clim. 40, 100992. doi:10.1016/j.uclim.2021.100992
Wang, Y. L., Xu, X., and Zhu, Q. H. (2021). Carbon emission reduction decisions of supply chain members under cap-and-trade regulations: A differential game analysis. Comput. Ind. Eng. 162, 107711. doi:10.1016/j.cie.2021.107711
Xu, J. T., Qi, Q., and Bai, Q. G. (2018). Coordinating a dual-channel supply chain with price discount contracts under carbon emission capacity regulation. Appl. Math. Model. 56, 449–468. doi:10.1016/j.apm.2017.12.018
Xu, L., Xie, F. G., Yuan, Q., and Chen, J. H. (2019). Pricing and carbon footprint in a two-echelon supply chain under cap-and-trade regulation. Int. J. Low-Carbon Tec. 14, 212–221. doi:10.1093/ijlct/ctz013
Xu, X. P., He, P., Xu, H., and Zhang, Q. P. (2017). Supply chain coordination with green technology under cap-and-trade regulation. Int. J. Prod. Econ. 183, 433–442. doi:10.1016/j.ijpe.2016.08.029
Xue, K., Sun, G., and Yao, T. (2022). Incentive mechanisms for carbon emission abatement considering consumers’ low-carbon awareness under cap-and-trade regulation. Int. J. Environ. Res. Public Health 19, 4104. doi:10.3390/ijerph19074104
Yang, H. X., and Chen, W. B. (2018). Retailer-driven carbon emission abatement with consumer environmental awareness and carbon tax: Revenue-sharing versus Cost-sharing. Omega 78, 179–191. doi:10.1016/j.omega.2017.06.012
Yang, H. X., Luo, J. W., and Wang, H. J. (2017a). The role of revenue sharing and first-mover advantage in emission abatement with carbon tax and consumer environmental awareness. Int. J. Prod. Econ. 193, 691–702. doi:10.1016/j.ijpe.2017.08.032
Yang, L., Zhang, Q., and Ji, J. (2017b). Pricing and carbon emission reduction decisions in supply chains with vertical and horizontal cooperation. Int. J. Prod. Econ. 191, 286–297. doi:10.1016/j.ijpe.2017.06.021
Yang, Y. X., Goodarzi, S., Jabbarzadeh, A., and Fahimnia, B. (2022). In-house production and outsourcing under different emissions reduction regulations: An equilibrium decision model for global supply chains. Transp. Res. Part E Logist. Transp. Rev. 157, 102446. doi:10.1016/j.tre.2021.102446
Yu, W., Shang, H. T., and Han, R. Z. (2020). The impact of carbon emissions tax on vertical centralized supply chain channel structure. Comput. Ind. Eng. 141, 106303. doi:10.1016/j.cie.2020.106303
Zhang, C. T., and Liu, L. P. (2013). Research on coordination mechanism in three-level green supply chain under non-cooperative game. Appl. Math. Model. 37, 3369–3379. doi:10.1016/j.apm.2012.08.006
Zhang, G. T., Cheng, P. Y., Sun, H., Shi, Y. Y., Zhang, G. Q., and Kadiane, A. (2021a). Carbon reduction decisions under progressive carbon tax regulations: A new dual-channel supply chain network equilibrium model. Sustain. Prod. Consum. 27, 1077–1092. doi:10.1016/j.spc.2021.02.029
Zhang, H. Q., Li, P., Zheng, H., and Zhang, Y. X. (2021b). Impact of carbon tax on enterprise operation and production strategy for low-carbon products in a co-opetition supply chain. J. Clean. Prod. 287, 125058. doi:10.1016/j.jclepro.2020.125058
Zhang, W. S., Xiao, J., and Cai, L. F. (2020). Joint emission reduction strategy in green supply chain under environmental regulation. Sustainability 12, 3440. doi:10.3390/su12083440
Zhang, Y. F., Gong, B. G., and Wang, Y. (2022). Pricing and coordinated of supply chain for three-echelon non-instantaneous deteriorating items considering transportation costs sharing. Comput. Integr. Manuf. Syst. 28, 258–268. doi:10.13196/j.cims.2022.01.024
Zhang, Z. Y., and Yu, L. Y. (2021). Dynamic optimization and coordination of cooperative emission reduction in a dual-channel supply chain considering reference low-carbon effect and low-carbon goodwill. Int. J. Environ. Res. Public Health 18, 539. doi:10.3390/ijerph18020539
Zhou, Y. J., Hu, F. Y., and Zhou, Z. L. (2018a). Pricing decisions and social welfare in a supply chain with multiple competing retailers and carbon tax policy. J. Clean. Prod. 190, 752–777. doi:10.1016/j.jclepro.2018.04.162
Zhou, Y. X., Fang, W. S., Li, M. J., and Liu, W. L. (2018b). Exploring the impacts of a low-carbon policy instrument: A case of carbon tax on transportation in China. Resour. Conserv. Recycl. 139, 307–314. doi:10.1016/j.resconrec.2018.08.015
Keywords: three-echelon supply chain, carbon tax policy, carbon emission reductions, consumer environmental awareness, cross-shareholding
Citation: Zhang Y and Qin Y (2022) Carbon emission reductions, pricing and social welfare of three-echelon supply chain considering consumer environmental awareness under carbon tax policy. Front. Environ. Sci. 10:969613. doi: 10.3389/fenvs.2022.969613
Received: 15 June 2022; Accepted: 22 August 2022;
Published: 20 October 2022.
Edited by:
Guo Wei, University of North Carolina at Pembroke, United StatesReviewed by:
Liu Mingwu, Chongqing Jiaotong University, ChinaFengmin Yao, Harbin University of Science and Technology, China
Huajun Tang, Macau University of Science and Technology, Macao, SAR China
Lilong Zhu, Shandong Normal University, China
Copyright © 2022 Zhang and Qin. This is an open-access article distributed under the terms of the Creative Commons Attribution License (CC BY). The use, distribution or reproduction in other forums is permitted, provided the original author(s) and the copyright owner(s) are credited and that the original publication in this journal is cited, in accordance with accepted academic practice. No use, distribution or reproduction is permitted which does not comply with these terms.
*Correspondence: Ying Qin, eWluZ3FpbnlxQDE2My5jb20=