 Hongzhen Luo1*
 Kevin Dewitte2
 Sofie Landschoot2Ivona Sigurnjak1
 Ana A. Robles-Aguilar1Evi Michels1
 Stefaan De Neve3
 Geert Haesaert2
 Erik Meers1
- 1Department of Green Chemistry and Technology, Ghent University, Ghent, Belgium
- 2Department of Plants and Crops, Ghent University, Ghent, Belgium
- 3Department of Environment, Ghent University, Ghent, Belgium
Recovery of biobased fertilizers derived from manure to replace synthetic fertilizers is considered a key strategy to close the nutrients loop for a more sustainable agricultural system. This study evaluated the nitrogen (N) fertilizer value of five biobased fertilizers [i.e., raw pig manure (PM), digestate (DIG), the liquid fraction of digestate (LFD), evaporator concentrate (EVA) and ammonia water (AW)] recovered from an integrated anaerobic digestion–centrifugation–evaporation process. The shoot and root growth of maize (Zea mays L.) under biobased fertilization was compared with the application of synthetic mineral N fertilizer, i.e., calcium ammonium nitrate (CAN). The non-invasive technologies, i.e., minirhizotron and unmanned aerial vehicle (UAV) based spectrum sensing, were integrated with the classic plant and soil sampling to enhance the in-season monitoring of the crop and soil status. Results showed no significant difference in the canopy status, biomass yield or crop N uptake under biobased fertilization as compared to CAN, except a lower crop N uptake in DIG treatment. The total root length detected by minirhizotron revealed a higher early-stage N availability at the rooting zone under biobased fertilization as compared to CAN, probably due to the liquid form of N supplied by biobased fertilizers showing higher mobility in soil under dry conditions than the solid form of CAN. Given a high soil N supply (averagely 70–232 kg ha−1) in the latter growing season of this study, the higher N availability in the early growing season seemed to promote a luxury N uptake in maize plants, resulting in significantly (p < 0.05) higher N concentrations in the harvested biomass of PM, LFD and AW than that in the no-N fertilized control. Therefore, the biobased fertilizers, i.e., PM, LFD, EVA and AW have a high potential as substitutes for synthetic mineral N fertilizers, with additional value in providing easier accessible N for crops during dry seasons, especially under global warming which is supposed to cause more frequent drought all over the world.
1 Introduction
Nitrogen (N) is generally considered the main nutrient limiting plant growth. The global consumption of N fertilizers in agriculture has increased more than ninefold during the last six decades and reached 107.7 million tonnes per year by 2019 (FAO, 2021). However, the production of synthetic N fertilizers, mainly through the Haber-Bosch process, is highly fossil fuel-dependent (Gilland, 2014), accounting for 1%–2% of the global energy consumption (Schrock, 2006) and nearly 1.0% of global greenhouse gas emissions (Wang et al., 2021). This highlighted the recovery of biobased fertilizers from animal manure processing, with the aim to substitute synthetic N fertilizers, as an important strategy to reconnecting animal husbandry and crop production, thus closing the nutrient loops and contributing to a more sustainable agricultural system (Sigurnjak 2017; Vaneeckhaute et al., 2014). Anaerobic digestion is widely used in manure processing for production of clean energy (biogas) and mitigation of pollution from livestock industry (Yao et al., 2020). The generated organic residue, so-called digestate (DIG), can be used as a good substitute for synthetic fertilizers itself (Möller and Müller, 2012), or be further processed into liquid fraction of digestate (LFD), evaporator concentrate (EVA), ammonium nitrate (AN), ammonium sulphate (AS) and/or ammonia water (AW), using innovative technologies such as N-stripping, evaporation, membrane filtration, etc. (Sigurnjak et al., 2019; Vondra et al., 2019; Brienza et al., 2021). Different combination of technologies in the manure processing could result in various nutrient compositions in the biobased fertilizers, which in turn affects the nutrient availability and agronomic performance after soil application. For example, the higher proportion of readily available N (mineral N/total N ratio) and the lower ratio of carbon (C) over N of DIG and LFD as compared to raw manure would make them better substitutes for synthetic fertilizers (Sigurnjak et al., 2017; Reuland et al., 2021). However, there is still doubt if additional processing of these products could further increase the agronomic value, due to the limited knowledge of the performance of innovative products like EVA and AW.
The agronomic performance of fertilizers is usually evaluated by one-time measurement of the crop biomass or grain yields at harvest, without considering the effect on the in-season dynamics of the crop development. However, unlike the fully plant-available N supplied by synthetic mineral N fertilizers, biobased fertilizers also provide part of N in organic form, which could be available only after N mineralization. Therefore, the N release pattern of biobased fertilizers may have a remarkable effect on crop growth at different growing stages (Mandal et al., 2007; Geng et al., 2019). To comprehensively evaluate the fertilizer value, it is essential to closely monitor crop growth over the growing season. Handheld chlorophyll meter sensors have been used to measure N plant status in the field. However, this is still time-consuming for large-scale applications. Alternatively, remote sensing seems to be a promising technology for large-scale field monitoring (Machwitz et al., 2021) providing information on vegetation responses to, e.g., different fertilization regimes in a timely manner. In this study, the unmanned aerial vehicle (UAV) based multispectral sensors were used to assess plant N and aboveground biomass after the six leaf-collar growth stage (V6) of maize, as previously described by (Saberioon et al., 2014; Pôças et al., 2015). Based on the leaf reflectance of visible light, several vegetation indices (VIs) can be calculated and used as indicators for the N status of the crop, such as visual atmospheric resistance index (VARI), normalized green-red difference index (NGRDI), triangular greenness index (TGI) and green leaf index (GLI). The ability of these VIs to detect and discriminate the N-related changes in leaf reflectance (Hunt et al., 2005; Adão et al., 2017) would present an important advantage over the conventional soil- and plant-based testing to evaluate the agronomic performance of the biobased fertilizers.
Compared to shoots, plant roots exhibit large plasticity to the changes in nutrient availability (Yu et al., 2014) by modifying root growth (Olmo et al., 2016) or root physiological traits (Kou et al., 2015; Robles-Aguilar et al., 2019). When soil N supply is limited, the length of primary, seminal, and nodal roots is increased to explore a larger soil volume and thus increase the spatial N availability (Tian et al., 2006). Therefore, fertilizer additions may induce dramatic changes not only in the soil characteristics but also in the root development. The change in root dynamics and soil properties strongly impact the growth of the shoot (Dieter Jeschke and Hartung, 2000; Peng et al., 2010). However, in situ observation of roots is usually achieved by a destructive sampling of the whole plant and requires heavy labor work for continuously monitoring. Alternatively, the minirhizotrons (fine root observation tubes) and specialized camera equipment have been widely used as a non-destructive visualization technique, allowing the dynamic study of root traits at particular locations in the soil profile (Liedgens and Richner 2001; Zeng et al., 2008; Vamerali et al., 2012; Postic et al., 2019).
The main goal of this study was to evaluate the N fertilizer value of the different biobased fertilizers at field-scale application, with particular emphasis on the novel ones (i.e., EVA and AW) obtained from the evaporation-based nutrient recovery system. Comprehensive monitoring during the growing season of a single-year field trial was achieved by integrating non-invasive techniques, i.e., UAV-based spectrum sensing and minirhizotron with classical soil-plant sampling. We hypothesized that 1) the biobased fertilizers recovered from manure have a high potential to replace the synthetic mineral N fertilizer with no significant impact on the crop growth and biomass yield; 2) the non-invasive techniques reflect high sensitivity on the canopy and root response to in-season N availability, especially during the early growing stages.
2 Materials and methods
2.1 Biobased fertilizers collection and analyses
The biobased fertilizers were obtained from a biogas plant (Waterleau NewEnergy) located in Ieper, Belgium (50°51N, 2°53E). The biogas plant has a yearly capacity of treating 12,000 m3 of biowaste, consisting of 45% pig manure (PM) and 55% other biological waste streams (grain waste, potato waste, glycerin and sludge from industrial wastewater treatment). Briefly, the feedstock is mixed and heated to 40°C before the 30-day anaerobic digestion, followed by a 10-day post-digestion. Next, the generated digestate (DIG) is hygienized (1 h 70°C) and separated by a decanter centrifuge. The resulting liquid fraction of digestate (LFD) goes into a biological aerobic water treatment for a small removal of chemical oxygen demand (COD). In the next step (evaporator), NH3 is transferred to the gas phase and condenses with 1.5% of the water vapor (process water) to form an N-rich ammonia water (AW), while the remaining non-volatile nutrients are concentrated into an evaporator concentrate (EVA) representing 14% of the fed volume. The remaining water vapor is circulated to the aerobic treatment process and mixed with the LFD.
Three sub-samples were taken from the tested biobased fertilizers (PM, DIG, LFD, EVA and AW) and stored in the fridge at 4°C for characterization. Dry matter (DM) content was determined as the residual weight after 24 h drying at 105°C (VITO, 2021). Organic matter content (OM) was measured as mass loss after incineration of the samples for 4 h at 550°C in a muffle furnace. Electrical conductivity (EC) and pH were determined using an Orion-520A (United States) conductivity electrode and pH meter. Total organic C (TOC) was calculated as the difference between total and inorganic carbon determined using a CN analyzer (Skalar Analytical BV, Netherlands). Total N (TN) was determined using Kjeldahl destruction, while NH4+-N and NO3−-N were analyzed from 5 g subsamples extracted by 50 ml 1 M KCl using a continuous flow auto-analyzer (Chemlab System 4, Skalar, Netherlands). After a closed microwave (CEM MARS 5, Belgium) digestion using 13% HNO3, concentrations of total P, K, and S were analyzed using inductively coupled plasma optical emission spectrometry (ICP-OES) (Varian Vista MPX, United States). The characteristics are presented in Table 1.
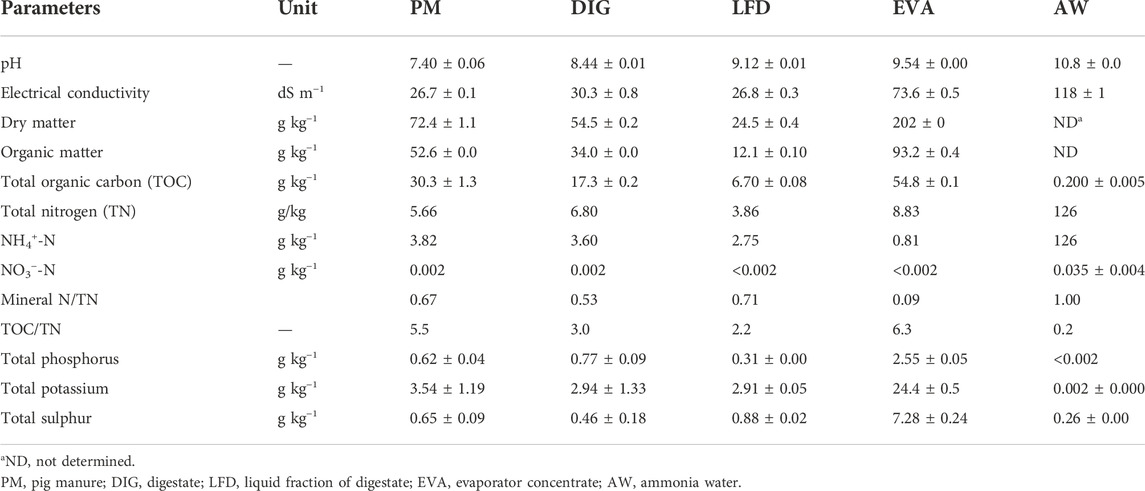
TABLE 1. Characterization of bio-based products (n = 3) on fresh weight (FW) basis.
2.2 Field trial set-up and sampling
The experimental field trial is located at the experimental farm of Ghent University in Oosterzele (Belgium). The soil at surface layer (0–30 cm) had 55% of sand, 6% of clay and 39% of silt, and is classified as sandy-loam (USDA texture triangle). Subsamples of soil before fertilization were collected and air-dried for chemical characterization. The pH-H2O and EC1:5 were determined from 10 g air-dried soil extracted by 50 ml deionized water after 16 h equilibrium, using an Orion-520A (United States) pH and conductivity electrode meter. The determination of OM, TC, TN, mineral N in soil samples followed the same method as in Section 2.1. The characteristics of the tested soil are: pH-H2O = 6.91; EC1:5 = 88 μS cm−1; OM = 3.25%; TC = 1.41%; TN = 0.15%; NH4+-N = 7.8 kg ha−1; NO3−-N = 26.0 kg ha−1 on a fresh weight basis.
The field was divided into 28 plots (6 m × 9 m each), which allowed quadruplicate assessment of 7 treatments following the principle of a completely randomized block design. The N treatments included the abovementioned five biobased fertilizers, a no-N fertilized control (CON) and a synthetic reference using calcium ammonium nitrate (CAN). All the fertilizers were applied at a rate of 105 kg of total N ha−1 (according to the advice from the Belgian soil service). The application rates of total P and total K were compensated by triple superphosphate (TSP, 46% P2O5) and potassium chloride (60% KCl) to the highest supplies as 65 kg P2O5 ha−1 and 252 kg K2O ha−1 provided by EVA treatments. The fertilizers were applied to the field on 12th May and immediately incorporated into the soil to avoid N loss via emission. Silage maize (Z. mays L.) was sowed on 13th May and harvested on 22nd September. The daily average air temperature and precipitation were presented in (Supplementary Figure S1A). The monthly average air temperature and accumulated precipitation during the growing season as well as of the past 20 years were presented in Table 2.
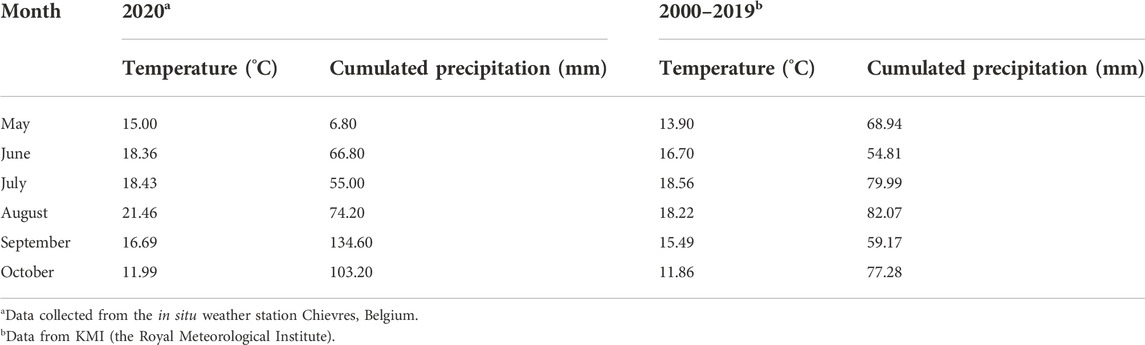
TABLE 2. The average temperature and precipitation during the maize growing season of 2020 and 2000–2019.
Soil samples from each plot were collected from 0–30, 30–60 to 60–90 cm depth at four time-points (T1 = 8 May 2020, T2 = 9 July 2020, T3 = 18 August 2020 and T4 = 22 September 2020, referring to before fertilization, V6, grain filling stage and at harvest, respectively). At T3, five maize plants were randomly harvested from the two central rows of each plot to determine the fresh and dry biomass as well as N concentration in the shoots. These results were used to estimate the biomass yield and N uptake of the whole plot based on the counted density (approximately 80,000 plant ha−1). By T4, all the maize plants in the two central rows of each plot were harvested, and the fresh weight (FW) was determined individually for each plot. The harvested plants were dried at 65°C in a forced-draft oven until dry weights (DW) were constant. Subsamples were taken from the dried materials of each plot and ground to pass through a 2-mm mesh. Total N was measured for each sub-sample using a CN analyzer (Skalar Analytical BV, Netherlands).
2.3 Canopy monitoring with unmanned aerial vehicle based remote sensing
Drone images were taken by a UAV DJI Matrice 100 equipped with an RGB camera (DJI Zenmuse Z3) at the height of 10 m and at three different time points (T2, T3 and T4 as in Section 2.2). The obtained UAV images have a resolution of 72 pixels per inch (PPI). Alignment and geo-referencing of the different UAV images were done with the Pix4D software, and the generated orthophotos were then exported and loaded into the R-software (R Core Team, 2018) for further processing.
Based on the geo-coordinates of the 28 experimental plots, polygons were drawn to retrieve spectral information (red band (670 nm), green band (560 nm) and blue band (480 nm)) from the individual plots. In the next step, the average RGB values were converted to three VIs: the NGRDI (normalized green red difference index) based on the red and green band spectral reflectance and as calculated by Eq. 1; the triangular greenness index (TGI) and the green leaf index (GLI) based on the red, green and blue band spectral reflectance (Eqs 2, 3).
2.4 Underground root scan with minirhizotron camera
After sowing, one PVC tube with a diameter of 6.35 and 120 cm in length was buried at 84 cm depth under an angle of 45° in each plot for root scan analysis. Images of the roots (with a resolution of 102 PPI) were taken by a CID MS 600-002-1005 camera (Sol Franc, Spain) at four different depths (D1 = 0–21 cm, D2 = 21–42 cm, D3 = 42–63 cm, D4 = 63–84 cm) and 3 different time points (T2, T3 and T4). The different root images were analyzed with an in-house developed Python script that can count the number of pixels in the image which are roots. At first, the RGB images are transferred to the HSV color space to appropriately distinguish roots from the soil, and several algorithms are then used to remove small objects and ensure that roots are continuous. The total root length was calculated as Eq. 4:
where the image resolution is 102 PPI and the conversion factor from inch to meter is 0.0254.
2.5 Data analyses
The N use efficiency (NUE) of the synthetic or biobased fertilizers was calculated from the rate of applied N being taken up in the maize crop at harvest (T4), taking into account the N uptake in the control treatment:
Mineral N balance was calculated by considering the soil mineral N (SMN) levels, the initial mineral N applied by fertilizer (prior to any mineralization) and crop N uptake at each sampling moment (T2, T3 and T4), as Eq. 6:
Statistical analyses were performed using SPSS statistical software (version 27.0; SPSS Inc., Chicago, IL, United States). The field observations were first subjected to the Shapiro–Wilk test to check the normality, whereas homogeneity was tested with the Levene test. In the case of a normal distribution (biomass yields, N uptake, SMN, mineral N balance), one-way ANOVA was used to determine their differences between different sampling moments (T2, T3 and T4) and the effect of the applied fertilizers at each sampling moment. When significant differences (p < 0.05) between means were observed, additional post hoc assessment was performed using Fisher’s Least Significant Difference (LSD). For the VIs (i.e., NGRDI, TGI, GLI) and the total root length (TRL), the normality of residuals and the homogeneity of variance were not statistically supported; therefore, the independent-samples Kruskal-Wallis analysis was used, followed by a Dunn post hoc test for multiple comparisons. Additionally, the coefficient of variation was calculated from the ratio of the standard deviation to the mean of each parameter to show the extent of variability among the replicate plots within each treatment. Pearson’s correlations between the observations were determined with data from different sampling moments.
3 Results
3.1 Aboveground biomass yield and N uptake of maize plants
The fresh and dry biomass yields determined at grain filling stages (T3) showed no significant difference among treatments (Figures 1A,B). From T3 to T4, a significant (p < 0.001, data not shown) decrease in FW and the N concentration (% DW) of the aboveground biomass, but a non-significant increase in DW was observed in all the treatments. By T4, the DW yields in PM (16.4 ± 1.1 t ha−1) and LFD (17.0 ± 2.3 t ha−1) were significantly higher than those in CON (13.6 ± 0.5 t ha−1), DIG (13.7 ± 1.0 t ha−1), EVA (14.2 ± 1.3 t ha−1) and AW (13.3 ± 2.1 t ha−1), but not significantly different compared to the synthetic reference, i.e., CAN (15.1 ± 1.1 t ha−1) (Figure 1B). The N concentration (% DW) of maize shoots was also significantly higher in PM, LFD and AW than in CON at T3 and T4 (Figure 1C). Similar to the trend for biomass yield, the LFD treatment resulted in the highest mean value in crop N uptake (200 ± 37 kg ha−1), significantly higher than CON (135 ± 5 kg ha−1), DIG (140 ± 19 kg ha−1), EVA (155 ± 14 kg ha−1) and AW (159 ± 31 kg ha−1) but insignificantly compared to CAN (172 ± 8 kg ha−1) and PM (182 ± 10 kg ha−1) (Figure 1D).
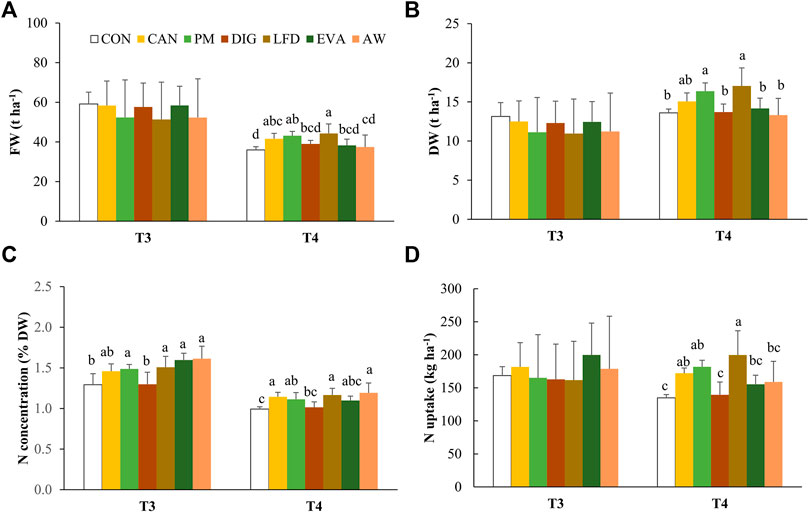
FIGURE 1. The values of mean ± standard deviation (n = 4) for (A) fresh weight (FW), (B) dry weight (DW), (C) the N concentration (% DW) and (D) the N uptake (kg ha−1) of maize crop at sampling moments T3 (18 August 2020) and T4 (22 September 2020). The lowercase and uppercase letters refer to the statistical difference between treatments at T3 and T4, respectively, using one-way ANOVA and Fisher’s Least Significant Difference (LSD) post-hoc pairwise comparisons at a 5% level. CON, no-N control; CAN, calcium ammonium nitrate; PM, pig manure; DIG, digestate; LFD, liquid fraction of digestate; EVA, evaporator concentrate; AW, ammonia water.
3.2 Dynamics of vegetation indices obtained from unmanned aerial vehicle-based spectrum sensing
Figure 2 presented the distribution of experimental plots (A) and the detected NGRDI value (B) at T2, indicating an uneven germination and growth of maize plant across the experimental treatments and replicates. Over the three sampling moments (T2, T3 and T4), no significant difference in the detected VIs (NGRDI, TGI, GLI) was observed between treatments (Figure 3). However, the mean values of all the three VIs detected at T2 were lower in CON treatment (no N applied) than in the fertilized treatments (Figure 3A). From T2 to T3, the value of NGRDI increased significantly in CON, CAN and PM treatments (Figure 3A), while significant increases of TGI and GLI were only observed in the CON treatment (Figures 3B,C). The values of the VIs increased significantly from T3 to T4 in all treatments except the NGRDI values in CON, EVA and AW treatments.
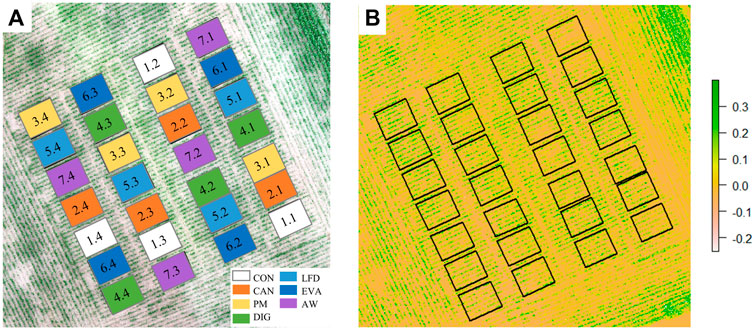
FIGURE 2. Field maps for the distribution of experimental treatments and replicates (A) and the detected NGRDI value at T2 (B).
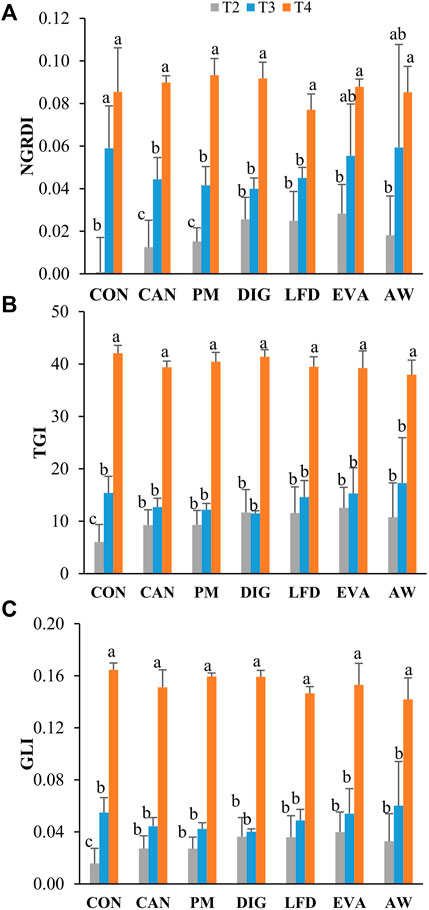
FIGURE 3. Values of NGRDI (A), TGI (B) and GLI (C) observed at sampling moments T2 (9 July 2020), T3 (18 August 2020) and T4 (22 September 2020). The lowercase letters refer to the statistical difference between observations at T2, T3 and T4 under each treatment, analyzed using independent-samples Kruskal-Wallis test followed by a Dunn post-hoc pairwise comparisons at a 5% level. CON, no-N control; CAN, calcium ammonium nitrate; PM, pig manure; DIG, digestate; LFD = liquid fraction of digestate, EVA, evaporator concentrate; AW, ammonia water.
3.3 Development of maize root as monitored by minirhizotron technique
The observed TRL by the minirhizotron technique showed high variations among replicates (Figure 4), with a coefficient of variation from 15% up to 170%. For all the treatments, TRLs were higher in the topsoil layers (0–42 cm) than in deeper soil (42–84 cm), with averagely 35% of TRL detected at 0–21 cm and 30% at 21–42 cm depth. The average values of TRL in the surface soil (0–21 cm) were highest in CON and CAN treatments over the growing season, which were significantly higher than PM (at T3 and T4), DIG (at T3) and AW treatments (at T2, T3 and T4). However, these significant differences disappeared in deeper soil layers (21–84 cm). Over the growing season, all treatments revealed increases of the TRLs at 0–84 cm depth, especially in DIG, EVA and AW treatments from T2 to T3, which averagely increased by 346%, 194%, and 125%, respectively. However, due to the relatively high deviation, no significance (p > 0.05) could be detected between sampling moments.
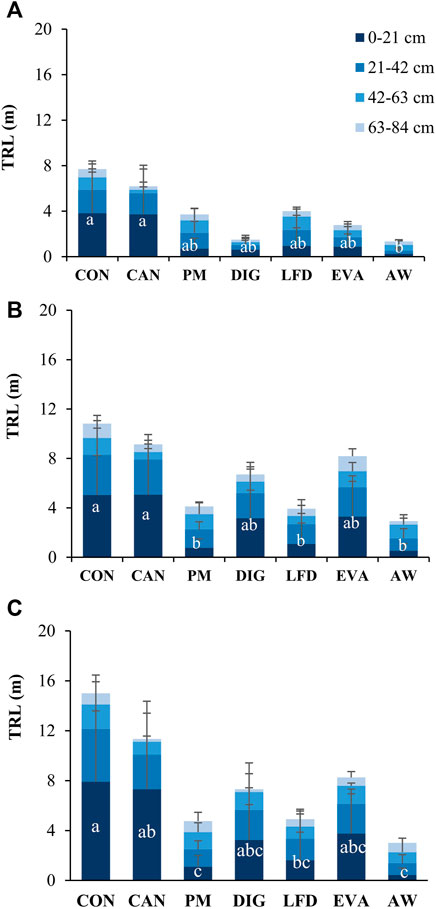
FIGURE 4. Total root length (TRL, mean ± standard deviation, m, n = 4) at different soil depth (0–21, 21–42, 42–63, 63–84 cm) observed at sampling moments (A) T2 (9 July 2020), (B) T3 (18 August 2020) and (C) T4 (22 September 2020). The lowercase letters refer to the statistical difference of TRL at 0–21 cm depth between treatments using independent-samples Kruskal-Wallis test followed by a Dunn post-hoc pairwise comparisons at a 5% level. no significant difference was observed at 21–42, 42–63, or 63–84 cm depth. CON, no-N control; CAN, calcium ammonium nitrate; PM, pig manure; DIG, digestate; LFD, liquid fraction of digestate; EVA, evaporator concentrate; AW, ammonia water.
3.4 Dynamics of soil mineral N levels
The soil sampling and measurements before fertilization (T1) showed no significant difference among treatments in the soil mineral N (SMN) levels at all three depths (Figure 5A). From T1 to T2, increases of SMN (by 18–78 kg ha−1) were observed in all treatments at 0–30 cm and also in the fertilized treatments at 30–60 cm (by 4–28 kg ha−1) (Figures 5A,B), but significant difference between treatments was only observed at the surface soil (0–30 cm). Consequently, by T2, the SMN levels at 0–60 cm were significantly higher in CAN (162 ± 28 kg ha−1) and LFD (133 ± 45 kg ha−1) than in CON (65 ± 21 kg ha−1), but no significance was observed when comparing PM, DIG, EVA and AW treatments with CON treatment. From T2 to T3, the SMN levels at 0–30 cm decreased by 2–50 kg ha−1, while at 60–90 cm, they increased by 4–38 kg ha−1 (Figures 5B,C). By harvest (T4), the application of DIG (59 ± 14 kg ha−1), EVA (64 ± 7 kg ha−1) and AW (62 ± 9 kg ha−1) resulted in significantly higher SMN at 0–30 cm compared to CON (43 ± 11 kg ha−1) (Figure 5D). While at deeper soil (30–60 cm), significantly higher SMN was only observed in EVA (38 ± 17 kg ha−1) compared to CON (18 ± 5 kg ha−1) (Figure 5D). No significant difference was observed among treatments in the SMN at 60–90 cm depth.
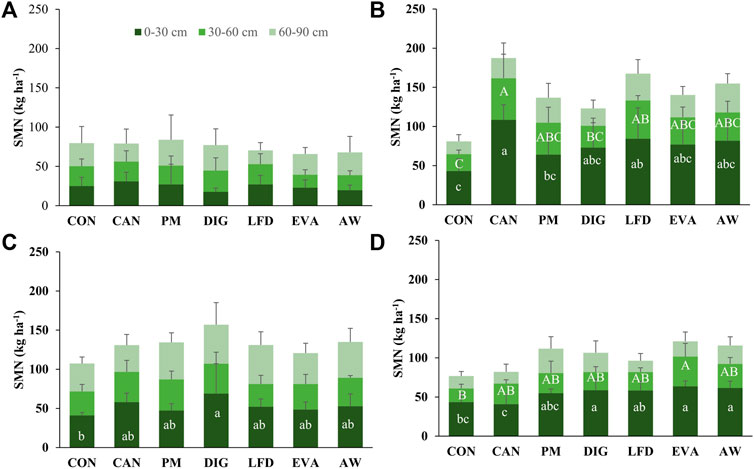
FIGURE 5. Soil mineral N (SMN, mean ± standard deviation, kg ha−1, n = 4) at different soil depths (0–30, 30–60, 60–90 cm) observed at sampling moments (A) T1 (8 May 2020), (B) T2 (9 July 2020), (C) T3 (18 August 2020) and (D) T4 (22 September 2020). The lowercase and uppercase letters refer to the statistical difference of SMN between treatments at 0–30 and 30–60 cm depth, respectively, using one-way ANOVA and Fisher’s Least Significant Difference (LSD) post-hoc pairwise comparisons at a 5% level. no significant difference was observed at 60–90 cm depth. CON, no-N control; CAN, calcium ammonium nitrate; PM, pig manure; DIG, digestate; LFD, liquid fraction of digestate; EVA, evaporator concentrate; AW, ammonia water.
Table 3 revealed that treatment using EVA had a significantly positive mineral N balance (as opposed to zero, which indicates equilibrium) while AW treatment resulted in a significantly negative balance at T2. For T3 and T4, all the treatments showed a positive mineral N balance, with EVA having significantly higher values than CON, CAN, DIG and AW treatments. For fertilized treatments, NUE was calculated at T4, being the highest in LFD (62% ± 35%) and the lowest in DIG (4% ± 18%). No significant difference was observed when comparing the NUE of biobased treatments with CAN (35% ± 8%).
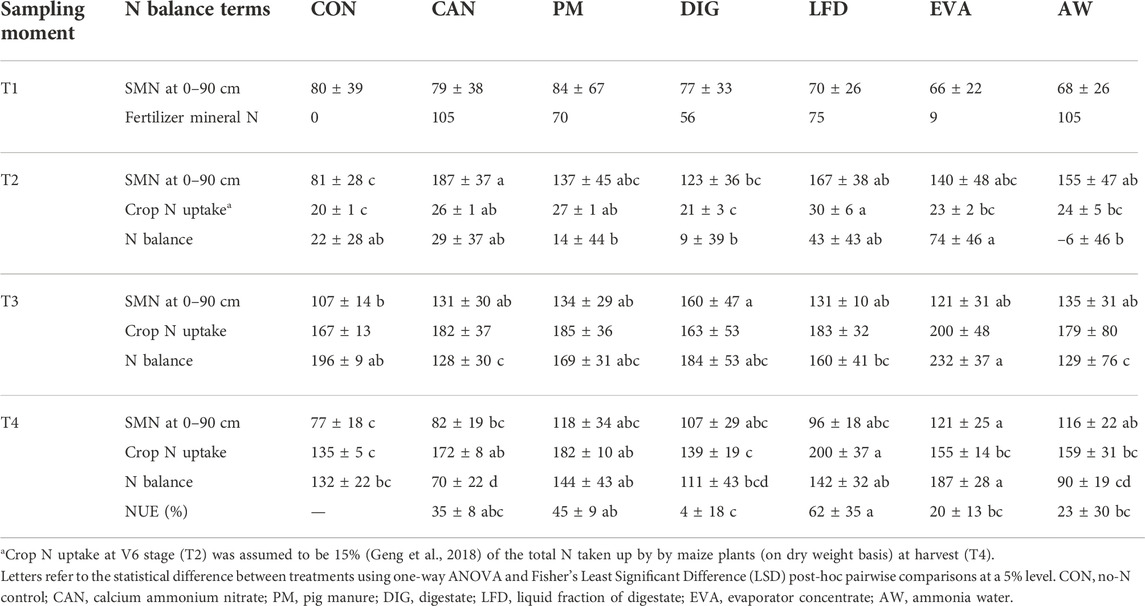
TABLE 3. The terms of the mineral N balance (mean ± standard deviation, kg ha−1, n = 4) at sampling moments T1 (8 May 2020), T2 (9 July 2020), T3 (18 August 2020) and T4 (22 September 2020) and the nitrogen use efficiency (NUE, mean ± standard deviation, n = 4) at T4.
3.5 Correlations between canopy and ground level indicators
Pearson’s correlations were calculated between the canopy and ground level indicators by considering all the measurements at the three sampling moments, T2, T3 and T4 (Figure 6). The TRLs at T2, T3 and T4 showed a significantly positive correlation with the FW (r = 0.378–0.510, p < 0.05) and DW (r = 0.392–0.497, p < 0.05) observed at T3. However, when correlated to the FW and DW observed at T4, the coefficient became negative, and the significance disappeared. There is a lack of significance between the correlations of FW or DW with the VIs at any sampling moment. Instead, significant and positive correlations were observed among the crop N concentration at T4 and SMN at T2 (r = 0.584, p < 0.01) the TGI (r = 0.405, p < 0.05) and GLI (r = 0.394, p < 0.05) at T3, while significant and negative correlations were observed between the crop N concentration at T4 and GLI (r = −0.442, p < 0.01) at T4The TRLs always showed a negative correlation with SMN, but no significance (p > 0.05) was observed at any sampling moment.
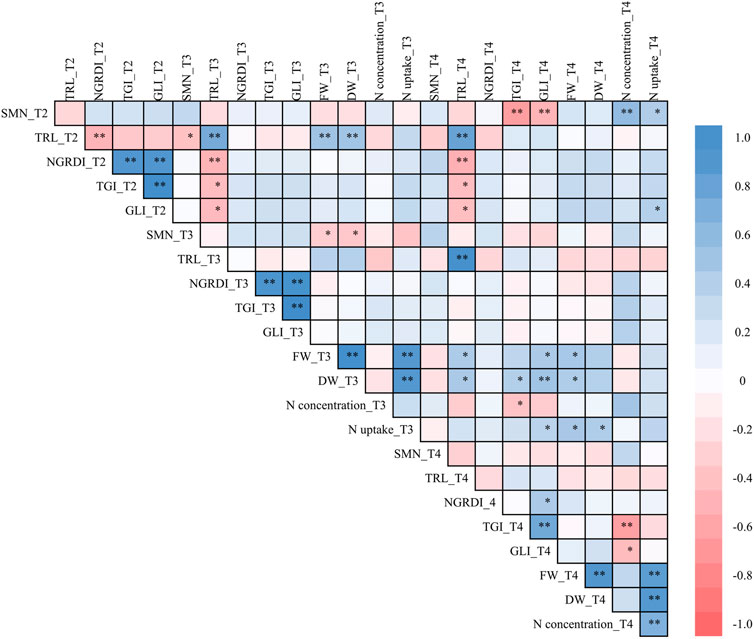
FIGURE 6. Pearson’s correlations between observations combing the three sampling moments T2 (9 July 2020), T3 (18 August 2020) and T4 (22 September 2020). *p < 0.05, **p < 0.01, ***p < 0.001. FW, fresh weight (t ha−1) of the harvested biomass; DW, dry weight (t ha−1) of the harvested biomass; N concentration, crop N concentration (% DW) in the harvested biomass; N uptake, crop N uptake (kg ha−1) in the harvested biomass; SMN, the total soil mineral N content (kg ha−1) at 0–90 cm soil depth; NGRDI, normalized green-red difference index; TGI, triangular greenness index; GLI, greenness leaf index; TRL, the total root length (m) at 0–84 cm soil depth.
4 Discussion
4.1 Potential benefit of liquid biobased fertilizers during an early-season drought
Under warm, moist conditions, maize seeds will germinate and emerge within 4–6 days after sowing (Nleya et al., 2016). However, during the germination stage (May 2020) of this field experiment, the precipitation (6.80 mm) was only 10% of the average precipitation (68.94 mm) in May observed over the last 20 years (2000–2019, Table 2). This low precipitation and the associated low soil water content (averagely 11% at 0–30 cm soil depth) resulted in delayed and heterogeneous germination in all the treatments (Figure 2B), which could have led to the high variations in the detected biomass (coefficient of variation up to 44%, Figure 1A,B) and total root length (TRL) over the whole growing season (coefficient of variation from 15% to 170%, Figure 4). Furthermore, very low soil moisture must also have inhibited soil microbial activities resulting in reduced N mineralization from soil organic matter (SOM) (Mohammed et al., 2013). In the meantime, the N losses through denitrification and leaching were assumed to be negligible (0 < 10 kg ha−1 estimated from calculations using the Daisy model, results shown in Supplementary Figure S1B). This was confirmed by the equilibrium of the mineral N balance in CON treatment (no N applied, 22 ± 28 kg ha−1) at T2 (Table 3). Therefore, the significant increase in mineral N of EVA treatment (74 ± 46 kg ha−1) could be mainly attributed to the mineralization of organic N from this product. While in AW treatment, the significant loss (−6 ± 46 kg ha−1) of mineral N probably resulted from significant NH3 volatilization shortly after application due to the high pH (10.8) of this product.
In CON treatment (no N applied), since the SOM decomposition was the only N source for maize plants, the root system had to search for N by developing more fine roots before reaching deeper soil (Jackson and Bloom 1990; Robinson et al., 1994; Liu et al., 2009), which resulted in higher detected TRL in CON treatment as compared to other treatments, especially in topsoil (0–42 cm) (Figures 4A,B). For the CAN treatment which supplied N in solid form (granules), the low soil moisture at the early stage probably limited the mobility of the applied N towards the rooting zone. This means though a significantly higher SMN than CON was reached at 0–30 cm (Figure 5B), the largest part of it probably remained in the soil layer where it was applied (0–15 cm), thus reducing the N availability for maize plants. In contrast, plant-available N in the biobased fertilizers was applied in liquid form, it could be more easily filtered through soil particles (Möller and Müller 2012) and move towards deeper soil to satisfy the demand of plants at the early growth stages. Consequently, TRLs in biobased treatments were lower than in CON and CAN treatments (Figures 4A,B). However, higher TRLs achieved at the early stage most likely led to a higher biomass accumulation during the vegetative stage, as revealed by the significantly positive correlation between TRLs at T2 and T3 with the FW and DW at T3 (r = 0.378–0.510, p < 0.05, Figure 6).
Given that by V6 the root system of maize is well-developed and distributed in the soil (Nleya et al., 2016), the notable increases of TRLs from T2 to T3 under DIG, EVA and AW treatments (Figures 4A,B) suggested that the maize plants in those plots might not reach the V6 stage by T2, meaning a delayed growth of maize plant under the application of DIG, EVA and AW. However, this delay cannot be fully explained by the N availability at the early stage, as no significant correlation was observed between the TRL and SMN by then. It should be emphasized that the dynamics of root length during the growing season were monitored from one single pre-set PVC tube in each plot, which only detected the roots growing through a limited contact area between the minirhizotron and the soil. Possibilities of under-or over-estimation on the TRL may arise from insufficient soil-minirhizotron contact (allowing for preferential root growth in gaps), tracking of roots along vertical or angled minirhizotrons, or alterations in the immediate environment of the minirhizotron (Wiesler and Horst 1994; Liedgens and Richner 2001).
4.2 Vegetation indices as indicators for crop stress and growth
The water and N stress that maize plants were experiencing may also reflect in the value of VIs detected by UAV-based remote sensing. For example, the NGRDI is usually used to estimate the vegetation fraction (expressed as the percentage of the reference area covered by the ground projection of the green vegetation; Gitelson et al., 2002; Wan et al., 2018), and it was identified by Yang et al. (2020) as an efficient non-destructive indicator with strong prediction values (R2 = 0.69–0.89) for water use efficiency. In this study, the values (−0.01 to 0.04) of NGRDI by T2 ranged from −0.01 to 0.04, indicating a vegetation fraction at 25%–55%, according to Gitelson et al. (2002). These values were lower than the value (60%–90%) observed by Pôças et al. (2015) under similar conditions (i.e., sowing density, growth stage and weather), probably due to a delayed growth of maize plants under water stress in this study. Looking into different treatments, the lower values of NGRDI, TGI and GLI observed by T2 in CON treatment (no N applied) than in the fertilized treatments (Figures 3A–C) may indicate a delayed growth of maize plants in CON treatment due to a lower N availability. The GLI was reported to be strongly correlated to leaf chlorophyll concentration (Saberioon et al., 2014). However, the N uptake in maize plant before the V6 stage was relatively low (<15%, Geng et al., 2018) which led to undetectable variations in leaf chlorophyll concentration (Hunt et al., 2005) and thus no significant difference in GLI of this study between treatments by T2 (Figure 3C).
The relationship between VIs and canopy status was found to be strongly influenced by the phenological stage of maize plants (Burkart et al., 2018). During the initial stage when the maize leaves did not cover the whole plots, the VI values calculated from UAV images may be influenced by the background such as soil and other disturbances even though methods had been adopted to eliminate the impacts (Meyer and Neto, 2008; Jin et al., 2017; Liu et al., 2017). Therefore, it was suggested to integrate the VI acquired at important growth stages of maize which can reflect more precisely the temporal dynamic changes of growth conditions and achieve the highest precision for yield prediction (Guo et al., 2020). With the rapid accumulation of biomass and N in maize plants from T2 (V6) to T3 (grain filling), the values of the three detected VIs increased in all treatments (Figure 3). The significant increases of NGRDI in CON, CAN, and PM treatments may be attributed to the higher TRLs of maize plants in these treatments (Figure 4), which enabled a higher rate of nutrient uptake and biomass accumulation (Dieter Jeschke and Hartung, 2000; Hong-Bo et al., 2012). Unlike NGRDI, significant increases of TGI and GLI were only observed in the CON treatments (Figures 2B,C), which may suggest a higher sensitivity of NGRDI than TGI and GLI at the early stage before canopy closure. From T3 to T4, accumulation of chlorophyll, xanthophyll and carotenoids pigments in maize leaves resulted in a significant increase in the green light reflectance and a significant decrease in blue light reflectance (Subedi and Ma, 2005) which eventually appeared as significantly increased values of NGRDI, TGI and GLI from T3 to T4 (Figure 3).
4.3 The early-season N availability at root zone resulted in late-season luxury N uptake
By grain filling (T3), biomass accumulation and N uptake in maize plants have reached over 80% of the total amount in the harvested crop. From then onwards, variations in biomass (Figures 1A,B) and crop N concentration (Figures 1C,D) can be attributed mainly to the translocation of non-structural carbohydrates and nutrients from the stem and leaves to the ear (Center et al., 1970; Perry and Compton, 1977; Swank et al., 1982; Koca and Erekul, 2016). In the meantime, the detected N concentration of the maize plants was higher (significantly in PM, LFD, EVA and AW at T3 and in CAN, PM, LFD and AW at T4) in the fertilized treatments than in the CON treatment, indicating a potential for luxury N uptake under fertilization (Nasielski et al., 2019). Moreover, the N concentration in maize plants detected by T4 was significantly correlated to the TGI, and GLI observed at T3 and T4. It is, therefore, reasonable to hypothesize that the sufficient N and water supply during the late season of this field study may have enhanced the “stay-green” effect—the ability of the maize crop to continue taking up N late in the growing season, thus maintaining N concentrations in leaves and a greater photosynthetic capacity (Rajcan and Tollenaar, 1999; Subedi and Ma, 2005). Linking to the significantly positive correlation (r = 0.584, p < 0.01) between the crop N concentration at T4 and the SMN at T2 (Figure 6), it suggested that when the N supply is sufficient, a higher N availability at early growing stages tends to result in luxury N uptake in maize plants. Therefore, the early-stage SMN level could be a good predictor for crop N uptake in late seasons. However, this luxury N uptake does not necessarily result in high biomass yields, as no significant difference in DW was detected in CAN and AW treatments when compared to CON treatment (Figure 1B).
Regardless, application of biobased fertilizers (except DIG) resulted in no significant difference in either biomass (FW, DW) or crop N uptake as compared to CAN treatment, indicating the high potential of these biobased fertilizers as substitutes for synthetic mineral N fertilizers in maize cultivation. Given a certain application rate, luxury N uptake implies reduced N loss and increased NUE (Dawson et al., 2008; Li et al., 2018). By T4, the NUE obtained in PM and LFD treatments were higher than values from literature while for CAN the obtained NUE in this study was lower. For example, in a 2-year field maize experiment (Montanaso Lombardo, Italy) by Cavalli et al. (2014), the NUE of LFD (20%–25%) was lower as compared to that of ammonium sulfate as synthetic reference (68%–82%). Velthof and Rietra (2019) observed a NUE at 30%–39% for incorporated pig slurry, while CAN as synthetic reference reached a NUE of 51%. A 1-year field trial on perennial ryegrass (Lolium perenne L.) by Klop et al. (2012) also showed similar trend, with a NUE 24%–48% for pig slurry and 62%–64% for CAN. So far as we are aware, this is the first time for the two novel products: EVA and AW to be demonstrated at field-scale, thus no literature value is available yet.
4.4 Impact of climate and native soil on the single-year application
The large positive mineral N balance at T3 and T4 for all treatments, including CON (on average 70–232 kg ha−1, Table 3), suggested a main contribution of the N mineralization from SOM in maintaining the high SMN levels and in the meantime satisfying the crop N demand. The native soil N supply from this field trial, calculated as the crop N uptake in CON treatment, was an averagely of 83% (60%–113%) of the crop N uptake in fertilized treatments, which is in line with the reported 80%–85% of soil-derived N by Joris et al. (2020) using 15N labelled technology. The large soil N supply could have met the majority of the crop N demand during the growing season, thus masking the yield contribution of the fertilizers. Over the growing season of this field study, the SMN remained high (on average 61–162 kg ha−1 at 0–60 cm) in all treatments, which was higher than the optimal levels (around 50.4 kg ha−1) for maize cultivation, as suggested by Peng et al. (2013). Although the measured SMN in the topsoil at T2 may not realistically reflect the N availability for roots due to the low precipitation at that moment, it is foreseen that given adequate precipitation in the following months (i.e., August and September 2020 in this study, Table 2), the N remaining in the top layers could become available to maize roots and support the further development of the plants.
Additionally, given heavy precipitation happens during the fallow season, these high levels of SMN postharvest may indicate high risk of nitrate leaching (Supplementary Figure S1B) and thus end up as pollution of the groundwater (Díez et al., 2004; De Notaris et al., 2018). Compared to CON, the application of EVA and AW resulted in significant increase in the postharvest SMN (Table 3), however, no significant difference was observed in other biobased treatments (i.e., PM, DIG, LFD) when compared to either CON or CAN. It suggested that, for nutrient-saturated regions, the substitution of synthetic fertilizers with biobased fertilizers itself may not be sufficient to address the environmental issue of N losses. In such a case, the inclusion of catch crops after harvest of the main crop must be considered to reduce post-harvest N leaching (Constantin et al., 2011; De Notaris et al., 2018; Böldt et al., 2021) and help close the N cycle.
Overall, the results of this study reflected the agronomic performance of biobased fertilizers as compare to synthetic N fertilizer, i.e., CAN within one growing season. However, single-year application may not realistically reflect the fertilizer value of biobased fertilizers in long-term application, as the impact of historical practices (Tiessen et al., 2014; de França et al., 2021) and climate conditions (Hernández et al., 2013) may be more pronounced than the effect of fertilizers during short-term application. Moreover, as compared to synthetic fertilizers, biobased fertilizers might lead to a significant residue effect after repeated application (Hernández et al., 2013; Tewolde et al., 2016; Yan et al., 2020). Further field demonstration on multiple sites and over a long-term period is warranted to reach a more comprehensive and more representative evaluation of these biobased fertilizers.
5 Conclusion
The biobased fertilizers (PM, LFD, EVA and AW, except DIG) tested in this study resulted in comparable biomass and N yields as CAN did in the maize cultivation, showing a high potential as substitutes for synthetic mineral N fertilizers. Furthermore, given the dry weather during the early growing season, biobased fertilizers which supply N in liquid form seemed to maintain a higher N availability at the rooting zone than the application of CAN in solid form, as revealed by the early-season TRL detected by minirhizotron. This makes these biobased fertilizers even promising in the light of global warming, which increases the occurrence probability of droughts. Moreover, the higher N availability at the early stage of maize was likely to cause a luxury N uptake at the latter stages. Though the soil N supply in this experimental site was relatively high, which to some extent overlaid the variation induced by the compositional differences among the fertilizers, the observations in this field study, especially combining the non-invasive techniques (i.e., minirhizotron and UAV-based spectrum sensing) in the monitoring of in-season crop N status, contributed to the overall understanding of the agronomic performance of the novel fertilizers recovered from manure processing.
Data availability statement
The original contributions presented in the study are included in the article/Supplementary Material, further inquiries can be directed to the corresponding author.
Author contributions
HL: conceptualization, methodology, formal analysis, investigation, data curation, visualization, writing—original draft preparation and Editing. KD: methodology, formal analysis, investigation, data curation, writing—reviewing and editing. SL: methodology, formal analysis, investigation, data curation, writing—reviewing and editing. IS: conceptualization, methodology, supervision, writing—reviewing and editing. AR-A: conceptualization, methodology, supervision, writing—reviewing and editing. EM: conceptualization, supervision, writing—reviewing and editing, project administration. SD: conceptualization, supervision, writing—reviewing and editing. GH: conceptualization, resources, writing—reviewing and editing. EM: conceptualization, supervision, writing—reviewing and editing, funding acquisition, resources. All authors have read and agreed to the published version of the manuscript.
Funding
The research is done as a part of the Nutri2Cycle project that receives funding from the European Union’s Horizon 2020 Framework Programme for Research and Innovation under Grant Agreement No. 773682.
Conflict of interest
The authors declare that the research was conducted in the absence of any commercial or financial relationships that could be construed as a potential conflict of interest.
Publisher’s note
All claims expressed in this article are solely those of the authors and do not necessarily represent those of their affiliated organizations, or those of the publisher, the editors and the reviewers. Any product that may be evaluated in this article, or claim that may be made by its manufacturer, is not guaranteed or endorsed by the publisher.
Supplementary material
The Supplementary Material for this article can be found online at: https://www.frontiersin.org/articles/10.3389/fenvs.2022.988932/full#supplementary-material
References
Adão, T., Hruška, J., Pádua, L., Bessa, J., Peres, E., Morais, R., et al. (2017). Hyperspectral imaging: A review on UAV-based sensors, data processing and applications for agriculture and forestry. Remote Sens. 9 (11), 1110. doi:10.3390/rs9111110
Böldt, M., Taube, F., Vogeler, I., Reinsch, T., Kluß, C., and Loges, R. (2021). Evaluating different catch crop strategies for closing the nitrogen cycle in cropping systems—Field experiments and modelling. Sustainability 13 (1), 394. doi:10.3390/su13010394
Brienza, C., Sigurnjak, I., Meier, T., Michels, E., Adani, F., Schoumans, O., et al. (2021). Techno-economic assessment at full scale of a biogas refinery plant receiving nitrogen rich feedstock and producing renewable energy and biobased fertilisers. J. Clean. Prod. 308, 127408. doi:10.1016/j.jclepro.2021.127408
Burkart, A., Hecht, V. L., Kraska, T., and Rascher, U. (2018). Phenological analysis of unmanned aerial vehicle based time series of barley imagery with high temporal resolution. Precis. Agric. 19 (1), 134–146. doi:10.1007/s11119-017-9504-y
Cavalli, D., Cabassi, G., Borrelli, L., Fuccella, R., Degano, L., Bechini, L., et al. (2014). Nitrogen fertiliser value of digested dairy cow slurry, its liquid and solid fractions, and of dairy cow slurry. Ital. J. Agron. 9 (2), 71–78. doi:10.4081/ija.2014.567
Center, C. F., Jones, G. D., and Carter, M. T. (1970). Dry matter accumulation and depletion in leaves, stems, and ears of maturing maize. Agron. J. 62 (4), 535–537. doi:10.2134/agronj1970.00021962006200040033x
Constantin, J., Beaudoin, N., Laurent, F., Cohan, J. P., Duyme, F., and Mary, B. (2011). Cumulative effects of catch crops on nitrogen uptake, leaching and net mineralization. Plant Soil 341 (1), 137–154. doi:10.1007/s11104-010-0630-9
Dawson, J. C., Huggins, D. R., and Jones, S. S. (2008). Characterizing nitrogen use efficiency in natural and agricultural ecosystems to improve the performance of cereal crops in low-input and organic agricultural systems. Field Crops Res. 107 (2), 89–101. doi:10.1016/j.fcr.2008.01.001
de França, A. A., von Tucher, S., and Schmidhalter, U. (2021). Effects of combined application of acidified biogas slurry and chemical fertilizer on crop production and N soil fertility. Eur. J. Agron. 123, 126224. doi:10.1016/j.eja.2020.126224
De Notaris, C., Rasmussen, J., Sørensen, P., and Olesen, J. E. (2018). Nitrogen leaching: A crop rotation perspective on the effect of N surplus, field management and use of catch crops. Agric. Ecosyst. Environ. 255, 1–11. doi:10.1016/j.agee.2017.12.009
Dieter Jeschke, W., and Hartung, W. (2000). Root-shoot interactions in mineral nutrition. Plant Soil 226 (1), 57–69. doi:10.1023/A:1026431408238
Díez, J. A., Hernaiz, P., Muñoz, M. J., De la Torre, A., and Vallejo, A. (2004). Impact of pig slurry on soil properties, water salinization, nitrate leaching and crop yield in a four-year experiment in Central Spain. Soil Use Manag. 20 (4), 444–450. doi:10.1111/j.1475-2743.2004.tb00395.x
FAO (2021). FAOSTAT. Rome, Italy: Food and Agriculture Organization of the United Nations. Available at: https://www.fao.org/faostat/en/#data/RFN (Last accessed July 6, 2022).
Geng, Y., Cao, G., Wang, L., and Wang, S. (2019). Effects of equal chemical fertilizer substitutions with organic manure on yield, dry matter, and nitrogen uptake of spring maize and soil nitrogen distribution. PloS one 14 (7), e0219512. doi:10.1371/journal.pone.0219512
Geng, Y., Cao, G., and Wang, S. (2018). Nitrogen accumulation characteristics of high-yield spring maize in Northeast China. Int. J. Plant Prod. 12 (3), 149–157. doi:10.1007/s42106-018-0015-1
Gilland, B. (2014). Is a haber-bosch world sustainable? Population, nutrition, cereals, nitrogen and environment. J. Soc. Polit. Econ. Stud. 39 (2), 166–185. Available on https://www.proquest.com/scholarly-journals/is-haber-bosch-world-sustainable-population/docview/1552717263/se-2. (Accessed November 12, 2022).
Gitelson, A. A., Kaufman, Y. J., Stark, R., and Rundquist, D. (2002). Novel algorithms for remote estimation of vegetation fraction. Remote Sens. Environ. 80 (1), 76–87. doi:10.1016/S0034-4257(01)00289-9
Guo, Y., Wang, H., Wu, Z., Wang, S., Sun, H., Senthilnath, J., et al. (2020). Modified red blue vegetation index for chlorophyll estimation and yield prediction of maize from visible images captured by UAV. Sensors 20 (18), 5055. doi:10.3390/s20185055
Hernández, D., Polo, A., and Plaza, C. (2013). Long-term effects of pig slurry on barley yield and N use efficiency under semiarid Mediterranean conditions. Eur. J. Agron. 44, 78–86. doi:10.1016/j.eja.2012.09.001
Hong-Bo, L. I., Zhang, F. S., and Jian-Bo, S. H. E. N. (2012). Contribution of root proliferation in nutrient-rich soil patches to nutrient uptake and growth of maize. Pedosphere 22 (6), 776–784. doi:10.1016/S1002-0160(12)60063-0
Hunt, E. R., Cavigelli, M., Daughtry, C. S., Mcmurtrey, J. E., and Walthall, C. L. (2005). Evaluation of digital photography from model aircraft for remote sensing of crop biomass and nitrogen status. Precis. Agric. 6 (4), 359–378. doi:10.1007/s11119-005-2324-5
Jackson, L. E., and Bloom, A. J. (1990). Root distribution in relation to soil nitrogen availability in field-grown tomatoes. Plant Soil 128 (2), 115–126. doi:10.1007/BF00011100
Jin, X., Liu, S., Baret, F., Hemerlé, M., and Comar, A. (2017). Estimates of plant density of wheat crops at emergence from very low altitude UAV imagery. Remote Sens. Environ. 198, 105–114. doi:10.1016/j.rse.2017.06.007
Joris, H. A. W., Vitti, A. C., Ferraz-Almeida, R., Otto, R., and Cantarella, H. (2020). Long-term N fertilization reduces uptake of N from fertilizer and increases the uptake of N from soil. Sci. Rep. 10 (1), 18834–18839. doi:10.1038/s41598-020-75971-0
Klop, G., Velthof, G. L., and Van Groenigen, J. W. (2012). Application technique affects the potential of mineral concentrates from livestock manure to replace inorganic nitrogen fertilizer. Soil Use Manag. 28 (4), 468–477. doi:10.1111/j.1475-2743.2012.00434.x
Koca, Y. O., and Erekul, O. (2016). Changes of dry matter, biomass and relative growth rate with different phenological stages of corn. Agric. Agric. Sci. Procedia 10, 67–75. doi:10.1016/j.aaspro.2016.09.015
Kou, L., Guo, D., Yang, H., Gao, W., and Li, S. (2015). Growth, morphological traits and mycorrhizal colonization of fine roots respond differently to nitrogen addition in a slash pine plantation in subtropical China. Plant Soil 391 (1-2), 207–218. doi:10.1007/s11104-015-2420-x
Li, T., Zhang, W., Yin, J., Chadwick, D., Norse, D., Lu, Y., et al. (2018). Enhanced-efficiency fertilizers are not a panacea for resolving the nitrogen problem. Glob. Chang. Biol. 24 (2), e511–e521. doi:10.1111/gcb.13918
Liedgens, M., and Richner, W. (2001). Minirhizotron observations of the spatial distribution of the maize root system. Agron. J. 93 (5), 1097–1104. doi:10.2134/agronj2001.9351097x
Liu, J., Chen, F., Olokhnuud, C., Glass, A. D. M., Tong, Y., Zhang, F., et al. (2009). Root size and nitrogen-uptake activity in two maize, Zea mays) inbred lines differing in nitrogen-use efficiency. Z. Pflanzenernahr. Bodenk. 172 (2), 230–236. doi:10.1002/jpln.200800028
Liu, S., Baret, F., Andrieu, B., Burger, P., and Hemmerle, M. (2017). Estimation of wheat plant density at early stages using high resolution imagery. Front. Plant Sci. 8, 739. doi:10.3389/fpls.2017.00739
Machwitz, M., Pieruschka, R., Berger, K., Schlerf, M., Aasen, H., Fahrner, S., et al. (2021). Bridging the gap between remote sensing and plant phenotyping-challenges and opportunities for the next generation of sustainable agriculture. Front. Plant Sci. 12, 749374. doi:10.3389/fpls.2021.749374
Mandal, A., Patra, A. K., Singh, D., Swarup, A., and Masto, R. E. (2007). Effect of long-term application of manure and fertilizer on biological and biochemical activities in soil during crop development stages. Bioresour. Technol. 98 (18), 3585–3592. doi:10.1016/j.biortech.2006.11.027
Meyer, G. E., and Neto, J. C. (2008). Verification of color vegetation indices for automated crop imaging applications. Comput. Electron. Agric. 63, 282–293. doi:10.1016/j.compag.2008.03.009
Mohammed, A. M., Nartey, E., Naab, J. B., and Adiku, S. G. K. (2013). A simple model for predicting plant residue decomposition based upon their C/N ratio and soil water content. Afr. J. Agric. Res. 8 (19), 2153–2159. doi:10.5897/AJAR11.1342
Möller, K., and Müller, T. (2012). Effects of anaerobic digestion on digestate nutrient availability and crop growth: A review. Eng. Life Sci. 12 (3), 242–257. doi:10.1002/elsc.201100085
Nasielski, J., Earl, H., and Deen, B. (2019). Luxury vegetative nitrogen uptake in maize buffers grain yield under post-silking water and nitrogen stress: A mechanistic understanding. Front. Plant Sci. 10, 318. doi:10.3389/fpls.2019.00318
Nleya, T., Chungu, C., and Kleinjan, J. (2016). “Corn growth and development. Chapter 5: Corn growth and development,” in iGrow corn: Best management practices. Editors D. E. Clay, C. G. Carlson, S. A. Clay, and E. Byamukama (South Dakota: South Dakota State University).
Olmo, M., Villar, R., Salazar, P., and Alburquerque, J. A. (2016). Changes in soil nutrient availability explain biochar's impact on wheat root development. Plant Soil 399 (1-2), 333–343. doi:10.1007/s11104-015-2700-5
Peng, Y., Niu, J., Peng, Z., Zhang, F., and Li, C. (2010). Shoot growth potential drives N uptake in maize plants and correlates with root growth in the soil. Field Crops Res. 115 (1), 85–93. doi:10.1016/j.fcr.2009.10.006
Peng, Y., Yu, P., Li, X., and Li, C. (2013). Determination of the critical soil mineral nitrogen concentration for maximizing maize grain yield. Plant Soil 372 (1), 41–51. doi:10.1007/s11104-013-1678-0
Perry, L. J., and Compton, W. A. (1977). Serial measures of dry matter accumulation and forage quality of leaves, stalks, and ears of three corn hybrids 1. Agron. J. 69 (5), 751–755. doi:10.2134/agronj1977.00021962006900050005x
Pôças, I., Paço, T. A., Paredes, P., Cunha, M., and Pereira, L. S. (2015). Estimation of actual crop coefficients using remotely sensed vegetation indices and soil water balance modelled data. Remote Sens. 7 (3), 2373–2400. doi:10.3390/rs70302373
Postic, F., Beauchêne, K., Gouache, D., and Doussan, C. (2019). Scanner-based minirhizotrons help to highlight relations between deep roots and yield in various wheat cultivars under combined water and nitrogen deficit conditions. Agronomy 9, 297. doi:10.3390/agronomy9060297
R Core Team (2018). R: A language and environment for statistical computing. Vienna. R Foundation for Statistical Computing. Available on https://www.R-project.org. (Accessed November 12, 2022).
Rajcan, I., and Tollenaar, M. (1999). Source:sink ratio and leaf senescence in maize:. Field Crops Res. 60 (3), 255–265. doi:10.1016/S0378-4290(98)00143-9
Reuland, G., Sigurnjak, I., Dekker, H., Michels, E., and Meers, E. (2021). The potential of digestate and the liquid fraction of digestate as chemical fertiliser substitutes under the RENURE criteria. Agronomy 11 (7), 1374. doi:10.3390/agronomy11071374
Robinson, D., Linehan, D. J., and Gordon, D. C. (1994). Capture of nitrate from soil by wheat in relation to root length, nitrogen inflow and availability. New Phytol. 128 (2), 297–305. doi:10.1111/j.1469-8137.1994.tb04013.x
Robles-Aguilar, A. A., Pang, J., Postma, J. A., Schrey, S. D., Lambers, H., and Jablonowski, N. D. (2019). The effect of pH on morphological and physiological root traits of Lupinus angustifolius treated with struvite as a recycled phosphorus source. Plant Soil 434 (1), 65–78. doi:10.1007/s11104-018-3787-2
Saberioon, M. M., Amin, M. S. M., Anuar, A. R., Gholizadeh, A., Wayayok, A., and Khairunniza-Bejo, S. (2014). Assessment of rice leaf chlorophyll content using visible bands at different growth stages at both the leaf and canopy scale. Int. J. Appl. Earth Obs. Geoinf. 32, 35–45. doi:10.1016/j.jag.2014.03.018
Schrock, R. R. (2006). Reduction of dinitrogen. Proc. Natl. Acad. Sci. U. S. A. 103 (46), 17087. doi:10.1073/pnas.0603633103
Sigurnjak, I. (2017). Animal manure derivatives as alternatives for synthetic nitrogen fertilizers (Ghent, Belgium: Ghent University). Dissertation.
Sigurnjak, I., Brienza, C., Snauwaert, E., De Dobbelaere, A., De Mey, J., Vaneeckhaute, C., et al. (2019). Production and performance of bio-based mineral fertilizers from agricultural waste using ammonia (stripping-) scrubbing technology. Waste Manag. 89, 265–274. doi:10.1016/j.wasman.2019.03.043
Sigurnjak, I., De Waele, J., Michels, E., Tack, F. M. G., Meers, E., and De Neve, S. (2017). Nitrogen release and mineralization potential of derivatives from nutrient recovery processes as substitutes for fossil fuel-based nitrogen fertilizers. Soil Use Manag. 33 (3), 437–446. doi:10.1111/sum.12366
Subedi, K. D., and Ma, B. L. (2005). Nitrogen uptake and partitioning in stay-green and leafy maize hybrids. Crop Sci. 45 (2), 740–747. doi:10.2135/cropsci2005.0740
Swank, J. C., Below, F. E., Lambert, R. J., and Hageman, R. H. (1982). Interaction of carbon and nitrogen metabolism in the productivity of maize. Plant Physiol. 70 (4), 1185–1190. doi:10.1104/pp.70.4.1185
Tewolde, H., Sistani, K. R., and McLaughlin, M. R. (2016). Residual effect of poultry litter applications on no-till cotton lint yield. Agron. J. 108 (4), 1405–1414. doi:10.2134/agronj2016.01.0059
Tian, Q., Chen, F., Zhang, F., and Mi, G. (2006). Genotypic difference in nitrogen acquisition ability in maize plants is related to the coordination of leaf and root growth. J. Plant Nutr. 29 (2), 317–330. doi:10.1080/01904160500476905
Tiessen, H., Cuevas, E., and Chacon, P. (1994). The role of soil organic matter in sustaining soil fertility. Nature 371, 783–785. doi:10.1038/371783a0
Vamerali, T., Bandiera, M., and Mosca, G. (2012). “Minirhizotrons in modern root studies,” in Measuring roots. Editor S. Mancuso (Berlin, Germany: Springer), 341–361. doi:10.1007/978-3-642-22067-8_17
Vaneeckhaute, C., Ghekiere, G., Michels, E., Vanrolleghem, P. A., Tack, F. M., and Meers, E. (2014). “Assessing nutrient use efficiency and environmental pressure of macronutrients in biobased mineral fertilizers: A review of recent advances and best practices at field scale,” in Advances in agronomy (Cambridge: Academic Press), 128, 137–180. doi:10.1016/B978-0-12-802139-2.00004-4
Velthof, G. L., and Rietra, R. P. J. J. (2019). Nitrogen use efficiency and gaseous nitrogen losses from the concentrated liquid fraction of pig slurries. Int. J. Agron. 2019, 1–10. doi:10.1155/2019/9283106
VITO. (2021). Bemonsterings- en analyseprocedures voor mest, bodem en veevoeder in het kader van het mestdecreet (BAM). [Sampling and analysis procedures for manure, soil and feed in the context of the manure policy.]. VITO, Flemish Institute for Technological Research, Mol, Belgium, https://emis.vito.be/en/node/31845, BAM deel 3/03 (Last accessed October 29, 2022).
Vondra, M., Touš, M., and Teng, S. Y. (2019). Digestate evaporation treatment in biogas plants: A techno-economic assessment by Monte Carlo, neural networks and decision trees. J. Clean. Prod. 238, 117870. doi:10.1016/j.jclepro.2019.117870
Wan, L., Li, Y., Cen, H., Zhu, J., Yin, W., Wu, W., et al. (2018). Combining UAV-based vegetation indices and image classification to estimate flower number in oilseed rape. Remote Sens. 10 (9), 1484. doi:10.3390/rs10091484
Wang, M., Khan, M. A., Mohsin, I., Wicks, J., Ip, A. H., Sumon, K. Z., et al. (2021). Can sustainable ammonia synthesis pathways compete with fossil-fuel based Haber–Bosch processes? Energy Environ. Sci. 14 (5), 2535–2548. doi:10.1039/d0ee03808c
Wiesler, F., and Horst, W. J. (1994). Root growth of maize cultivars under field conditions as studied by the core and minirhizotron method and relationships to shoot growth. Z. Pflanzenernaehr. Bodenk. 157 (5), 351–358. doi:10.1002/jpln.19941570506
Yan, M., Pan, G., Lavallee, J. M., and Conant, R. T. (2020). Rethinking sources of nitrogen to cereal crops. Glob. Change Biol. 26 (1), 191–199. doi:10.1111/gcb.14908
Yang, M., Hassan, M. A., Xu, K., Zheng, C., Rasheed, A., Zhang, Y., et al. (2020). Assessment of water and nitrogen use efficiencies through UAV-based multispectral phenotyping in winter wheat. Front. Plant Sci. 11, 927. doi:10.3389/fpls.2020.00927
Yao, Y., Huang, G., An, C., Chen, X., Zhang, P., Xin, X., et al. (2020). Anaerobic digestion of livestock manure in cold regions: Technological advancements and global impacts. Renew. Sustain. Energy Rev. 119, 109494. doi:10.1016/j.rser.2019.109494
Yu, P., White, P. J., Hochholdinger, F., and Li, C. (2014). Phenotypic plasticity of the maize root system in response to heterogeneous nitrogen availability. Planta 240 (4), 667–678. doi:10.1007/s00425-014-2150-y
Keywords: nitrogen use efficiency, biobased fertilizer, minirhizotron, unmanned aerial vehicle, soil mineral nitrogen, drought stress, luxury nitrogen uptake
Citation: Luo H, Dewitte K, Landschoot S, Sigurnjak I, Robles-Aguilar AA, Michels E, De Neve S, Haesaert G and Meers E (2022) Benefits of biobased fertilizers as substitutes for synthetic nitrogen fertilizers: Field assessment combining minirhizotron and UAV-based spectrum sensing technologies. Front. Environ. Sci. 10:988932. doi: 10.3389/fenvs.2022.988932
Received: 07 July 2022; Accepted: 10 November 2022;
Published: 21 November 2022.
Edited by:
Jianbin Zhou, Northwest A&F University, ChinaReviewed by:
Nicola Dal Ferro, University of Padua, ItalyYansheng Li, Northeast Institute of Geography and Agroecology (CAS), China
Copyright © 2022 Luo, Dewitte, Landschoot, Sigurnjak, Robles-Aguilar, Michels, De Neve, Haesaert and Meers. This is an open-access article distributed under the terms of the Creative Commons Attribution License (CC BY). The use, distribution or reproduction in other forums is permitted, provided the original author(s) and the copyright owner(s) are credited and that the original publication in this journal is cited, in accordance with accepted academic practice. No use, distribution or reproduction is permitted which does not comply with these terms.
*Correspondence: Hongzhen Luo, aG9uZ3poZW4ubHVvQHVnZW50LmJl