 Francisco Estrada1,2,3*
 Alma Mendoza3
 Guillermo Murray4
 Oscar Calderón-Bustamante1
 Wouter Botzen2,5
 Teresa De León Escobedo6
 Julián A. Velasco1
- 1Centro de Ciencias de la Atmosfera, Universidad Nacional Autónoma de México, Mexico City, Mexico
- 2Institute for Environmental Studies, VU Amsterdam, Amsterdam, Netherlands
- 3Programa de Investigación en Cambio Climático, Universidad Nacional Autónoma de México, Mexico City, Mexico
- 4Instituto de Investigaciones en Ecosistemas y Sustentabilidad, Universidad Nacional Autónoma de México, Mexico City, Mexico
- 5Utrecht University School of Economics (U.S.E.), Utrecht University, Utrecht, Netherlands
- 6Posgrado en Geografía, Universidad Nacional Autónoma de México, Mexico City, Mexico
The collection of publicly available databases about climate change and its impacts on natural and human systems is unprecedented and ever-growing. However, the requirements of information can vary widely among users depending on their region, socioenvironmental context, and interests. Moreover, in the current era of active mitigation and adaptation policies, information needs are frequently not satisfied even by these massive and variated collections of databases. The development and use of emulators can help closing this information gap by allowing users to approximate the output from complex models and create user-defined experiments, without being technically or computational demanding on the user. Here, a simple emulator of the EPIC biophysical crop model is presented which is able to adequately reproduce the changes in rainfed maize and to create projections for user-defined scenarios. Moreover, it allows to produce risk measures that are not available with the original model. The proposed methodology is illustrated with a case study of rainfed maize production in Mexico for a reference emissions scenario (SSP370) and two user-defined international mitigation policy scenarios. These scenarios represent 1) current international mitigation commitments and 2) a scenario in which China withdraws from international mitigation efforts. Results showed that, under the reference scenario, climate change could have widespread consequences on rainfed production all over the country with decreases in yields reaching up to 80% in the southeast and northeast of the country. These impacts can be partially modulated by the moderately ambitious mitigation commitments assumed in recent international agreements if all countries comply. However, a potential withdraw of China from these efforts would significantly reduce any benefits from international mitigation. Under all scenarios, changes in productivity impose increasing risks for already vulnerable populations and considerable economic costs at the state and national levels. These results suggest the urgent need for critical planning for adaptation in the agricultural sector of the country.
1 Introduction
Climate change poses a serious risk to agriculture worldwide potentially compromising food security both globally and locally (Altieri and Nicholls, 2017). All domesticated crops, and particularly cereals, have been adapted to constrained climatic requirements that rely on predictable and recurrent climatic patterns. Deviations from these conditions have differential impacts on agricultural production around the world. It is expected that negative changes will be more evident in tropical regions where temperature is already close to the high temperature thresholds for suitable cereals production (Rosenzweig et al., 2014; Betts et al., 2018). Hazards of an altered climate on agriculture include the rise in global temperatures (Betts et al., 2018), the increment in frequency of extreme climatic events (Lesk et al., 2016; Cook et al., 2018) and a shift in precipitation seasonality (Zaveri et al., 2020). To understand and prevent the worst potential impacts of climate change on agriculture, a plethora of investigations have been conducted at different geographical scales from global to subnational (Ziska et al., 2012; Deryng et al., 2014; Rosenzweig et al., 2014; Lesk et al., 2016; Kukal and Irmak, 2018; Agovino et al., 2019; Jägermeyr et al., 2021; Kogo et al., 2021). Nevertheless, the availability of these main sources of information (satellites, censuses, surveys and models) and the spatial and temporal resolutions of these data products are not matching. In addition, these resources are frequently beyond of the computational abilities of different types of users which include policymakers (Kim et al., 2021). As a result, there is an urgent need to close the gap between the generation of sound scientific information, and its application in decision making to manage climate risks for global food systems facing climate change.
At least three approaches have been adopted to address the evaluation of climate change impacts on agriculture: empirical studies on observed climate variability and change and crop production; field experiments, and; process-based computational models. The first consists on case-studies of observed anomalous climatic events to exemplify the potential impact if similar conditions were to happen in the future. This type of approach is also used to extrapolate the impacts on crops under future climate conditions (Estrada et al., 2012; Iizumi and Ramankutty, 2015). This methodology has the advantage of being applicable at any spatial scale, thus potentially generating direct information for the decision makers. However, it usually involves using statistical models to extrapolate the effects of climate conditions beyond the range of observations in which the model was calibrated. In addition, climatic events as analogs of future climate conditions can offer little insight about how crops can respond to persistent climate conditions (Dell et al., 2014). A second approach is the employment of field trials, such as rain-exclusion and warming experiments (Robertson and Hamilton, 2015), which evaluate how crop yields could change in locally constructed future climatic conditions. Although they offer greater insights on potential response in face of future scenarios, their spatial extrapolation is limited to similar local conditions. Also, these studies are usually costly, limited to case studies and not feasible at the national or regional scales. The final approach has been the construction of computational models based on the processes that govern the agricultural systems and their relationships with climate. Despite limitations of their own (Rosenzweig et al., 2014), including that potential yields in general do not reflect the observed yields, this approach has enough flexibility to provide information at multiple spatiotemporal scales, including past events and future climatic scenarios.
Several global agricultural models have been developed in the last decades for generating climate change impact projections. The Environmental Policy Integrated Climate (EPIC-TAMU) is an open model which originally estimated the effects of soil erosion on crop productivity (Williams et al., 1984, 1989). The major components of this model are weather simulation, hydrology, erosion-sedimentation, nutrient cycling, pesticide fate, crop growth, soil temperature, tillage, economics, and plant environment control. Although EPIC operates on a daily step, it is capable of simulating hundreds of years (Williams et al., 2015). The EPIC-IIASA global gridded crop model (Balkovič et al., 2014) is not an open model, based on the EPIC-TAMU version 081. It assesses the impacts on yields, water availability, and soil degradation in the main global agricultural systems with different management such as cropping, fertilization, irrigation practices, and organic options under future climate change conditions. The EPIC-IIASA model estimates plant growth and yield based on temperature and soil moisture (Balkovič et al., 2014). Another popular and open model is the pDSSAT which comprises an assortment of survey-based and geospatial data sources (Elliott et al., 2014), and field-scale crop models, including those based in the Decision Support System for Agrotechnology Transfer (DSSAT) framework (CROPGRO103 and CERES (Crop Environment Resource Synthesis (Jones et al., 2003) (referred to as pDSSAT). The pDSSAT model simulates food, fiber and biomass production systems at high spatial resolution and continental or global extents (Müller et al., 2019). The Lund-Postdam-Jena managed Land model (LPJLmL) originated from the LPJ-Dynamic Global Vegetation Model (Sitch et al., 2003) and it is associated with biogeochemical processes (mainly carbon cycling) (Bondeau et al., 2007). The LPJLmL model simulates the growth and geographical distribution of natural plant and crop functional types. There are other alternative crop models such as WOFOST that is a simulation model for analyzing the growth and production of field crops under a wide range of weather and soil limiting conditions (Diepen et al., 1989), the CLM-Crop (Levis et al., 2012), ORCHIDEE-CROP, and PEGASUS (Deryng et al., 2011).
Considering the wide variety of crop models, some international efforts have been developed to compare their projections such as the Inter-Sectoral Impact Model Intercomparison Project (ISIMIP) (https://www.isimip.org/) and the Agricultural Model Intercomparison and Improvement Project (AgMIP) (https://agmip.org/). Their main goal is to facilitate the evaluation and improvement of the models. They also aim to improving the estimates of the biophysical and socio-economic impacts of climate, to provide knowledge for enhancing technological capabilities, and to tackle food security, and poverty at local to global scales.
How countries adapt to climate change impacts and prevent further risks possess critical questions about the countries’ capacity to produce climate knowledge on a relevant scale for local decision-makers. This is a key aspect of the climate services discussions (Vaughan and Dessai, 2014; Soares and Buontempo, 2019) and the analysis of how to bridge climate policy and the science interface (Lemos et al., 2012; Tang and Dessai, 2012; Knutti, 2019). Unequal climate knowledge infrastructures have been identified as one of the key dimensions to better understanding how climate information is locally produced, circulated, selected, and used by policymakers in different development sectors (Edwards, 2010; Mahony and Hulme, 2016). This geographical imbalance can be modulated by how countries customize the information from all parts of the world and integrate it to their processes. Here, novel modelling approaches are proposed to help different regions customize and use model output and data. At the same time, this approach can help build stronger technical capacities and provide adequate information for decision making.
The increasing availability of crop projection databases from leading modelling groups allows proposing simple model emulators based on statistical techniques (Blanc, 2017; Estrada et al., 2020). These emulators have low technical and computing requirements and aim helping a variety of users who have no access to biophysical crop models, but that have information needs that may go beyond publicly available datasets. The requirements of information can vary widely among users and include tailor-made, user-defined policy or reference climate change scenarios to address specific information needs. The low-computational and technical costs of emulators also facilitate the use of simulation and resampling methods that allow generating probabilistic scenarios and estimating various risk measures to facilitate communication of results and help decision-making processes. Examples of such risk measures include the social and economic time of emergence, and multivariate risk indices (Hawkins and Sutton, 2012; Estrada and Botzen, 2021; Estrada et al., 2021; Ignjacevic et al., 2021).
Limited access to complex models and technical and computational challenges are much more common for policy makers and stakeholders in developing countries (Blicharska et al., 2017). In these regions, the development of alternative modelling approaches and tools, such as emulators, can be of high scientific and policy relevance. For instance, biophysical crop models require high levels of expertise and programming to use and adapt in a way that they can address relevant national, subnational and local needs. Due to the lack of modelling alternatives, policymakers in these countries are frequently left with model runs created for other users’ needs that do not respond to their specific demands. However, the usefulness and benefits of emulators of complex models are not limited to cases in which technical or computational resources are scarce or not available. A variety of emulators, such as MAGICC (Meinshausen et al., 2011), are used in high-impact publications on climate change (Fawcett et al., 2015; IPCC, 2021) and play a central role in integrated assessment modelling (Tol and Fankhauser, 1998; van Vuuren et al., 2011; Nordhaus, 2013; Meinshausen et al., 2020; Estrada and Botzen, 2021).
The main objective of this work is to offer a simplified mathematical framework to produce emulators that can approximate complex climate change impact assessment models for agriculture. These emulators can extend the original models’ results to a wide range of user-defined intervention/inaction greenhouse gas emissions scenarios. They can also be extended to a probabilistic setting in which a variety of risk measures can be developed to address the user’s information needs. In specific, emulators of the EPIC model based on the simulations that are freely available in the AgMIP7 database are developed. Some performance metrics and a test to evaluate their performance are proposed. This builds upon concepts such as “weather typing” (Hay et al., 1991), “time-shift approach” (Herger et al., 2015) and “time sampling” (James et al., 2017), developed for climate simulations and for downscaling. These concepts have been applied to interpolate impact projections for the Network for Greening the Financial System (NGFS)1. Here we extend previous work to a formal mathematical model and provide metrics and tests for evaluating its performance.
The proposed methodology is illustrated with a case study of rainfed maize production in Mexico, which has a particular cultural and socioeconomic importance for the country. Although the contribution of agricultural activities accounts for 3.4% of the Mexican GDP (INEGI, 2020), there are ∼6 million people who depend directly on this sector (SIAP, 2019) and up to 26.9 million people considering their relatives (INEGI, 2021). Farmers in Mexico have been cataloged as of the most vulnerable to climate change because of a mosaic of conditions (Monterroso et al., 2014; Murray-Tortarolo et al., 2018; Donatti et al., 2019), and their incomes are highly dependent on crop yields. The vast majority of agricultural land is rainfed (69.7%) (SIAP, 2021), and conducted in small patches of land (usually <2ha) (Ibarrola-Rivas et al., 2020), with traditional management practices (e.g., milpa). The proposed emulators are used to estimate the changes in yields at the grid (0.5° × 0.5°) and state levels for three emissions scenarios that are not available in the AgMIP7 database. These scenarios explore the benefits of strict compliance of the Nationally Determined Contributions (NDC) and what consequences would arise if a large emitter would drop out of the NDC and the Paris Agreement. In the current context of the cancellations of the US-China talks by China, a modified NDC scenario in which China decides not to participate in the NDC efforts is selected for the analysis. The economic costs and benefits of such scenarios are evaluated, and two risk measures are used to identify the regions that are more exposed to climate change impacts on rainfed maize production.
The remainder of this article is structured as it follows. Section 2 presents the data and methods used. It develops the modelling framework for constructing the emulators and presents an approach to evaluate the emulators’ adequacy and accuracy. Section 3 presents and discusses model evaluation and the projected changes in yields and their implications for rainfed maize production in Mexico. Section 4 summarizes the results and concludes.
2 Data and methods
2.1 Model description
A simple methodology for constructing crop model emulators is presented. The proposed emulators can closely reproduce the outcome of complex models and address information needs that cannot be covered with the simulations that are publicly available. This methodology is illustrated using the EPIC crop model projections that are available in the AgMIP7 database. The emulator is based on a simple non-parametric modeling strategy described in the following paragraphs.
The evolution of crop yields
where
The first step in the methodology is to construct an information set H that contains a library of simulations from the biophysical model and the corresponding global temperature change, both for a range of emissions scenarios, such as those in the Representative Concentration Pathways (RCP):
where
The second step consists of indexing the information contained in
where
Some relevant properties and limitations of the proposed methodology include:
• There are no assumptions about the functional form relating the effects of changes in climate over yields.
• Spatial patterns produced by the original biophysical crop model are preserved. Noise is introduced to these patterns by the mismatch between
• As with many other models, projections beyond the range of values used for calibration are likely not valid.
• The proposed methodology is not appropriate for scenarios which involve large changes in spatial climate patterns (i.e., spatial stationarity of changes does not hold, see below) such as those that correspond to climatic catastrophes (e.g., thermohaline circulation collapse).
• At each time t the emulator in Eqs 4, 5 constructs a library of realizations that represents the response of the biophysical climate models to similar levels of warming. These collections of realizations can be used to approximate the empirical distributions of crop yields conditional on the level of warming
Finally, note that
where
2.2 Computation of risk measures estimates
A relevant application of the proposed methodology is to provide risk measures that are currently not available from the original biophysical crop models. The library of realizations in the information set H, in combination with resampling methods, can be used to approximate the empirical distribution of crop yields conditional on the level of warming
2.3 Calculation of economic losses
For calculating the economic losses, the following steps were carried out. First, because modelled and observed yields are not directly comparable (Rosenzweig et al., 2014) the change in modelled yields is applied to observed yields as follows (see Estrada et al., 2022):
where
2.4 Evaluating the adequacy and accuracy of models based on different information sets H
As mentioned in the previous subsection, the adequacy of the information set H used to calculate Eq. 5 can be evaluated by analyzing the properties of the error term
where
To evaluate the accuracy of the projections obtained using different H sets, the root mean square error (RMSE) and the normalized RMSE (nRMSE) are calculated using the mean of the yield of the original model for the projected period. These metrics also help to assess how much additional realizations of the biophysical crop contribute to improve the emulator’s projections.
2.5 Data description and sources
The proposed methodology is illustrated using the output from the EPIC crop model for rainfed maize (Williams et al., 1984, 1989) forced with the climate projections of the HadGEM2-ES climate model under the RCP8.5, RCP6.0, RCP4.5 and RCP2.6 emissions scenarios.2 This information constitutes the
3 Results and discussion
3.1 Evaluation of adequacy and accuracy of the proposed emulators
The adequacy and accuracy of different emulators based on all possible combinations of RCP simulations to integrate the information set H was evaluated. Supplementary Tables S1–S4 in the Supplementary Material show the RMSE, nRMSE and the significance of the ADF test statistic. Bold figures denote which emulators provide no evidence of non-stationarities in
The results in Supplementary Tables S1–S4 in the Supplementary Material show that: 1) the errors produced by the proposed emulators are relatively small, as the RMSE is in general below 1 t/ha in comparison with the average yield for the area of study (about 6 t/ha); 2). Due to the fact that the RCP8.5 expands over a wider range of global temperature change, it is the scenario that adds more information to the set H. In contrast, the RCP2.6 adds the least because all other RCP scenarios provide information for changes in yields in a range of global temperature change that encompasses that of the RCP2.6; 3) the out-of-sample RMSE values averaged over the different RCPs decreases as more RCP scenarios are added to the set H, suggesting that the emulator becomes better at producing projections that are not in the training set.
Furthermore, most of the combinations of RCP in H that include the RCP8.5 produce stationary errors at each grid cell, for all RCP that are evaluated. This suggests that differences between
3.2 An illustration of the proposed emulators for generating user-defined scenarios
The usefulness of the proposed methodology is illustrated by projecting rainfed maize yields under three emissions scenarios that are not considered in AgMIP7. Furthermore, risk estimates that are not directly available using current biophysical crop models are provided. The emissions scenarios that were selected are: the SSP370 used in the CMIP6, and that is similar to a “business-as-usual” scenario; 2) a strict compliance NDC scenario and; 3) the NDCnoCHINA scenario which consists of the NDC scenario but excluding China’s participation (Estrada and Botzen, 2021).
3.2.1 Climate change impacts on rainfed maize yields
Results of the simulations of rainfed maize yields for the selected emissions scenarios are presented in Supplementary Figure S10 included in the Supplementary Material. This figure shows the changes in yields (%) with respect to 1980–2010 for the SSP370, NDC and NDCnoCHINA emissions scenarios for the time horizons 2055 and 2085. The SSP370 scenario implies large reductions in rainfed maize in Mexico by mid-century. These reductions are highly heterogeneous in space and particularly large for part of the northeast and most of the southeast of Mexico. This is also the case for the south-center region of the US, where the yield changes can exceed −40%. The reductions in yields become much larger and widespread near the end of the century, reaching over 70% in the southeast and northeast of Mexico (and in the southeast of the US), and close to 40%–50% in some regions of the Pacific coast where some of the largest producers of rainfed maize are located.
Aggregating yield changes at the state level (Figure 1) shows that under the SSP370 all states, with the exception of the Baja California peninsula, would experience important decreases in rainfed maize yields during this century. The largest reductions occur in Nuevo Leon reaching close to 50% during the 2050s and about 80% at the end of the century, followed by those in Campeche which exceed 40% by mid-century and 60% by the 2080s. Other states with decreases in yields exceeding 50% by the end of the century are Coahuila, Quintana Roo, Tabasco, Tamaulipas, and Yucatán. States such as Chiapas, Guerrero, and Oaxaca, which are characterized by high levels of poverty and small-scale producers that depend on rainfed maize production for subsistence, would also experience large reductions in yields. For these states, the expected reductions in yields are about 30%–45% by the end of the century and 15%–30% in the following 3 decades. The largest producers of rainfed maize in the country (e.g., Mexico, Jalisco, and Nayarit) would see reductions between 5% and 15% by the 2050s, and 15% and 25% at the end of the century. Figures 2A, 3A show these results as maps for the short (2025) and medium (2055) time horizons, respectively.
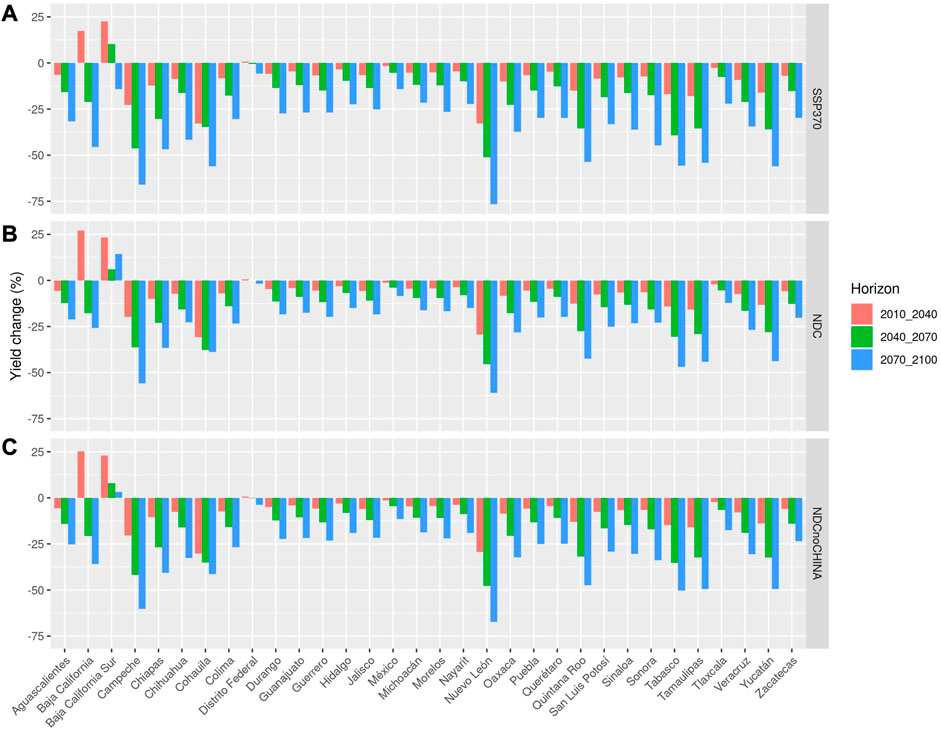
FIGURE 1. Percent changes per state in rainfed yields under the SSP370, NDC and NDCnoCHINA scenarios for three time horizons. Panel (A) shows the percent change in yields under theSSP370 scenario while Panels (B,C) show those for the NDC and NDCnoCHINA scenarios. Projections for 2010–2040 are shown in red, in green for 2040–2070, and in blue for 2070–2100. The Y-axis depicts the percent changes in maize yields and the X-axis shows the state names.
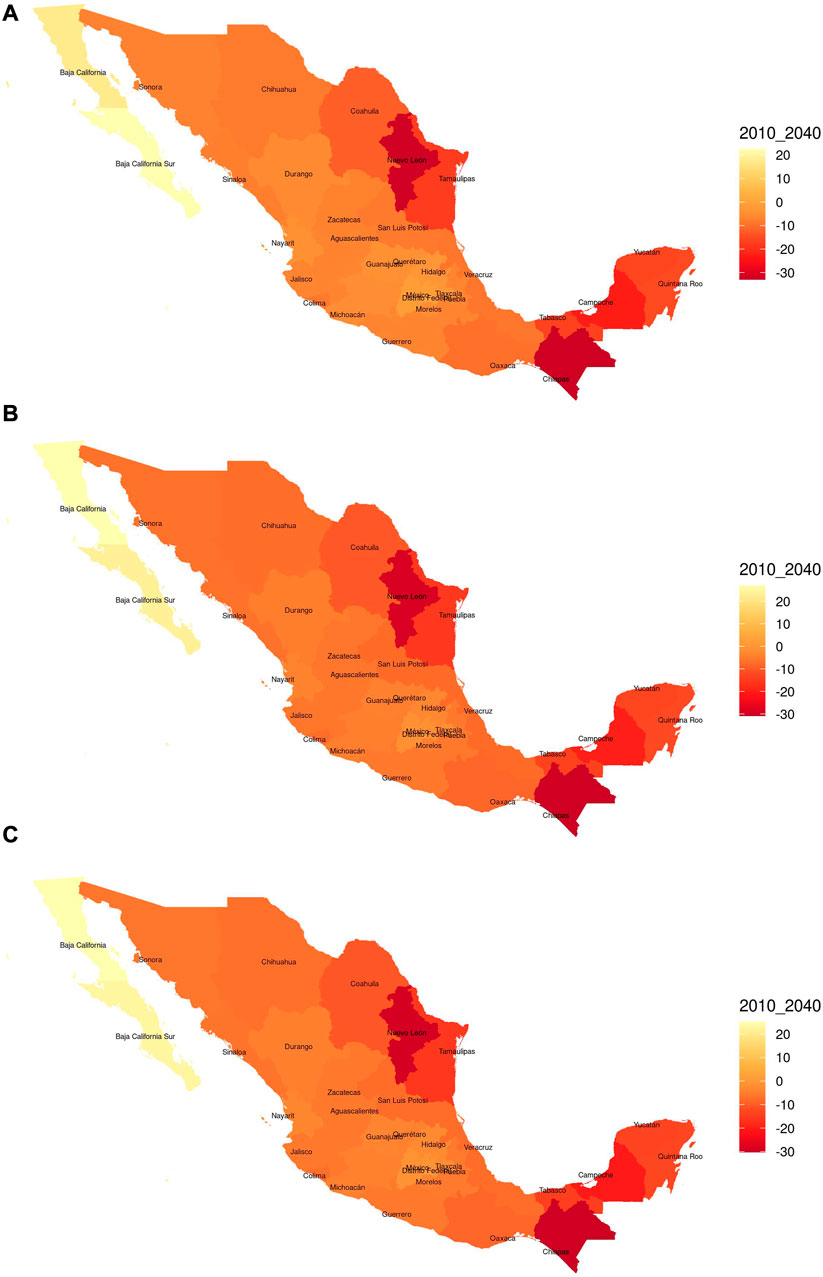
FIGURE 2. Maps of percent changes in rainfed yields under the SSP370, NDC and NDCnoCHINA scenarios for the short time horizon (2010–2040). Panel (A) shows the percent change in yields under theSSP370 scenario while Panels (B,C) show those for the NDC and NDCnoCHINA scenarios. Figures axes are latitude (Y-axis) and longitude (X-axis).
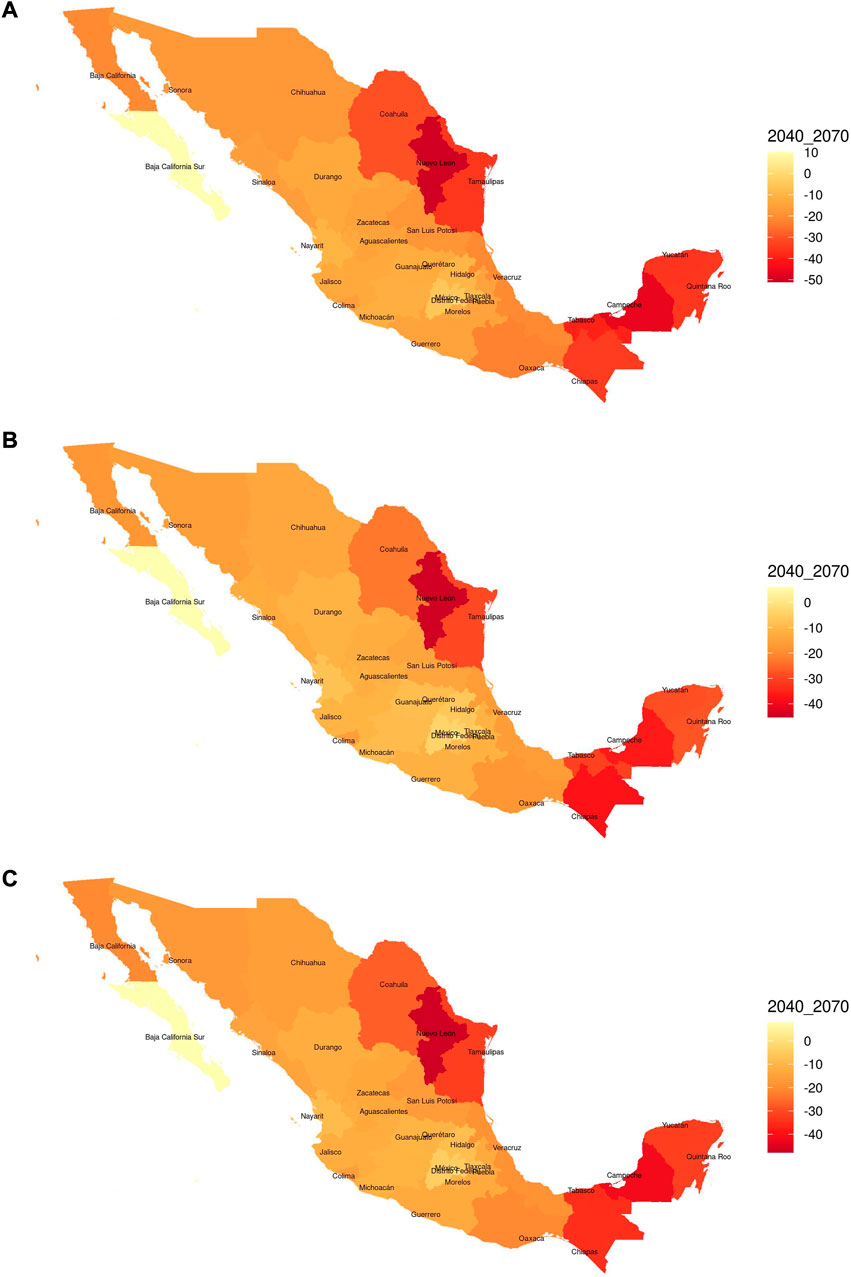
FIGURE 3. Maps of percent changes in rainfed yields under the SSP370, NDC and NDCnoCHINA scenarios for the medium time horizon (2040–2070). Panel (A) shows the percent change in yields under theSSP370 scenario while Panels (B,C) show those for the NDC and NDCnoCHINA scenarios. Figures axes are latitude (Y-axis) and longitude (X-axis).
If an international mitigation effort consistent with the NDC commitments would be implemented, a significant fraction of these reductions in yields could be avoided. Figure 1B shows the yield changes obtained for the NDC scenario and reveals that there would be important benefits for most states if such an international mitigation effort would be implemented in comparison with a “business-as-usual” type of scenario (SSP370; Figures 2B, 3B). Thirteen states would avoid losing at least 10% of their current yields by the end of the century, and seven states would avoid reductions in yields of 5% or more by the 2050s. However, if China, one of key actors for limiting greenhouse gas emissions, would decide not to participate in the NDC effort these benefits would be significantly reduced (Figures 1D, 2C, 3C). In comparison with the SSP370, implementing the NDCnoCHINA scenario would more than halve the benefits that would be obtained under the full compliance of all participant countries (NDC): only three states would avoid reductions of at least 10% by the 2080s and no state would see benefits exceeding 5% by mid-century.
3.2.2 Risk measures estimates for rainfed maize in Mexico
In this subsection, the library of realizations in the information set H is used in combination with resampling methods to approximate the empirical distribution of crop yields conditional on the level of warming
Animated Supplementary Figures S12–S14 in the Supplementary Material show the evolution of the probabilities of exceeding 30% reductions in rainfed maize yields for the SSP370, NDC and NDCnoCHINA scenarios for the period 2005–2100. Under the SSP370 (Supplementary Figure S12), the probabilities of exceedance increase rapidly in the second part of the century reaching values above 80% in the southeast region of the country and all along the Pacific coast. In contrast, for most of the central region these probabilities remain below 60%. Although the NDC is not a very ambitious international mitigation effort, the probabilities of exceeding the selected risk threshold for rainfed maize yields are much lower for most of the country. The exceptions are the states located in the southeast of the country, as well as in Nuevo Leon, Coahuila, Tamaulipas, and Veracruz.
Figure 4 shows the dates of exceedance for each of three scenarios considered. Under the SSP370 scenario (Figure 4A), most of the area devoted to rainfed maize production in Mexico would likely experience reductions of 30% in yields during this century. During the present decade, states such as Nuevo Leon and Coahuila would reach this risk threshold, as well as some parts of Campeche. In the 2030s, Tamaulipas, parts of Sonora and the rest of Campeche would exceed decreases in yields above 30%. The rest of the southeast of Mexico would exceed 30% decreases in yields during the 2040–2060 period, and a large fraction of the remaining area devoted to this crop would exceed the threshold as early as the 2070s. Strict compliance with the NDCs would not be enough to delay exceeding the risk threshold for Nuevo Leon, Coahuila, Tamaulipas or Campeche (Figure 4B). Nevertheless, it would provide about 10 extra years for adaptation in parts of the southeast of Mexico, and about 20 years in Nayarit, Sinaloa and, Sonora. Furthermore, such mitigation scenario would push the date for exceeding the risk threshold into the next century for most of the central part of Mexico.
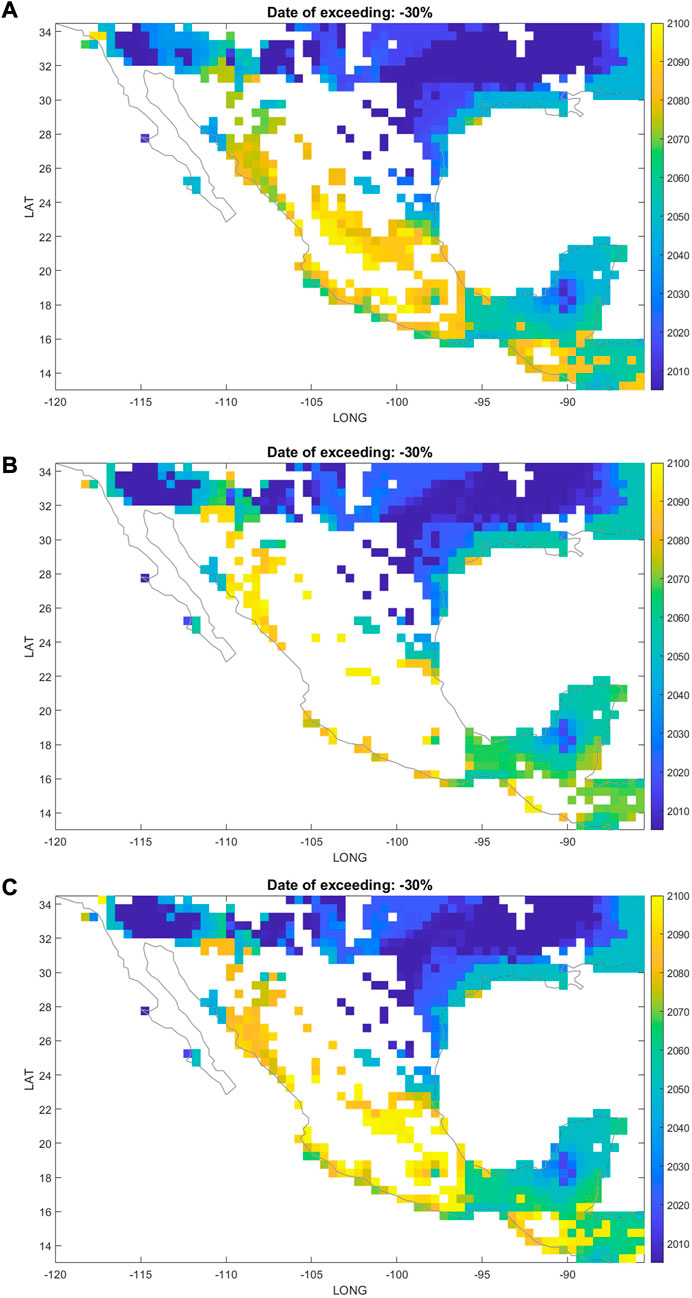
FIGURE 4. Dates of exceedance of reductions of at least 30% in rainfed maize. Panel (A) shows the dates of exceedance for the SSP370, while Panels (B,C) present the estimated dates for the NDC and NDCnoCHINA scenarios. Figures axes are latitude (Y-axis) and longitude (X-axis). Units are calendar years.
If China dropped out of the NDCs (NDCnoCHINA), most regions in Mexico would still experience some benefits in terms of delaying the date of exceedance of the risk threshold (Figure 4C). These areas include the southeast of the country, where the dates for exceedance would be like those obtained in the NDC scenario. For most of the Pacific coast there would be a delay of 10–15 years in comparison with the SSP370 scenario. The central part of the country would also experience about a 20-year delay for reaching the risk threshold of with respect to the SSP370 scenario. These delays would provide additional time for designing and implementing adaptation strategies to minimize the impacts of climate change on this crop and for addressing the challenges of the population that depends on it.
3.2.3 Estimates of the economic costs of climate change for rainfed maize in Mexico
In this section, estimates of the economic costs of climate change at the national and state levels are provided. For this purpose, the official statistics about yields, crop area and prices collected over the period 2000–2010 by the Ministry of Agriculture and Rural Development of Mexico are used, as well as the projections of changes in yields obtained for the SSP370, NDC and NDCnoCHINA scenarios.
To represent the reference yields and area devoted to rainfed maize, the state average values of these variables during the 2000–2010 period are used. For each scenario, the future yields are obtained multiplying one plus the projected changes (%) by the observed average yield of each state. Assuming the rainfed maize area remains constant for the rest of this century, the losses/gains from climate change in rainfed production are calculated as the difference between future and reference yields in each state, multiplied by the rainfed maize area in each state. The resulting quantity of tons are multiplied by the state-level price to approximate the costs or benefits of climate change for this crop under a particular emissions scenario. For the results in this subsection, state prices in 2012 pesos and a 4% discount rate are used for calculating present values.
At the national level, the present value of the cumulative losses in rainfed maize yields over this century amounts to $130,000 million pesos, which is comparable to three times the value of rainfed production of Mexico in 2012 (Table 1). These losses are highly heterogeneous at the state level with Chiapas, Jalisco, Veracruz, Oaxaca, and Guerrero account for about 60% of the total national losses (Figure 5A). In comparison with the SSP370, the present value of the cumulative benefits over this century of the NDC scenario (Figure 5B) would be about $25,000 million pesos, with the largest benefits in Chiapas ($5,600 million), Jalisco ($3,300 million) and Veracruz ($3,000 million). The decision of China to drop out of the NDC agreement would represent a loss of $8,600 million pesos for Mexico in rainfed maize production in comparison with the strict implementation of the NDC. About 46% of these lost benefits would occur in Chiapas, Jalisco and Veracruz (Figure 5B).
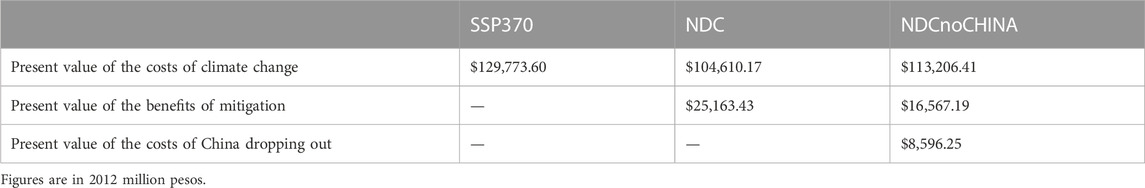
TABLE 1. Present values of the cumulative costs of climate change, of the cumulative benefits of international mitigation over this century and of the costs of China dropping out from international mitigation efforts.
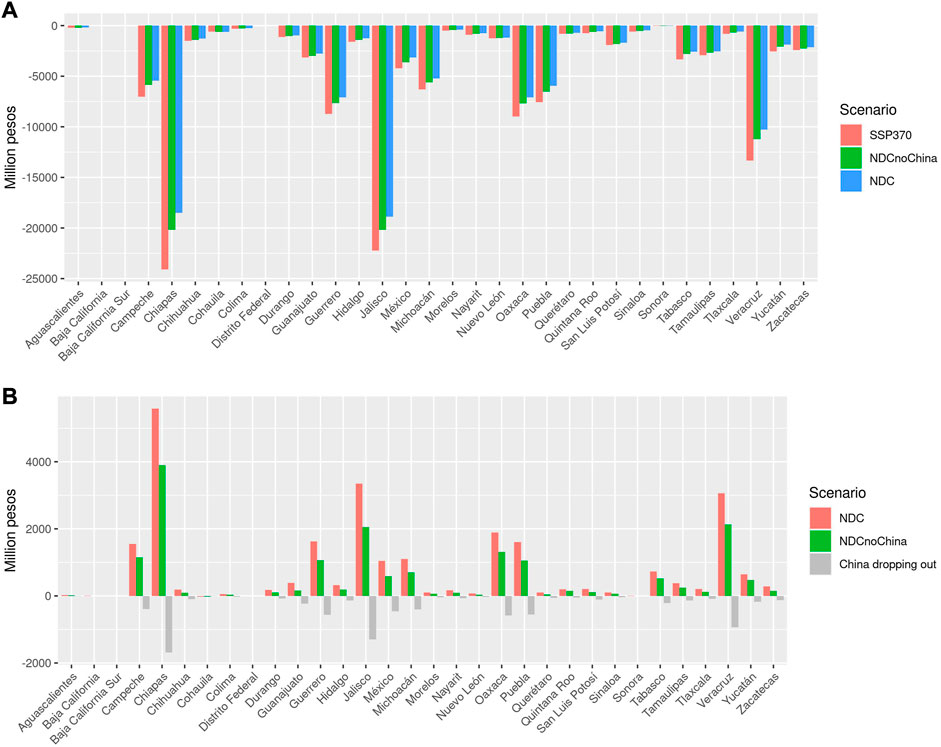
FIGURE 5. Present value of the cumulative costs of climate change over this century in rainfed maize production and of the cumulative benefits of international mitigation. Panel (A) shows the present value of the costs of reductions in rainfed yields for the SSP370 (red), NDC (blue) and NDCnoCHINA (green) scenarios. Panel (B) shows the benefits of implementing the NDC (red) and the NDCnoCHINA (green) with respect to the SSP370 scenario. The present value of the costs of China dropping out of the NDC mitigation effort are show in grey. The Y-axis depicts the calculated present values, and the X-axis shows the state names. Quantities are expressed in million pesos.
4 Conclusion
The amount of data about climate change and its impacts on natural and human systems that is available for decision-makers and researchers all over the world is unprecedented and ever-growing. Moreover, a large fraction of these databases is publicly available through international efforts of the climate change modelling community. However, the information needs are highly dynamic in an era of active mitigation and adaptation policies and are very heterogeneous among users. As such, information needs can hardly be satisfied even by such impressive and variated collections of databases. This is particularly true in the case of complex models for which runs are typically available for a limited number of scenarios (e.g., RCP, SSP) and experiments. Limited access to these models and lack of technical and computational capacities to run them constitute significant barriers for a variety of users and preclude them from creating tailor-made scenarios to address their specific information needs.
This information gap can be addressed through the development of emulators which can approximate the output from complex models using simple methods that are not technically demanding on the user, nor costly in computational terms. Moreover, such methods can be easily implemented and made publicly available. In this paper, a simple emulator of the EPIC model applied to rainfed maize is presented. It is shown that it can adequately reproduce the output of this complex biophysical crop model and to create projections for user-defined scenarios, as well as risk measures that are not available with the original model.
The proposed emulator is illustrated with an application for rainfed maize production in Mexico under three scenarios that are not available in the AgMIP7 database: the SSP370 and two user-defined scenarios that represent the strict compliance of the NDC commitments and a hypothetical case in which China drops out of this international mitigation effort. It is shown that under the baseline scenario (SSP370), rainfed maize yields could decrease at least 40% for 11 states of the country and up to 60%–80% in some regions by the end of the century. These results are consistent with the range of yield reductions reported in Estrada et al. (2022), which analyzes yield changes of the EPIC model under the RCP8.5 and RCP2.6 scenarios for rainfed maize in Mexico. The probabilities of exceeding a user-defined risk threshold of −30% reduction in rainfed maize yields are estimated and the areas with higher risks are identified. Using the estimated probabilities, the dates of exceedance of this risk threshold are calculated and reveal that regions such as Nuevo Leon, Coahuila and Campeche would reach this threshold in the current decade, and that most of the southeast of the country would do so in the period 2040–2060. Most of the remaining area devoted to this crop would exceed the risk threshold later this century. It is shown that under the NDC scenario, yield reductions and risks significantly decrease for most of the country but that there are some regions in which such an effort has no effect delaying the date for exceeding the selected risk threshold (i.e., Nuevo Leon, Coahuila and Campeche). Results also show that if China decided not to participate in the NDC effort, some benefits would still be attained but most regions of the country would face significantly higher risk and yield reductions.
The present value of the cumulative costs of climate change over this century under these three scenarios is also provided. Under an inaction scenario (SSP370) the present value of the losses in rainfed maize yields amounts to $130,000 million pesos, with much of these losses occurring in Chiapas, Jalisco, Veracruz, Oaxaca, and Guerrero. As expected, these losses are lower than those reported by Estrada et al. (2022) for a higher emissions scenario (RCP8.5). However, these estimates are consistent with what could be expected for the SSP370, and a similar geographical distribution of losses is shown. The strict implementation of the NDC would represent about $25,000 million pesos of avoided damages in rainfed maize production for Mexico, while the hypothetical decision of China to drop out of the NDC would impose losses for about $8,600 million pesos in rainfed maize production for Mexico. Overall, the results show that climate change could have widespread consequences on rainfed production all over the country, with increasing risks for already vulnerable populations and large economic costs at the state and national levels. Moreover, the proposed methodology allows to estimate dates for exceedance of critical thresholds that can help stakeholders to develop timely adaptation plans and to prioritize regions of higher concern. Note that this methodology can also be used to assess the effects of some adaptation measures, such as converting production from rainfed to irrigated in places where water availability allows for. The development of this type of simple emulators that can produce policy-relevant information could provide helpful assistance for government adaptation and risk reduction policies aimed to minimize the expected negative effects of climate change in different sectors.
Data availability statement
Publicly available datasets were analyzed in this study. This data can be found here: https://agmip.org/, https://climexp.knmi.nl/, https://www.gob.mx/siap/documentos/siacon-ng-161430.
Author contributions
FE, WB developed the idea. FE, JV, and OC-B processed and analysed the data. FE, GM, AM, JV and TDL wrote the paper. All authors contributed to the article and approved the submitted version.
Funding
FE acknowledges financial support from DGAPA-UNAM through the projects PAPIIT IN110718 and IN111221, and from UNEP through the Small Scale Grant SSFA-MEX-001/2022.
Conflict of interest
The authors declare that the research was conducted in the absence of any commercial or financial relationships that could be construed as a potential conflict of interest.
The reviewer UOS declared a shared affiliation with authors FE, AM, GM, OC-B, TDL and JV to the handling editor at the time of review.
Publisher’s note
All claims expressed in this article are solely those of the authors and do not necessarily represent those of their affiliated organizations, or those of the publisher, the editors and the reviewers. Any product that may be evaluated in this article, or claim that may be made by its manufacturer, is not guaranteed or endorsed by the publisher.
Supplementary material
The Supplementary Material for this article can be found online at: https://www.frontiersin.org/articles/10.3389/fenvs.2023.1027545/full#supplementary-material
Footnotes
1https://climate-impact-explorer.climateanalytics.org/methodology/
2These emissions scenarios are named after the radiative forcing they would produce by the end of the present century, ranging from 8.5 W/m2 to 2.6 W/m2. They can also be interpreted as a very high emissions trajectory (RCP8.5), two scenarios that are similar to what current policies would achieve (RCP6.0) and to what strict fulfilment of Nationally Determined Contributions (NDC) would produce (RCP4.5), and a stringent international mitigation scenario that is consistent with the Paris Agreement goals of keeping global temperature increase well below 2°C by 2100.
3SIACON is a query system for agricultural information created by the Mexican government. SIACON is available at https://www.gob.mx/siap/documentos/siacon-ng-161430
4Note that there is no consensus about what an acceptable range RMSE or nRMSE values is. This measure is intended to compare the accuracy of alternative models in relative terms (Blanc, 2017; Estrada et al., 2020).
References
Agovino, M., Casaccia, M., Ciommi, M., Ferrara, M., and Marchesano, K. (2019). Agriculture, climate change and sustainability: The case of EU-28. Ecol. Indic. 105, 525–543. doi:10.1016/j.ecolind.2018.04.064
Altieri, M. A., and Nicholls, C. I. (2017). The adaptation and mitigation potential of traditional agriculture in a changing climate. Clim. Change 140, 33–45. doi:10.1007/s10584-013-0909-y
Balkovič, J., van der Velde, M., Skalský, R., Xiong, W., Folberth, C., Khabarov, N., et al. (2014). Global wheat production potentials and management flexibility under the representative concentration pathways. Glob. Planet. Change 122, 107–121. doi:10.1016/j.gloplacha.2014.08.010
Betts, R. A., Alfieri, L., Bradshaw, C., Caesar, J., Feyen, L., Friedlingstein, P., et al. (2018). Changes in climate extremes, freshwater availability and vulnerability to food insecurity projected at 1.5°C and 2°C global warming with a higher-resolution global climate model. Philos. Trans. R. Soc. A 376, 20160452. doi:10.1098/rsta.2016.0452
Blanc, É. (2017). Statistical emulators of maize, rice, soybean and wheat yields from global gridded crop models. Agric. For. Meteorol. 236, 145–161. doi:10.1016/j.agrformet.2016.12.022
Blicharska, M., Smithers, R. J., Kuchler, M., Agrawal, G. K., Gutiérrez, J. M., Hassanali, A., et al. (2017). Steps to overcome the North– South divide in research relevant to climate change policy and practice. Nat. Clim. Chang. 7, 21–27. doi:10.1038/nclimate3163
Bondeau, A., Smith, P. C., Zaehle, S., Schaphoff, S., Lucht, W., Cramer, W., et al. (2007). Modelling the role of agriculture for the 20th century global terrestrial carbon balance. Glob. Chang. Biol. 13, 679–706. doi:10.1111/j.1365-2486.2006.01305.x
Cook, B. I., Mankin, J. S., and Anchukaitis, K. J. (2018). Climate change and drought: From past to future. Curr. Clim. Change Rep. 4, 164–179. doi:10.1007/s40641-018-0093-2
Dell, M., Jones, B. F., and Olken, B. A. (2014). What do we learn from the weather? The new climate-economy literature. J. Econ. Lit. 52, 740–798. doi:10.1257/jel.52.3.740
Deryng, D., Conway, D., Ramankutty, N., Price, J., and Warren, R. (2014). Global crop yield response to extreme heat stress under multiple climate change futures. Environ. Res. Lett. 9, 034011. doi:10.1088/1748-9326/9/3/034011
Deryng, D., Sacks, W. J., Barford, C. C., and Ramankutty, N. (2011). Simulating the effects of climate and agricultural management practices on global crop yield. Glob. Biogeochem. Cycles 25, GB2006. doi:10.1029/2009gb003765
Dickey, D. A., and Fuller, W. A. (1979). Distribution of the estimators for autoregressive time series with a unit root. J. Am. Stat. Assoc. 74, 427. doi:10.2307/2286348
Diepen, C. A., Wolf, J., Keulen, H., and Rappoldt, C. (1989). Wofost: A simulation model of crop production. Soil Use Manag. 5, 16–24. doi:10.1111/j.1475-2743.1989.tb00755.x
Donatti, C. I., Harvey, C. A., Martinez-Rodriguez, M. R., Vignola, R., and Rodriguez, C. M. (2019). Vulnerability of smallholder farmers to climate change in Central America and Mexico: Current knowledge and research gaps. Clim. Dev. 11, 264–286. doi:10.1080/17565529.2018.1442796
Edwards, P. N. (2010). A vast machine. Computer models, climate date and the politics of global warming. England: MIT Press.
Elliott, J., Kelly, D., Chryssanthacopoulos, J., Glotter, M., Jhunjhnuwala, K., Best, N., et al. (2014). The parallel system for integrating impact models and sectors (pSIMS). Environ. Model. Softw. 62, 509–516. doi:10.1016/j.envsoft.2014.04.008
Estrada, F., and Botzen, W. J. W. (2021). Economic impacts and risks of climate change under failure and success of the Paris Agreement. Ann. N. Y. Acad. Sci. 1504, 95–115. doi:10.1111/nyas.14652
Estrada, F., Botzen, W. J. W., and Calderon-Bustamante, O. (2020). The assessment of impacts and risks of climate change on agriculture (AIRCCA) model: A tool for the rapid global risk assessment for crop yields at a spatially explicit scale. Spat. Econ. Anal. 15, 262–279. doi:10.1080/17421772.2020.1754448
Estrada, F., Gay, C., and Conde, C. (2012). A methodology for the risk assessment of climate variability and change under uncertainty. Clim. Change 113, 455–479. doi:10.1007/s10584-011-0353-9
Estrada, F., Kim, D., and Perron, P. (2021). Anthropogenic influence in observed regional warming trends and the implied social time of emergence. Commun. Earth Environ. 2, 31. doi:10.1038/s43247-021-00102-0
Estrada, F., Mendoza-Ponce, A., Calderón-Bustamante, O., and Botzen, W. J. W. (2022). Impacts and economic costs of climate change on Mexican agriculture. Reg. Environ. Change 22, 126. doi:10.1007/s10113-022-01986-0
Fawcett, A. A., Clarke, L. E., Edmonds, J. A., Hultman, N. E., McJeon, H. C., Rojelj, J., et al. (2015). Can Paris pledges avert severe climate change? Science 350, 1168–1169. doi:10.1126/science.aad5761
Hawkins, E., and Sutton, R. (2012). Time of emergence of climate signals. Geophys Res. Lett. 39, L01702. doi:10.1029/2011gl050087
Hay, L. E., McCabe, G. J., Wolock, D. M., and Ayers, M. A. (1991). Simulation of precipitation by weather type analysis. Water Resour. Res. 27, 493–501. doi:10.1029/90wr02650
Herger, N., Sanderson, B. M., and Knutti, R. (2015). Improved pattern scaling approaches for the use in climate impact studies. Geophys. Res. Lett. 42, 3486–3494. doi:10.1002/2015gl063569
Ibarrola-Rivas, M. J., Castillo, G., and González, J. (2020). Diversity of social, economic and production implications of maize systems in Mexico. Investig. Geogr. 102, e60009. doi:10.14350/rig.60009
Ignjacevic, P., Estrada, F., and Botzen, W. J. W. (2021). Time of emergence of economic impacts of climate change. Environ. Res. Lett. 16, 074039. doi:10.1088/1748-9326/ac0d7a
Iizumi, T., and Ramankutty, N. (2015). How do weather and climate influence cropping area and intensity? Glob. Food Sec. 4, 46–50. doi:10.1016/j.gfs.2014.11.003
INEGI. (2020). Sistema de Cuentas nacionales de México. Producto interno bruto (PIB). México: Instituto Nacional de Estadística y Geografía.
IPCC (2021). “Climate change 2021: The physical science basis,” in Contribution of working group I to the sixth assessment report of the intergovernmental panel on climate change (Cambridge: Cambridge University Press).
Jägermeyr, J., Müller, C., Ruane, A. C., Elliott, J., Balkovic, J., Castillo, O., et al. (2021). Climate impacts on global agriculture emerge earlier in new generation of climate and crop models. Nat. Food. 2, 873–885. doi:10.1038/s43016-021-00400-y
James, R., Washington, R., Schleussner, C. F., Rogelj, J., and Conway, D. (2017). Characterizing half-a-degree difference: A review of methods for identifying regional climate responses to global warming targets. Wiley Interdiscip. Rev. Clim. Chang. 8, e457. doi:10.1002/wcc.457
Jones, J. W., Hoogenboom, G., Porter, C. H., Boote, K. J., Batchelor, W. D., Hunt, L. A., et al. (2003). The DSSAT cropping system model. Eur. J. Agron. 18, 235–265. doi:10.1016/s1161-0301(02)00107-7
Kim, K. H., Doi, Y., Ramankutty, N., and Iizumi, T. (2021). A review of global gridded cropping system data products. Environ. Res. Lett. 16, 093005. doi:10.1088/1748-9326/ac20f4
Knutti, R. (2019). Closing the knowledge-action gap in climate change. One Earth 1, 21–23. doi:10.1016/j.oneear.2019.09.001
Kogo, B. K., Kumar, L., and Koech, R. (2021). Climate change and variability in Kenya: A review of impacts on agriculture and food security. Environ. Dev. Sustain. 23, 23–43. doi:10.1007/s10668-020-00589-1
Kukal, M. S., and Irmak, S. (2018). Climate-driven crop yield and yield variability and climate change impacts on the u.s. great plains agricultural production. Sci. Rep. 8, 3450. doi:10.1038/s41598-018-21848-2
Lemos, M. C., Kirchhoff, C. J., and Ramprasad, V. (2012). Narrowing the climate information usability gap. Nat. Clim. Chang. 2, 789–794. doi:10.1038/nclimate1614
Lesk, C., Rowhani, P., and Ramankutty, N. (2016). Influence of extreme weather disasters on global crop production. Nature 529, 84–87. doi:10.1038/nature16467
Levis, S., Bonan, G. B., Kluzek, E., Thornton, P. E., Jones, A., Sacks, W. J., et al. (2012). Interactive crop management in the Community Earth System Model (CESM1): Seasonal influences on land–atmosphere fluxes. J. Clim. 25, 4839–4859. doi:10.1175/jcli-d-11-00446.1
Mahony, M., and Hulme, M. (2016). Modelling and the nation: Institutionalising climate prediction in the UK, 1988–92. Minerva 54, 445–470. doi:10.1007/s11024-016-9302-0
Meinshausen, M., Nicholls, Z. R. J., Lewis, J., Gidden, M. J., Vogel, E., Freund, M., et al. (2020). The shared socio-economic pathway (SSP) greenhouse gas concentrations and their extensions to 2500. Geosci. Model. Dev. 13, 3571–3605. doi:10.5194/gmd-13-3571-2020
Meinshausen, M., Wigley, T. M. L., and Raper, S. C. B. (2011). Emulating atmosphere-ocean and carbon cycle models with a simpler model, MAGICC6 – Part 2: Applications. Atmos. Chem. Phys. 11, 1457–1471. doi:10.5194/acp-11-1457-2011
Monterroso, A., Conde, C., Gay, C., Gómez, D., and López, J. (2014). Two methods to assess vulnerability to climate change in the Mexican agricultural sector. Mitig. Adapt. Strateg. Glob. Chang. 19, 445–461. doi:10.1007/s11027-012-9442-y
Müller, C., Elliott, J., Kelly, D., Arneth, A., Balkovic, J., Ciais, P., et al. (2019). The global gridded crop model intercomparison phase 1 simulation dataset. Sci. Data 6, 50. doi:10.1038/s41597-019-0023-8
Murray-Tortarolo, G. N., Jaramillo, V. J., and Larsen, J. (2018). Food security and climate change: The case of rainfed maize production in Mexico. Agric. For. Meteorol. 253-254, 124–131. doi:10.1016/j.agrformet.2018.02.011
Nordhaus, W. D. (2013). The climate casino: Risk, uncertainty, and economics for a warming world. United States: Yale University Press.
Perron, P. (1989). The great crash, the oil price shock, and the unit root hypothesis,. Econometrica 57, 1361–1401. doi:10.2307/1913712
Robertson, G., and Hamilton, S. (2015). Long-term ecological research in agricultural landscapes at the Kellogg Biological Station LTER site: Conceptual and experimental framework. New York: Oxford University Press.
Rosenzweig, C., Elliott, J., Deryng, D., Ruane, A. C., Müller, C., Arneth, A., et al. (2014). Assessing agricultural risks of climate change in the 21st century in a global gridded crop model intercomparison. Proc. Natl. Acad. Sci. 111, 3268–3273. doi:10.1073/pnas.1222463110
Said, S. E., and Dickey, D. A. (1984). Testing for unit roots in autoregressive-moving average models of unknown order. Biometrika 71, 599–607. doi:10.1093/biomet/71.3.599
SIAP. (2021). Datos municipales anules de la Información Agroalimentaria y Pesquera. Mexico: Secretaría de Desarrollo Rural (SADER) y Sistema de Información Agroalimentaria y Pesquera.
SIAP. (2019). Panorama agroalimentario 2019. Mexico: Servicio de Información Agroalimentaria y Pesquera.
Sitch, S., Smith, B., Prentice, I. C., Arneth, A., Bondeau, A., Cramer, W., et al. (2003). Evaluation of ecosystem dynamics, plant geography and terrestrial carbon cycling in the LPJ dynamic global vegetation model. Glob. Chang. Biol. 9, 161–185. doi:10.1046/j.1365-2486.2003.00569.x
Soares, M. B., and Buontempo, C. (2019). Challenges to the sustainability of climate services in Europe. Wiley Interdiscip. Rev. Clim. Change 38 (1), 1–9. doi:10.1002/wcc.587
Tang, S., and Dessai, S. (2012). Usable science? The U.K. Climate projections 2009 and decision support for adaptation planning. Wea. Clim. Soc. 4, 300–313. doi:10.1175/wcas-d-12-00028.1
Tebaldi, C., and Arblaster, J. M. (2014). Pattern scaling: Its strengths and limitations, and an update on the latest model simulations. Clim. Change 122, 459–471. doi:10.1007/s10584-013-1032-9
Tol, R. S. J., and Fankhauser, S. (1998). On the representation of impact in integrated assessment models of climate change. Environ. Model Assess. 3, 63–74. doi:10.1023/a:1019050503531:
van Vuuren, D. P., Stehfest, E., den Elzen, M. G. J., Kram, T., van Vliet, J., Deetman, S., et al. (2011). RCP2.6: Exploring the possibility to keep global mean temperature increase below 2°C. Clim. Change 109, 95–116. doi:10.1007/s10584-011-0152-3
Vaughan, C., and Dessai, S. (2014). Climate services for society: Origins, institutional arrangements, and design elements for an evaluation framework. Wiley Interdiscip. Rev. Clim. Change 5, 587–603. doi:10.1002/wcc.290
Villoria, N. B., Elliott, J., Müller, C., Shin, J., Zhao, L., and Song, C. (2016). Rapid aggregation of global gridded crop model outputs to facilitate cross-disciplinary analysis of climate change impacts in agriculture. Environ. Model Softw. 75, 193–201. doi:10.1016/j.envsoft.2015.10.016
Williams, J., Dagitz, S., Magre, M., Meinardus, A., Steglich, E., and Tylor, R. (2015). EPIC user’s manual version 0810. Texas: Texas A&M University.
Williams, J., Jones, C., and Dyke, P. (1984). A modeling approach to determining the relationship between erosion and soil productivity. Trans. ASAE 27, 0129–0144. doi:10.13031/2013.32748
Williams, J., Jones, C., Kiniry, J., and Spanel, D. (1989). The EPIC crop growth model. Trans. ASAE 32, 0497–0511. doi:10.13031/2013.31032
Zaveri, E., Russ, J., and Damania, R. (2020). Rainfall anomalies are a significant driver of cropland expansion. Proc. Natl. Acad. Sci. 117, 10225–10233. doi:10.1073/pnas.1910719117
Ziska, L. H., Bunce, J. A., Shimono, H., Gealy, D. R., Baker, J. T., Newton, P. C. D., et al. (2012). Food security and climate change: On the potential to adapt global crop production by active selection to rising atmospheric carbon dioxide. Proc. R. Soc. Lond. B Biol. Sci. 279, 4097–4105. doi:10.1098/rspb.2012.1005
Keywords: climate change, agriculture, emulator, risk, integrated assesment
Citation: Estrada F, Mendoza A, Murray G, Calderón-Bustamante O, Botzen W, De León Escobedo T and Velasco JA (2023) Model emulators for the assessment of regional impacts and risks of climate change: A case study of rainfed maize production in Mexico. Front. Environ. Sci. 11:1027545. doi: 10.3389/fenvs.2023.1027545
Received: 25 August 2022; Accepted: 22 February 2023;
Published: 09 March 2023.
Edited by:
Rupakumar Kolli, Indian Institute of Tropical Meteorology, IndiaReviewed by:
Mannava Sivakumar, World Meteorological Organization, SwitzerlandÚrsula Oswald-Spring, National Autonomous University of Mexico, Mexico
Copyright © 2023 Estrada, Mendoza, Murray, Calderón-Bustamante, Botzen, De León Escobedo and Velasco. This is an open-access article distributed under the terms of the Creative Commons Attribution License (CC BY). The use, distribution or reproduction in other forums is permitted, provided the original author(s) and the copyright owner(s) are credited and that the original publication in this journal is cited, in accordance with accepted academic practice. No use, distribution or reproduction is permitted which does not comply with these terms.
*Correspondence: Francisco Estrada, ZmVwb3JydWFAYXRtb3NmZXJhLnVuYW0ubXg=