 Yunlong Zong1
 Sophia Shuang Chen
 Giri Raj Kattel
- 1School of Geographical Sciences, Nanjing University of Information Science and Technology, Nanjing, China
- 2Research Centre of Urban Sustainable Development, Nanjing University of Information Science and Technology, Nanjing, China
- 3State Key Laboratory of Lake Science and Environment, Nanjing Institute of Geography and Limnology, Chinese Academy of Sciences, Nanjing, China
- 4Department of Infrastructure Engineering, University of Melbourne, Melbourne, VIC, Australia
- 5Department of Hydraulic Engineering, Tsinghua University, Beijing, China
Rapid urbanization has caused widespread environmental pollution in Africa, restricting sustainable development programs. Today, non-point source pollution has become a major threat to many African cities. In this study, we have classified urban land use followed by the identification of urban functional areas based on multi-source data. We have then evaluated non-point source pollution based on nitrogen and phosphorus loads at a spatial scale in Mwanza city (Tanzania). We have estimated the spatial distribution of total nitrogen (TN) and total phosphorus (TP) loads at a scale of 1 square kilometer grid. The results show that ① the built-up area of the city was identified as 28.9 km2, accounting for 6.8% of the total area of the city. The area of informal settlements was 56.9 km2, accounting for 13.4% of the total area of the city. About 90.38% of 2.41×10⁵ kg of the total TN load and 87.23% of 4.00×10⁴ kg of the total TP load in the city were derived from the informal settlements alone in 2020. ② The average load intensities of TN and TP in Mwanza city were 6.90 kg·hm-2·yr-1 and 1.14 kg·hm-2·yr-1, respectively. The average TN and TP intensities in Mwanza city were slightly higher than the average TN and TP load intensities in the Lake Victoria basin. However, given the high population density of the Mwanza city area, the average TN and TP intensities were found to be consistent. ③ The TN and TP pollution loads were relatively concentrated in the inner urban area, including the lower reaches of the Mirongo River basin, the eastern side of the Nyamagana Peninsula, and the lakeside area extending north and south from the peninsula, and gradually decreased toward the city’s outskirts. We propose that the identified riparian areas in our study should be prioritized as potentially key construction zones for pollution treatment plant facilities and urban renewal pilot programs for restraining the widespread informal settlements. This study contributes to the development of an innovative urban non-point source pollution control measure, which may be applicable to low-income countries in Africa and elsewhere.
1 Introduction
Non-point source pollution is one of the most complex global issues, causing significant degradation of urban water quality (Gong et al., 2018). Expansion of built-up areas, population growth, industrial development, and several other factors exacerbate non-point source pollution in cities worldwide (Kattel et al., 2020; Qian et al., 2021). Over the recent decades, many African cities have faced severe non-point source pollution problems due to unmanaged urban developments such as large-scale “slums” without the provision of appropriate infrastructure in the inner city and the widespread increase of low-density and low-quality informal settlements across the city’s outskirts. In many African developing countries, modern urban areas are often integrated with informal settlements, agriculture, and livestock production areas (Vuai et al., 2013), resulting in mismanagement of the city’s environment and consequently difficulty in the estimation of non-point source pollution loads. Urban non-point source pollution load estimation in many African countries is usually different from that of well-developed, fully urbanized areas in Europe and elsewhere. However, studies on non-point source pollution in poorly managed urbanized areas of Africa are often limited. As a result, the data relevant to obtain a comprehensive understanding of the non-point source pollution load in the region are scarce.
Until recently, various models have been used to estimate non-point source pollution loads. However, the mechanistic and empirical models are the two most common models that are currently being employed for estimating urban non-point source pollution loads (Haith and Tubbs, 1981; Brezonik and Stadelmann, 2002; Mao et al., 2012). The mechanistic model defines pollutant pathways with strong applicability and accurately describes the hydrological cycling process, which clearly reflects the spatial characteristics of the watershed (Zhai et al., 2012). However, this model requires high-quality data, including accurately measured hydrological and water quality data, which are available only in a few urban areas of African countries such as Niger and Togo (Schuol et al., 2008). Lately, the Soil and Water Assessment Tool (SWAT), one of the commonly used mechanistic models, has been adopted in the Simiyu River basin in Tanzania (Kimwaga et al., 2012; van Griensven et al., 2013) and the Sondu River basin in Kenya (Cheruiyot and Muhandiki, 2015). The SWAT models used in Tanzania and Kenya suggest that if the observation data used to determine the model parameters are too little, the simulation results of sediment and nutrient salts in water are not ideal, and the agreement between the simulated value and the observed value is not high (Cheruiyot and Muhandiki, 2015). To resolve this issue, the model needs modified parameters with an increased dataset so that it will be unbiased and produce accurate results. Until recently, many poorly developed urban surface and catchment areas in African countries often lacked good sources of high-quality data, consequently impeding the successful application of the SWAT model (Rao et al., 2022).
The empirical model, on the other hand, adopts the export coefficient and source intensity coefficient approaches (Ma et al., 2011), which are used to estimate non-point source pollution by establishing the relationship between land use and pollutants (Rhee et al., 2012). Although the accuracy of simulation in the empirical model is lower than that in the mechanistic or SWAT model, it would usually satisfy the practical application in the areas lacking hydrologic, meteorological, and water quality data (Gao et al., 2022). For example, Li et al. (2009) and Li et al. (2016) combined local pollutant output characteristics with parameter correction in the Xitiao River basin in the southwest of Tai Hu Lake and the Xinlicheng Reservoir in Changchun in China and determined the non-point source pollution export coefficients of dry land, grassland, orchards, forest, and constructed land and then used the export coefficient model to estimate the pollution load. Application of the export coefficient model was found to be increasingly useful for identifying non-point source pollution sources and providing advice on pollution prevention and control measures to resource managers in the region (Varekar et al., 2021). Lately, the export coefficients of different land use types such as forest, grassland, cropland, and pavements under different topographies have also become useful to estimate nitrogen and phosphorus pollution loads at the spatial scales of various watersheds in China and elsewhere (Calamari et al., 1995; Scheren et al., 2004; Liu et al., 2021; Tong et al., 2022). However, due to differences in land use classification methods and type identifications among different countries and regions, as well as differences in pollutant output characteristics, research on non-point source pollution based on regional environments will help better understand its spatial distribution patterns.
Mwanza is the second largest city located on the shore of Lake Victoria in Tanzania. Rapid urbanization and industrialization of Mwanza and increased mismanagement of the city have led to severe nitrogen and phosphorus enrichments in Lake Victoria, causing serious environmental problems over the past decades (Zhang et al., 2019; Guo et al., 2023). The poorly developed drainage system and lack of sewage treatment facilities in residential areas, together with the increase in informal settlements around the lowland waterfronts surrounded by agricultural areas, have caused serious non-point source pollution in the Mwanza city area (Kalvin et al., 2016).
Existing studies in the past mainly explored the water quality issue in Mwanza city based on the measurement of some sections of the river on a temporal basis (Chen et al., 2022) or the calculation of urban nitrogen and phosphorus budgets for the reduction of nitrogen and phosphorus inputs into Lake Victoria (Xiong et al., 2022; Guo et al., 2023). However, the distribution source, composition, and spatial differentiation in characteristics of urban nitrogen and phosphorus output in Mwanza city have not yet been comprehensively investigated. Here, we ask two key questions on nitrogen and phosphorous sources in Mwanza city: 1) what are the characteristics of the source composition and spatial differentiation of non-point source pollution in informal urbanized areas? and 2) how to evaluate the spatial differentiation in the distribution of non-point source pollution loads in areas with limited availability of data? Having addressed these two key questions, we can provide a scientific basis for local pollution prevention and control measures in similar cities in Africa and elsewhere.
2 Study area and land use
Mwanza city is located on the south shore of Lake Victoria in northwest Tanzania, with a total area of 1,325 km2, including 425 km2 of land area and 900 km2 of water area. The city has two districts, Nyamagana and Ilemela, with 21 wards (Figure 1). The socio-economic structure of the city is mainly based on agriculture, and the city experiences the savanna climate type, which is relatively mild and wet, with an average annual temperature of 23.5°C and an average precipitation of 1050 mm.
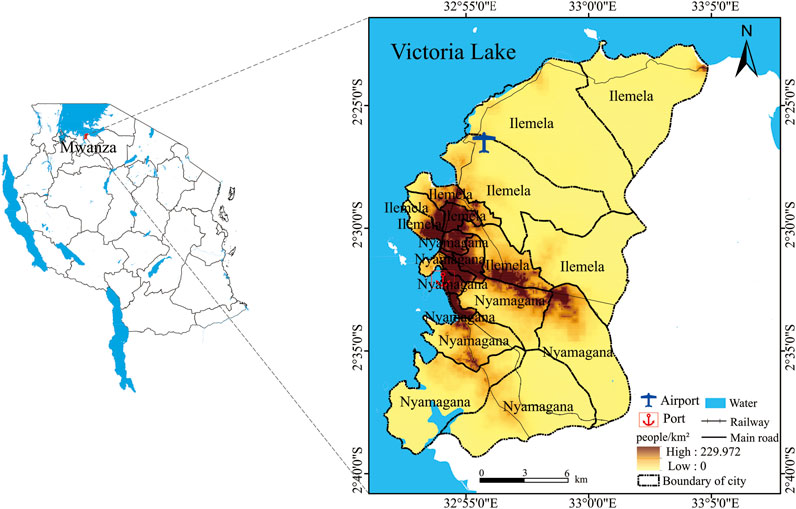
FIGURE 1. Study area and population density of Mwanza city, which is mainly located near the Mwanza Gulf adjacent to Lake Victoria.
The World Bank report suggests that Mwanza city has a total of 1,182,011 people residing there in 2022, and the national Tanzania census data and relevant literature suggest that the greater Mwanza city is an urban area, but it still contains a part of the rural population with existing agricultural land masses and many informal settlements (Wineman et al., 2020). The existence of informal settlements is a prominent phenomenon in many African cities, including Mwanza and other less-developed regions (Acolin and Kim, 2022). In Tanzania, influenced by the absence of a land system for living and cultivation and a lack of effective planning mechanisms, the rapid growth of the population has caused the expanding and disorderly spreading of informal settlements, consequently blurring the boundary between urban and rural areas (Andreasen et al., 2020). At present, more than 70% of residential areas do not have a drainage system, and sewage treatment facilities are mainly concentrated in the city’s central business district (CBD) and other surrounding formal residential areas (Kalvin et al., 2016). Informal settlements are mostly located on slopes or lowland waterfront areas with complex geographical environments exposed to the vulnerability of natural disasters such as floods and landslides. The people living in informal areas lack the basic needs for safe water and sanitation facilities. The waste discarded and discharged by residents gathered here becomes atypical urban non-point source pollution. Located to the west of the famous Serengeti National Park and the south shore of Lake Victoria, Mwanza is also an important port city and tourism distribution center, with the railway, high-grade highway, aviation, and other transportation modes, as well as gathering aquatic products, processing and trading, cotton spinning, electricity, and other industries (Flynn, 2001).
Based on the aforementioned characteristics, we summarized Mwanza city into six different land use types, including the built-up area, informal settlement, forest, grassland, agricultural land, and water body, among which the built-up area includes a formal residential area and the land use area for industries, commercial, public services, and educational and scientific research.
3 Materials and methods
3.1 Flow chart for non-point source pollution simulation
The main idea of this study was to classify urban land use based on multi-source data to estimate non-point source pollution of nitrogen and phosphorus load by simulation. We developed a flow chart for the spatial distribution of nitrogen and phosphorous loads in Mwanza city (Figure 2). The flow chart consists of four main steps: basic data collection and processing, classification of urban land use, a pollution load model to estimate urban pollution, and results and analysis. Part one includes data acquisition and processing. Parts two and three are the main components or the body of the flow chart. Part two focuses on the urban land use classification and urban functional area identification. Part three is based on the classical export coefficient model according to urban land use, population, and industrial development conditions, from which TN and TP loads are estimated and the spatial distribution of the TN and TP load intensity at different scales of the city is estimated. Part four is our conclusion based on the analysis and synthesis of our results.
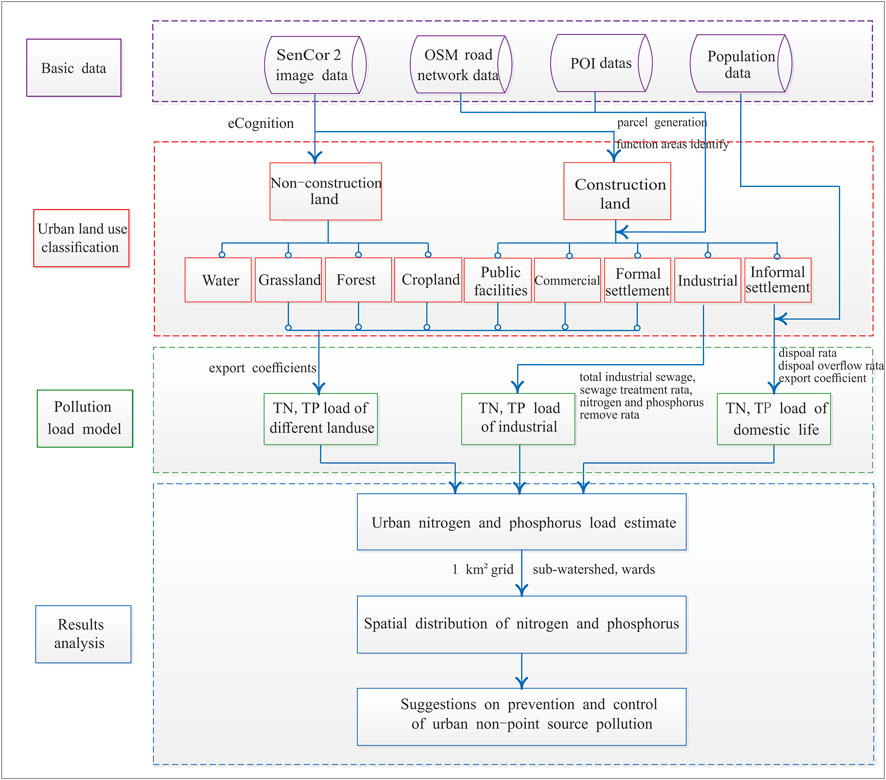
FIGURE 2. Flow chart for spatial distribution of nitrogen and phosphorus simulation, including input data, methods, and results. Three pollution sources can play the key role: urban land use, pollution of informal settlements, and industrial emissions. The TN and TP load intensities at grid, sub-watershed, and sub-region scales have been shown in the flow chart.
3.2 Data source and processing
Data used in this study includes administrative boundary data, remote sensing image data, road network data, point of interest (POI) data, population data (Table 1), and empirical parameter data (Table 2). Administrative boundary data were obtained from the Tanzania National Bureau of Statistics. For convenience, we removed smaller islands. Image data were obtained from the 2020 SenCor data of the European Space Agency (ESA) after radiometric calibration and clipping. POI data were from the Open Street Map (OSM). We deleted some data that had no practical significance and no full information. We verified the output with Google Maps and then finally selected a total of 84,691 POIs. The POIs were divided into six categories: residential settlements (formal and informal settlements), commercial (shopping, retail trade, catering services, banks, etc.), industrial facilities (mining, fish product processing, companies, etc.), educational and scientific research organizations (educational institutions, research institutes, etc.), and public services and facilities (government offices, medical use of land, airport, station, etc.) according to the Mwanza city Master Plan (Kalvin et al., 2016). The population data were derived from grid data with a spatial resolution of 100 m on the official website of WorldPop in 2020. In this study, based on the raster population data, we extracted the population of the built-up area (N = 355447) and then obtained the population of informal settlements (N = 614263). The digital elevation model (DEM) was used to extract urban water systems and sub-watersheds. We obtained the DEM data from the Advance Land Observing Satellite (ALOS). According to the administrative boundary data of Mwanza city, we obtained the DEM data of our study area, and then, we divided the city into 26 sub-watersheds.
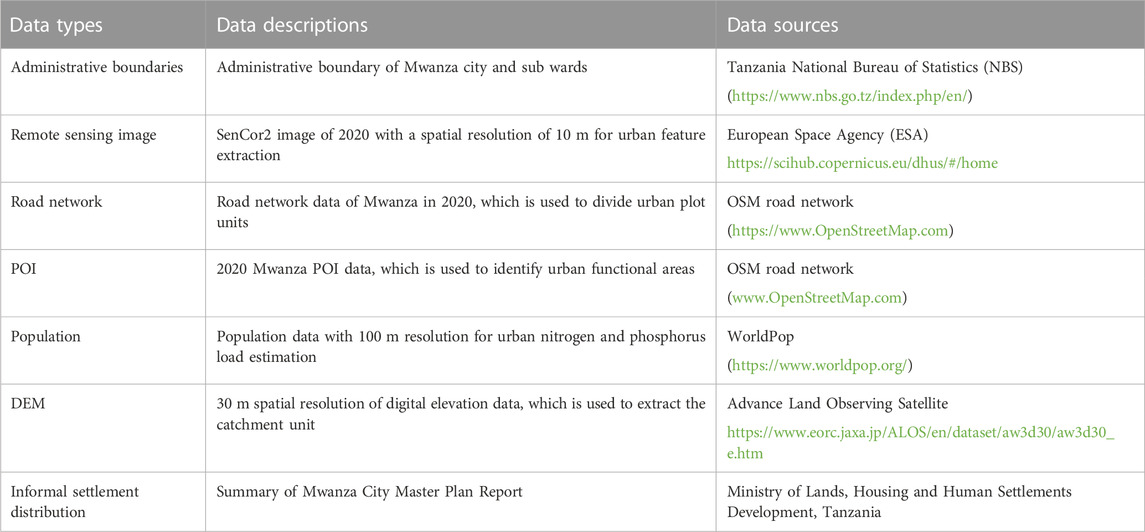
TABLE 1. Data types that played different roles in Mwanza city.
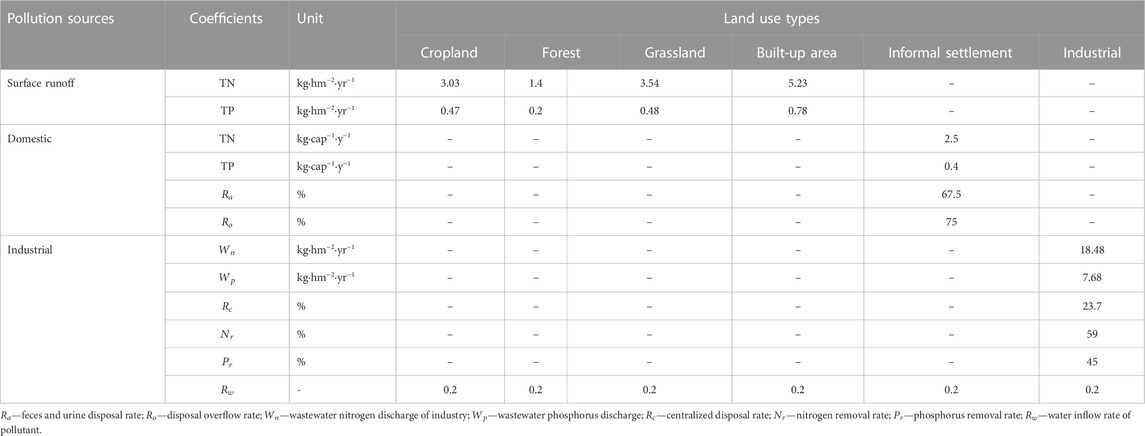
TABLE 2. Export coefficients of nitrogen and phosphorus from surface runoff, domestic, and industrial non-point sources.
Given the limited data, we have to use the export coefficient and source intensity coefficient approaches. Some empirical parameters, including land use coefficients, urban domestic household coefficients, and industrial wastewater coefficients, were adopted in this study. We adopted parameters from areas with similar spatial backgrounds to the study area by drawing on the practices of other scholars from different times (Calamari et al., 1995; van Horen, 1996; Young et al., 1996; Scheren et al., 2000; Jonsson et al., 2004; Abira et al., 2005; Awiti, 2006; Cheruiyot and Muhandiki, 2014; Xiong et al., 2020). For example, we have summarized the studies related to export coefficients by land use class in the Lake Victoria Basin (Supplementary Annex Table S1) and the per capita nitrogen and phosphorus emission coefficients (Supplementary Annex Table S2). The nitrogen export coefficient of land use in the Lake Victoria Basin over different periods (Supplementary Annex Table S1) shows that nitrogen export in cropland is generally higher than that of forest and grassland, while nitrogen export in constructed land is close to or higher than cropland (Calamari et al., 1995; Van Horen, 1996; Scheren et al., 2000; Awiti, 2006). However, Cheruiyot and Muhandiki (2014) reported that the nitrogen output of forest and grassland in Kenya is much higher than that of cropland, suggesting land use differences in different geographies can lead to variation in nitrogen pollution in Africa. The export coefficients of different land use types in the eastern Australian river basin (Young et al., 1996) in the southern hemisphere showed annual average rainfalls close to our study area, suggesting that the nitrogen emission in forests is the lowest among all land use types. Hence, we disregarded the forest export coefficient of Kenya and adopted the Australian study by Young et al. (1996). By averaging the TN and TP values from several studies (Ierodiaconou et al., 2005; Ding et al., 2010), we reviewed and summarized them in Table 2. Finally, we established both nitrogen and phosphorus export coefficients for different land use types in our study area (Table 2). For industrial wastewater coefficients, we used parameters for the calculation of industrial pollution load available in the literature and the statistical book of the Mwanza government (Kalvin et al., 2016). At present, there is only one sewage treatment plant in Mwanza city, which is located in Ilemella; the total industrial sewage discharge in Mwanza city is as high as 6500 m3·d−1 (Kalvin et al., 2016), in which the sewage treatment rate is about 23.7% (Madenge, 2021) and the nitrogen and phosphorus removal rates are approximately 59% and 45%, respectively (Mbwele, 2006; Mayo, 2013). After treatment, the concentrations of nitrogen and phosphorus in industrial wastewater discharge shall not exceed 15 mg·L−1 and 6 mg·L−1, respectively (TBS, 2005).
3.3 Image multi-scale segmentation-based land cover classification
After pre-processing the remote sensing images with geometric correction and image clipping, we first we used eCognition for multi-scale segmentation of the image. In this process, the whole image plane was segmented into polygonal images with similar attribute information at any scale. The scale parameter of image segmentation is very important for the quality of the classification result (Wu et al., 2022). The optimal segmentation scale in the study area is determined by combining the Estimation of Scale Parameter (ESP) in eCognition software with the maximum area method (Drǎgut et al., 2010). When the rate of change (ROC) in ESP software reaches its maximum value, it indicates that this scale may be the optimal segmentation scale (Cánovas-García and Alonso-Sarría, 2015). Under different segmentation scales, when the area tends to be flat, it may be the optimal segmentation scale (Mohan Vamsee et al., 2018). In actual operation, ESP is run in eCognition, and the obtained TXT file is imported into the ESP Chart program (Liu, 2020). Based on the running results, the optimal segmentation scale was finally determined to be 90 (Figure 3).
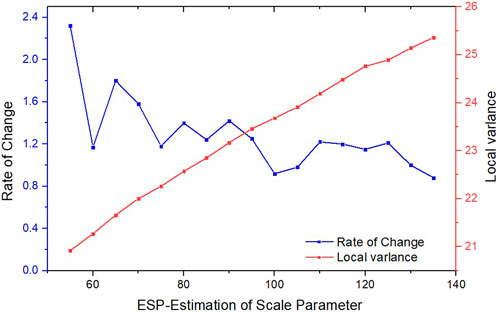
FIGURE 3. ESP evaluation results.
Second, the selection of plot features used in this study is based on the spectral features of the Sentinel 2 image (including mean and standard deviation of red, green, blue, and near-infrared bands), the normalized difference vegetation index (NDVI), and texture features (the detailed structure of the remote sensing image referring to the frequency of pixel tone changes on the image) (Wu et al., 2009; Tu et al., 2020), and the support vector machine (SVM) classification method was used for supervised classification in eCognition. Combining the environmental characteristics and research objectives of the study area, the surface features in the study area were classified into five categories: constructed land (which includes built-up areas and informal settlements), agricultural land, forest, grassland, and water body. Finally, the classification was post-processed by comparing it with Google high-definition images.
3.4 Extraction and classification of urban land functional areas
The OSM road network was used to divide the urban inner space plot units, and the OSM road network was treated as follows.
1) Different roads such as railways, expressways, and trunks were screened according to the attributes of road networks. Then, after topological processing, the independent road is deleted, whose length is less than 100 m, and the suspended road is extended to the adjacent road network.
2) The screened roads were classified according to the first grade (railway, expressway, and main road), second grade (secondary trunk road, first-grade road, and second-grade road), and third grade (third-grade road and residential road), and 30 m, 20 m, and 10 m buffer zones were formed successively. After removing the road space and deleting the research units with smaller areas, independent plot units in the study area are finally obtained (Wang et al., 2021).
Based on the generation of plot units, POI point kernel density analysis is used to extract the urban function areas. Kernel density analysis reflects the spatial connection of things and core elements according to their distance from the core elements (Hao et al., 2018), which is generally used in studies on urban infrastructure, commercial spatial agglomeration, and risk assessment of traffic sections (Elgammal et al., 2002). This study calculates the kernel density values for different types of POI by kernel density analysis; the calculation formula is as follows:
where
The calculation formula of bandwidth h is as follows:
where SD is the standard distance between the mean center of the point and all points;
Taking the construction land in Mwanza city as the object, the kernel density analysis maps of commercial land, industrial land, residential land, public service and facility land, and education and research land were obtained by kernel density analysis, as shown in Figure 4. The functional areas of urban land are identified according to the proportion of kernel density of various POIs in the plot unit. The calculation formula is as follows:
where
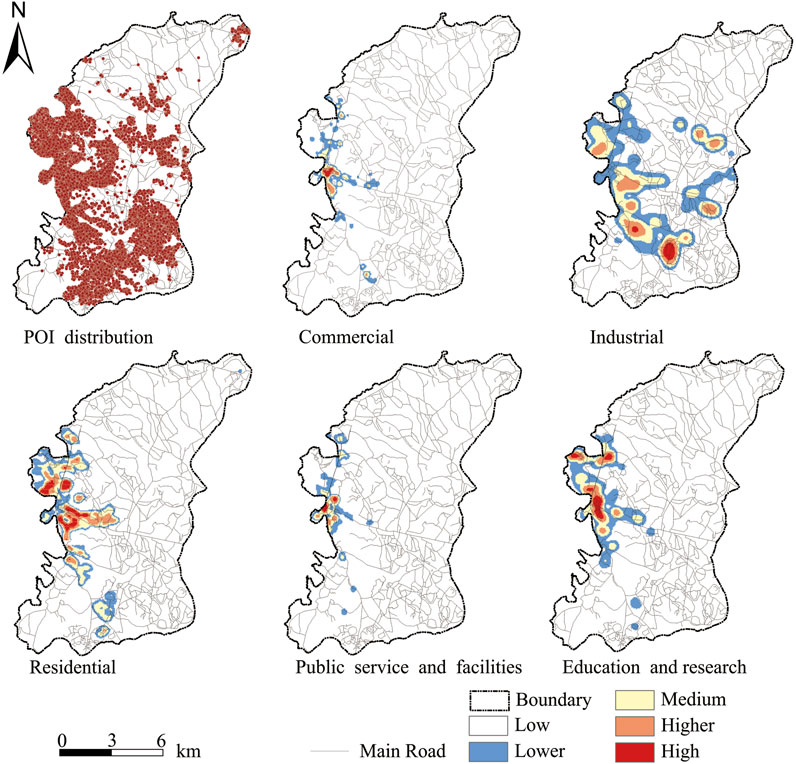
FIGURE 4. The POI distribution and kernel density analysis of different land use types in Mwanza city. The urban built-up area is divided into five different functional areas. The POI of Mwanza mostly distributes on the northwest and the southeast. The zone with high kernel density of different types of POIs is concentrated in the city center near the Mwanza Gulf.
Due to the complexity of urban functions, including the interactions among businesses, education, and residential areas, there were inevitably two or more urban functional areas identified: mixed functional areas and comprehensive functional areas. They were distinguished by setting thresholds for the frequency density of POI within the plot units. When the frequency density of POI is more than or equal to 50%, the plot unit is assigned to be a single functional area (Ding et al., 2020). When the POI frequency density in the unit is between 20% and 50%, the plot unit is assigned to be a mixed functional area (Ding et al., 2020). The rest is assigned as a comprehensive functional area. Finally, combined with Google Image, the single functional area was identified as the land type, and the mixed functional area and comprehensive functional area were artificially merged through visual interpretation, either classified as the land type of the dominant function or the land type of the adjacent parcel. By fusing POI data and road network data, 7,006 plot units in the city were obtained, and patch errors were modified based on kernel density analysis and visual interpretation. Based on the obtained residential functional areas, the informal settlements were visually interpreted based on the distribution map of informal settlements and sewerage network coverage map provided by the Mwanza Urban Master Plan, combined with Google high-definition images.
3.5 Model of pollution load
As the municipal area of Mwanza city contains a large amount of non-construction land and informal settlements that are distributed extensively within the city, the coverage of urban sewage centralized treatment facilities is only about 23% (Kalvin et al., 2016). Different from the classical export coefficient model, in this study, we considered not only the pollution generated by surface runoff but also the domestic sewage discharged by the population of the informal settlements and the treatment process of industrial wastewater. However, due to the data limitations, it is difficult to distinguish and obtain different types of industrial pollution under existing conditions, and there is no way to calculate point sources one by one. So, we used tailwater discharge from the industrial wastewater collected at sewage treatment plants in the city as a point source and estimated the amount of non-point source pollution from urban industrial wastewater discharge through wastewater pollution concentration. Informal settlements mostly use open toilets and septic tanks, and some of the feces and urine are retained, while some of it overflows into downstream rivers during the rainy season. Both domestic and industrial pollution in Mwanza city is mostly untreated and uncontrolled, and often the pollution is directly linked to the rivers, lakes, and reservoirs (Zhang et al., 2020; Guo et al., 2023). In similar studies, the calculation of the pollution load of poultry in urban areas is often neglected due to the small amount of pollution load produced by poultry (Scheren et al., 2000; Ding et al., 2013). Meanwhile, due to the difficulty in obtaining the poultry data in the study area, the pollution load of poultry was ignored in order to simplify the model. We used three methods to estimate the non-point source pollution load based on land use (Eq. 5), the domestic pollution load based on population (Eq. 6), and the industrial pollution load (Eq. 7), respectively, where Equation (5) excludes informal settlements and industrial areas. The results are annual averages, and the equation for calculating phosphorus pollution load is the same as for nitrogen pollution load, using different coefficients. In order to distribute the load of TN and TP in space, we used three scales: grid, sub-watershed, and sub-region (wards). We used the analysis function of GIS to obtain the load of the grid cell and then summarized the TN and TP load of the grid into the sub-watershed and sub-region. We relied on Eq. 9 to obtain the spatial distribution of the load intensity of the TN and TP in different scales. The equations are as follows:
where
4 Results and discussion
4.1 Urban land use structure and distribution
The results of the land use classification of Mwanza city shown in Figure 5 clearly suggest that built areas in the city are distributed as clumps and informal settlements. This shows how the city itself is intertwined with patches of agricultural, forested, and grassland areas. The structure of the urbanized area is a complex mixture of different types of land use, land cover, and built-up areas. The areas and percentages of ten different land use types are shown in Table 3. Agricultural land (45.1%) is the main type of urban land use, which is distributed extensively across the northeast of the city, while the constructed land (6.8%) is mainly distributed across the south-central part of the city. The built-up area of the city extends from the center, which locates around the lakeshore, to the city’s outskirts, connected by the three main traffic roads to the north along the Makongoro road connecting the airport, to the east along the Nyerere road connecting the Musema, and to the south along the Kenyatta Road connecting the Hinianga (Zhang, et al., 2019). More than 90% of the commercial and economic activities of the city take place in Mirongo, Isamilo, and Pamb, around the Mwanza city port adjoining Lake Victoria. Only a small proportion (1.55%) is the formal settlement with good built-up infrastructure extending outward along the commercial district; otherwise, the large area contains informal settlements consisting of densely clustered small houses occupied by low-income residents. The economic condition of the informal settlements is further constrained by hills, slopes, lowlands, and river corridors with poorly invested infrastructure, causing increased air and water pollution (Hambati and Yengoh, 2018). The notable pollution sources in Mwanza city are existing industrial areas (3.9%), including Igoma, Buhongwa, Nyakato, Igoma, Ilema, and the Igogo fish processing and industrial facilities. In addition, the proposed pharmaceutical industry, planned for the Bhongwa area, would be the future pollution source for the city (Zhang et al., 2019). Scattered public services and facilities (1.17%) in patches and clusters across the city, such as educational facilities including the St. Augustine University of Tanzania and Nganza Secondary School in Mkolani and extended north–south distribution of agricultural area, clearly indicate the poor planning of the city, enhancing various forms of pollution.
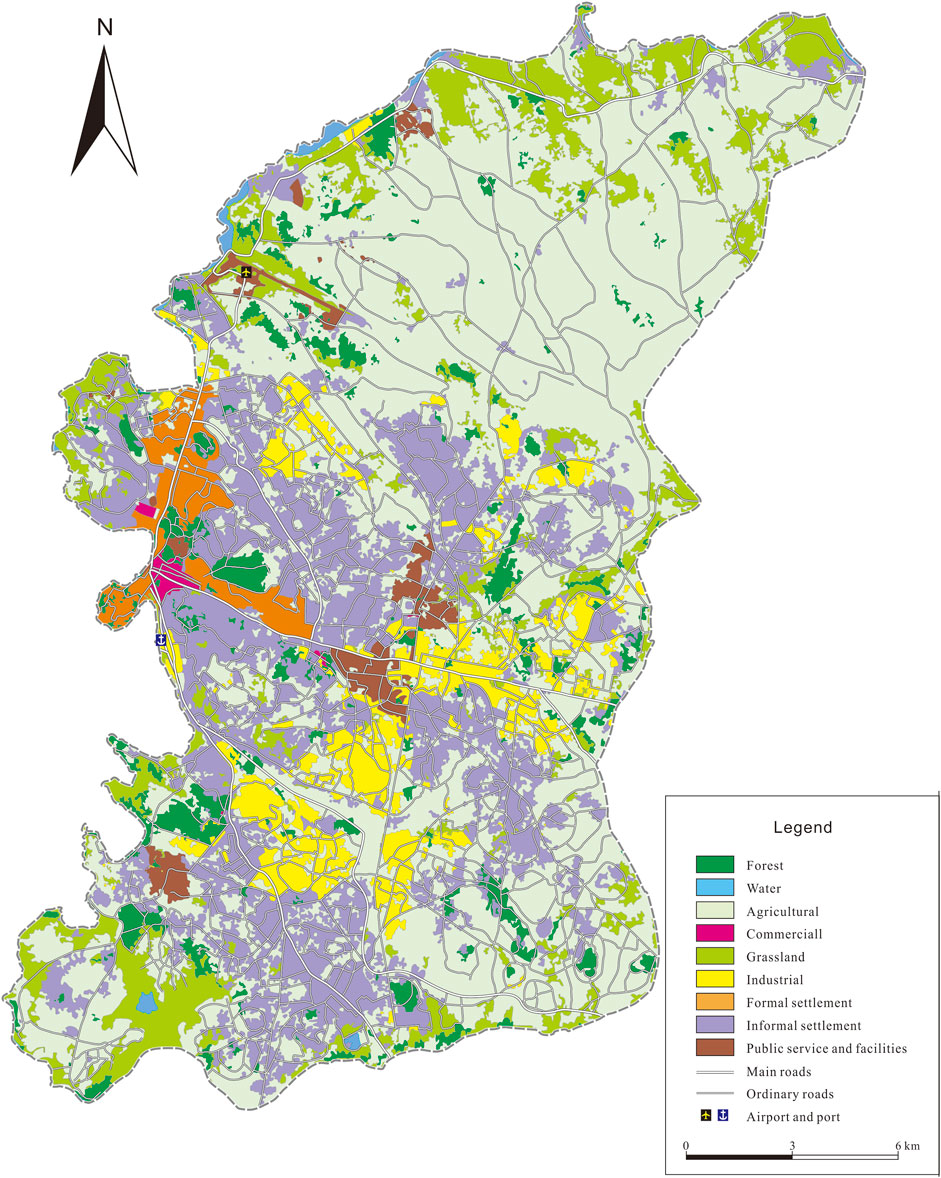
FIGURE 5. Land use structure of Mwanza city. A total of nine land use types and main roads in the city have been shown across north–south and east–west gradients, where the road runs through the city.
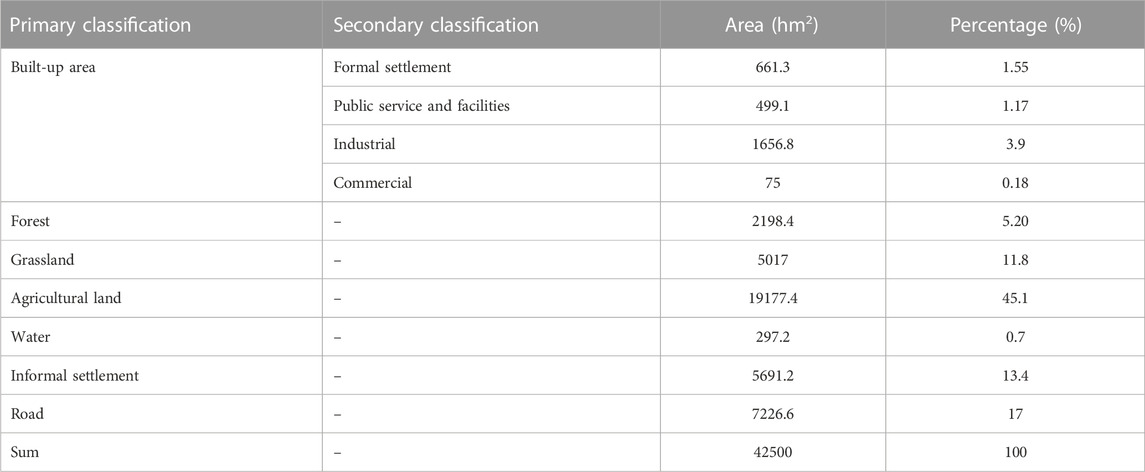
TABLE 3. Land use classification system and the area and the percentage of different land use in Mwanza city. The urban land use is divided into different systems including the five primary classifications and the built-up area, which contained five secondary classifications. The land use excludes the roads.
4.2 TN and TP loads and contribution rates of various pollutant sources
Existing studies suggest that the export coefficient correctly evaluates nitrogen and phosphorous non-point source pollution loads when combined with other models (Zhang et al., 2013; Guo et al., 2023). We used the export coefficient by combining it with the source intensity coefficient to calculate nitrogen and phosphorus pollution loads from surface runoff (Eq. 5) and domestic (Eq. 6) and industrial wastage (Eq. 7) at the 1 km
Based on the pollution load model and different coefficients, we calculated the TN and TP loads of Mwanza city and then summarized the city’s pollution, as shown in Table 4. Table 4 shows that the total TN and TP loads in Mwanza city in 2020 were 241190.16 kg and 39986.16 kg, respectively, and the TN load was six times that of the TP, suggesting very high nitrogen-related pollution in the city. If the total pollution load is divided by the sum of the area of each land category (Figure 5), the average pollution load intensity for Mwanza city can be calculated as 6.9 kg·hm−2·yr−1 for TN and 1.14 kg·hm−2·yr−1 for TP. However, it is advisable that we calculate the pollution load intensity, but we did not consider the area of roads in our model. From our observation, the pollution load intensity in the road area should be negligible as there is no high-density road construction in Mwanza city. When we equally distributed over the basin area according to the TN and TP inputs to the basin area from urban domestic and agricultural sources in the Lake Victoria basin as per the calculation provided by Scheren et al. (2004) and COWI Consulting Engineers (2002), the results of the pollution load intensity ranged from 1.75 to 2.75 kg·hm−2·yr−1 (TN) and 0.34–0.39 kg·hm−2·yr−1 (TP), respectively. These results were lower than the results of this study. This is because our study area was densely populated, so it would be reasonable for the pollution load intensity to be higher than that of the basin average.
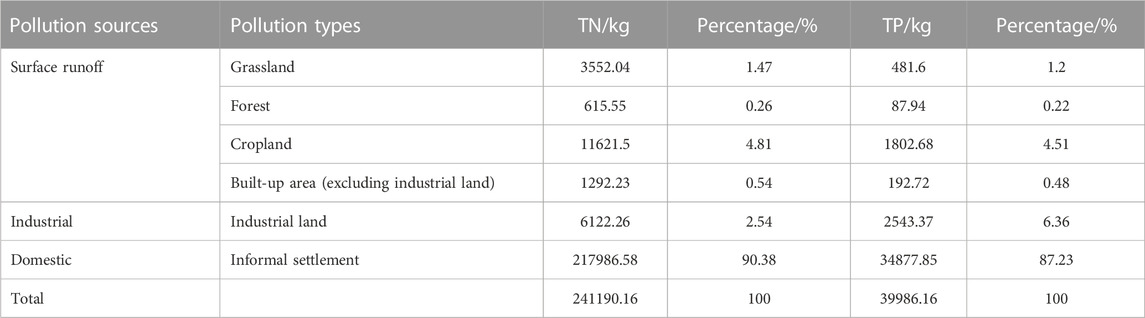
TABLE 4. TN and TP load estimation results of different land use types in Mwanza City.
From the perspective of pollution sources, the contribution rates of TN were mainly domestic household wastes, surface runoff, and industrial wastes (Table 4). The contribution rates of TP were also mainly domestic household wastes, surface runoff, and industrial wastes, respectively (Table 4). From the perspective of land use and the TN load, the contribution rates of different land use types were in the order of informal settlements, cropland, industrial areas, grassland, built-up areas (excluding industrial areas), and forest, respectively (Table 4). Informal settlements alone contributed to as high as 90.38% of the TN load of the city (Table 4). In the context of the TP load, the contribution rates of different land use types were in the order of informal settlements, industrial areas, cropland, grassland, urban built-up area (excluding industrial areas), and forest (Table 4). Informal settlements alone contributed to as high as 87.23% of the TP load of the city (Table 4). Domestic household waste was the main source of the TN and TP pollution loads of the city. Industrial land was the third and second largest source of TN and TP pollution loads in Mwanza city, respectively. Cropland was the main land use type in Mwanza city. Although the cropland area was much larger than that of informal settlements, its contribution to TN and TP pollution loads was found to be relatively less. First, Mwanza city is a large city around Lake Victoria; more developed industrial and commercial areas would attract people’s migration to the city for employment, resulting in the high population density. Next, the level of agricultural productivity in Mwanza city is still primitive, as the use of pesticides and fertilizers is relatively low and soil erosion is the main source of agricultural surface source pollution load (Mwanuzi et al., 2005). Several studies have shown strong relationships between land use types and non-point source pollution in Africa and elsewhere (Wu et al., 2015; Yang et al., 2020). Especially in semi-urbanized areas in Africa and Asia with high population density, nitrogen and phosphorus pollution is mainly caused by population growth, showing high pollution intensity in urban areas and low pollution intensity in agricultural areas (Shen et al., 2014). However, in our study, the proportion of pollution load in urban built-up areas (excluding industrial land) is slightly higher than that of the forested area (Table 4). Considering that the built-up area occupies only 6.8% of the total urban area and is covered by a sewage treatment pipe network. We argue that the improved infrastructure will effectively filter nitrogen and phosphorus load in the city and improve the utilization efficiency of nitrogen and phosphorus resources (Iloms et al., 2020) so that its total load is the smallest.
4.3 TN and TP load intensity and spatial distribution
4.3.1 Analysis of grid unit characteristics
The TN and TP load intensity distributions of land use, domestic life of people, and industry in the 1 km
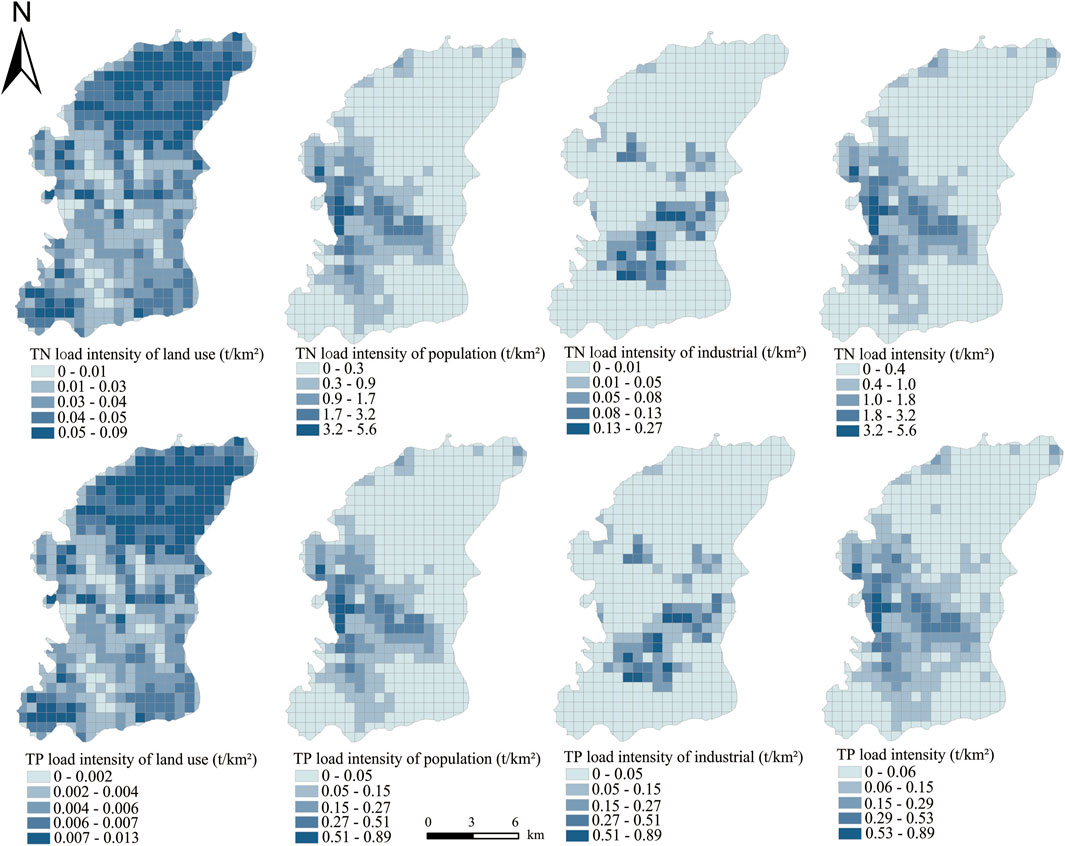
FIGURE 6. Spatial distribution of TN and TP load intensities of different pollution sources in Mwanza city grid cells (including land use load intensity, population load intensity, and industrial load intensity. Results are divided into five levels: highest-load intensity zone, higher-load intensity zone, medium-load intensity zone, lower-load intensity zone, and lowest-load intensity zone).
4.3.2 Analysis of sub-watershed characteristics
We observed that the pollutants released from informal settlements were primarily mixed with rivers and then discharged into the lake and reservoir in Mwanza city. We summarized TN and TP load grid units, mapped them into the sub-watershed, and calculated the average load intensity of each unit, as shown in Figure 7. The results suggest that the loads of sub-watersheds 13, 15, 16, 17, 18, 10, and 12 were found to be much larger than the loads of other units. The maximum loads of TN and TP were in the Mirongo River basin of the 13th unit, with a total load of 63.63 t and 10.25 t, respectively, accounting for about 26.4% and 25.6% of total loads. Mirongo is an important river that runs through the Mwanza city center and is vital for the safety of both people and the city’s environment. The river also plays a significant role not only in maintaining the city’s amenities but also in recycling pollution. However, due to the direct emission of pollution from industrial and human activities, discharges of industrial and domestic wastes into the Mwanza Gulf are significantly high (Kishe and Machiwa, 2003). Our study suggests that sub-watersheds with higher nutrient loads belong to the units where the pollution has surpassed the river’s capacity to recycle. Those units urgently need improved river management strategies with strong pollution control measures.
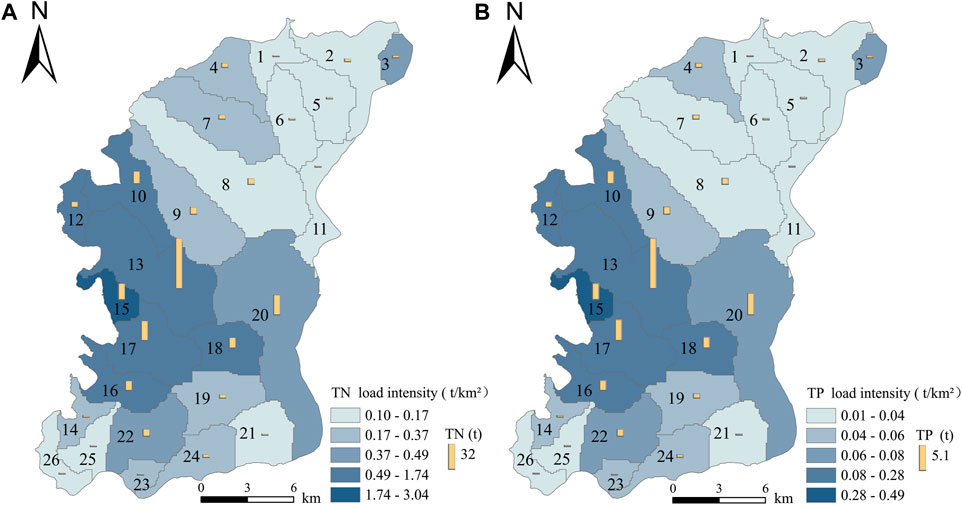
FIGURE 7. Pollutant load intensity in different sub-watersheds of Mwanza city. The bars show the pollutant loads, and the color in the map shows the load intensity. The numbers represent different sub-watersheds. (A) TN and (B) TP.
Among the load intensities of sub-watersheds assessed, the load intensity of the Mwanza city, where the TN ranged from 0.1 to 3.04 t·km−2, while the TP ranged from 0.01 to 0.49 t·km−2 (Figure 7). The highest average intensity was in sub-watershed 15, where Mwanza port and business center are located. As the second biggest city after Dar es Salaam during the colonial period, the port and the Mwanza Gulf had become the commercial hub for trade and industrial activities, mainly around Lake Victoria. When Mwanza was upgraded to a city, it was designated as one of the country’s six major industrial centers; as a result, the port had become the largest in Lake Victoria in Tanzania and played an important role in international commercial fishing and trade (Lawrence, 2009). In the city’s CBD, modern buildings are often intermingled with dilapidated shanty towns, where residents of nearby informal settlements are engaged in unmanaged but intensive business activities, further intensifying the pollution (Owens, 2014). More developed areas, mainly around the CBD, with an increased number of commercial and processing industries provide better employment opportunities. We found that, mostly, new migrants from rural areas tend to build poorly designed houses on barren slopes and hills on the city’s outskirts, quickly leading to an informal settlement. Such housing settlements (units) would become the high-intensity non-point source pollution for TN and TP in Mwanza city. Those units should be prioritized as the key areas for a better environmental management program. A study in another city has also shown a similar result of high-intensity non-point source pollution in informal settlements, mostly in semi-urbanized areas without a full sewerage and water treatment infrastructure facility (Mapunda et al., 2018). In our study, sub-watersheds: 10, 12, 13, 16, 17, and 18, and the outskirts of sub-watershed 15 were measured as the highest-intensity non-point source pollution areas for TN and TP (Figure 7). Sub-watersheds: 1, 2, 5, 6, and 11 and other units located to the northeast of the city were agricultural areas, and those areas were measured as the lowest TN (0.1–0.17 t·km−2) and TP (0.01–0.04 t·km−2) load intensity areas (Figure 7).
4.3.3 Analysis of sub-district administrative characteristics
We aggregated the grid’s TN and TP loads into 21 sub-district administrative units and then obtained the total loads and load intensity of different ward numbers and presented this in Figure 8. The TN load intensity of each ward number ranged from 0.18 to 4.85 t·km−2, and the TP load intensity ranged from 0.02 to 0.79 t·km−2. A total of five wards with the maximum total load of TN and TP were Mahina, Igoma, Nyakato, Butimba, and Bugogwa in order. These ward numbers should be prioritized for the development of key management strategies and pollution control measures. The maximum load intensity areas were identified in Igogo, Pamba, Mkuyuni, Mirongo, Isamilo, and other wards in order and were mainly located in the east of the Nyamagana peninsula and the lakeside area on the north and south. These areas should be prioritized for the key construction sites for environmental infrastructure. The load intensity of each ward appears like an encircling sphere, decreasing from the CBD to the city’s outskirts. According to the Lake Victoria Environmental Management Project (LVEMP), it can be observed that many rivers flowing into Lake Victoria and the near-shore areas, especially the Mwanza Gulf, are heavily polluted due to 1) untreated or partially treated industrial and municipal wastewater and 2) unsanitary conditions of coastal settlements, especially those of informal settlements, which are thought to influence urban surface runoff significantly (Abuodha et al., 2005). Pollutants originating from feces and urine will change the chemical condition of the lake and disrupt its nutrient balance (Das et al., 2022). Hence, to the control urban pollution problem, Mwanza city should increase the capacity of industrial sewage, improve land use efficiency to avoid continued spreads of informal settlements, improve living conditions in informal settlements, and increase investments in the infrastructure to improve public water supply, drainage, and sewage treatment in informal settlements.
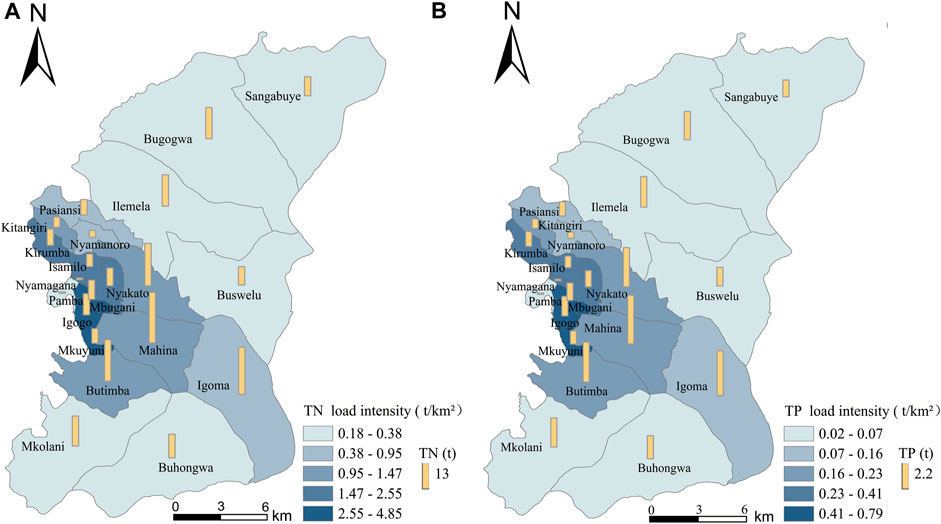
FIGURE 8. Pollutant load intensity of each ward in Mwanza city. The bars are the pollutant loads in the city including the surface runoff, domestic life, and industrial load. The load intensity means the total load on per unit area. A total of five colors are used to express the load intensity. (A) TN and (B) TP.
4.4 Limitations of methods and data
In our study, we used the pollution load model to estimate the TN and TP loads in the Mwanza city area, which mainly included the following three methods: the export coefficient model of the land use, the pollution load model of the domestic household, and the pollution load model of the industry. However, estimating the industrial pollution load accurately was not possible due to the difficulty in identifying the different types of industries in the city. In addition, the study area was largely covered by an urban area, where livestock data were lacking. Hence, to simplify the model, we ignored the pollution load caused by domestic animals. We used the locally available empirical dataset to estimate the TN and TP pollution loads in Mwanza city. The coefficients of the model had a large span of years (less resolution). This is because there were only a few studies carried out on pollution load coefficients in the study area. As a result, we had to rely on selecting the relevant empirical coefficients that were close to the study area to improve the accuracy of the model.
5 Conclusion
We conclude that the urban non-point source pollution load and its distribution in many African cities were largely influenced by informal settlements. This also applies to Mwanza city, where we used the multi-source data for modeling the export coefficient of land use and intensity coefficient of domestic pollution sources to estimate nitrogen and phosphorus pollution loads in the city. The spatial distribution of nitrogen and phosphorus pollution loads at the scale of a 1 square kilometer grid, catchment units, and administrative sub-regions revealed distinct spatial differences in the study area. We observed Mwanza as a semi-urbanized city in Africa. Although the constructed land expanded disorderly, the infrastructure of those constructions lagged far behind the level of urbanization. Due to the population explosion over the recent decades and a lack of reasonable planning, modern and centrally located small urban areas got intertwined with informal settlements, which spread from the center to the outskirts of the urban fringe. Hence, non-point source pollution in Mwanza city is widespread today and becoming increasingly complex to manage. However, more importantly, this study is a theoretical exploration of non-point source pollution, mainly accounting for cities of low-income countries in Africa, to provide a certain level of data support for developing nitrogen and phosphorus pollution control measures locally. Our goal was not only to obtain accurate estimates but also to improve the export coefficient model so that it would help African cities manage pollution appropriately. Upon distinguishing urban built-up areas and informal settlements based on different pollution output processes under different land use types, the use of removal rates of TN and TP and the disposal overflow rate of informal settlements in the pollution estimation model has become potentially applicable to Mwanza city and also a useful reference for elsewhere in less-developed cities in Africa.
Data availability statement
The original contributions presented in the study are included in the article/Supplementary Material; further inquiries can be directed to the corresponding author.
Author contributions
ZY wrote the original draft and performed data analysis; SSC built the concept and methodology and wrote and edited the manuscript; and GZ and GR-K performed review and editing. All authors read and agreed to a published version of the manuscript. All authors contributed to the article and approved the submitted version.
Funding
This research was funded by the National Key R&D Program of China “Lake-watershed integrated management for sustainable use of water in East Africa great lakes basins,” Grant No. 2018YFE0105900; National Natural Science Foundation of China (Grant Nos. 42161144003, 41771140, and 42101309); Jiangsu Education Development Project (#1521582201004); and Nanjing University of Information Science and Technology Talent Launch Fund.
Acknowledgments
The authors appreciate the Tanzania Fisheries Research Institute for coordinating the research. GK would like to acknowledge Longshan Professorship at Nanjing University of Information Science and Technology. Special thanks go to Li Tianrun for helping with the illustration design and Shen Chunying for cleaning the map.
Conflict of interest
The authors declare that the research was conducted in the absence of any commercial or financial relationships that could be construed as a potential conflict of interest.
Publisher’s note
All claims expressed in this article are solely those of the authors and do not necessarily represent those of their affiliated organizations, or those of the publisher, the editors, and the reviewers. Any product that may be evaluated in this article, or claim that may be made by its manufacturer, is not guaranteed or endorsed by the publisher.
Supplementary material
The Supplementary Material for this article can be found online at: https://www.frontiersin.org/articles/10.3389/fenvs.2023.1084031/full#supplementary-material
References
Abira, M. A., Oleko, C., Okungu, J. O., Abuodha, J. O. Z., and Hecky, R. E. (2005). Ndustrial and municipal effluent loadings into the Lake Victoria catchment. Kenya: Kisumu: Lake Victoria Environment Management Project, 116. Kenya national water quality synthesis report 2005.
Abuodha, J. O. Z., Muyodi, F. J., Hecky, R. E., and Mwanuzi, F. l. (2005). Lake Victoria environment management project (LVEMP) water quality and ecosystem status: Lake Victoria regional water quality synthesis report; Technical Report. Nairobi, Kenya: United Nations Environment Programme, 1–189.
Acolin, A., and Kim, A. M. (2022). Algorithmic justice and groundtruthing the remote mapping of informal settlements: The example of Ho Chi Minh City’s periphery. Environ. Plan. B Urban Anal. City Sci. 49 (1), 151–168. doi:10.1177/2399808321998708
Aliu, I. R., Akoteyon, I. S., and Soladoye, O. (2021). Living on the margins: Socio-spatial characterization of residential and water deprivations in Lagos informal settlements, Nigeria. Habitat Int. 107, 102293. doi:10.1016/j.habitatint.2020.102293
Andreasen, M. H., Mcgranahan, G., Kyessi, A., and Kombe, W. (2020). Informal land investments and wealth accumulation in the context of regularization: Case studies from dar es Salaam and Mwanza. Environ. Urbanization 32 (1), 89–108. doi:10.1177/0956247819896265
Awiti, A. (2006). Improved land management in the Lake Victoria Basin: Final report on the TransVic project. Nairobi: World Agroforestry Centre.
Brandes, K., Schoebitz, L., Kimwaga, R., and Strande, L. (2015). SFD promotion initiative dar es Salaam Tanzania. Eawag, Sandec: University of Dar es Salaam.
Brezonik, P. L., and Stadelmann, T. H. (2002). Analysis and predictive models of stormwater runoff volumes, loads, and pollutant concentrations from watersheds in the Twin Cities metropolitan area, Minnesota, USA. Water Res. 36 (7), 1743–1757. doi:10.1016/S0043-1354(01)00375-X
Calamari, D., Akech, M. O., and Ochumba, P. B. O. (1995). Pollution of winam gulf, Lake Victoria, Kenya: A case study for preliminary risk assessment. Res. Manag. 1 (2), 89–106. doi:10.1111/j.1440-1770.1995.tb00010.x
Cánovas-García, F., and Alonso-Sarría, F. (2015). A local approach to optimize the scale parameter in multiresolution segmentation for multispectral imagery. Geocarto Int. 30 (8), 937–961. doi:10.1080/10106049.2015.1004131
Chen, S. S., Kimirei, I. A., Yu, C., Shen, Q., and Gao, Q. (2022). Assessment of urban river water pollution with urbanization in East Africa. Environ. Sci. Pollut. Res. 29 (27), 40812–40825. doi:10.1007/s11356-021-18082-1
Cheruiyot, C. K., and Muhandiki, V. S. (2014). Estimation of nutrient export coefficients in Lake Victoria basin. J. Water Environ. Technol. 12 (3), 231–244. doi:10.2965/jwet.2014.231
Cheruiyot, C. K., and Muhandiki, V. S. (2015). Modeling of runoff pollution load in a data scarce situation using swat, Sondu watershed, Lake Victoria Basin. Ethiop. J. Environ. Stud. Manag. 8 (5), 494–506. doi:10.4314/ejesm.v8i5.3
COWI Consulting Engineers (2002). Integrated water quality/limnology study for Lake Victoria. Lake Victoria Environmental Management Project, Part II. Technical Report.
Das, R., Chanakya, H. N., and Rao, L. (2022). Study towards understanding foaming and foam stability in urban lakes. J. Environ. Manag. 322, 116111. doi:10.1016/j.jenvman.2022.116111
Ding, X., Gong, Y., An, C., and Lin, M. (2013). Spatial distribution of non-point source nitrogen in urban area of Beijing City, China. Environ. Syst. Res. 2, 12–17. doi:10.1186/2193-2697-2-12
Ding, X., Shen, Z., Hong, Q., Yang, Z., Wu, X., and Liu, R. (2010). Development and test of the export coefficient model in the upper reach of the Yangtze River. J. Hydrology 383 (3-4), 233–244. doi:10.1016/j.jhydrol.2009.12.039
Ding, Y, W., Xu, H. W., and Wang, C. H. (2020). Research on urban functional area recognition integrating OSM road network and POI data. Geogr. Geo-Information Sci. 36 (04), 57–63. doi:10.3969/j.issn.1672-0504.2020.04.009
Drǎgut, L., Tiede, D., and Levick, S. R. (2010). Esp: A tool to estimate scale parameter for multiresolution image segmentation of remotely sensed data. Int. J. Geogr. Inf. Sci. 24 (6), 859–871. doi:10.1080/13658810903174803
Elgammal, A., Duraiswami, R., Harwood, D., and Davis, L. S. (2002). Background and foreground modeling using nonparametric kernel density estimation for visual surveillance. Proc. IEEE 90 (7), 1151–1163. doi:10.1109/JPROC.2002.801448
Flynn, K. C. (2001). Urban agriculture in Mwanza, Tanzania. J. Int. Afr. Inst. 71 (4), 666–691. doi:10.3366/afr.2001.71.4.666
Gao, T. T., Xie, H., Wang, N. S., Xiong, Z. Y., Hu, Z. H., and Lai, X. J. (2022). Simulation and source analysis of nonpoint source nitrogen and phosphorus pollution export in a typical agricultural catchment draining to Chaohu Lake. J. Agro-Environment Sci. 4 (11), 2428–2438. doi:10.11654/jaes.2022-0231
Gong, M. L., Zuo, J. J., Ren, X. X., Zhao, H. T., Luo, X., Liao, Y. J., et al. (2018). Evaluation of effect of urban non-point source pollution control on porous asphalt-bio-retention combined roads. Environ. Sci. 39 (09), 4096–4104. doi:10.13227/j.hjkx.201712213
Gossweiler, B., Wesström, I., Messing, I., Villazón, M., and Joel, A. (2021). Impact of land use change on non-point source pollution in a semi-arid catchment under rapid urbanisation in Bolivia. Water 13 (4), 410. doi:10.3390/w13040410
Guo, Z., Chen, S. S., Kattel, G. R., Mkumbo, A. C., Xiong, C., Gao, Q., et al. (2023). Scenario analysis of phosphorus flow in food production and consumption system in the Mwanza region, Tanzania. Sci. Total Environ. 879, 162991. doi:10.1016/j.scitotenv.2023.162991
Haith, D. A., and Tubbs, L. J. (1981). Watershed loading functions for nonpoint sources. J. Environ. Eng. Div. 107 (1), 121–137. doi:10.1061/JEEGAV.0001130
Hambati, H., and Yengoh, G. T. (2018). Community resilience to natural disasters in the informal settlements in Mwanza City, Tanzania. J. Environ. Plan. Manag. 61 (10), 1758–1788. doi:10.1080/09640568.2017.1372274
Hao, F. L., Wang, S. J., Feng, Z. X., Yu, T., and Ma, L. (2018). Spatial pattern and its industrial distribution of commercial space in Changchun based on POI data. Geogr. Res. 37 (02), 366–378. doi:10.11821/dlyj201802010
Ierodiaconou, D., Laurenson, L., Leblanc, M., Stagnitti, F., Duff, G., Salzman, S., et al. (2005). The consequences of land use change on nutrient exports: A regional scale assessment in southsouth-west Victoria, Australia. J. Environ. Manag. 74 (4), 305–316. doi:10.1016/j.jenvman.2004.09.010
Iloms, E., Ololade, O. O., Ogola, H. J. O., and Selvarajan, R. (2020). Investigating industrial effluent impact on municipal wastewater treatment plant in Vaal, South Africa. Int. J. Environ. Res. public health 17 (3), 1096. doi:10.3390/ijerph17031096
Jones, P. (2017). Formalizing the informal: Understanding the position of informal settlements and slums in sustainable urbanization policies and strategies in Bandung, Indonesia. Sustainability 9 (8), 1436. doi:10.3390/su9081436
Jonsson, H., Stintzing, A. R., Vinnerås, B., and Salomon, E. (2004). Guidelines on the use of urine and faeces in crop production. Sweden: EcoSanRes Programme.
Kalvin, C. V. F., Frederico, T., Rakshada, R., Ketan, K., Gabriella, R., and Anandan, K. (2016). Final master plan report. Singapore: SURBANA JURONG CONSULTANTA PRIVATE LIMITED.
Kattel, G., Reeves, J., Wester, W., Zhang, W., Jing, W., McGowan, S., et al. (2020). Healthy waterways and ecologically sustainable cities in Beijing-Tianjin-Hebei urban agglomeration (northern China): Challenges and future directions. WIREs Water 8. doi:10.1002/wat2.1500
Katukiza, A. Y., Ronteltap, M., Niwagaba, C. B., Foppen, J. W. A., Kansiime, F., and Lens, P. N. L. (2012). Sustainable sanitation technology options for urban slums. Biotechnol. Adv. 30 (5), 964–978. doi:10.1016/j.biotechadv.2012.02.007
Kimwaga, R. J., Mashauri, D. A., Bukirwa, F., Banadda, N., Wali, U. G., and Nhapi, I. (2012). Development of best management practices for controlling the non-point sources of pollution around Lake Victoria using SWAT model: A case of Simiyu catchment Tanzania. Open Environ. Eng. J. 5, 77–83. doi:10.2174/1874829501205010077
Kishe, M. A., and Machiwa, J. F. (2003). Distribution of heavy metals in sediments of Mwanza gulf of Lake Victoria, Tanzania. Environ. Int. 28 (7), 619–625. doi:10.1016/S0160-4120(02)00099-5
Kulabako, R. N., Nalubega, M., Wozei, E., and Thunvik, R. (2010). Environmental health practices, constraints and possible interventions in peri-urban settlements in developing countries–a review of Kampala, Uganda. Int. J. Environ. health Res. 20 (4), 231–257. doi:10.1080/09603120903545745
Lawrence, D. (2009). Tanzania: The land, its people and contemporary life. Dar es Salaam: New Afraican Press.
Li, N., Han, W, Z., Shen, M. N., and Yu, S. L. (2016). Load evaluation of non-point source pollutants from reservoir based on export coefficient modeling. Trans. Chin. Soc. Agric. Eng. 32 (8), 224–230. doi:10.11975/j.issn.1002-6819.2016.08.032
Li, Z. F., Yang, G. S., and Li, H. P. (2009). Estimated nutrient export loads based on improved export coefficient model in xitiaoxi watershed. Environ. Sci. 30 (03), 668–672. doi:10.13227/j.hjkx.2009.03.043
Liu, Y., Li, L. J., and Li, J. Y. (2021). Estimation of non-point source pollution load for regional management: A case study of shengzhou, zhejiang province. Acta Sci. Circumstantiae 41 (10), 3938–3946. doi:10.13671/j.hjkxxb.2021.0288
Liu, Z, L. (2020). Research on remote sensing monitoring of abandoned farmland based on sentinel-2——a case study of qi county, jinzhong. master’s thesis. BeiJing: Beijing Forestry University.
Ma, X., Li, Y., Zhang, M., Zheng, F., and Du, S. (2011). Assessment and analysis of non-point source nitrogen and phosphorus loads in the three gorges reservoir area of hubei province, China. Sci. Total Environ. 412, 154–161. doi:10.1016/j.scitotenv.2011.09.034
Madenge (2021). Things you need to know about the Mwanza city. Available at: https://unitedrepublicoftanzania.com/geography-of-tanzania/regions-of-tanzania/things-you-need-to-know-about-the-mwanza-city-tra-district-rock-city-region-city-council-km-zip-postal-code/.
Mao, F., Su, K. Z., Kang, J. T., Feng, Y., Jiang, H., and Zhen, H. (2012). Research on heavy metal load accounting in mining areas using improved export coefficient method. Res. Environ. Sci. 25 (2), 207–211. doi:10.13198/j.res.2012.02.85.maof.010
Mapunda, D. W., Chen, S. S., and Yu, C. (2018). The role of informal small scale water supply system in resolving drinking water shortages in peri-urban Dar es Salaam, Tanzania. Appl. Geogr. 92, 112–122. doi:10.1016/j.apgeog.2018.02.001
Mayo, A. W. (2013). Nitrogen mass balance in waste stabilization ponds at the University of Dar es Salaam, Tanzania. Afr. J. Environ. Sci. Technol. 7 (8), 836–845. doi:10.5897/AJEST2013.1495
Mbwele, L. A. (2006). Microbial phosphorus removal in waste stabilization pond wastewater treatment systems. [dissertation]. Stockholm, Sweden: School of Biotechnology, Royal Institute of Technology.
Mohan Vamsee, A., Kamala, P., Martha, T. R., Vinod Kumar, K., Jai Sankar, G., and Amminedu, E. (2018). A tool assessing optimal multi-scale image segmentation. J. Indian Soc. Remote Sens. 46, 31–41. doi:10.1007/s12524-017-0685-7
Murthy, S. L. (2012). Land security and the challenges of realizing the human right to water and sanitation in the slums of Mumbai, India. Health and Hum. Rts. 14, 61–73.
Mwanuzi, F. L., Abuodha, J. O. Z., Muyodi, F. J., and Hecky, R. E. (2005). Lake Victoria environment management project (LVEMP) water quality and ecosystem status. Lake Victoria Reg: Water Qual. Synth. Rep, 1–189.
NBS (2015). Thematic report on housing condition, household amenities and assets monograph 2012 Population and Housing Census. Dar es Salaam: National Bureau of Statistics, Ministry of Finance.
Owens, K. E. (2014). Negotiating the city: Urban development in Tanzania. [dissertation]. Ann Arbor: University of Michigan.
Qian, Y., Sun, L., Chen, D., Liao, J., Tang, L., and Sun, Q. (2021). The response of the migration of non-point source pollution to land use change in a typical small watershed in a semi-urbanized area. Sci. Total Environ. 785, 147387. doi:10.1016/j.scitotenv.2021.147387
Rao, P., Wang, S., Wang, A., Yang, D., and Tang, L. (2022). Spatiotemporal characteristics of nonpoint source nutrient loads and their impact on river water quality in Yancheng city, China, simulated by an improved export coefficient model coupled with grid-based runoff calculations. Ecol. Indic. 142, 109188. doi:10.1016/j.ecolind.2022.109188
Rhee, H. P., Yoon, C. G., Lee, S. J., Choi, J. H., and Son, Y. K. (2012). Analysis of nonpoint source pollution runoff from urban land uses in South Korea. Environ. Eng. Res. 17 (1), 47–56. doi:10.4491/eer.2012.17.1.047
Scheren, P., Kroeze, C., Janssen, F., Hordijk, L., and Ptasinski, K. J. (2004). Integrated water pollution assessment of the ebrié lagoon, ivory coast, west Africa. J. Mar. Syst. 44 (1-2), 1–17. doi:10.1016/j.jmarsys.2003.08.002
Scheren, P., Zanting, H. A., and Lemmens, A. M. C. (2000). Estimation of water pollution sources in Lake Victoria, east Africa: Application and elaboration of the rapid assessment methodology. J. Environ. Manag. 58 (4), 235–248. doi:10.1006/jema.2000.0322
Schuol, J., Abbaspour, K. C., Srinivasan, R., and Yang, H. (2008). Estimation of freshwater availability in the West African sub-continent using the SWAT hydrologic model. J. hydrology 352 (1-2), 30–49. doi:10.1016/j.jhydrol.2007.12.025
Shen, Z., Hou, X., Li, W., and Aini, G. (2014). Relating landscape characteristics to non-point source pollution in a typical urbanized watershed in the municipality of Beijing. Landsc. Urban Plan. 123, 96–107. doi:10.1016/j.landurbplan.2013.12.007
TBS (2005). National environmental standards compendium. Dar es Salaam: Tanzania Bureau of Standards, 74. TZS 789; Drinking (potable) water-Specification.
Tong, X., Zhou, Y., Liu, J., Qiu, P., and Shao, Y. (2022). Non-point source pollution loads estimation in Three Gorges Reservoir Area based on improved observation experiment and export coefficient model. Water Sci. Technol. 85 (1), 27–38. doi:10.2166/wst.2021.508
Tu, Y., Chen, B., Zhang, T., and Xu, B. (2020). Regional mapping of essential urban land use categories in China: A segmentation-based approach. Remote Sens. 12 (7), 1058. doi:10.3390/rs12071058
Van Griensven, A., Popescu, I., Abdelhamid, M. R., Ndomba, P. M., Beevers, L., and Betrie, G. D. (2013). Comparison of sediment transport computations using hydrodynamic versus hydrologic models in the Simiyu River in Tanzania. Phys. Chem. Earth Parts A/B/C. 61, 12–21. doi:10.1016/j.pce.2013.02.003
Van Horen, D. J. M. (1996). The eutrophication of Lake Victoria, east-africa. dissertation. Eindhoven: Eindhoven University of Technology.
Varekar, V., Yadav, V., and Karmakar, S. (2021). Rationalization of water quality monitoring locations under spatiotemporal heterogeneity of diffuse pollution using seasonal export coefficient. J. Environ. Manag. 277, 111342. doi:10.1016/j.jenvman.2020.111342
Vuai, S. A. H., Ibembe, J. D., and Mungai, N. W. (2013). Influence of land use activities on spatial and temporal variation of nutrient deposition in Mwanza Region: Implication to the atmospheric loading to the Lake Victoria. Atmos. Clim. Sci. 3 (02), 224–234. doi:10.4236/acs.2013.32024
Wang, Z., Ma, D., Sun, D., and Zhang, J. (2021). Identification and analysis of urban functional area in Hangzhou based on OSM and POI data. PLoS one 16 (5), e0251988. doi:10.1371/journal.pone.0251988
Wineman, A., Alia, D. Y., and Anderson, C. L. (2020). Definitions of “rural” and “urban” and understandings of economic transformation: Evidence from Tanzania. J. rural Stud. 79, 254–268. doi:10.1016/j.jrurstud.2020.08.014
Wu, L., Gao, J. E., Ma, X. Y., and Li, D. (2015). Application of modified export coefficient method on the load estimation of non-point source nitrogen and phosphorus pollution of soil and water loss in semiarid regions. Environ. Sci. Pollut. Res. 22 (14), 10647–10660. doi:10.1007/s11356-015-4242-z
Wu, L. L., Li, X. Y., Mao, D., and Wang, Z. (2022). Urban land use classification based on remote sensing and multi—Source geographic data. Remote Sens. Nat. Resour. 34 (1), 127–134. doi:10.6046/zrzyyg.2021061
Wu, S. S., Qiu, X., Usery, E. L., and Wang, L. (2009). Using geometrical, textural, and contextual information of land parcels for classification of detailed urban land use. Ann. Assoc. Am. Geogr. 99 (1), 76–98. doi:10.1080/00045600802459028
Xiong, C., Guo, Z., Chen, S. S., Gao, Q., Kishe, M. A., and Shen, Q. (2020). Understanding the pathway of phosphorus metabolism in urban household consumption system: A case study of dar es Salaam, Tanzania. J. Clean. Prod. 274, 122874. doi:10.1016/j.jclepro.2020.122874
Xiong, C., Xu, L., Mhagama, F. L., Chen, S. S., Zhu, K. X., Gao, Q., et al. (2022). Reactive nitrogen budgets in human-nature coupling system in lakeside area with insufficient data-A case study of Mwanza, Tanzania. Sci. Total Environ. 855, 158915. doi:10.1016/j.scitotenv.2022.158915
Yang, J., Liang, J., Yang, G., Feng, Y., Ren, G., Ren, C., et al. (2020). Characteristics of non-point source pollution under different land use types. Sustainability 12 (5), 2012. doi:10.3390/su12052012
Young, W. J., Marston, F. M., and Davis, R. J. (1996). Nutrient exports and land use in Australian catchments. J. Environ. Manag. 47 (2), 165–183. doi:10.1006/jema.1996.0043
Zhai, Y., Shang, X., Shen, J., and Wang, X. (2012). Application of SWAT model in agricultural non-point source pollution investigation in Lake Erhai watershed. Res. Environ. Sci. 25 (6), 666–671. doi:10.13198/j.res.2012.06.61.zhaiy.017
Zhang, H. B., Li, J., Li, X. D., Liu, X., Chen, X., and Liu, J. (2013). Study on rural non-point source pollution assessment method of regions with sparse data. J. Sichuan Univ. Eng. Sci. Ed. 45 (06), 58–66. doi:10.15961/j.jsuese.2013.06.008
Zhang, J., Chen, S., Gao, Q., Shen, Q., Kimirei, I. A., and Mapunda, D. W. (2020). Morphological characteristics of informal settlements and strategic suggestions for urban sustainable development in Tanzania: Dar es Salaam, Mwanza, and Kigoma. Sustainability 12 (9), 3807. doi:10.3390/su12093807
Zhang, J. Q., Chen, S., Gao, Q., and Kimirei, I. A. (2019). Urban sprawl under the rapid growth of informal settlements—a case study of Mwanza city, Tanzania. World Reg. Stud. 28 (03), 32–42. doi:10.3969/j.issn.1004-9479.2019.03.2017351
Keywords: informal settlements, non-point source pollution, load estimation, spatial distribution, African city
Citation: Zong Y, Chen SS, Kattel GR and Guo Z (2023) Spatial distribution of non-point source pollution from total nitrogen and total phosphorous in the African city of Mwanza (Tanzania). Front. Environ. Sci. 11:1084031. doi: 10.3389/fenvs.2023.1084031
Received: 29 October 2022; Accepted: 25 April 2023;
Published: 11 May 2023.
Edited by:
Holly Michael, University of Delaware, United StatesReviewed by:
Peng Zhang, Guangdong Ocean University, ChinaRenata Augustyniak-Tunowska, University of Warmia and Mazury in Olsztyn, Poland
Copyright © 2023 Zong, Chen, Kattel and Guo. This is an open-access article distributed under the terms of the Creative Commons Attribution License (CC BY). The use, distribution or reproduction in other forums is permitted, provided the original author(s) and the copyright owner(s) are credited and that the original publication in this journal is cited, in accordance with accepted academic practice. No use, distribution or reproduction is permitted which does not comply with these terms.
*Correspondence: Sophia Shuang Chen, c2NoZW5zQG51aXN0LmVkdS5jbg==
†ORCID: Giri Raj Kattel, orcid.org/0000-0002-8348-6477