 Haiying Zhang1
 Wangxun Zhou2*
- 1College of Chemical Engineering, China university of Petroleum (East China), Qingdao, China
- 2College of Chemical Engineering, Northeast Electric Power University, Jilin, China
One of the most widely recognized tactics for ensuring long-term development at the national level, green economic growth approaches require the development of a nation to be implemented. The present study examines the effects of infrastructure development, oil consumption, and institution on carbon emission in the presence of economic complexity index, urbanization, infrastructure development, oil consumption, and institution quality in 30 provinces of China region from 2000 to 2020. This study employed second-generation panel cointegration methodologies. Similarly, the results of the CUP-FM and CUP-BC tests confirm the relationship between carbon emission and other variables used in this study. The estimation shows that the economic complexity index, urbanization, and oil consumption increase carbon emissions, whereas infrastructure development and institution have a significantly negative impact on carbon emissions. The robustness check findings obtained CUP-BC test validates the results. The study shows the moderate effect of institutions on the economic complexity index, urbanization, and infrastructure development has a negative impact on carbon emissions. In light of outcomes, the current study suggests decent policy implications to attain a green economic recovery.
1 Introduction
Deterioration of the natural environment ranks among the most pressing problems of our day. As a result of the potential impact on billions of people, the problem of environmental degradation has received a great deal of attention from scientists and academics (Rafique et al., 2021). Greenhouse gas emissions are largely believed to be a contributing factor to global warming A rise of 1.4°F in global average temperature since 1880 is directly attributable to human-caused emissions of heat-trapping greenhouse gases, which pose major risks to all forms of life on our planet. About 75% of all manmade greenhouse gas emissions are caused by carbon dioxide (CO2). Floods, droughts, heat waves, and heavy rainfall are all examples of extreme weather occurrences that have become more common in the previous decade, all of which may be directly attributed to human-caused increases in atmospheric carbon dioxide (Calvert Jump et al., 2019).
All of the built environment components in this research are considered infrastructures because of their central role in the relationship between human progress and climate change (Shahzad et al., 2021). Improving access to necessities including water, power, food, shelter, transportation, and communication is crucial to reducing poverty and fostering economic growth. The entire socio-metabolic system is impacted by infrastructures’ contributions to anthropogenic greenhouse gas emissions (He et al., 2021). These emissions occur in three stages: 1) during construction (emissions in materials production, manufacture, and construction, including energy industries); 2) during usage (e.g., transportation or buildings); and 3) to a lesser extent, during the end of life (waste management). Because of their permanence, infrastructures have a significant impact on the long-term trend of a society’s carbon footprint. While use-phase emissions are created in real-time, production-phase emissions are often created decades before service is provided (Liu et al., 2022b; Huang et al., 2022).
With this in mind, the construction of infrastructure sets the stage for the long-term growth and emission reductions of all key economic sectors. The guard rail set in U.N. climate debates to prevent devastating anthropogenic interferences with the climate system—a 2°C increase in world average temperature over preindustrial levels—is made much more challenging by the prolonged lifetime of the infrastructure. Reduced emissions present an exceptional obstacle to building infrastructure in both developed and developing nations. There has been a lot of research into different ways to cut down on the direct energy consumption and emissions of many types of infrastructure, such as buildings, vehicles, and factories. Infrastructure stocks are considered in the models of Marrocu et al. (2015) for aggregate infrastructure stocks as energy users and greenhouse gas emitters; however, the models do not consider the materials needed to construct the infrastructures, and thus are unable to account for essential socio-metabolic interconnections between infrastructures and the material generating sectors. Studies of items’ carbon footprints have included their accumulated end utilization across regions and internationally, as well as their embedded emissions and other indirect emissions (Fatai Adedoyin et al., 2021). Emissions inherent in consumption and trade flows have been the primary focus of these studies, but there has been a dearth of research examining emissions from existing stockpiles of materials and goods. This void is due in part to the absence of comprehensive data on the quantity and, more significantly, the kind of materials used to construct infrastructure (Doğan et al., 2021).
The rapid increase in Saudi Arabia’s domestic oil consumption has far-reaching implications on a global scale. That instance, if people in the United States consume more oil, Saudi Arabia will have less to sell on the worldwide market. The oil-based nature of the Saudi Arabian economy necessitates that the Kingdom take action on global environmental challenges like climate change at the national level. There is a clear correlation between sustained economic expansion and ecological degradation in Saudi Arabia, both of which are exacerbated by rising domestic oil use. To put it another way, high domestic oil consumption serves as both the foundation for economic activity and human wellbeing and the driving force for environmental degradation (You and Ren, 2021; Khezri et al., 2022). However, the oil industry’s extraction, refining, and transportation processes have significant effects on environmental quality (Ahmad et al., 2021; Xu et al., 2021; Akadiri et al., 2022; Liu et al., 2022c). The United States Energy Information Administration reports that Saudi Arabia consumes more petroleum than any other Middle Eastern country. According to the BP Statistical Review of World Energy, Saudi Arabia consumed nearly 60% of its energy needs from petroleum in 2013, ranking it as the world’s 12th highest user of total primary energy that year. According to Mealy and Teytelboym (2020), rising internal demand for Saudi Arabian oil could pose a danger to the country’s ability to export to international markets. According to Lafuente et al. (2012), the rising demand for energy (oil, gas, and electricity) contributes to Saudi Arabia’s economic development. Increases in carbon emissions are one way in which increased energy demand could harm the environment. Carbon dioxide emissions in Saudi Arabia are positively and statistically significantly correlated with income, according to research by Razumovskaia et al. (2020).
Moreover, increasing income and a shift in attitudes toward environmental protection highlight the importance of prioritizing regulatory institutions, both of which are essential to improve environmental quality (Bian and Yan, 2022;; Liu et al., 2022d; Oluc et al., 2022). On the other hand, inadequate political-institutional quality is linked to environmental problems in developing countries, undermining protections for the environment by creating biases in the adaptation and integration of current government rules. There is a wealth of literature discussing how institutional quality affects environmental protection. It has been proposed that better environmental quality can be achieved by bolstering government institutions to enforce environmental regulations (Wang et al., 2021a). However, ecosystem health could be hampered by institutional failure and/or insufficient governance, leading to long-term damage to the environment. Environmental policies in developing nations are typically less stringent, as noted by Adedoyin et al. (2021). The civil conflict in Somalia has hampered the country’s administration, which has in turn hampered the energy and environmental management sectors. There was a system in place (albeit it was not fully effective) that managed energy consumption before the civil war, but this system was interrupted throughout the war, which had negative effects on energy and environmental protection.
Non-etheless, the following is a new tidbit added to the available literature by the current study. From 2000 to 2020, this study looks at a subset of China’s provinces to see how economic growth has affected carbon dioxide emissions. Efforts to improve China’s infrastructure have been stepped up. Equally important to China’s economic growth may be the considerable innovations in road infrastructure development in the last few decades, which have outpaced those of any other method of transport. An increase in China’s CO2 emissions over the past few years has similarly harmed the country’s ecology. However, the nature of this effect on the environment is unclear; so, this study seeks to analyze the impact of China’s infrastructure development on the country’s environmental quality and to determine if this growth has led to a net increase or decrease in the country’s total emissions.
In this network, organizations play an integral part. Having laws and regulations in place that protect citizens and ensure they have access to high-caliber services while also adhering to established norms is an indication of strong institutions (Shahzad et al., 2022). The rule of law is an example of a quality institutional variable. The degree to which citizens are able to have their voices heard and officials are held to account is indicative of the efficiency of government as a whole, as well as of the professionalism of government employees, the reliability of government promises to implement policies, the level of public services provided, and the independence of government officials from political pressures. The fundamental goal is to learn how Chinese institutions affect environmental quality.
Another important finding of this research is an estimate of how much China’s total oil consumption contributes to the country’s carbon emissions. Policymakers can use the results of this analysis to pinpoint the industry’s most responsible for contributing to environmental degradation due to oil use and implement appropriate corrective actions. The impact of oil demand on environmental quality has not been examined in any of the research. Thus, the effects of oil consumption in China are the primary subject of this research.
Finally, the impact of quality institutions on carbon emissions via instructional quality on ECI, urbanization, and industrial development is thoroughly explored by utilizing just a single proxy and the quality institutions index. Our research also shows that protecting environmental quality in regards to ECI, urbanization, and industrial development is dependent on the quality of institutions. In addition, it can embrace and encourage the use of renewable energy sources for manufacturing through production policies. Strong institutions can also encourage greener forms of business. Also, these economic parameters are used to examine the moderating effect of quality institutions on carbon emissions, with the goal of determining whether or not quality institutions play a role in sustaining ECI. In a similar vein, the study’s objectives are satisfied by employing a novel collection of econometric approaches. In chapter three, we lay out the research design and methods; in chapter four, we talk about the results; and in chapter five, we draw the essential conclusion and talk about their consequences.
2 Literature review
There has been a lot of research looking at how vehicle transportation affects emissions. Emissions are strongly correlated with the use of automobiles (Gozgor, 2018). All of these investigations have confirmed that an increase in the number of vehicles on the road results from improvements in transportation infrastructure, which has a profoundly detrimental effect on environmental quality. Pollutants in the air can have negative effects on people’s health, yet many are not aware of the dangers they pose. The health and visibility impact of air pollution from a variety of sources were estimated by Adebayo (2022). The study’s overarching goal is to increase public awareness of air pollution by drawing attention to its negative effects on society as a whole. In order to investigate both outcomes, the authors turned to meta-hedonic pricing analysis. The study found that people underestimate the negative impacts of air pollution on their health due to a lack of knowledge about the issue. One of the health costs individuals in society face due to air pollution is the risk of untimely death. Many times, the health expenditures spent by the normal community are underestimated since these negative consequences of air pollution on health are not factored into the choice to purchase a home. Barbier (2020) conducted a further investigation on the topic, this one concentrating on the health impacts of air pollution caused by automobile emissions. Emissions of nitrogen, sulfur, carbon, and particulate matter were all weighed and measured in terms of their respective per-kilogram costs. In their research, the scientists found that nitrogen is the most expensive component since it serves as a precursor for the creation of O3 and NO2 emissions. Carbon dioxide does not immediately affect mortality rates or PM levels in the air; hence it is cheaper per kilogram. Also, compared to other emissions that only have a modest impact on health, the PM in the air is far more dangerous.
Shahbaz et al. (2017) in-depth research on the transport sector’s contribution to Pakistan’s economy was recently completed. According to the study’s conclusion, eco-friendly, economically viable transportation infrastructure is crucial to an economy’s competitiveness and prosperity. The study considered not just the resource cost that users openly pay, but also the congestion cost, the unintentional cost, and the environmental cost that are all related to transportation but are not directly paid by users. Thus, it is observed that better transportation infrastructure is thought to mitigate these hidden costs, leading to a higher quality of life and, ultimately, more human and material wealth. It is well-accepted that transportation is one of the most significant contributors to poor air quality in the environment. It is unlikely that the positive effects of road transportation on development and economic growth would have been realized without regulations relating to transportation system, fuel adulteration, and effective pollution control legislation. Because of this, effective environmental regulations and sustainable development initiatives concerning a nation’s transportation network can significantly influence that nation’s economic and political growth and development. Moreover, Valadkhani et al. (2019) found that the benefits of improved technology that are projected to lessen the concentration of hazardous emissions generated by road transportation are generally nullified by development in both the number of cars on the road and the distances they travel. Similarly, a case study of India by Iqbal et al. (2020) also tried to investigate the role of institutional quality in energy utilization and found the significant decline in energy utilization. Moreover, Sarwar et al. (2017) investigated the role of infrastructure development on ecosystem in Istanbul. However, results showed the inverse association of investment on eco-system. Likewise, Wang et al. (2020) tried to investigate role of transport on carbon emissions in United States economy. They used the quantile ARDL and showed the inverse connection of freight and passenger transport with carbon emissions. Furthermore, Yuan et al. (2008) investigated the impact of renewable energy and innovations on carbon emissions and cause of decrease in emissions.
Considering the environmental impact of Pakistan’s road infrastructure policy, Ahmad and Zhang (2020) concluded that expanding the country’s economy is the primary goal. It is also decided that road infrastructure expansion and traffic growth continue to place environmental concerns on the back burner. The study by He and Guo (2021) on China found the same thing: policymakers had to choose between width and length of road. Governments in poor countries tend to prioritize road length above road width since investing in automotive mobility is unaffordable. In addition, higher air pollution and a decline in social welfare are caused by the increased emissions that accompany longer stretches of road. Meanwhile, Adekoya et al. (2022) looked at the causes of road pollution in 39 areas of a United States metropolis and discovered that long stretches of road significantly increase the amount of nitrogen dioxide released into the atmosphere. Murshed and Tanha (2021) found that an increase in road length leads to an increase in vehicle number and its associated emissions in the United States.
Researchers focus on the interplay between energy use, the natural environment, and GDP expansion has increased dramatically during the past few decades. Energy is often thought to be an input in the production function. In this way, energy can play a crucial role in a country’s economic development. Positive effects include economic growth, but negative effects include climate change, GHG emissions and global warming (Smith et al., 2021). The United Nations Millennium Development Goals Report states that worldwide CO2 emissions increased by over 50% between 1990 and 2015. Since oxygen and a healthy ecosystem are important to human survival, reducing CO2 emissions has become a top priority for governments around the globe. Many academics, though (Iqbal et al., 2020; Jin et al., 2022; Lee and Lee, 2022) have held the view that environmental contamination is correlated with higher economic activity. Because of this, a country with a highly developed economy contributes more to environmental pollution. Non-etheless, several studies have found a negative correlation between progress in economics and increases in pollution of the natural environment. Simply said, a nation with higher economic growth and degree of development will have an easier and faster time increasing its use of clean energy sources. Therefore, understanding the connection between oil use, energy growth, and CO2 emissions in practice is cloudy and confusing. Accordingly, it follows that there is no similar or unique-patterned relationship in any country, despite the fact that many prior studies have attempted to prove it through the examination of the environmental Kuznets curve. Examples include the finding by Cheng et al. (2018) that the relationship takes the form of a reversed U in high- and upper-middle-income nations. According to their findings, advanced renewable energy technology and widespread adoption are already available in countries with high and upper-middle incomes. In contrast, this procedure cannot be verified in low and lower-middle-income nations due to the absence of requisite equipment and excessive expenses.
A synthesis can be built from these two schools of thought in energy economics, one focusing on trade and the other on institutional quality, to determine if the latter enhances trade for environmental gains or mitigates the potentially detrimental environmental implications of international commerce. The theoretical underpinnings for this synthesis are provided by Mastini et al. (2021). Their conceptualization of the connection between freer trade and more stringent environmental protections points to corruption’s significance as a proxy for institutional quality. Specifically, it implies less stringent environmental policy in corrupt governments. Licastro and Sergi (2021) find evidence for this hypothesis using data from both industrialized and developing countries.
3 Data and methodology
3.1 Data sources
This study observes the influence of the economic complexity index, urbanization, infrastructure development, oil consumption, and institutions on carbon emissions. Additionally, the sample for this analysis is taken from 2000 to 2020 from 30 provinces in the China region. This research uses CO2 as the dependent variable calculated in (kt) and is gathered from Environmental statistics. The economic complexity index is measured by index from the Atlas data bank, urbanization is measured by (% of the population), infrastructure development (% of Growth) from Bureau of China statistics (BCS), oil consumption is measured by % of total oil consumption, data are taken from the China Yearbook and institution is measured by Index (Table 1). Figure 1 shows the box plots of each variable.
TABLE 1. Data descriptions.
FIGURE 1. (A–F) Box plot of variables.
Given Figure 1 shows the box plot for each variable. However, the X-axis shows the variable name, while the y-axis shows the data range, e.g., LCO2 emissions has range from 3.0 to 6.0.
3.2 Descriptive statistics
Descriptive statistics of the relevant variable must be compiled before any further empirical inquiry may be directed by them. The table’s given values show that economic complexity index is the lowest and infrastructural development has the greatest mean. CO2, ECI, URB, ID, OC, and INS were the primary areas of interest. The close proximity of the means and medians of all the variables in Table 2 is indicative of a good standard of care.
TABLE 2. Descriptive statistics.
3.3 Pairwise correlation matrix
Whether the variables have a positive or negative relationship depends on the degree and direction of the link between them. As a rule, the correlation coefficient takes on a value between −1 and +1. Correlations with values near +1 are considered strong, while those with values close to −1 are considered weak. A smaller correlation value between the independent variable suggests that there is no problem of multicollinearity in the model estimation, as shown in Table 3.
TABLE 3. Correlation matrix.
3.4 Model construction
Thus, the empirical model to be estimated is as follows:
The given function refers to CO2, ECI, URB, ID, OC, and INS refers to carbon emission, economic complexity index, urbanization, infrastructure development, oil consumption, and institutions. Whereas i refers to a number of cross sections and t shows the time period.
After taking a log, the equation is as:
Equation 2 shows that L indicated log, β refers to intercept and ε shows the error term in this section. In Eq. 3, other variables remain constant in moderate terms of LINS * ECI has an impact on carbon emission:
In Eq. 4, other variables remain constant moderate term of INS * LURB has an impact on carbon emission:
In Eq. 5, other variables remain constant moderate term of INS * LID has an impact on carbon emission:
When i denote cross sections, t is a year, and ε it is an error term following a standard deviation with zero mean and finite variance.
3.5 Estimation strategy
3.5.1 Cross-sectional dependence
Cross-sectional dependency (CD) is a crucial part of panel data models, and it may be influenced by the economic, regional, and cultural relationships between the nations included in the sample. Considering the financial interdependence of the countries in the China region, it is reasonable to assume that these provisions will be dependent beyond provincial boundaries. Thus, it is essential to check for the possibility of CD, as failure to do so would lead to inaccurate and inconsistent estimates of stationarity and cointegration characteristics (Verma and Kandpal, 2021). Because of the need to handle data from a lower number of cross-sectional units and a shorter time frame, we use the CD test developed by Li et al. (2021) for our research. Slope heterogeneity considerations are also crucial to investigate, as slope coefficients would likely vary across cross-sections. The argument is made that elasticity estimates are overstated when slope heterogeneity issues are ignored. Despite their similarities, the selected Chinese provisions under consideration here have important distinctions that warrant attention. CO2 emissions per capita, energy consumption, globalization, national wealth, and other macroeconomic factors vary greatly amongst these countries. So, the slope homogeneity test proposed by Jinru et al. (2021) has been used here.
3.5.2 Panel unit root test
Considering the importance of determining if particular datasets are stationary or not, it is crucial to do such an evaluation. In order to estimate the stationarity of the data, several tests can be applied. There are two generations of UR tests, and they are called first and second-generation tests (Jin et al., 2022), respectively. The premise of independence in error cross-section is at the heart of the first generation of UR tests. In addition, numerous tests have been developed to probe the CD, which softens the requirement of independence (Lee and Lee, 2022). Traditional UR tests will fail to reliably detect CD of error. As a result, the study has employed Covariate-Augmented Dickey-Fuller (CADF) and cross-sectionally augmented Im, Pesaran, and Shin (CIPS) tests, both of which take CD into account.
The CADF unit root is computed as follows:
Where: Yt−1 and ∆Yt−1 define the average lag of the parameter and the first difference of the average lag of the parameter. Furthermore, the CIPS unit root is computed as:
Where CIPS and CADF represent the cross-sectional augmented IPS and ADF, respectively.
3.5.3 Panel cointegration test
In the next stage, we checked how well the target variables were cointegrated. Although first and second-generation tests have improved greatly, they still have their limitations, especially when it comes to detecting CD and structural fractures (Kasztelan, 2017). Furthermore, when the data exhibit heteroscedasticity and CD, the conventional tests often produce inaccurate and unreliable results. Therefore, given the restrictions imposed by these tests, Westerlund and Edgerton were employed to evaluate the panel’s cointegration because of their capacity to account for the CD, structural breakdowns, and autocorrelation. Listed below are the numerical examples used by Achi et al. (2022):
Reflection of the least squares estimator is (ϕi) reflection of
3.5.4 Long-run analysis
Researchers have several options at their disposal, including ordinary least squares (OLS), generalized method of moments (GMM), and “pooled ordinary least squares,” to determine the strength of the relationship between the targeted variables. That leaves it up to the researchers to narrow down the options for the most suitable method based on their evaluations of the merits and drawbacks of the available approaches, even if such evaluations really ought to be guided by the characteristics and behavior of the dataset itself. To be clear, none of these methods can diagnose CD. Because of this, the Cup-FM test is used, as it has been in research with similar designs (Appolloni et al., 2022). In addition, the Cup-BC test is implemented as recommended to assess the validity of the Cup-FM outcome. Additionally, when the information is large enough, resulting in high statistical power, these test results can be used with certainty. These two tests are superior to more conventional ones in the context of panel data sets because they hold up even when the information is plagued by issues like correlated data (CD), autocorrelation (AC), endogeneity (E), and producing a trustworthy outcome (R). By yielding findings that are rigorous and durable for the exogenous property of the regressor, these tests can also be used to reduce the potential fallout from using a model with a mixture of I(1) and I(0) explanatory variables. These assessments also help to eliminate the impact of the endogeneity problem, leading to reliable and strong outcomes regardless of the presence or absence of endogeneity (Liu and Dong, 2021).
Parameter dispersion is halted at a sustained level during outcome generation using Cup-FM testing, but parameters also absorb changes produced by changes in time via stimulating to convergent level. Furthermore, the factor model has been stated as follows, with the assumption of constant following of the error terms:
In Eq. 10, MF = IT–T−2FF′, Error terms are the reflection of “common latent components,” and IT is the presentation of the elements, which is “the identity matrix” as expressed by T’s. The initial computation is allocated at point F, and the operation is repeated up to the point of convergence.
4 Results and discussion
4.1 Cross-sectional dependency test
In particular, it assumed that there is no correlation between the various cross-sections. However, as a result of international trade and travel, panel data may become too dependent on individual countries. If CSD is disregarded, the resulting estimators may be inefficient and biassed. Table 4 displays the outcomes of the CSD analyses performed for this study. As a result, the existence of a cross-sectional dependency was established. If conditional stationarity bias (CSD) is present, the results of the King and Shackleton (2020) first-generation unit root test could be skewed and deceptive. Given these findings, we are compelled to approach the issue of CSD by employing a different suite of unit root tests, namely, the CIPS and CADF developed by Liu H. et al. (2022), the second-generation method.
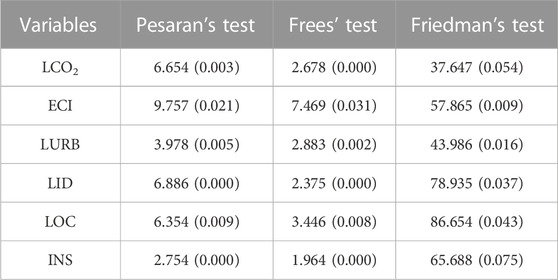
TABLE 4. CSD.
4.2 Results of CADF and CIPS unit root test
In order to account for cross-sectional dependence, the authors of this empirical work use the CADF and CIPS unit root tests rather than the first-generation IPS and LLC unit root tests. To restate, the CADF and CIPS tests nevertheless provide credible findings when there is cross-sectional dependency and heterogeneity across the sample nations. All components (CO2, ECI, URB, ID, and INS) are integrated at the first difference, as shown by the CADF and CIPS unit root tests. These findings are the product of this study’s use of more advanced research techniques (Table 5).
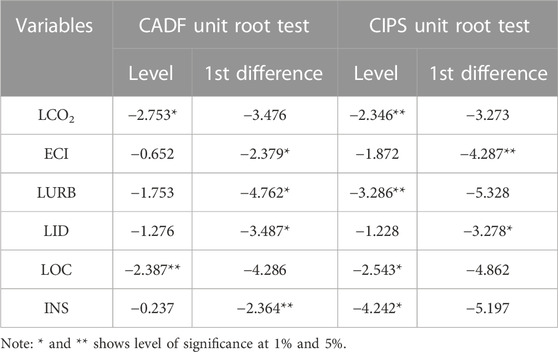
TABLE 5. CADF and CIPS.
4.3 Panel cointegration approach
The method of Westerlund and Edgerton (2007) were then used to assess the degree of cointegration, which is useful for gauging the persistence of relationships between variables through time. The results show that cointegration is present, as the significance values are statistically significant at the 1% level. Results from the method of (Ma and Zhu, 2022) are shown in Table 6.
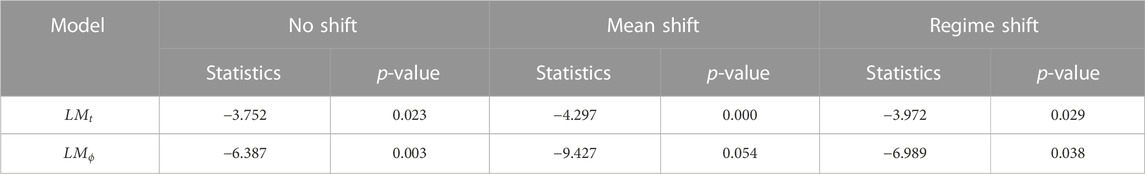
TABLE 6. Results of Westerlund and Edgerton cointegration test.
4.4 Long run estimation of Cup-FM
Table 7 shows the results of CUP-FM; however, the values of coefficients have minor variation from CUP-BC because of different estimators. It is common view that different estimators can show the same results in association (+VE or −VE) but the coefficient can deviate. This means that over a range of estimates, the economic complexity index is consistently found to have a positive impact on CO2 output. In accordance with the CUP-FM standards, it suggests that an increase in ECI of 1% would result in an increase in emissions of 0.053%–0.164%, 0.075%, and 0.107%. By depicting the long-term relationship between economic complexity and carbon dioxide emissions as an inversion U-shaped curve, similar to the EKC for income, this work contributes significantly to the existing literature on the EKC hypothesis. In the initial stage of economic complexity development, carbon emissions rise because more resources and processes are absorbed into increasingly complex and sophisticated goods. In the second phase, when the effectiveness of export product diversification deteriorates, a more complex economy does indeed result in more carbon emissions. More sophisticated systems sometimes incorporate polluting technologies; therefore, they may themselves cause an increase in pollution. There may be more carbon emissions at this stage if the economy is more complicated.
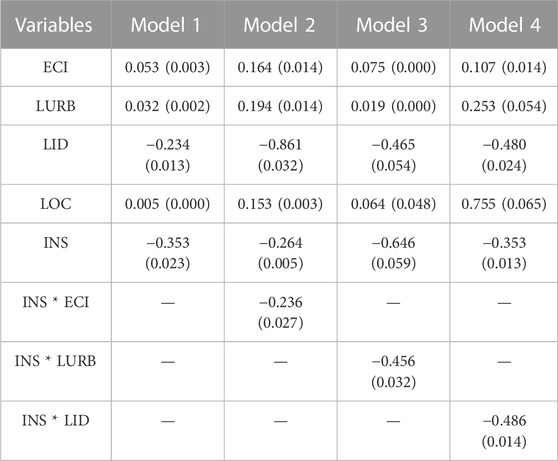
TABLE 7. Cup-FM results.
The rate of urbanization in the China region has had a favorable effect on carbon emissions. In addition, the statistically significant increases in emissions of 0.032%, 0.194%, 0.019%, and 0.253% for the China region are all associated with a 1% increase in urbanization in that region, respectively. As was previously believed, urbanization will affect the environmental damage model. An increase in emissions is expected for every one percent rise in the urban population share of the total population. Different conclusion can be drawn from studies looking at how urbanization affects carbon emissions in Indonesia. Centobelli et al. (2021), for instance, find that urbanization raises carbon emissions in Indonesia. On the other hand, urbanization has little effect on carbon emissions in Indonesia, according to research by Wu et al. (2021). Findings of Ma and Zhu (2022) and theses are consistent with one another. In addition, it is in line with other studies that have looked into the connection between urbanization and carbon emissions; for example, Pouikli (2020) in the Asian region, Streimikiene and Kaftan (2021) in 59 countries (low-middle-upper income) including Indonesia, Zhao et al. (2020) in Ethiopia, Shuai and Fan (2020) in European Union countries, and Ye et al. (2021). The rapid expansion of Indonesia’s industrial sector has coincided with a corresponding increase in the country’s urban population. While just 14.6% of the world’s population lived in urban areas in 1960, that number has risen dramatically to 55.3% of the world’s population in 2018. Wang Y. et al. (2021) found that as urbanization spread across Indonesia, so did the country’s reliance on coal for power generation, which in turn contributed to an increase in greenhouse gas emissions.
The construction of new infrastructure also tends to increase pollution levels. Long-term, growing infrastructure reduces carbon emissions by an average of −0.234%, −0.861%, −0.465%, and −0.480%. Cities may have to rethink their infrastructure in light of the increased likelihood of climate change consequences in order to help reduce greenhouse gas emissions and make themselves more resistant to harsh weather. Both objectives are ambitious, and achieving them will require novel approaches and insights that have not yet been explored. Extreme weather events are the first point of contact that people will have with the effects of climate change, and they are widely recognized as one of the greatest threats to global sustainability. Cities are more susceptible to natural disasters because of their high populations, strategic placement (near water), and highly interconnected and complicated infrastructure (Otek Ntsama et al., 2021). As we determine how the construction of infrastructure to lessen vulnerability to extreme events may influence GHG emissions from activities, we expect to need connected methods (that enhance resilience and reduce GHG emissions). Evaluations of infrastructure utilisation with regard to greenhouse gas emissions must be combined with new information about how infrastructure affects social and natural systems. The traditional risk-based engineering methods to infrastructure design prioritise investment in hard, structural, resistant components that are fail-safe rather than more adaptive, varied, ecologically oriented strategies that try to reduce the consequences of failure (Yumei et al., 2022). Rethinking what makes infrastructures adaptable to climate extremes and the research relating infrastructure design and behaviour for GHG reductions are both crucial.
The findings point to a positive effect of oil consumption on carbon emissions of 0.005%, 0.153%, 0.064%, and 0.755%. Current oil consumption and CO2 emissions by road cars from 1990 to 2020 are displayed in Table 7. During this time period, there was an annual increase in the amount of oil used by the road transportation system. As a result, the road transportation sector is one of the fastest-growing oil-consuming sectors among countries that now import oil. The percentage of the country’s overall oil consumption used by the road transportation sector rose. One of China’s top consumers of oil is and will be the road transport sector. Trucks, as the currently larger fleet type, consume the most oil in road transport, accounting for more than half of the overall oil consumption by vehicles. However, just around 30% of all fuel was used by the targeted cars, even though their combined population is over half of the total. Nevertheless, as these vehicle types continue to expand at a staggering rate, their market share is slowly but steadily growing. Moreover, it is very interesting to clear why this phenomenon happened besides various studies have already pointed out this association. At this time china has numerous strategic plans to reduce the emissions level, such a Paris agreement, Sustainable development goals, etc. However, china brings massive amount of emissions as a result of traditional energy use such as oil consumption. Over time, china has tried it is best for energy transition to secure the environmental quality while the rising energy demand may not fulfill by energy transition. Therefore, it is significance of this study to point out that china uses massive amount of oil in its energy mix. In simple words china is using larger amount of traditional energies rather than modern one in its human and economic activities. However, China has settled a target to achieve carbon peak by 2030 and carbon neutrality by 2060.
Carbon emissions will drop by −0.353%, −0.264%, −0.646%, and −0.353% for every 1% increase in institutional size, respectively. The research shows that institutions have a favorable effect on CO2e in the long run, but they have a negative and significant effect in the short run. According to the results of a pooled mean group (PMG), a rise of just one percent in the number of institutions is associated with a decline in long-term carbon emissions. In a 2015 study, Ibrahim and Rahman showed that better institutional rules and regulations aid in decreasing CO2e emissions. Institutions are shown to have a detrimental effect on CO2es by Kopnina (2019). Institutional quality aids in lowering CO2e, according to studies by Chen et al. (2020). Institutions have positive effects on economic growth but negative effects on carbon dioxide emissions, as shown by the research of Rehman et al. (2021). These results lend credence to the regulation effect theory, which is associated with the introduction of ecological norms. This suggests that the financial markets are more likely to support environmentally friendly projects and green investments if there are high-quality institutions in place to do so. Reduce the negative effects of economic growth on the natural world. Consistent with the findings of Zhang et al. (2021), our findings hold.
There may raise a question, why does this study use the interaction term? The current study presents a fresh idea by investigating the moderate effect of IQ with ECI, LURB and LID. Fundamentally, it is being considered that IQ has a dampening impact on the association between the three variables, e.g., ECI, LURB and LID. If a variation in IQ causes some significant change, the moderate effect is unfavorable. Heterogeneous interactions are meaningful because it allows us to estimate the impact of continuous variation in IQ and other selected variables. Moreover, it is helpful to measure the marginal effect of ECI, LURB and LID on carbon neutrality. Similarly, the rising trend in emissions due to ECI, urbanization and infrastructure development can be manage via strong institution intervention. Therefore, the current study tries to introduce the integration term between the IQ and, ECI, IQ and URB and IQ and ID. Interestingly, the institutions perform well to minimize the environmental damages by specified factors. It infers that a one rise in this factor (interaction terms) would cause a decline in emissions by 0.236%, 0.456% and 0.486%, respectively.
4.5 Robust check by Cup-BC test
The results of the robust check indicate that the economic complexity index has a positive impact on carbon emissions (Table 8). This shows that a 1% increase in this factor would cause to increase in the level of carbon emission by 0.654%, 0.964%, 0.543%, and 0.265%. Based on the coefficients that here can be interpreted as elasticity, a 1% increase in urbanization in China will increase CO2 emissions by 0.753%, 0.845%, 0.264%, and 0.210%, respectively. The results indicate that infrastructure development has a negative impact on carbon emissions. This indicates that carbon emission decreases due to an increase in the level of infrastructure development by −0.787%, −0.642%, −0.464%, and −0.673%. Oil consumption has a positive impact on carbon emissions by 0.767%, 0.686%, 0.364%, and 0.924%. The results indicate that a 1% increase in the institution will cause to decrease in the level of carbon emission by −0.554%, −0.473%, −0.598%, and −0.765%. The moderate effect of institutions on the economic complexity index, urbanization, and institution development has a negative impact on carbon emission by −0.653%, −0.476%, and −0.165%.
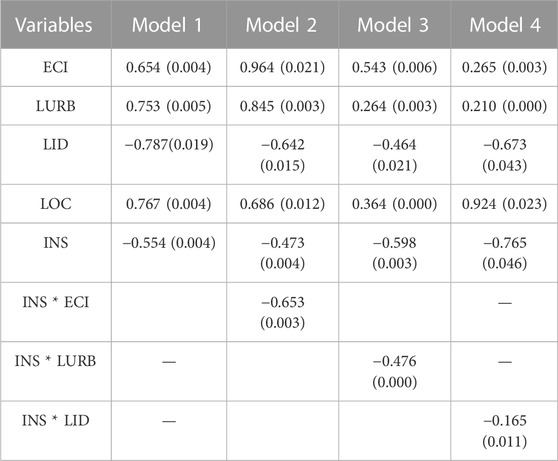
TABLE 8. Cup-BC results.
5 Conclusion and suggestions
The primary objective of this study is to examine the factors that would affect carbon emissions in 30 provinces across China on a yearly basis from 2000 to 2020. The study begins by assessing the interdependencies between countries before using a panel unit root test of the second generation that accounts for cross-sectional dependence. After a cointegration relationship is confirmed, the study estimates cointegration parameters using the PMG estimator. Using CS-ARDL regression, we conduct a rigorous check on the hypothesized connections. The estimating method yielded favorable results, showing that the economic complexity index, urbanization, and oil consumption all had an impact on carbon emissions. Furthermore, research shows that building new infrastructure and establishing new institutions has a major negative effect on greenhouse gas emissions.
Considering the association between economic complexity and environmental degradation in the countries under study, national environmental policies should include incentives for technical advancement (i.e., cleaner technologies in exports, environmentally friendly production processes, and smart grids) as well as general efforts to improve environmental protection. However, the urbanization increases the carbon emissions. This indicates that the rate of CO2 emissions in the region is increasing as more cities become urbanized. The low quality of life and the absence of basic services in rural regions contribute to the high rural-urban migration rates in China. People tend to migrate to urban areas because they are thought to have the best quality of life. For this reason, lowering the emission rate requires a decrease in the rate at which people leave rural areas for urban centers. The Chinese government should also prioritize job creation and raise urban residents’ standard of living. They will not feel the need to move to the city anymore. In addition, each nation should implement a well-thought-out URB. To achieve this goal, countries need to establish a URB threshold below which URB-related emissions will begin to decline. In addition, rapid URB places a greater strain on the nation’s already strained social and physical infrastructure. Because of this increase in URB, urban centers must invest in infrastructural upgrades. Investors would be presented with exciting new opportunities as a result of this. Last but not least, developing “smart cities” in China may alleviate some of the country’s URB-related woes. Cities that use smart technology improve the efficiency and effectiveness of municipal services including those that provide power and transportation.
Policy and decision-makers still lack an admiration for these relationships and the requirement to transition ageing infrastructure and develop new infrastructure for developing regions, despite significant advancements in our awareness of how infrastructure systems and techniques impact GHG emissions in urban areas. As a result of industrialization, people are moving both to cities and the countryside, reducing the disparity between them. Therefore, the development of roads should not be overlooked for directing sustained economic growth, as they connect various sectors and growth contributors together, facilitating easier access and eliminating time limitations.
Equally important for environmental protection is sound institutional structure for governing environmental issues. Indeed, it is institutions that determine the success or failure of government policies that are supposed to represent the capacity to deal with this issue. Having clear institutional structures is crucial for environmental sustainability since they serve as a mediator and lead to a win-win outcome (Feng et al., 2022). To effectively control environmental emissions and determine how their operational integrity may be improved, policymakers need to focus on several governance factors and their relationships. They need to ensure environmental safety is ensured as well. The environmental restrictions need to be tightened (for instance, by limiting emissions from various sources or by employing cleaner transport modes) and the system has to be improved.
Emissions from oil use are on the rise, and this suggests that inefficient use of energy is also contributing to climate change. For instance, the Chinese government would be unable to build up a nationwide public transportation system, especially in urban areas, to accommodate the country’s expanding population if oil were in short supply. Residents must rely heavily on personal automobiles because public transportation options to and from places of employment, educational institutions, and retail centres are severely limited. As a means of protecting the environment and decreasing the country’s reliance on oil, the Chinese government should invest in a modern, efficient, and fast urban system of public transportation. In addition, strong fuel economy standards need to be established for automobiles in order to decrease oil usage. Taxation and price controls imposed by the government have had a major impact on domestic oil usage. It has also been proposed that the Chinese government implement a solar-powered train system to improve the country’s transportation options, particularly within cities.
As our sample is non-exclusively comprised of developed nations, future research can split its attention between developing and developed nations to further disentangle the impact of these factors on carbon emissions. To better and more efficiently comprehend this association and compare results, future studies can use other econometric techniques for such studies. The purpose of this paper was to shed light on the ECI-carbon emissions relationship, but it is clear that this is only the beginning and that more research is needed to address the study’s limitations (i.e., the short time span). Further progress is feasible, not only by incorporating the most recent methodological findings in relation to the EKC model, but also by employing alternative data sets.
Data availability statement
The original contributions presented in the study are included in the article/Supplementary Material, further inquiries can be directed to the corresponding author.
Author contributions
WZ contributed to conception and design of the study. WZ organized the database. WZ performed the statistical analysis. WZ wrote the first draft of the manuscript. HZ wrote the sections of the manuscript. All authors contributed to manuscript revision, read, and approved the submitted version.
Conflict of interest
The author declares that the research was conducted in the absence of any commercial or financial relationships that could be construed as a potential conflict of interest.
Publisher’s note
All claims expressed in this article are solely those of the authors and do not necessarily represent those of their affiliated organizations, or those of the publisher, the editors and the reviewers. Any product that may be evaluated in this article, or claim that may be made by its manufacturer, is not guaranteed or endorsed by the publisher.
References
Achi, A., Adeola, O., and Achi, F. C. (2022). CSR and green process innovation as antecedents of micro, small, and medium enterprise performance: Moderating role of perceived environmental volatility. J. Bus. Res. 139, 771–781. doi:10.1016/j.jbusres.2021.10.016
Adebayo, T. S. (2022). Environmental consequences of fossil fuel in Spain amidst renewable energy consumption: A new insights from the wavelet-based granger causality approach. Int. J. Sustain. Dev. World Ecol. 29, 579–592. doi:10.1080/13504509.2022.2054877
Adedoyin, F. F., Ozturk, I., Bekun, F. V., Agboola, P. O., and Agboola, M. O. (2021). Renewable and non-renewable energy policy simulations for abating emissions in a complex economy: Evidence from the novel dynamic ARDL. Renew. Energy 177, 1408–1420. doi:10.1016/j.renene.2021.06.018
Adekoya, O. B., Oliyide, J. A., and Fasanya, I. O. (2022). Renewable and non-renewable energy consumption – ecological footprint nexus in net-oil exporting and net-oil importing countries: Policy implications for a sustainable environment. Renew. Energy 189, 524–534. doi:10.1016/j.renene.2022.03.036
Ahmad, M., Ahmed, Z., Majeed, A., and Huang, B., 2021. An environmental impact assessment of economic complexity and energy consumption: Does institutional quality make a difference? Environ. Impact Assess. Rev. 89, 106603. doi:10.1016/j.eiar.2021.106603
Ahmad, T., and Zhang, D. (2020). A critical review of comparative global historical energy consumption and future demand: The story told so far. Energy Rep. 6, 1973–1991. doi:10.1016/j.egyr.2020.07.020
Akadiri, S. S., Adebayo, T. S., Asuzu, O. C., Onuogu, I. C., and Oji-Okoro, I. (2022). Testing the role of economic complexity on the ecological footprint in China: A nonparametric causality-in-quantiles approach. Energy Environ., 0958305X2210945. doi:10.1177/0958305X221094573
Appolloni, A., Chiappetta Jabbour, C. J., D’Adamo, I., Gastaldi, M., and Settembre-Blundo, D. (2022). Green recovery in the mature manufacturing industry: The role of the green-circular premium and sustainability certification in innovative efforts. Ecol. Econ. 193, 107311. doi:10.1016/J.ECOLECON.2021.107311
Barbier, E. B. (2020). Greening the post-pandemic recovery in the G20. Environ. Resour. Econ. 76, 685–703. doi:10.1007/s10640-020-00437-w
Bian, W., and Yan, G. (2022). Analyzing intention to purchase brand extension via brand attribute associations: The mediating and moderating role of emotional consumer-brand relationship and brand commitment. Front. Psychol. 13, 884673. doi:10.3389/fpsyg.2022.884673
Calvert Jump, R., Hommes, C., and Levine, P. (2019). Learning, heterogeneity, and complexity in the New Keynesian model. J. Econ. Behav. Organ. 166, 446–470. doi:10.1016/j.jebo.2019.07.014
Centobelli, P., Cerchione, R., Esposito, E., and Passaro, R. (2021). Determinants of the transition towards circular economy in SMEs: A sustainable supply chain management perspective. Int. J. Prod. Econ. 242, 108297. doi:10.1016/J.IJPE.2021.108297
Chen, T. L., Kim, H., Pan, S. Y., Tseng, P. C., Lin, Y. P., and Chiang, P. C. (2020). Implementation of green chemistry principles in circular economy system towards sustainable development goals: Challenges and perspectives. Sci. Total Environ. 716, 136998. doi:10.1016/J.SCITOTENV.2020.136998
Cheng, C., Ren, X., Wang, Z., and Shi, Y. (2018). The impacts of non-fossil energy, economic growth, energy consumption, and oil price on carbon intensity: Evidence from a panel quantile regression analysis of EU 28. Sustain 10, 4067. doi:10.3390/su10114067
Doğan, B., Driha, O. M., Balsalobre Lorente, D., and Shahzad, U. (2021). The mitigating effects of economic complexity and renewable energy on carbon emissions in developed countries. Sustain. Dev. 29, 1–12. doi:10.1002/sd.2125
Fatai Adedoyin, F., Agboola, P. O., Ozturk, I., Bekun, F. V., and Agboola, M. O. (2021). Environmental consequences of economic complexities in the EU amidst a booming tourism industry: Accounting for the role of brexit and other crisis events. J. Clean. Prod. 305, 127117. doi:10.1016/J.JCLEPRO.2021.127117
Feng, H., Liu, Z., Wu, J., Iqbal, W., Ahmad, W., and Marie, M. (2022). Nexus between Government spending’s and Green Economic performance: Role of green finance and structure effect. Environ. Technol. Innov. 27, 102461. doi:10.1016/j.eti.2022.102461
Gozgor, G. (2018). A new approach to the renewable energy-growth nexus: Evidence from the USA. Environ. Sci. Pollut. Res. 25, 16590–16600. doi:10.1007/s11356-018-1858-9
He, K., Ramzan, M., Awosusi, A. A., Ahmed, Z., Ahmad, M., and Altuntaş, M. (2021). Does globalization moderate the effect of economic complexity on CO2 emissions? Evidence from the top 10 energy transition economies. Front. Environ. Sci. 9, 555. doi:10.3389/fenvs.2021.778088
He, S., and Guo, K. (2021). What factors contribute to the mutual dependence degree of China in its crude oil trading relationship with oil-exporting countries? Energy 228, 120547. doi:10.1016/j.energy.2021.120547
Huang, Y., Haseeb, M., Usman, M., and Ozturk, I. (2022). Dynamic association between ICT, renewable energy, economic complexity and ecological footprint: Is there any difference between E-7 (developing) and G-7 (developed) countries? Technol. Soc. 68, 101853. doi:10.1016/J.TECHSOC.2021.101853
Iqbal, W., Fatima, A., Yumei, H., Abbas, Q., and Iram, R. (2020). Oil supply risk and affecting parameters associated with oil supplementation and disruption. J. Clean. Prod. 255, 120187. doi:10.1016/j.jclepro.2020.120187
Jin, Y., Tang, Y. M., Chau, K. Y., and Abbas, M. (2022). How government expenditure mitigates emissions: A step towards sustainable green economy in belt and road initiatives project. J. Environ. Manage. 303, 113967. doi:10.1016/j.jenvman.2021.113967
Jinru, L., Changbiao, Z., Ahmad, B., Irfan, M., and Nazir, R. (2021). How do green financing and green logistics affect the circular economy in the pandemic situation: Key mediating role of sustainable production. Econ. Res. Istraz. 35, 3836–3856. doi:10.1080/1331677X.2021.2004437
Kasztelan, A. (2017). Green growth, green economy and sustainable development: Terminological and relational discourse. Prague Econ. Pap. 26, 487–499. doi:10.18267/j.pep.626
Khezri, M., Heshmati, A., and Khodaei, M. (2022). Environmental implications of economic complexity and its role in determining how renewable energies affect CO2 emissions. Appl. Energy. 306, 117948. doi:10.1016/j.apenergy.2021.117948
King, A., and Shackleton, C. M. (2020). Maintenance of public and private urban green infrastructure provides significant employment in Eastern Cape towns, South Africa. Urban For. Urban Green 54, 126740. doi:10.1016/j.ufug.2020.126740
Kopnina, H. (2019). Green-washing or best case practices? Using circular economy and cradle to cradle case studies in business education. J. Clean. Prod. 219, 613–621. doi:10.1016/j.jclepro.2019.02.005
Lafuente, M. V., Gil, M. D. G., and Miguez, G. C. (2012). “Maritime policy and economic performance in the European Union: An institutional and regulatory approach,” in European union: Economic and political developments, 66–88.
Lee, C. C., and Lee, C. C. (2022). How does green finance affect green total factor productivity? Evidence from China. Energy Econ. 107, 105863. doi:10.1016/J.ENECO.2022.105863
Li, G., Wu, H., Sethi, S. P., and Zhang, X. (2021). Contracting green product supply chains considering marketing efforts in the circular economy era. Int. J. Prod. Econ. 234, 108041. doi:10.1016/J.IJPE.2021.108041
Licastro, A., and Sergi, B. S. (2021). Drivers and barriers to a green economy. A review of selected balkan countries. Clean. Eng. Technol. 4, 100228. doi:10.1016/j.clet.2021.100228
Liu, H., Tang, Y. M., Iqbal, W., and Raza, H. (2022a). Assessing the role of energy finance, green policies, and investment towards green economic recovery. Environ. Sci. Pollut. Res. 29, 21275–21288. doi:10.1007/s11356-021-17160-8
Liu, L., Li, Z., Fu, X., Liu, X., Li, Z., and Zheng, W. (2022b). Impact of power on uneven development: Evaluating built-up area changes in Chengdu based on NPP-VIIRS images (2015–2019). Land 11 (4), 489. doi:10.3390/land11040489
Liu, X., Tong, D., Huang, J., Zheng, W., Kong, M., and Zhou, G. (2022c). What matters in the e-commerce era? Modelling and mapping shop rents in guangzhou, China. Land Use Policy 123, 106430. doi:10.1016/j.landusepol.2022.106430
Liu, Z., Wang, Y., and Feng, J. (2022d). Vehicle-type strategies for manufacturer's car sharing. Kybernetes ahead-of-print. doi:10.1108/K-11-2021-1095
Liu, Y., and Dong, F. (2021). How technological innovation impacts urban green economy efficiency in emerging economies: A case study of 278 Chinese cities. Resour. Conserv. Recycl. 169, 105534. doi:10.1016/j.resconrec.2021.105534
Ma, D., and Zhu, Q. (2022). Innovation in emerging economies: Research on the digital economy driving high-quality green development. J. Bus. Res. 145, 801–813. doi:10.1016/J.JBUSRES.2022.03.041
Marrocu, E., Paci, R., and Zara, A. (2015). Micro-economic determinants of tourist expenditure: A quantile regression approach. Tour. Manag. 50, 13–30. doi:10.1016/j.tourman.2015.01.006
Mastini, R., Kallis, G., and Hickel, J. (2021). A green new deal without growth? Ecol. Econ. 179, 106832. doi:10.1016/j.ecolecon.2020.106832
Mealy, P., and Teytelboym, A. (2020). Economic complexity and the green economy. Res. Policy 51, 103948. doi:10.1016/j.respol.2020.103948
Murshed, M., and Tanha, M. M. (2021). Oil price shocks and renewable energy transition: Empirical evidence from net oil-importing South Asian economies. Energy, Ecol. Environ. 6, 183–203. doi:10.1007/s40974-020-00168-0
Oluc, I., Ben Jebli, M., Can, M., Guzel, I., and Brusselaers, J. (2022). The productive capacity and environment: Evidence from OECD countries. Environ. Sci. Pollut. Res. 30, 3453–3466. doi:10.1007/s11356-022-22341-0
Otek Ntsama, U. Y., Yan, C., Nasiri, A., and Mbouombouo Mboungam, A. H. (2021). Green bonds issuance: Insights in low- and middle-income countries. Int. J. Corp. Soc. Responsib. 6, 2–9. doi:10.1186/s40991-020-00056-0
Pouikli, K. (2020). Towards mandatory green public procurement (GPP) requirements under the EU green deal: Reconsidering the role of public procurement as an environmental policy tool. ERA Forum 214 21, 699–721. doi:10.1007/S12027-020-00635-5
Rafique, M. Z., Doğan, B., Husain, S., Huang, S., and Shahzad, U. (2021). Role of economic complexity to induce renewable energy: Contextual evidence from G7 and E7 countries. Int. J. Green Energy 18, 745–754. doi:10.1080/15435075.2021.1880912
Razumovskaia, E., Yuzvovich, L., Kniazeva, E., Klimenko, M., and Shelyakin, V. (2020). The effectiveness of Russian government policy to support SMEs in the COVID-19 pandemic. J. Open Innov. Technol. Mark. Complex. 20206, 160. Page 160 6. doi:10.3390/JOITMC6040160
Rehman, E., Ikram, M., Rehman, S., and Feng, M. T. (2021). Growing green? Sectoral-Based prediction of GHG emission in Pakistan: A novel NDGM and doubling time model approach. Environ. Dev. Sustain. 23, 12169–12191. doi:10.1007/s10668-020-01163-5
Sarwar, S., Chen, W., and Waheed, R. (2017). Electricity consumption, oil price and economic growth: Global perspective. Renew. Sustain. Energy Rev. 76, 9–18. doi:10.1016/j.rser.2017.03.063
Shahbaz, M., Sarwar, S., Chen, W., and Malik, M. N. (2017). Dynamics of electricity consumption, oil price and economic growth: Global perspective. Energy Policy 108, 256–270. doi:10.1016/j.enpol.2017.06.006
Shahzad, U., Fareed, Z., Shahzad, F., and Shahzad, K. (2021). Investigating the nexus between economic complexity, energy consumption and ecological footprint for the United States: New insights from quantile methods. J. Clean. Prod. 279, 123806. doi:10.1016/J.JCLEPRO.2020.123806
Shahzad, U., Ferraz, D., Nguyen, H. H., and Cui, L. (2022). Investigating the spill overs and connectedness between financial globalization, high-tech industries and environmental footprints: Fresh evidence in context of China. Technol. Forecast. Soc. Change 174, 121205. doi:10.1016/j.techfore.2021.121205
Shuai, S., and Fan, Z. (2020). Modeling the role of environmental regulations in regional green economy efficiency of China: Empirical evidence from super efficiency DEA-Tobit model. J. Environ. Manage. 261, 110227. doi:10.1016/j.jenvman.2020.110227
Smith, L. V., Tarui, N., and Yamagata, T., (2021). Assessing the impact of COVID-19 on global fossil fuel consumption and CO2 emissions. Energy Econ. 97, 105170. doi:10.1016/j.eneco.2021.105170
Streimikiene, D., and Kaftan, V. (2021). Green finance and the economic threats during COVID-19 pandemic. Terra Econ. 19, 105–113. doi:10.18522/2073-6606-2021-19-2-105-113
Valadkhani, A., Smyth, R., and Nguyen, J. (2019). Effects of primary energy consumption on CO 2 emissions under optimal thresholds: Evidence from sixty countries over the last half century. Energy Econ. 80, 680–690. doi:10.1016/j.eneco.2019.02.010
Verma, S., and Kandpal, D. (2021). “Chapter 16 - green economy and sustainable development: A macroeconomic perspective,” in Environmental sustainability and economy. Editors P. Singh, P. Verma, D. Perrotti, and K. K. Srivastava (Elsevier), 325–343. doi:10.1016/B978-0-12-822188-4.00016-6
Wang, Q., Li, S., and Pisarenko, Z. (2020). Heterogeneous effects of energy efficiency, oil price, environmental pressure, R&D investment, and policy on renewable energy – evidence from the G20 countries. Energy 209, 118322. doi:10.1016/j.energy.2020.118322
Wang, Y., Lei, X., Zhao, D., Long, R., and Wu, M. (2021b). The dual impacts of green credit on economy and environment: Evidence from China. Sustain 13, 4574. doi:10.3390/su13084574
Wang, Z., Ben Jebli, M., Madaleno, M., Doğan, B., and Shahzad, U. (2021a). Does export product quality and renewable energy induce carbon dioxide emissions: Evidence from leading complex and renewable energy economies. Renew. Energy 171, 360–370. doi:10.1016/j.renene.2021.02.066
Westerlund, J., and Edgerton, D. L. (2007). A panel bootstrap cointegration test. Econ. Lett. 97, 185–190. doi:10.1016/j.econlet.2007.03.003
Wu, M., Wu, J., and Zang, C. (2021). A comprehensive evaluation of the eco-carrying capacity and green economy in the Guangdong-Hong Kong-Macao Greater Bay Area, China. J. Clean. Prod. 281, 124945. doi:10.1016/j.jclepro.2020.124945
Xu, X., Wang, C., and Zhou, P. (2021). GVRP considered oil-gas recovery in refined oil distribution: From an environmental perspective. Int. J. Prod. Econ. 235, 108078. doi:10.1016/j.ijpe.2021.108078
Ye, F., Quan, Y., He, Y., and Lin, X. (2021). The impact of government preferences and environmental regulations on green development of China’s marine economy. Environ. Impact Assess. Rev. 87, 106522. doi:10.1016/j.eiar.2020.106522
You, J., and Ren, Q. (2021). The impact of consumption on economic growth in Chongqing based on the decomposition of input output table. J. Comput. methods Sci. 21 (6), 1647–1661. doi:10.3233/JCM-215437
Yuan, J. H., Kang, J. G., Zhao, C. H., and Hu, Z. G. (2008). Energy consumption and economic growth: Evidence from China at both aggregated and disaggregated levels. Energy Econ. 30, 3077–3094. doi:10.1016/j.eneco.2008.03.007
Yumei, H., Iqbal, W., Irfan, M., and Fatima, A. (2022). The dynamics of public spending on sustainable green economy: Role of technological innovation and industrial structure effects. Environ. Sci. Pollut. Res. 29, 22970–22988. doi:10.1007/s11356-021-17407-4
Zhang, D., Mohsin, M., Rasheed, A. K., Chang, Y., and Taghizadeh-Hesary, F. (2021). Public spending and green economic growth in BRI region: Mediating role of green finance. Energy Policy 153, 112256. doi:10.1016/J.ENPOL.2021.112256
Zhao, P. J., Zeng, L. E., Lu, H. Y., Zhou, Y., Hu, H. Y., and Wei, X. Y. (2020). Green economic efficiency and its influencing factors in China from 2008 to 2017: Based on the super-SBM model with undesirable outputs and spatial Dubin model. Sci. Total Environ. 741, 140026. doi:10.1016/j.scitotenv.2020.140026
Keywords: CO2, oil consumption, infrastructure development, Urb, ECI
Citation: Zhang H and Zhou W (2023) Are infrastructure development, economic complexity index, and oil cnsumption really matter for green economic recover? The role of institutions. Front. Environ. Sci. 11:1102038. doi: 10.3389/fenvs.2023.1102038
Received: 18 November 2022; Accepted: 16 January 2023;
Published: 28 February 2023.
Edited by:
Fengtao Guang, China University of Geosciences Wuhan, ChinaReviewed by:
Yefei Sun, Nanjing University of Science and Technology, ChinaDanish Iqbal Godil, Dar-ul-Madina International University Islamabad, Pakistan
Copyright © 2023 Zhang and Zhou. This is an open-access article distributed under the terms of the Creative Commons Attribution License (CC BY). The use, distribution or reproduction in other forums is permitted, provided the original author(s) and the copyright owner(s) are credited and that the original publication in this journal is cited, in accordance with accepted academic practice. No use, distribution or reproduction is permitted which does not comply with these terms.
*Correspondence: Wangxun Zhou, emhvdV93YW5neHVuQG91dGxvb2suY29t