 Nubia S. Rodríguez-Hernández*†
 Miguel Arango
 Lina M. Moreno-Conn
 José Orlando Arguello
 Jaime H. Bernal-Riobo
 Otoniel Pérez-López
- Colombian Agricultural Research Corporation—Agrosavia, La Libertad Research Center, Villavicencio, Meta, Colombia
Colombia has a livestock population of approximately 28.2 million heads, of which 20.4% is found in the eastern high plains of the Orinoquia region. The extensive beef cattle system predominates, whose diet is based on native and introduced pastures of the genus Urochloa sp. which is deficiently managed, affecting productive and reproductive indexes due to the low adoption of technology. We evaluated potential sustainable intensive systems for cattle production, which contribute to maintaining the provision of environmental services. Between 2011 and 2015 in Agrosavia’s Research Center at Carimagua (4° 37'N and 71° 19' W) environmental and animal production variables were monitored in the following systems: a) degraded pastures recovered with tillage and fertilization, b) annual crop rotation with pastures, c) forest arrangements in strips, and d) forest remnants in perimeter areas. Productive and reproductive variables were determined in animals such as weight gain, calving interval, among others while the pasture/crop productive variables included yield and forage quality. Regarding soil ecosystem services (ES) the macrofauna biodiversity, biogeochemical cycles, soil physical and chemical variables were considered. Estimation of indicators was carried out through principal components analysis for soil physical, chemical and macrofauna variables to extract the two main components that explain the variance. For climate regulation of ES, measurement of soil organic carbon (SOC) storage at a depth of 20 cm and the annual accumulated greenhouse gas (GHG) emissions were included. The systems that involved lime amendments and fertilizers increased the value in the year of application. Values in the water regulation indicator did not show significant differences among the options implemented during the years. Edaphic macrofauna biodiversity indicator value was sensitive to changes in management practices, with termites being the group with highest abundance. The indicator related to SOC was higher in the forest area compared to the pasture-crop system. Systems under the agroforestry schemes which integrated various practices such as managed and recovered pastures, crop-pasture rotation, patched areas and tree strips contributed to maintain or improve the ES, although each one of the strategies proposed provided improvement in at leas one ES.
1 Introduction
In Colombia, since the 18th century, multiple factors such as demographic growth, migration due to violence, and expansion of the agricultural frontier have interacted and even overlapped to forge the transformation of natural ecosystems (Etter et al., 2006). Nearly a third of natural forest areas were changed to productive systems, especially the livestock system, giving way to grazing areas and colonization of lowlands (Etter et al., 2008). Livestock farming is an economic activity that can secure land ownership and helps obtain higher profits in terms of land value, with low investment (Clerici et al., 2020). The transformation of forests to pastureland is one of the main drivers of deforestation (Armenteras et al., 2017; CDP Report, 2018). Extensive cattle raising is a sector that occupies 38% of the Colombian territory. It represents structural barriers to rural development due to the inefficient use of natural resources, limited access to financial resources and technology, low inputs and, therefore, low yields. Reducing the area allocated to livestock farming is a priority in order to contribute to deforestation reduction and forest preservation at the national scale (Correa and Ruiz, 2006; Nepstad et al., 2013). The high plains of the Meta department is located in the Eastern plains of Colombia. There is a cattle population of 5.75 million heads, which represents 20.4% of the national total and covers about 4.6 Mha (Paredes Vega and Hernández Leal, 2013). The high plains of the Meta department is a highly evolved ecosystem. The soils are primarily of the orders oxisols and ultisols, with low cation exchange capacity, high acidity, and Al3+ toxicity. From the physical point of view, these soils are fragile and susceptible to compaction, erosion, and surface sealing, with low infiltration and water storage capacity and high bulk density (FAO, 1965). These conditions contrast with the climatic conditions that favor vegetation development, i.e., annual average temperature of 26°C, annual average rainfall of 2,300 mm, a dry season with an average monthly rainfall of less than 100 mm from December to March, and a rainy season with an average monthly rainfall of more than 100 mm from April to November (Decaëns et al., 2003). The current livestock management system is being changed from extensive to intensive livestock farming through a process of sustainable intensification to reduce the impact on the environment. According to Pérez-Lopez et al. (2019), this region is dominated by cattle breeding with birth rates below 55%, mortality in young cattle of 10 %, weaning weight less than 160 kg, and age at first calving greater than 40 months. The cattle feed source is native and introduced grasses, mainly of the Urochloa genus; about 70% of the grazing areas have yield less than 700 kg ha-1 of dry matter (DM) with a high neutral detergent fiber (NDF) content of more than 65%, protein concentration of less than 7%, low digestibility (less than 60%), and mineral imbalance, factors that affect the voluntary consumption of cattle and limit production quality.
Unplanned changes in management and limited knowledge of landscape functioning of water, carbon, and nutrient cycling and biodiversity have repercussions on ecosystem services (ES). Evaluation of the ES is required to ensure the viability of productive systems of the region and thus contribute to the creation of sustainable development opportunities in what is considered the last Colombian agricultural frontier (Rodriguez et al., 2009). The complexity of the interaction between the ecosystem and the productive systems is a challenge for sustainable development.
The objective of this study was to investigate the impact of current and proposed management strategies such as the improvement of degraded grasslands, crop–pasture rotation, and tree establishment on indicators of ES provided by the soil such as fertility, climate control (greenhouse gases (GHGs) and carbon storage), biodiversity (edaphic macrofauna), and water function.
2 Materials and methods
2.1 Location characteristics
The high plain subregion of Colombia is between 100 and 300 m above sea level. Precipitation ranges between 1,500 and 2,500 mm/year, distributed between April and November, with an average temperature of 27°C and maximum and minimum values of 36 °C and 21°C, respectively (Amézquita et al., 2013; Rivera et al., 2013).
The soils in this area are classified by the US Soil Taxonomy as oxisols and are relatively well-drained, with very low fertility and high aluminum saturation. The soil pH ranges from 4.0 to 4.5, with very low organic matter concentration (1.5%–2.0%), phosphorus (range of 1–2 mg kg-1 Bray II), and exchangeable bases (Ca, Mg, and K), the latter being usually less than 0.1 cmolc kg-1 and exchangeable aluminum saturations between 60% and 90% (Pérez-Lopez et al., 2019). From the physical point of view, the soils are naturally dense, with the bulk density ranging from 1.4 to 1.65 g cm-3. The texture ranges from clay loam to sandy textures; they are fragile to mechanization processes, with high susceptibility to compaction, erosion, and surface sealing, and have low infiltration and water storage capacity (Pérez-Lopez et al., 2019).
The study was conducted between 2012 and 2014 at AGROSAVIA’s Carimagua Research Center of the Colombian Agricultural Research Corporation in the municipality of Puerto Gaitán (4° 19′01″N; 72° 04′59″W) in the Meta (Colombia). A 70-ha plot with Urochloa humidicola was selected with indicators of moderate degradation, such as low forage yield of less than 700 kg DM ha-1year-1, soil compaction, and the presence of termite mounds. A general review of the plot showed the need for pasture renovation and infrastructure adaptation to ensure enhanced management for breeding cattle production. The management strategies evaluated are given as follows:
2.2 Management strategies
2.2.1 Till–fert
Renovation of the U. humidicola pastures. Soil cultivation consisted of a harrow pass or a chisel pass. Fertilization and amendments consisted of dolomitic lime (26% Ca and 10% Mg) at a rate of 500 kg ha−1, phosphate rock (10% P and 25% Ca) at a rate of 250 kg ha−1, Paz del Río® Thomas phosphate fertilizer (4% P, 34% Ca, and 1% Mg) at a rate of 250 kg ha−1, and agricultural gypsum (19% Ca and 16% S) at a rate of 150 kg ha−1. Maintenance fertilization varied with the condition of the pasture, with frequencies of 1–2 years for the application of a mixture of urea at a rate of 46 and 69 kg N ha−1, potassium chloride (KCl) at a rate between 15 and 30 kg K2O ha−1, DAP (18% N and 20% P) at a rate between 50 and 100 kg ha−1, and Sulcamag (double sulfate of calcium and magnesium, enriched with phosphorus, 18% Ca, 9.6% Mg, and 9% S) at a rate of 50 kg ha−1 (Figure 1; Supplementary Material).

FIGURE 1. Projection of chemical variables in the correlation circle through principal component analysis at two depths (1: 0–10 cm; 2: 10–20 cm). Each vector represents a variable at depths 1 and 2. Years 2012 (A), 2013 (B), and 2014 (C).
2.2.2 Pasture–crops
Rotation of annual crops (maize, sorghum, and soybean) and grasses (Urochloa brizantha cv. Toledo + U. humidicola) was applied for silage production and renewal of degraded U. humidicola grasslands. Soil tillage consisted of two harrow passes and one rigid chisel pass. A mixture of dolomitic lime (26% Ca and 10% Mg) at a rate of 1,500 kg ha−1, Paz del Rio® Thomas phosphate fertilizer (4% P, 34% Ca, and 1% Mg) at a rate of 500 kg ha−1, phosphate rock (10% P and 25% Ca) at a rate of 500 kg ha−1, and agricultural gypsum (19% Ca and 16% S) at a rate of 300 kg ha−1 was applied 40–50 days before planting. Two maize hybrids were used: Pioneer 30F35H and P3862. Fertilization was divided into three periods: at planting, 200 kg ha−1 of diammonium phosphate (DAP) (N: P2O5 18: 46) at a rate of 20 kg ha−1 of a source of minor elements B, Zn, Cu, and S (Borozinco®), 100 kg ha−1 of a source of Ca and Mg (Sulcamag), and 45 kg K2O ha−1 as KCl were applied. At 15 days after sowing (DAS), 46 kg N ha−1 as urea and 45 kg K2O ha−1 as KCl were applied. At 30 DAS, 23 kg N ha−1 as urea was applied. For sorghum crop Corpoica variety JJT18, at planting time, the same doses and inputs were applied as for corn, except for KCl, the dose of which was 50 kg ha−1; at 15 DAS, 46 kg N ha−1 as urea and 50 kg ha−1 of KCl were applied. At 30 DAS, 46 kg N ha−1 as urea was applied. In the soybean crop varieties Panorama 29, Corpoica Taluma 5, and Sabana 7, fertilization consisted of application of a mixture of 75 kg ha−1 of Sulcamag, 200 kg ha−1 of triple superphosphate, 60 kg K2O ha−1 as KCl, and 20 kg ha−1 of Borozinco® at sowing and at 15 DAS, 23 kg N ha−1 as urea and 30 kg K2O ha−1 as KCl (Figure 2; Supplementary Material).
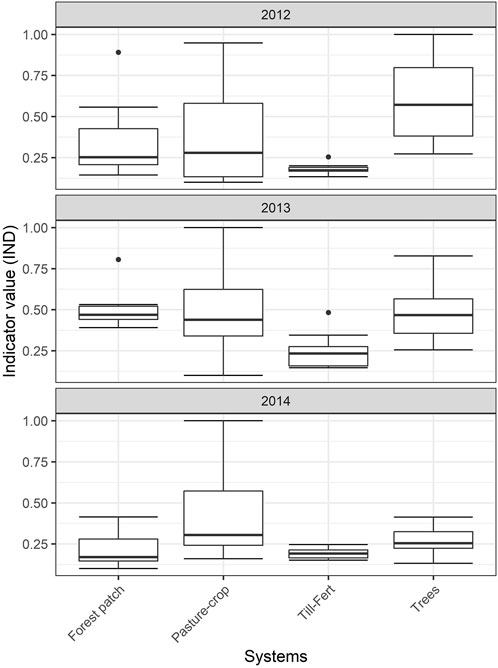
FIGURE 2. Fertility indicator obtained with different grassland management strategies in a cattle breeding system established in an oxisol of the Eastern Colombian highland plains. Years 2012, 2013, and 2014.
Harvesting of the maize–soybean or sorghum–soybean crops was carried out simultaneously at 75 DAS with a furrow harvester. A silo press machine was used to preserve the ensiled material in plastic bags to be used for livestock feed in the dry season. Grazing for cattle was resumed 1–2 months after forage crop harvest, depending on the recovery or pasture development.
2.2.3 Trees
Trees were planted in strips (13 m × 600 m each), with species such as Piptadenia opacifolia (yopo), Acacia mangium, and Cassia grandis (Figure 3; Supplementary Material). The seedlings were planted in alternating blocks of 12 trees per species in a staggered arrangement at 7 m between plants and 5 m between rows. Prior to planting, a harrow pass was made, and a mixture of dolomitic lime (26% Ca and 10% Mg) at a rate of 1,000 kg ha−1, phosphate rock (10% P and 25% Ca) at a rate of 250 kg ha−1, Paz del Rio® Thomas phosphate fertilizer (4% P, 34% Ca, and 1% Mg) at a rate of 250 kg ha−1, and agricultural gypsum (19% Ca and 16% S) at a rate of 250 kg ha−1 was applied, followed by a chisel pass and a polishing rake pass for amendment. The planting was done with seedlings with a height of 30–45 cm at the definitive site.
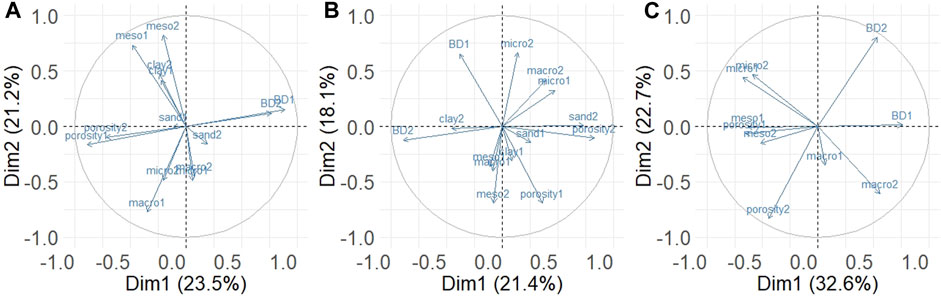
FIGURE 3. Projection of physical variables in the correlation circle through principal component analysis at two depths (1: 0–10 cm; 2: 10–20 cm). Each vector represents a variable at depths 1 and 2. Years 2012 (A), 2013 (B), and 2014 (C).
2.2.4 Forest patch
Areas of protected and conserved forest relicts through natural regeneration were monitored on the periphery of pastures. They were selected due to their contribution in terms of biodiversity, shade, habitat, and biological corridors for endemic species, among other ES (Figure 4; Supplementary Material).
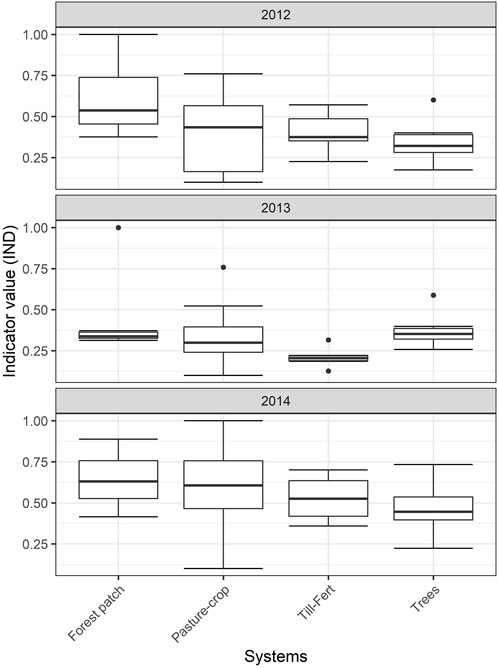
FIGURE 4. Water function indicator obtained with different grassland management strategies in a cattle breeding system established in an oxisol of the Eastern Colombian highland plains. Years 2012, 2013, and 2014.
2.3 Sampling
2.3.1 Soil chemical variables
During the study period, for each management strategy, four disturbed composite soil samples were taken annually at two depths: 0–10 cm and 10–20 cm for quantification of exchangeable bases (Ca, Mg, and K) and exchangeable Al and protons (H), phosphorus (P), sulfur (S), copper (Co), molybdenum (Mo), manganese (Mn), iron (Fe), and boron (B), organic matter, cation exchange capacity, and pH following the methodologies described in Table 1.
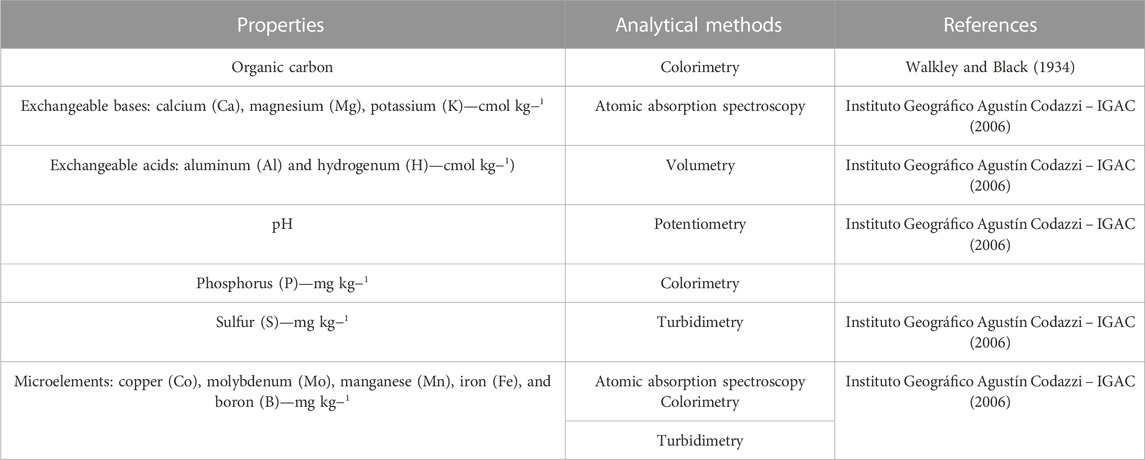
TABLE 1. Analytical methods used for the determination of soil chemical properties.
2.3.2 Soil physical variables
Soil sampling for physical analysis was performed every year, where four undisturbed soil samples were taken in metal cylinders of fixed volume (100–300 cm3) at two depths (0–10 cm and 10–20 cm). Soil samples were analyzed for texture, bulk density, particle density, total porosity, pore size distribution, volumetric moisture, and retention curves at two points (0.1 and 1.5 bar) following the methodologies cited in Table 2.
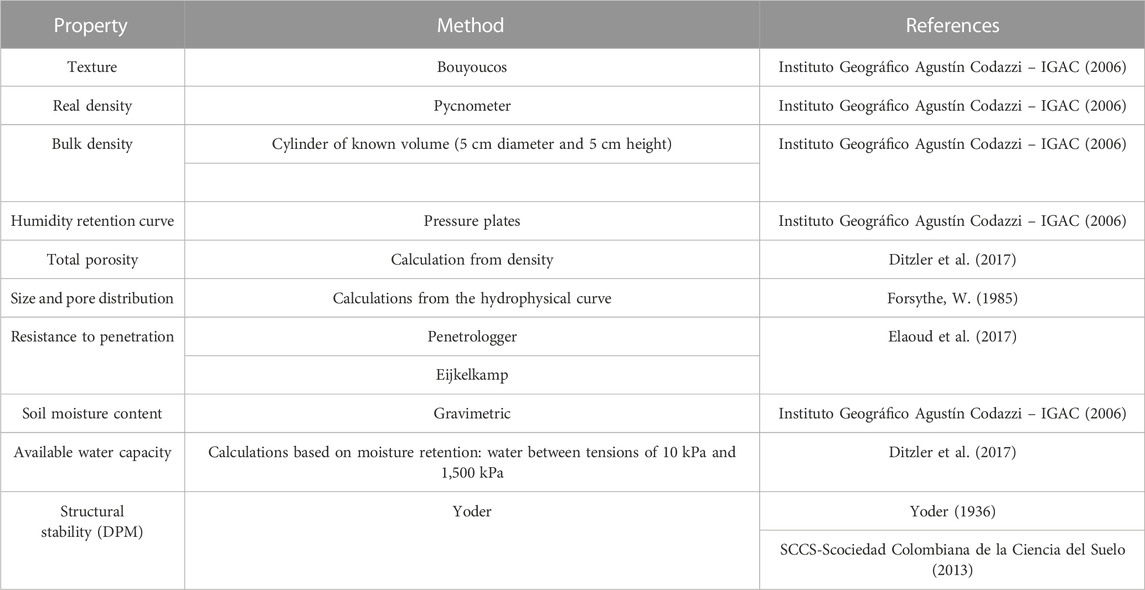
TABLE 2. Analytical methods used for the determination of soil physical properties.
2.3.3 Soil macrofauna
Edaphic macroinvertebrates were determined annually using the Tropical Soil Biology and Fertility (TSBF) method (Anderson and Ingram, 1993). A soil section of 25 × 25 × 20 cm was extracted at each depth (0–10 and 10–20 cm). Organisms were separated manually and preserved in 70% alcohol. In the case of earthworms, they were preserved in 4% formaldehyde.
Counting and identification to the order level were made by observation using a stereomicroscope in the soil biology laboratory at the International Center for Tropical Agriculture (CIAT) to determine richness, abundance, Simpson’s diversity index, and the dominance index:
where ni is the proportion of the number of individuals of species i with respect to the total number of individuals (N).
2.4 GHG fluxes and soil carbon (C) storage
A closed-chamber technique (CCT) was used to determine the net GHG fluxes: methane (CH4), nitrous oxide (N2O), and carbon dioxide (CO2). Sampling was performed monthly and always in the morning hours in each system during 2013 and 2014 for a total of 18 samplings. Three rings were inserted into the soil in each plot and remained throughout the study period. At the time of sampling, the chamber lid was placed, and 20 mL air sample was taken at 0, 20, and 40 min after placing the lid. A 15-mL sample was dispensed in vacuum tubes and sent to the greenhouse gas laboratory at CIAT. Concentrations of CO2, N2O, and CH4 taken in 2013 were determined in a Shimadzu GC-14A gas chromatograph, equipped with a flame ionization detector for methane analysis and an electron capture detector for nitrous oxide analysis. For the determination of CO2 concentrations, a Qubit Systems S151 gas analyzer with infrared detection (IRGA) was used. In 2014, a Shimadzu GC-2014 was used that read all three gases simultaneously.
The fluxes were calculated following the GRACEnet methodology (Parkin and Venterea, 2010). Concentration in ppm (v/v) was transformed into mass units according to the ideal gas equation. Once the mass was calculated, the flux was estimated using the HMR function (Pedersen et al., 2010; Pedersen A. R., 2015) by the R 3.2.1 software (R Core Team, 2015). If the concentrations vs. time relationship generated a nonlinear trend, the Hutchinson and Mosier (1981) equation was used. When the trend was linear, the linear regression equation was used. Flows outside the range reported in the literature were discarded from the analysis. The area under the curve was interpolated to estimate the cumulative emission per period. Cumulative emissions of the three gases were converted to CO2-equivalent values (t ha −1 period −1) using global warming potential values of 25 and 298 for methane and nitrous oxide, respectively.
2.5 Total soil organic carbon (SOC)
SOC was determined from soil chemical and physical sampling, i.e., C concentration (%) and bulk density. Sampling was performed at two depths: 0–10 and 10–20 cm. The C content was determined by applying the following equation:
where ρ = soil bulk density (kg m-3), fC = carbon concentration (kg C kg soil−1) by Walkley & Black, (1934), and Pm = sampling depth (m).
2.6 Forage production and nutritional content
During the dry season (December–March) and rainy season (April–November), the following parameters were evaluated in the pastures.
• Forage yield was quantified by placing a frame (0.5 m × 0.5 m) in 10–20 sites according to the pasture management condition, and the grass was cut with a sickle or scissors. Subsequently, the green weight of the forage was determined using an electronic scale. Forage moisture was quantified after drying at 70°C for 3 days in a forage drying oven and used to calculate forage dry matter content.
• Ground cover (%) was determined by placing a 0.25-m2 frame, as for forage yield.
• Forage nutritional quality: plucked samples of forage were taken from the pastures and analyzed for total nitrogen content (AOAC., 1984), neutral detergent fiber (Van Soest., 1967), acid detergent fiber (Van Soest et al., 1991), and in vitro or in vivo dry matter digestibility (Tilley and Terry., 1963) at AGROSAVIA‘s Animal Nutrition Laboratory.
2.7 Statistical analysis
Soil chemical and physical variables were analyzed considering a completely randomized design. The fixed factors were the systems (management strategies), time, and depth, and the random factors were associated with the replicates. For the analysis of the data, an analysis of variance model with repeated measures over time was used when the temporal autocorrelation was significant; in this case, different covariance matrices were evaluated using Proc GLIMMIX of SAS version 9.4 (SAS, 2016). Normality and homoscedasticity assumptions were evaluated based on Q–Q plots and model residual vs. predicted plots.
For the construction of indicators associated with the soil’s physical (water regulation), chemical (soil fertility), and biological (biodiversity) variables, a principal component analysis (PCA) was performed using the ADE4 1.4.5 library (Dray and Dufour, 2007) from R software (R Core Team, 2019). Calculations were carried out following the methodology proposed by Velásquez, Lavelle, and Andrade (2007).
An initial PCA allows for identification of the variables that best discriminate among the different management strategies. Variables with significant contribution (>50% of the maximum value) to either of the first two principal component axes were selected, and their contribution to PCA axes 1 and 2 was multiplied by the overall variability explained by each PCA axis to generate a weight factor for each variable. Values for each variable were then multiplied by their corresponding weight factor and summed to generate a raw sub-indicator value using the following formula:
Ii1 = value of the ecosystem service indicator at plot 1.F1 = % of the value of the variance explained by axis 1 of the PCA of the indicator data group Ii.αI, βI, and γI = respective contributions of variables a, b, and c to factor I.a, b, and c = values of the variables measured at plot 1.
Finally, the indicators were rescaled between 0.1 and 1 to compare ES such as soil fertility, water functions, and biodiversity (soil macrofauna) associated with management strategies. For the climate regulation indicator, the CO2-equivalent (t ha −1 period −1) was estimated from GHG fluxes (Rodríguez et al., 2013; Lavelle et al., 2014) and rescaled between 0.1 and 1 for comparison, and stock SOC values were rescaled between 0.1 and 1.
The analysis of variance of the indicators was performed considering a complete randomized design where the fixed factors were the management strategies and time (years) and the interaction strategies x time. The random factor was associated to the replicate.
3 Results
3.1 Soil fertility
Soil Ca, Mg, and P concentrations were affected by management, time (year), and sampling depth. The highest Ca, Mg, and P concentrations were found at 0–10 cm depth, where systems received corrective applications between 1 and 1.5 t ha−1 of dolomite lime and fertilizers. The concentrations of Ca, Mg, and P ranged from 1.02 to 1.97 cmolc kg−1, 0.24 to 0.48 cmolc kg−1, and 6.1 to 10.9 mg P kg−1 in the pasture–crop system during the time of study. The concentration of Ca, Mg, and P ranged from 1.05 to 2.56 cmolc kg−1, 0.23 to 0.59 cmolc kg−1, and 1.8 to 7 mg P kg−1, respectively, in the tree management system. The concentration of Ca, Mg, and P ranged from 0.46 to 1.8 cmolc kg−1, 0.14 to 0.37 cmolc kg−1, and 2.1 to 2.6 mg P kg−1, respectively, in the till fertilizer system, and the values of Ca, Mg, and P ranged from 0.68 to 0.88 cmolc kg−1, 0.39 to 0.59 cmolc kg−1, and 1.1 to 1.6 mg P kg−1, respectively, in the forest patch management system. According to the PCA, the behavior of soil chemical properties is explained by a total (components 1 and 2) of 56.2%, 50.4%, and 46% for the years 2012, 2013, and 2014, respectively. Trees and pasture–crop rotation management had the highest values of nutrient concentrations.
In general, during the 3 years of evaluation, there was a separation of pH and Al in the two depths sampled and a positive relationship of some elements such as P, Ca, and Mg in the systems with the addition of chemical fertilizers (Figure 1).
For the soil fertility indicator, there were significant differences regarding the time (year) x system effect. In 2012, the pasture–crop rotation system that included fertilizer additions and amendments had the highest indicator values compared to the other management systems (Figure 2). In 2013, the pasture–crop system still had the highest indicator values. The areas with the lowest values corresponded to plots that had lower rates of fertilization such as pasture areas managed only with tillage and fertilization (till–fert). In 2014, the trend was the same as in the previous year; the plots with the highest values corresponded to those that received amendments and fertilizers (pasture–crop and trees).
3.2 Water function
Total porosity was more strongly correlated with mesoporosity and inversely related to microporosity (Figure 3) in all years; however, the strength was not the same across years. Although texture is related to porosity, the contribution to principal components is minimal (Figure 3). Mesoporosity had variations originated by management systems and soil use change in the years of evaluation; its values ranged from 4.98% to 15.6%; the highest values were found for the first year, mainly due to the action of tillage in soil management involving pastures and annual crops (pasture–crop).
The water function indicator was possibly (alpha<0.1) affected by the management system. The highest values were observed in the pasture–crop and forest patch management systems, which had values above 0.5 for the years 2012 and 2014. In 2013, this indicator decreased in all systems; however, the forest patch and pasture–crop systems still had the highest values (Figure 4).
3.3 Soil macroinvertebrates
In 2012, the Blattodea order, which is composed primarily by termites, had the highest density (individuals m-2) at a depth of 0–10 cm, representing 35% (4,613 individuals m-2) of the population, followed by earthworms with 28% (3,632 individuals m-2). At the depth of 10–20 cm, this trend was similar, where termites were also the dominant organisms; however, the population decreased with depth, corresponding to 15% with 2032 individuals m-2, followed by ants (Hymenoptera) and beetles (Coleoptera).
According to the PCA, the first two components of soil macrofauna variables explained 55.1, 56.0, and 54.6% of the variability for the years 2012, 2013, and 2014, respectively (Figure 5). In 2013, a high correlation between termites and total macrofauna abundance (individuals m-2) was observed with Blattodea being the order with the highest density, with 17,984 individuals m2, representing 72% of the total abundance. For 2014, even though there was a decrease in density, termites were the taxonomic unit with the highest correlation with total abundance and 9,139 individuals m-2 representing 69% of the population.
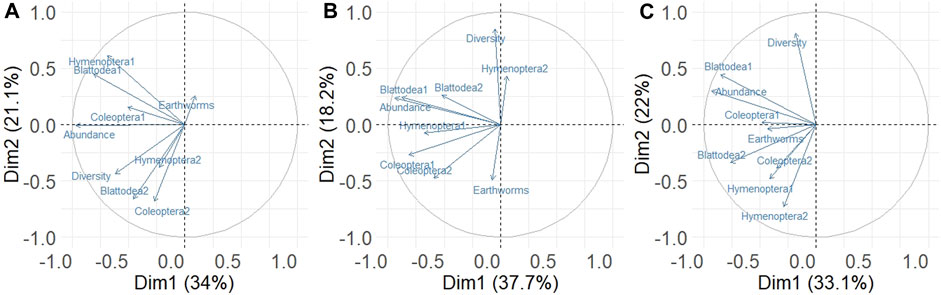
FIGURE 5. Projection of soil macrofauna variables in the correlation circle through principal component analysis at two depths (1: 0–10 cm; 2: 10–20 cm). Each vector represents a variable at depths 1 and 2. Years 2012 (A), 2013 (B), and 2014 (C).
In 2012, the till–fert system tended to differentiate from the other management systems with an average value corresponding to 0.32 (Figure 6). In 2013, the forest patch system had a higher value than others, with an indicator value of 0.6. For 2014, no significant differences were found among systems.
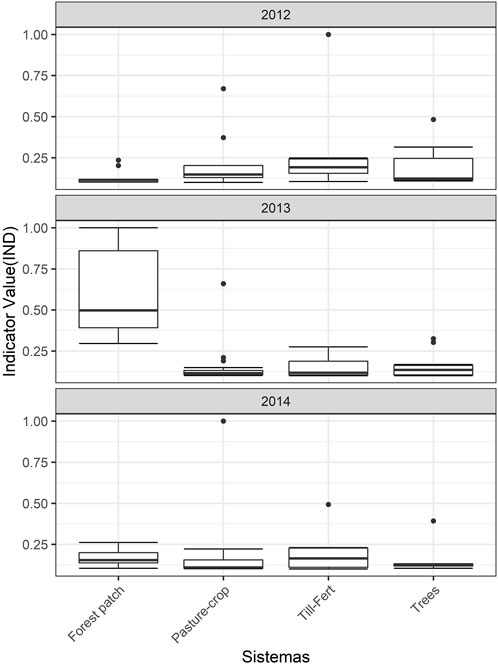
FIGURE 6. Biodiversity indicator, edaphic macrofauna, obtained with different grassland management strategies in a cattle breeding system established in an oxisol of the Eastern Colombian highland plains. Years 2012, 2013, and 2014.
3.4 Climate control
3.4.1 GHGs and soil organic carbon content
There was a significant interaction system x year. For 2013, the forest patch had significantly lower fluxes (7.9 t CO2-eq ha−1 yr−1) than the other management systems. For 2014, the cumulative emissions were similar among management strategies, with values below 10 t CO2-eq ha−1 yr−1 (Figure 7).
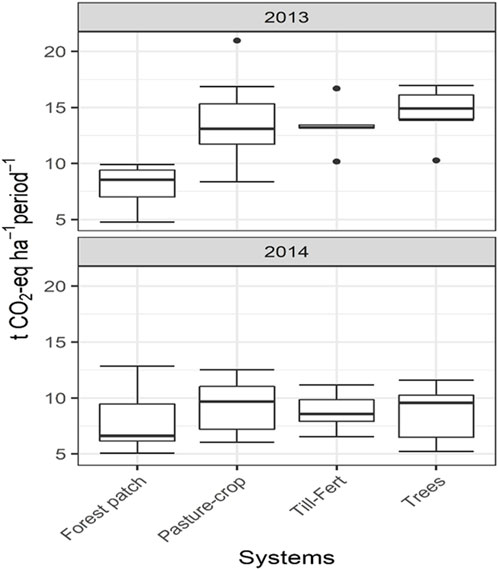
FIGURE 7. GHG emissions (CO2-eq ha−1) quantified in different grassland management strategies in a cattle breeding system established in an oxisol of the Eastern Colombian highland plains. Years 2013 and 2014.
The soil organic carbon content at 10 cm depth was 13% higher in year 2013 than in 2012 and 12% higher in year 2014 than in 2012, with mean values of 31 g C kg−1 and 26.9 g C kg−1, respectively.
3.5 Forage production from grasslands and annual crops
The goal of the systems was to improve zootechnical indicators of the cattle breeding system with financial sustainability and animal welfare. Degraded U. humidicola pastures, without intervention during the rainy season (April–November), had a forage yield of 435–839 kg DM ha−1 and yields ranging from 389 to 671 kg DM ha−1 during the dry season. The renovation of U. humidicola by means of the crop–grassland strategy increased forage yield from 1,324 to 1929 kg DM ha−1 in the rainy season and from 869 to 1,152 kg DM ha−1 in the dry season. When pasture recovery was carried out conventionally with soil tillage and fertilization, yields ranged from 1,232 to 1893 kg DM ha−1 in the rainy season and from 749 to 904 kg DM ha−1 in the dry season (Table 3). The forage quality of the U. humidicola pastures showed crude protein (CP) between 3.1% and 6.6% and forage degradability between 51.6% and 63.6% in the dry season. In the rainy season, CP ranged between 5.3% and 11%, and degradability between 60.7% and 77.5%. Regarding corn forage quality, it was found that the CP contents varied between 7.0% and 8.5%, with degradability between 58.5% and 62.1%.
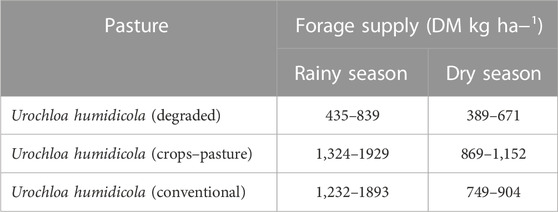
TABLE 3. Forage supply (DM kg ha−1) from U. humidicola pasture in rainy and dry seasons at the Carimagua Research Center.
Forage production from annual crops also showed outstanding results. Maize reached green forage yields of 35.1 and 25 t ha−1, with the differences due to the genotypes used. Forage sorghum Corpoica JJT18 had yields that varied between 39.6 and 50 t ha−1. Sorghum also has the possibility of generating a second crop by regrowth, which can represent 36%–45% of additional forage to conserve. Regarding soybean forage production, the Corpoica Taluma 5 variety reached yields between 18.5 and 26.5 t ha−1, the Panorama 29 variety, between 17.1 and 26.4 t ha−1, and the Corpoica Sabana 7 variety, 27.7 t ha−1. Corpoica JJT18 sorghum provided CP values of 6.0–7.6% and degradability between 58.1% and 69.7%. For soybean varieties, CP values ranged from 12% to 24% and degradability from 56.7% to 71.1% (Table 4).
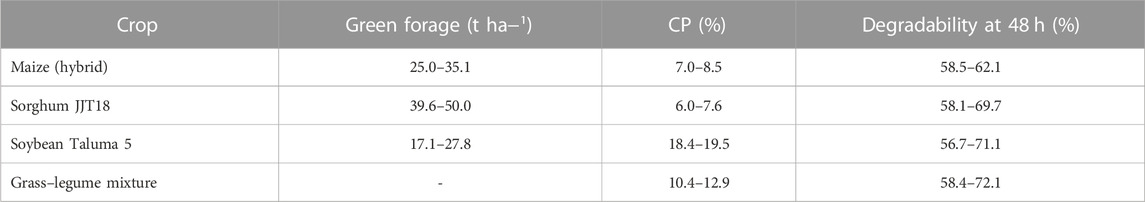
TABLE 4. Production (t ha−1) and nutritional content (%) of green forage of maize, sorghum, and soybean crops in the Carimagua Research Center.
The management and environmental conditions prevailing during the study favored the growth and development of forest species. Diameter at breast height (DBH) recorded in 2015 showed that the highest values were reached by Acacia mangium with 58 cm, followed by Piptadenia opacifolia with 45 cm, and finally, Cassia grandis with 25 cm. With the differential development of the species, ground shade projection related to the growth and architecture of the canopy that generates the microclimate for animal comfort was similar for the first two species and less for the last one. Species growth also plays an important role in C fixation in the wood biomass accumulated, soil and water conservation, biodiversity, and the beauty of the rural landscape.
4 Discussion
The management strategies that were tested in this research were aimed at improving animal productivity through a greater forage supply quality, especially during critical periods. Direct actions into the soil were carried out to improve nutrient supply conditions and soil water storage. Those actions included amendment applications for improving K+, Ca2+, and Mg2+ availability and the use of tillage implements for improving soil porosity.
Soil nutrient availability was improved in the management strategies till–fert, pasture–crop, and trees by application of fertilizers and amendments. Soil chemical properties (Ca2+, Mg2+, P, pH, and Al3+ concentrations) were the main soil fertility indicators. Dolomite lime affects mainly pH and Ca 2+. Positive pH and calcium relationships, shown in the correlation circles, are associated with the application and incorporation of a mixture of dolomitic lime, Paz del Río® fertilizer, phosphate rock, and agricultural gypsum, as well as that of phosphorus by the application of triple superphosphate and DAP. According to Amézquita et al. (2004), the main soil limitation for crop production in highland plains is the high acidity and low nutrient availability; therefore, it is essential to improve soil fertility by improving nutrient availability and reducing Al toxicity to increase productivity.
Soil bulk density, macroporosity, and mesoporosity were the main variables associated to the soil water indicator. Tillage practices used in the management strategies mainly impacted macropore and mesopore ratios. Increasing mesoporosity is the key for improving soil water and nutrient availability for established pastures. By improving soil organic matter through practices such as liming, pasture nutrition, and the use of soil decompaction equipment, root system quantity and quality of established grasses would be increased, thus exerting a positive effect on soil structure, density, and porosity, which in turn contribute to the hydrophysical dynamics that benefit crop development (Torres-Guerrero et al., 2013).
An improvement in chemical and physical conditions was observed in less than 2 years; however, in the medium term (3 years), an increase in soil bulk density was observed, which returned to the initial condition of native savanna, validating the theory of soil resilience (Amezquita et al., 2013). This condition highlighted the importance of including practices such as incorporation of organic matter and deep tillage to maintain better soil conditions for production systems. Amezquita et al. (2013) state that the main challenge facing agricultural soils from the highland plains (Typic Haplustox) is their susceptibility to degradation. Degradation is understood as the loss of some physical, chemical, and biological qualities due to negative human intervention, which will affect agricultural sustainability. In livestock systems, soil compaction is the main physical cause that restricts plant root growth and development.
The improvement of edaphic macrofauna population was observed in forest relict areas (forest patch). It was noted that the greatest variability explained by PCA was related to organisms found at 0–10 cm depth. This may have been influenced by the vegetation cover present in the evaluated systems, which contributed with biomass supply as a food source for organisms and for regulating soil temperature and decreasing light intensity, generating a stable microhabitat for the development, and functioning of soil epigeal and endogean macroinvertebrate communities. Soil-dwelling biological communities are among the most diverse, comprising a wide range of life forms and functions, and are involved in many ecological processes and provide key ES (Decaëns, 2010). Macrofaunal dynamics can be used as a biological indicator sensitive to impacts on land use, soil management, and soil quality (Rousseau, et al., 2013). These organisms, together with earthworms, are dominant in the edaphic macrofauna of tropical savannas, such as Brazilian Cerrado and the Eastern Plains of Colombia, where they influence soil physical characteristics and soil chemical activity (Decaëns et al., 2003). Biodiversity patterns can be affected not only by the soil physical conditions but also by biotic interactions that are established between species. Therefore, the magnitude and specificity of mechanisms that control a given group of organisms may be different from those of another group (Decaëns, 2010). According to Masters (2004), changes in soil temperature and moisture conditions as a consequence of a lower amount of organic residues affect certain taxonomic entities, such as Oligochaeta or earthworms, which normally require permanent moisture for survival.
The GHG emissions expressed as accumulated CO2-equivalent of each gas showed how the system that has no anthropic intervention (forest patch) registered the lowest emissions and, therefore, was associated with the lowest indicator (Figure 8). Systems where tillage and fertilizer were applied showed higher values (pasture–crop, till–fert, and trees). Year-by-year variation in the accumulated CO2-equivalent may also be associated with the prevailing climatic conditions; thus, lower values in 2014 may be due to the dry condition in that year for Eastern Colombian highland plains (Vargas-Pineda et al., 2017). Soil moisture is the most important parameter associated with soil GHG dynamics because it controls microbial activity and all related processes.
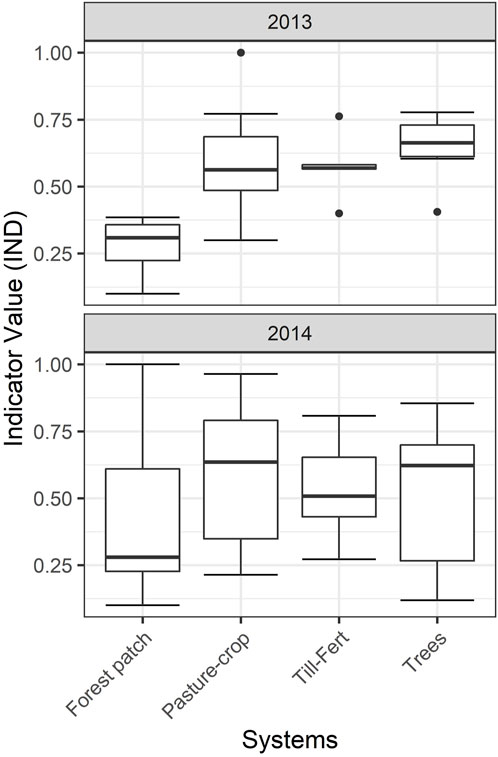
FIGURE 8. Climate regulation indicator (GHGs) obtained with different grassland management strategies in a cattle breeding system established in an oxisol of the Eastern Colombian highland plains. Years 2013 and 2014.
Soil organic carbon indicator tended to increase in the forest patch and tree management systems, while it was reduced in the pasture–crop system (Figure 9). According to Post and Kwon (2000), there are factors that influence soil carbon storage, which depends on the quality and quantity of inputs and the decomposition rate of the organic matter. Management practices that improve soil physical, chemical, and biological characteristics have positive impacts on the accumulation of above- and below-ground organic carbon.
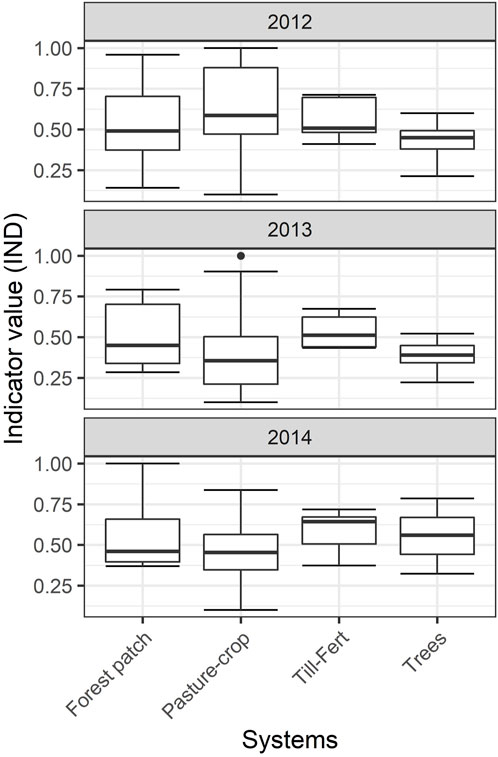
FIGURE 9. Climate regulation indicator (carbon storage) obtained with different grassland management strategies in a cattle ranching system established in an oxisol of the Eastern Colombian highland plains.
Although it is necessary to implement practical actions in livestock systems to reduce the impacts of climate change, these should not be in contradiction with the objectives of ending poverty and reducing the hunger rate to 0 by 2030, considering that livestock production provides benefits for human nutrition, health, and welfare. The livestock system is part of the AFOLU sector, which is considered one of the largest emitters, contributing up to 15%, and of the AFOLU sector, 10% is considered as the direct responsibility of the bovine system (FAO, 2019).
The consolidated analysis of the indicators shows how forest relict areas (forest patch) had an expected trend regarding the best performance for the biodiversity of edaphic macrofauna and improved soil physical conditions for better water storage capacity and lower GHG emissions. For fertility indicator and carbon storage, forest patch had an intermediate performance compared to other systems. As expected, the highest emissions were recorded for the pastures and annual crop systems which were intervened with fertilization and/or mechanization (Figure 10).
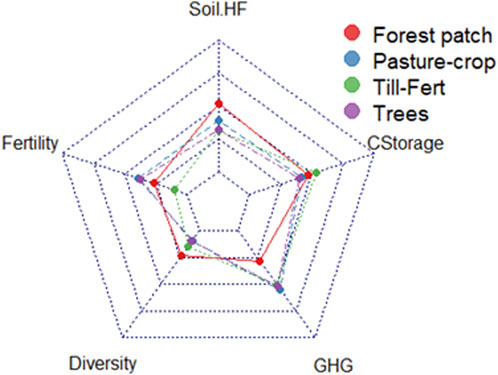
FIGURE 10. Comparison of the indicators obtained for each of the grassland management strategies in the cattle raising system established in an oxisol of the Eastern Colombian highland plains. Fertility, water function (soil HF), biodiversity of edaphic macrofauna (diversity), climate regulation—greenhouse gases (GHGs), and climate regulation—carbon storage (CStorage).
This study showed that systems under an agroforestry scheme, which in this case translates into a system of recovered pastures, annual crops–pastures (agropastoral), tree strips, and forest-patch areas, can contribute to the maintenance of soil ES, although each one of them provides improvement in at least one soil ecosystem service.
The work developed in soil and climate conditions of the Colombian highlands contributes with evidence that shows that cattle farms can improve their eco-efficiency indicators and, in particular, contribute to carbon sequestration through the implementation of agroforestry systems; remaining forests, areas of secondary vegetation in regeneration, wooded pastures, and other land uses dedicated to agricultural work can act as atmospheric carbon sinks (Post and Kwon, 2000; Ruiz, 2002; Fisher et al., 2004).
5 Conclusion
It is urgent to improve the sustainability of livestock production systems by adopting measures at both local and regional scales, not only for mitigating GHG levels in the atmosphere but also to conserve other ES that are part of the soil dynamics. In this sense, the scheme proposed, which included improving pastures through management, tree incorporation, and preserving forest-patch areas, can be applied in the farms of small and medium producers in the Eastern Colombian highland plains.
Improving management practices in pasture systems and introducing tree cover can enhance zootechnical and environmental indicators due to their positive effect on forage quality and quantity and the potential reduction of carbon footprint.
The sustainable intensification of livestock systems will allow releasing areas not suitable for agricultural production and the use of secondary forests in natural regeneration processes, considering establishment of forest plantations at the farm level.
There are still challenges in agricultural research to evaluate the long-term effect of management strategies on soil properties, water use efficiency, crops, and animal productivity in the high plains of Colombia aimed to contribute to mitigate effects of climate change and variability.
Data availability statement
The raw data supporting the conclusion of this article will be made available by the authors, without undue reservation.
Author contributions
OP-L developed and managed the research project. NR-H, JB-R, JOA, LM-C, and MA participated in the planning of field trials and consolidation of experimental data. MA performed statistical analysis and interpretation of the data. NR-H and OP-L prepared the manuscript with important contributions from all authors. All authors contributed to the article and approved the submitted version.
Funding
This research was supported by the Ministry of Agriculture and Rural Development—AGROSAVIA -CIAT Cooperation Agreement Fund and by AGROSAVIA (formerly Corpoica) Five-Year Agenda Fund implemented between 2011 and 2017.
Acknowledgments
The authors would like to thank the Colombian Ministry of Agriculture and Rural Development for financing this research and the researchers and operators of the International Center for Tropical Agriculture (CIAT) who participated in the execution of activities and field sampling. The authors acknowledge the support of professionals and operators of the Colombian Agricultural Research Corporation AGROSAVIA for their follow-up and support in data collection. Special recognition is due to the technical and administrative staff of CI Carimagua—AGROSAVIA for their cooperation and support in the development of the work.
Conflict of interest
Authors NR-H, MA, LM-C, JA, Jb-R, and OP-L were employed by the Colombian Agricultural Research Corporation—AGROSAVIA.
Publisher’s note
All claims expressed in this article are solely those of the authors and do not necessarily represent those of their affiliated organizations, or those of the publisher, the editors, and the reviewers. Any product that may be evaluated in this article, or claim that may be made by its manufacturer, is not guaranteed or endorsed by the publisher.
Supplementary material
The Supplementary Material for this article can be found online at: https://www.frontiersin.org/articles/10.3389/fenvs.2023.1107466/full#supplementary-material
References
Amézquita, E., Thomas, R. J., Rao, I. M., Molina, D. L., and Hoyos, P. (2004). Use of deep-rooted tropical pastures to build-up an arable layer through improved soil properties of an Oxisol in the Eastern Plains (Llanos Orientales) of Colombia. Agric. Ecosyst. Environ. 103 (2), 269–277. doi:10.1016/j.agee.2003.12.017
Amézquita, E., Rao, I. M., Rivera, M., Corrales, I. I., and Bernal, J. H. (2013). Sistemas agropastoriles: Un enfoque integrado para el manejo sostenible de Oxisoles de los llanos orientales de Colombia. Centro internacional de Agricultura tropical (CIAT). Cundinamarca, Colombia: Ministerio de Agricultura y Desarrollo Rural (MADR); Corporación Colombiana de Investigación Agropecuaria (Corpoica) hoy AGROSAVIA, 288.
Anderson, J. M., and Ingram, J. S. I. (1993). Tropical soil biology and fertility programe. A handbook of methods. http://courses.washington.edu/esrm304a/lectures/Soils/Tropical%20Soil%20Biology%20and%20Fertility%20Methods_Web%20Soils%20Reading.pdf.
AOAC (ASSOCIATION OF O FFICIAL AGRICULTURAL CHEMISTS) (1984). Official methods of analysis. Kjeldahl method (2.062). Washington D.C., USA: AOAC.
Armenteras, D., Espelta, J. M., Rodríguez, N., and Retana, J. (2017). Deforestation dynamics and drivers in different forest types in Latin America: Three decades of studies (1980–2010). Glob. Environ. Change 46, 139–147. doi:10.1016/j.gloenvcha.2017.09.002
Cdp reports, (2018). Challenges in reducing livestock farming-related deforestation in Colombia – recommendations for Colombia’s new government and the 2018 – 2022 National Development Plan. https://6fefcbb86e61af1b2fc4-c70d8ead6ced550b4d987d7c03fcdd1d.ssl.cf3.rackcdn.com/cms/policy_briefings/documents/000/004/172/original/Policy_Brief_Colombia_Nov18_EN.pdf?1605770352.
Clerici, N., Armenteras, D., Kareiva, P., Botero, R., Ramírez-Delgado, J. P., Forero-Medina, G., et al. (2020). Deforestation in Colombian protected areas increased during post-conflict periods. Sci. Rep. 10, 4971. doi:10.1038/s41598-020-61861-y
Correa, H. (2006), Plan de acción en biodiversidad de la cuenca del Orinoco –Colombia/2005 - 2015 – propuesta Técnica. Bogotá D.C Editors D. Ruiz, and S. L. Y. Arévalo (Bogotá, Colombia: Corporinoquia, Cormacarena, IAvH, Unitrópico, Fundación Omacha, Fundación Horizonte Verde, Universidad Javeriana, Unillanos, WWF - Colombia, GTZ – Colombia), 330
Decaëns, T., Lavelle, P., Jiménez, J. J., Escobar, G., Rippstein, G., Schneidmadl, J., et al. (2003). Impacto del Uso de la Tierra en la Macrofauna del Suelo de los Llanos Orientales de Colombia Capitulo 2 En: El Arado Natural: Las Comunidades de Macroinvertebrados del Suelo en las Sabanas Neotropicales de Colombia Editado por: Juan J. Jiménez y Richard J. Thomas. Cali-Palmira, Colombia: Publicación CIAT.
Decaëns, T. (2010). Macroecological patterns in soil communities: Soil community macroecology. Glob. Ecol. Biogeogr.) 19, 287–302. doi:10.1111/j.1466-8238.2009.00517.x
Ditzler, C., Scheffe, K., and Monger, H. C. (2017). “Soil science division staff,” in Soil survey manual (Washington, DC, USA: Government Printing Office), 603.
Dray, S., and Dufour, A.-B. (2007). The ade4 package: Implementing the duality diagram for ecologists. J. Stat. Softw. 22 (4), 1–20. doi:10.18637/jss.v022.i04
Elaoud, A., Hassen, H. B., Salah, N. B., Masmoudi, A., and Chehaibi, S. (2017). Modeling of soil penetration resistance using multiple linear regression (MLR). Arab. J. Geosci. 10, 442. doi:10.1007/s12517-017-3235-2
Etter, A., McAlpine, C., and Possingham, H. (2008). Historical patterns and drivers of landscape change in Colombia since 1500: A regionalized spatial approach. Ann. Assoc. Am. Geogr. 98 (1), 2–23. doi:10.1080/00045600701733911
Etter, A., McAlpine, C., Wilson, K., Phinn, S., and Possingham, H. (2006). Regional patterns of agricultural land use and deforestation in Colombia. Agric. Ecosyst. Environ. 114, 369–386. doi:10.1016/j.agee.2005.11.013
FAO (2019). Five practical actions towards low-carbon livestock. http://www.fao.org/3/ca7089en/ca7089en.pdf.
FAO (1965). Reconocimiento Edafológico de los Llanos Orientales Colombia. http://www.fao.org/3/ar747s/ar747s.pdf.
Fisher, M. J., Rao, I. M., and Thomas, R. J. (2004). Implications of land use change to introduced pastures on carbon stocks in the central lowlands of tropical South America. Environ. Dev. Sustain. 6, 111–131. doi:10.1023/b:envi.0000003632.82447.4d
Forsythe, W. (1985). Física de Suelos. Manual de laboratorio. Bogotá, Colombia: IICA, San José de Costa Rica, 211.
Hutchinson, G. L., and Mosier, A. R. (1981). Improved soil cover method for field measurement of nitrous oxide fluxes. Soil Sci. Soc. Am. J. 45 (2), 311–316. doi:10.2136/sssaj1981.03615995004500020017x
Instituto Geográfico Agustín Codazzi – Igac, (2006). Métodos analíticos del laboratorio de suelos 6 edición. Bogotá, Colombia.
Lavelle, P., Rodríguez, N., Arguello, O., Bernal, J., Botero, C., Chaparro, P., et al. (2014). Soil ecosystem services and land use in the rapidly changing Orinoco River Basin of Colombia. Agric. Ecosyst. Environ. 185, 106–117. doi:10.1016/j.agee.2013.12.020
Masters, G. J. (2004). “Belowground herbivores and ecosystem processes,” in Insects and ecosystem function. Editors En W. W. Weisser, and E. Siemann (Berlin, Germany: Springer), 93–112.
Nepstad, D., Bezerra, T., Tepper, D., McCann, K., Stickler, C., McGrath, D. G., et al. (2013). Addressing agricultural drivers of deforestation in Colombia: Increasing land-based production while reducing deforestation, forest degradation, greenhouse gas emissions and rural poverty. Report to the United Kingdom, foreign and commonwealth office and department of energy climate change, forests and climate change programme. Additional financial support provided by the Norwegian agency for development cooperation (norad), through the forests, farms and finance initiative. https://assets.publishing.service.gov.uk/government/uploads/system/uploads/attachment_data/file/274185/drivers_of_deforestation_in_colombia.pdf.
Paredes Vega, J. E., and Hernández Leal, G. H. (2013). “Composición de la Economía de la Región Suroriente de Colombia,” in En: Ensayos sobre Economía Regional (Bogotá, Colombia: Banco de la Republica). https://www.banrep.gov.co/docum/Lectura_finanzas/pdf/eser_51_suroriente_2013.pdf.
Parkin, T. B., and Venterea, A. (2010). “Chapter 3. Chamber-base trace gas flux measurements,” in Sampling protocols. Editor En R. F. Follet (Washington, D.C, United States: USDA-ARS. Recuperado de). https://www.ars.usda.gov/ARSUserFiles/np212/chapter%203.%20gracenet%20Trace%20Gas%20Sampling%20protocols.pdf.
Pedersen, A. R. (2015). Hmr: Flux estimation with static chamber data. http://cran.r-project.org/package=HMR.
Pedersen, A. R., Petersen, S. O., and Schelde, K. (2010). A comprehensive approach to soil-atmosphere trace-gas flux estimation with static chambers. Eur. J. Soil Sci. 61, 888–902. doi:10.1111/j.1365-2389.2010.01291.x
Pérez-López, O., Bueno, G. A., Baquero, J. E., Onofre, H. G., Cassalett-Bustillo, E., Molina, A. M., et al. (2019). Modelo productivo tecnologías integrales para sistemas de producción de bovinos de cría en la altillanura colombiana. Mosquera, Colombia: Corporación Colombiana de Investigación Agropecuaria AGROSAVIA.
Post, W. M., and Kwon, K. C. (2000). Soil carbon sequestration and land-use change: Processes and potential. Glob. Change Biol. 6, 317–327. doi:10.1046/j.1365-2486.2000.00308.x
R Core Team (2015). R: A language and environment for statistical computing. http://www.r-project.org/.
R Core Team (2019). R: A language and environment for statistical computing. http://www.r-project.org/.
Rivera, M., Amézquita, E., Bernal, J. H., and Rao, I. (2013). Las Sabanas de los Llanos Orientales de Colombia: Caracterización Biofísica e Importancia para la Producción Agropecuaria. En: Sistemas agropastoriles: Un enfoque integrado para el manejo sostenible de Oxisoles de los Llanos Orientales de Colombia/editado por Edgar Amézquita, Idupulapati M. Rao, Mariela Rivera, Irlanda I. Corrales y Jaime H. Bernal. -- Cali, CO: Centro Internacional de Agricultura Tropical (CIAT); Ministerio de Agricultura y Desarrollo Rural (MADR) de Colombia. Bogotá, Colombia: Corporación Colombiana de Investigación Agropecuaria Corpoica, 3–13.
Rodríguez, M., Andrade, G., Castro, L. G., Durán, A., Rudas, G., and Wills, A. Uribe y. E. (2009). La mejor Orinoquia que podemos construir – elementos para la sostenibilidad ambiental del desarrollo. https://www.researchgate.net/publication/265077456_LA_MEJOR_ORINOQUIA_QUE_PODEMOS_CONSTRUIR_Elementos_para_la_Sostenibilidad_Ambiental_del_Desarrollo/link/55522b3a08ae980ca606aa9f/download.
Rodríguez, N. S., Lavelle, P., Pulido, S. X., Gutiérrez, A., Bernal, J., Argüello, O., et al. (2013). Construcción de Indicadores de Eco-eficiencia para la Altillanura Plana en los Municipios de Puerto López y Puerto Gaitán, departamento del Meta. Villavicencio-Meta, Colombia: CORPOICA, 40.
Rousseau, L., Fonte, S. J., Téllez, O., van der Hoek, R., and Lavelle, P. (2013). Soil macrofauna as indicators of soil quality and land use impacts in smallholder agroecosystems of western Nicaragua. Ecol. Indic. 27, 71–82. doi:10.1016/j.ecolind.2012.11.020
Ruiz, A. (2002). Fijación y almacenamiento de carbono en sistemas silvopastoriles y competividad económica en Matiguás. Nicaragua. Turrialba, CR: CATIE, 111. URI http://hdl.handle.net/11554/2148.
Sas, (2016). SAS software, version 9.4. http://www.sas.com/.
SCCS -Sociedad Colombiana de la Ciencia del Suelo (2013). Ciencia del suelo: Principios básicos. - 2 edición burbano hernán y silva francisco. Bogotá, Colombia: SCCS -Sociedad Colombiana de la Ciencia del Suelo.
Tilley, J. M. A., and Terry, R. A. (1963). The digestibility of the leaves and stems of perennial ryegrass, cocksfoot, timothy, tall fescue, Lucerne and sainfoin, as measured by an in vitro procedure. Grass Forage Sci. 19 (4), 363–372. doi:10.1111/j.1365-2494.1964.tb01188.x
Torres-Guerrero, , Alberto, C., Etchevers, B., Jorge, D., Fuentes-Ponce, , Hada, M., et al. (2013). Influencia de las raíces sobre la agregación del suelo. Terra Latinoam. 31 (1), 71–84. http://www.scielo.org.mx/scielo.php?script=sci_arttext&pid=S0187-57792013000100071&lng=es&nrm=iso.
Van Soest, P. J., Robertson, J. B., and Lewis, B. A. (1991). Methods for dietary fiber, neutral detergent fiber, and nonstarch polysaccharides in relation to animal nutrition. J. Dairy Sci. 74, 3583–3597. doi:10.3168/jds.s0022-0302(91)78551-2
Van Soest, P. (1967). Use of detergent in the analysis of fibrous feeds. A rapid meted for determination of fiber and lignin. J. A. O. A. C 46, 830.
Vargas Pineda, O. I., Trujillo González, J. M., and Torres Mora, M. A. (2017). La economía verde: Un cambio ambiental y social necesario en el mundo actual. Rev. Investig. Agrar. Ambient. 8 (2), 175–186. doi:10.22490/21456453.2044
Velásquez, E., Lavelle, P., and Andrade, M. (2007). GISQ, a multifunctional indicator of soil quality. Soil Biol. Biochem. 39 (12), 3066–3080. doi:10.1016/j.soilbio.2007.06.013
Walkley, A., and Black, I. A. (1934). An examination of the Degtjareff method for determining soil organic matter and a proposed modification of the chromic acid titration method. Soil Sci. 37 (1), 29–38. doi:10.1097/00010694-193401000-00003
Keywords: biodiversity, fertility, water regulation, livestock, Eastern high plains
Citation: Rodríguez-Hernández NS, Arango M, Moreno-Conn LM, Arguello JO, Bernal-Riobo JH and Pérez-López O (2023) Grassland management effect on ecosystem services in the livestock system in an oxisol from the Eastern high plains of Colombia. Front. Environ. Sci. 11:1107466. doi: 10.3389/fenvs.2023.1107466
Received: 24 November 2022; Accepted: 20 July 2023;
Published: 11 August 2023.
Edited by:
David Sotomayor-Ramírez, University of Puerto Rico at Mayagüez, Puerto RicoReviewed by:
Manoj Kumar Jhariya, Sant Gahira Guru Vishwavidyalaya, IndiaJose A. Amador, University of Rhode Island, United States
Copyright © 2023 Rodríguez-Hernández, Arango, Moreno-Conn, Arguello, Bernal-Riobo and Pérez-López. This is an open-access article distributed under the terms of the Creative Commons Attribution License (CC BY). The use, distribution or reproduction in other forums is permitted, provided the original author(s) and the copyright owner(s) are credited and that the original publication in this journal is cited, in accordance with accepted academic practice. No use, distribution or reproduction is permitted which does not comply with these terms.
*Correspondence: Nubia S. Rodríguez-Hernández, bnJvZHJpZ3VlekBhZ3Jvc2F2aWEuY28=
†ORCID: Nubia S. Rodríguez-Hernández, orcid.org/0000-0002-5685-8597