 Anuj Saraswat1,2†
 Triyugi Nath2
 Michael E. Omeka3*†
 Chinanu O. Unigwe4†Ifeanyi E. Anyanwu5†Samuel I. Ugar3
 Ashish Latare2
 Md Basit Raza6†Biswaranjan Behera7†Partha P. Adhikary7†
 Antonio Scopa8*†
 Mohamed A. E. AbdelRahman9†
- 1Department of Soil Science, G.B. Pant, University of Agriculture and Technology, Pantnagar, Uttarakhand, India
- 2Department of Soil Science and Agricultural Chemistry, Institute of Agricultural Sciences, Banaras Hindu University, Varanasi, Uttar Pradesh, India
- 3Department of Geology, University of Calabar, Calabar, Nigeria
- 4Boone Pickens School of Geology, Oklahoma State University, Stillwater, OK, United States
- 5Department of Geology, University of Nigeria, Nsukka, Nigeria
- 6ICAR-Indian Institute of Soil and Water Conservation, Dehradun, India
- 7ICAR-Indian Institute of Water Management, Bhubaneswar, India
- 8Scuola di Scienze Agrarie, Forestali, Alimentari ed Ambientali (SAFE), University of Basilicata, Potenza, Italy
- 9Division of Environmental Studies and Land Use, National Authority for Remote Sensing and Space Sciences (NARSS), Cairo, Egypt
The recent global upsurge in anthropogenic activities has resulted in a decline in the quality of water. This by extension has resulted in increased ubiquity of water pollution in terms of sources. The application of traditional water quality assessment methods usually involves the use of conventional water quality parameters and guideline values. This may be associated with bias and errors during the computation of various sub-indices. Hence, to overcome this limitation, it is critical to have a visual appraisal of the water quality in terms of source and human health risks exposure for sustainable water resource management and informed decision-making. Therefore, the present study has integrated multiple water quality assessment indices, spatio-temporal, and statistical models to assess the suitability of fifty groundwater samples (n = 50) within the Firozabad industrial area for irrigation and drinking; as well as the likely health risks from oral intake and dermal contact by inhabitants. Electrical conductivity (mean = 1,576.6 μs/cm), total hardness (mean = 230.9 mg/L), dissolved sodium (mean = 305.1 mg/L) chloride (mean = 306.1 mg/L) and fluoride (mean = 1.52 mg/L) occurred in the water at concentrations above the recommended standards; attributed influxes from agricultural and industrial wastewater. The pollution index of groundwater and water quality index revealed that 100% of the groundwater samples are extremely polluted; this was also supported by the joint multivariate statistical analyses. The majority of the irrigational water quality indices (sodium adsorption ratio, Kelly’s Ratio, permeability index, percent sodium) revealed that the long-term use of the groundwater for irrigation in the area will result in reduced crop yield unless remedial measures are put in place. Higher Hazard index (HI > 1) for nitrate and fluoride ingestion was recorded in water for the children population compared to adult; an indication that the children population is more predisposed to health risks from the oral intake of water. Generally, risk levels from ingestion appear to increase in the western and north-eastern parts of the study area. From the findings of this study, it is highly recommended that adequate agricultural practices, land use, and water treatment regulatory strategies be put in place for water quality sustainability for enhanced agricultural production and human health protection.
Introduction
The importance of groundwater for drinking, domestic, irrigated agriculture, and industrial uses cannot be overemphasized. In the recent past, higher preference and demand have been put on groundwater due to its perceived low vulnerability to pollution compared to surface water (Egbueri et al., 2021; Liu, 2021). This assumption has been based on the fact that groundwater is located within the subsurface and “protected” by a confined subsurface aquifer layer, which tends to shield it from contamination. However, recent studies have found that due to the varying subsurface aquifer characteristics peculiar to different geologic formations (such as porosity, permeability, depth to the water table, topography, etc.), over-exploitation (over-abstraction of groundwater), groundwater is also found to be highly vulnerable to pollution (Omeka et al., 2022b; Omeka and Egbueri, 2022). Given the increasing demand and the need for sustainable agriculture to meet the increasing population, quality water for irrigation becomes crucial for sustainable agriculture, especially in arid and semi-arid areas of the world (FAO, 2003; Qadir and Oster, 2004; Abrahao et al., 2011; Wang et al., 2021). According to global projections on agricultural productivity, higher agricultural yield has been experienced from irrigational agriculture compared to non-irrigated agriculture. The implication of this is that the demand for agricultural land and quality water for irrigation is expected to increase in years to come (Qadir and Oster, 2004), thereby, putting more pressure on the available water resources and agricultural lands (Abrahao et al., 2011). Hence, ensuring quality water for irrigation will enhance agricultural productivity and sustainable management of agricultural soil (Brady, 2002; Omeka, 2023). Given these challenges, ensuring quality irrigation water will involve designing state-of-the-art models and cutting-edge, non-conventional multi-criteria approach towards quality water resource prediction, management, and sustainability.
The Firozabad city, where the present study is carried out is located in Firozabad district of Uttar Pradesh, one of India’s basins where there is intense demand of water for irrigation purpose. The major source of irrigation water in the area is groundwater and canals. The long-term annual average rainfall in the area is 715.2 mm. The climate of the area is sub-humid with a dry climate occurring throughout the year except during the monsoon season where high rainfall occurs from June to September, resulting in high percolation of water into the aquifer. In recent years, increased evapotranspiration, low precipitation, and overexploitation have been observed in the area resulting in a decrease in the level of groundwater in the area (Prasad, 2008). According to the long-term groundwater level fluctuation for 1 decade (1998–2007) for three groundwater monitoring wells, there has been a decline in groundwater level from 0.0171 to 0.0264 my-1 (Prasad, 2008). Overexploitation of the groundwater resources in the area is known to deplete the water table, thereby increasing the vulnerability of aquifers to contamination from irrigational water run-off, percolation, and leaching from return irrigational water flow enriched in toxic chemical substances such as nitrate (NO3−) and fluoride (F−) (Shah and Deb Roy 2002). These pollutants in water can portend high health risks to consumers and may impede crop yield when used for irrigation.
In the past decades, several efforts have been put in for regular monitoring and assessment of water quality for several purposes, locally and internationally through legislative guidelines (BIS, 2012; WHO, 2017; Rahman et al., 2021). This has been done through the estimation of an element background level and setting up the standard value of each element in water to a particular benchmark for different purposes. The background levels are either estimated temporally or spatially. Temporal estimation is done by taking into consideration the concentration of the elements in the natural environment over anthropogenic controls, while spatial estimation considers only the areas not influenced by anthropogenic activities (Omeka and Igwe, 2021; Rahman et al., 2021). However, for pollutants like NO3− and F− which occur from both anthropogenic and natural sources, with varying pollution sources (such as point and non-point sources), the use of only the conventional approach in assessment may not be adequate for a holistic and unbiased water quality assessment. NO3− and F− are essential elements for humans, however, their excessive intake through drinking water may be harmful to human health (WHO, 2017; Liu, 2021; Aghamelu et al., 2022; Unigwe C. O. et al., 2022; Xiao et al., 2022a; Unigwe C. O. et al., 2022; Xiao et al., 2022b). Human health issues from F− contamination have been highly documented in recent times globally (Shahzad et al., 2017; Mirzabeygi et al., 2017; Yousefi et al., 2018; Amiri et al., 2020). According to global health projections, about two hundred million people worldwide are exposed to risks from F− ingestion in drinking water (Daw, 2004; Ayoob et al., 2008). Among these, regions like China, India, and Africa seem to be more affected (Mumtaz et al., 2015). In a study carried out on the seasonal variation of F− concentration in groundwater samples in the Urmia coastal aquifer (northwest Iran), high concentration of F− was observed in the shallow aquifers; attributed mainly to influx from anthropogenic activities such as intensive use of inorganic fertilizers and untreated waste water (Amiri et al., 2020). According to the 2017 report by World Health Organization, out of 80% of diseases amounting to poor drinking water quality globally, 65% are attributed to endemic fluorosis (WHO, 2017). Long-term ingestion of F− in drinking water, at a concentration greater than 1.5 mg L-1, is known to be responsible for dental fluorosis (Dehghani et al., 2019; Xiao et al., 2022c). According to the National Research Council (NRC, 2001), harmless daily consumption level of F− content in water for different age groups have been given as follows: 0.1–0.5 mg d-1 (infants of <6 months), 0.2–1.0 mg d-1 (infants 6–12 months), 0.5–1.0 mg d-1 (children, 1–3 years), 1,0–2.5 mg/d-1 (children 4–6 years), 1.5–2.5 mg/day (children 7 years above) and 1.5–4.0 mg d-1 (adults). Nitrates on the other hand make up the most essential part of most inorganic fertilizers. They can be released into groundwater bodies through percolation and infiltration from agricultural fields, release from industrial and domestic wastes and burning of fossil fuels (WHO, 2017; Egueri et al., 2021; Omeka and Egbueri, 2022). High nitrate ingestion in drinking water has been associated with life-threatening illnesses like methemoglobinemia (blue baby syndrome) and stomach cancer (Dehghani et al., 2019; Okamkpa et al., 2022). The maximum permissible limit of nitrate in drinking water has been set at 50 mg L-1 according to WHO (2017). Elevated concentration of nitrate in drinking water have been found to result in carcinogenic and non-carcinogenic human health risks (Amiri et al., 2022).
Several multiple numerical models have been developed by several researchers for environmental quality monitoring, appraisal, and prediction for irrigation, drinking, and industrial purposes (Edet and Offiong, 2002; Amiri et al., 2021; Igwe and Omeka, 2021; Omeka et al., 2022a; Shukla et al., 2022; Egbueri et al., 2023). These models are based on water quality assessment for heavy metal concentration and overall chemical constituents of chemical elements in the water. Based on heavy metal concentration, numerical models such as heavy metal pollution index (HPI), heavy metal evaluation index (HEI), degree of contamination (Cdeg) and geo-accumulation index (I-geo) have been mostly used. Based on overall chemical constituents, indices such as the pollution index of groundwater (PIG), pollution load index (PLI), the overall index of pollution (OIP), and water quality index (WQI), have been widely used for drinking water quality analysis. Conversely, numerical indices for irrigation water quality assessment include sodium adsorption ratio (SAR), magnesium hazard (MH), permeability index (PI), residual sodium carbonate (RSC), and salinity hazard. However, a common drawback among these models is their inability to carry out a composite unbiased assessment of water quality. This can be attributed to differences in input variables and sub-index computation methods. As such, one model can certify particular water as suitable while the other may disagree, resulting in a bias in judgment and decision. Hence, for a holistic and unbiased water quality assessment, the use of the integrated approach is recommended for better decision-making (Egbueri et al., 2021; Omeka et al., 2023). Other health risk assessment indices have been based on only the children and adult population sizes and taking into account only the ingestion pathway (Adamu et al., 2015). It is thought that the assessment of the health risk implications of the toxic elements in ingestion water should include more age groups (male, female and children), which will enhance a robust and more reputable health risk assessment for a particular region (Sohrabi et al., 2021; Kadam et al., 2022). Additionally, evaluating the possible health risks from ingestion and dermal contact will afford a more enhanced and flexible approach to health risk assessment. Hence, in the present study, the health risk assessment for the male, female, and children population size has been evaluated, with consideration of two exposure pathways-ingestion and dermal contact with an emphasis on NO3− and F− contamination.
Groundwater sources in the Firozabad city have been exposed to contamination from chemicals (especially NO3− and F−). No known study has been carried out in the area concerning the irrigation suitability assessment of groundwater within the area. Moreover, no literature has reported health risk assessment of groundwater in the area based on NO3− and F−. Although several studies have been carried out in nearby areas such as Agra, on the health risk implications of only fluoride using different stochastic and simulation models (Ali et al., 2017). No literature has carried out an integrated and composite assessment of the drinking water and irrigation water quality assessment of groundwater in the area using numerical indexical approaches. Hence, in this study, multiple numerical indices, multivariate statistical models, and multipath health risk models have been integrated for a holistic assessment of the drinking water quality, irrigation suitability status, and health risk level of groundwater from the industrial region of Firozabad city, Uttar Pradesh, India. The objectives of the present study are 1) to appraise the quality of drinking water in the area using WQI-PIG multi-criteria study approach, 2) to carry out a composite human health risk assessment of the exposure of contaminated water to inhabitants by considering two exposure routes (ingestion and dermal contact) and three age groups (female, male and children) with emphasis on NO3− and F−, 3) to attempt a generic identification and classification of the possible source of contaminants as well as the association between numerical models using multivariate statistics, 4) to evaluate the suitability of the groundwater in the area for irrigation purposes using multiple irrigation water quality indices and 5) to propose a state-of-the-art futuristic water treatment/waste management approach for the study area for water quality sustainability. It is hoped that the findings from this research would be helpful to decision-makers for equitable and robust decision-making regarding water quality management and sustainability for enhanced agricultural production globally. The findings and suggested remediation measures can serve as a template for other parts of the world for enhanced water quality and resource availability.
2 Material and method
2.1 Study area description
Firozabad, famed for its numerous small-scale glass industries, is located in the western part of Uttar Pradesh (latitude: 27°12′ to 27°18′ N; longitude: 78°35′ to 78°42′ E), north-central India (Figure 1). The city is covered by the Etah district in the north, Mainpuri and Etawah districts in the east, while the Yamuna River covers its southern boundary. The region has a sub-humid climate with an average annual rainfall of 715.2 mm, the major portion being received during the summer monsoon period (June to September). The city employs a sizeable proportion of its population in centuries-old glass manufacturing units. Over five crore bangles are sold every day in the country, the supply of which is entirely credited to Firozabad city, earning it the name of ‘suhag nagri’. The multi-level bangle-making industry lacks improved technologies for glass processing and waste disposal. Glass is recycled and reused, however, the process requires a huge quantity of water for molding, cooling, washing, and glazing, which is drained away without treatment, contaminating land and subterranean water. Not only land and water but the air is also polluted by the pollutants spewed from the glass industries contributing to the deteriorating health condition of local peoples and making the ecosystem more fragile.
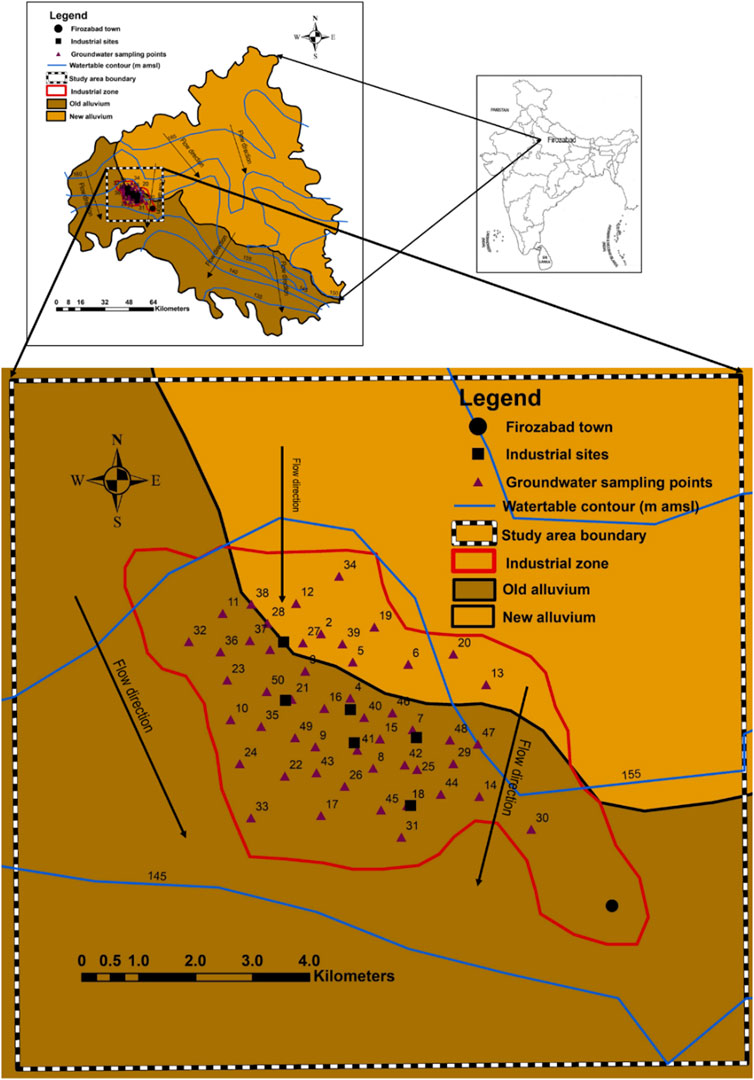
FIGURE 1. Map showing the sampling location, geology, hydrogeology and groundwater flow direction in the study area.
Since, the average annual precipitation in the region is inadequate to meet the demands of agricultural operations year-round, the water from canals and bore well helps the farmers to take up multiple crops in a year. The untreated effluents from the glass industries being drained directly into the nearby water channel, pollute the main stream water which flows down to the Yamuna via its tributaries’ viz. Sirsa, Senger and Arind Nadi.
2.2 Geology and hydrogeology
The geology of the Firozabad district is underlain by sands of various grades, gravels, silt, and clay. The result of exploratory drilling indicates that in the central and south-western parts of the district where the Firozabad city (where study area lies), encounters the Vindhyan sandstone as basement (with varying depths) and the alluvial sediment thickness increases from south-western part to northern parts (Ali et al., 2017). Additionally, there is also a shift from older alluvium (Bhangar) to newer alluvium (Khadar) in the same direction (Figure 1). Based on borehole data, a three-tier system of aquifers exists in the Firozabad district. Groundwater occurs under unconfined to semi-confined conditions, although this may depend on the nature and occurrence of the number of local/semi-regional clay beds.
Based on the depth to water level data of groundwater monitoring stations, the pre-monsoon water level varies from 2.42 to 25.1 m, while in the post-monsoon period, depth to water varies from 1.55 to 25.3 m (Prasad, 2008) Water level fluctuation varies from 0.23 to 1.38 m. Water level is deeper along the bank of Yamuna which takes it source from the southern part of the study area. The long-term water level trend is a falling one and varies from 0.0171 to 0.0264 m/year. The yield of deep tube-well varies from 1900 to 2,600 L per meter (lpm) for normal drawdowns, whereas the yield of shallow tube-well varies from 1,000 to 2000 lpm (Prasad, 2008). The transmissivity varies from 17.0 to 42.8 m/day. At the western part of the study area, there is presence of a small clay lens that can create a perched aquifer; serving as a major sink for anthropogenic contaminants. The groundwater flow direction is towards south (Figure 1), thus facilitating the possible migration of contaminants towards southern direction within the study area. It can therefore be deduced that due to the high porosity of the geologic units, coupled with the low depth to water table, the aquifer within this area is highly susceptible to contaminant influx from nearby industries and agricultural fields (Aghamelu et al., 2022; Okamkpa et al., 2022).
2.3 Groundwater sampling and analysis
To conduct a water quality assessment, a total of fifty (n = 50) groundwater samples were collected randomly from the nearby glass industrial area in the Firozabad city, which consists of shallow hand pumps and tube wells, from January–February 2021. The samples were collected in polypropylene bottles with 1 L capacity. In the laboratory, all analytical procedures were conducted based on American Public Health Association (APHA 1995, 2012, 2017) standard procedures. The water samples were filtered using Whatman-42 filter paper and a few drops of toluene were added to each of the samples and were stored at 4°C until further analysis. The samples were analyzed for sodium (Na+), potassium (K+), calcium (Ca2+), magnesium (Mg2+), chloride (Cl−), sulphate (SO42–), fluoride (F−), nitrate (NO3−), bicarbonate (HCO3−), and total hardness (TH) by using standard procedures (APHA 1995, 2012). The pH and electrical conductivity (EC) were measured in water samples employing a combined digital pH and conductivity meter (Eutech PC 700, Thermo Fisher Scientific Inc.). The total dissolved solids (TDS) (mg L–1) of the water samples was measured by multiplying EC (dS m-1) by a factor of 640 (Eaton et al., 1995; Corwin and Yemoto, 2017). The Na and K were determined using a flame photometer (Systronics Type-130). The SO42– in groundwater sample was analyzed by BaCl2 turbidimetric method, while NO3− was analyzed following the Cd-reduction method and measuring the absorbance at 543 nm using the UV spectrophotometric method (Labtronics Model LT-291). The F− in groundwater sample was estimated by using the F− ion selective electrode as per Corwin and Yemoto (2017). The heavy metals such as iron (Fe), copper (Cu), manganese (Mn), and zinc (Zn) were determined using flame atomic absorption spectroscopy (FAAS) (Agilent Technologies 200 series AA), while chromium (Cr), nickel (Ni), cadmium (Cd), and lead (Pb) were analyzed using graphite furnace atomic absorption spectroscopy (GFAAS) (Agilent Technologies 200 series AA) (Igwe and Omeka, 2021). For preparing standard solutions, 100 mg L-1 inductively coupled plasma (ICP) multi-element standard stock solution was purchased from Certipur® Merck KGaA (Germany). All concentrations are expressed in mg L-1, except pH and EC (dS m-1).
To ensure quality assurance and control of analytical data, it was necessary to calculate the ionic balance error (IBE) to ensure the accuracy of the hydrochemical data. The IBE is based on the principle of electro-neutrality as proposed by Freeze and Cherry (1979). The principle follows that the sum of all the anions in a particular water sample must equal that of cations (expressed in meq/L) (Eq. 1). Based on the computed IBE, all water samples showed IBE within the acceptable standard value of ≥5%
2.4 GIS-based geospatial analysis
The use of use spatiotemporal maps in the present study was to give a visual assessment of the human health risks to different population sizes through different exposure routes. The spatiotemporal maps were generated using Surfer (ver. 21.1). The location of the sample points (as collected during field studies using longitudes and latitudes values from GPS) were interpolated into the map by integrating the inverse distance weighting (IDW) technique and simple kriging (SK) in the Surfer (ver. 2.1.1) environment. Additionally, to determine the groundwater flow direction of the area, hydraulic head values were used as the input parameters, using the relation shown in Eq. 2 as per Okamkpa et al. (2022).
where H represents the hydraulic head layer, GSE represents the ground surface elevation (in meters), and SWL represents the static water level (in meters).
IDW is a geostatistical analytical method that fits a surface to three dimensions (XYZ). It involves the use of known Z values weights determined as a function of distances between the known and known points (Philips & Watson 1982). As such, in IDW, distant points have less influence than those that are close. In other words, only known Z values and distant weights are used to derive the unknown areas. In the present study the Z-values were represented by the health risk assessment values for different population sizes for different exposure pathways, with X and Y dimensions representing latitude and longitude values respectively.
2.5 Drinking water quality assessment
2.5.1 Water quality index
The WQI provides a complete summary assessment of the drinking water quality level of water samples (Igwe and Omeka, 2021; Xiao et al., 2021). To do so, distinct weights (wi) ranging from one to five are assigned to various water quality variables depending on their relative concentration and importance in terms of drinking water quality; the relative weights (Wi) of each parameter are then calculated. (Eq. (3); Table 1).
where n represents the total number of parameters.
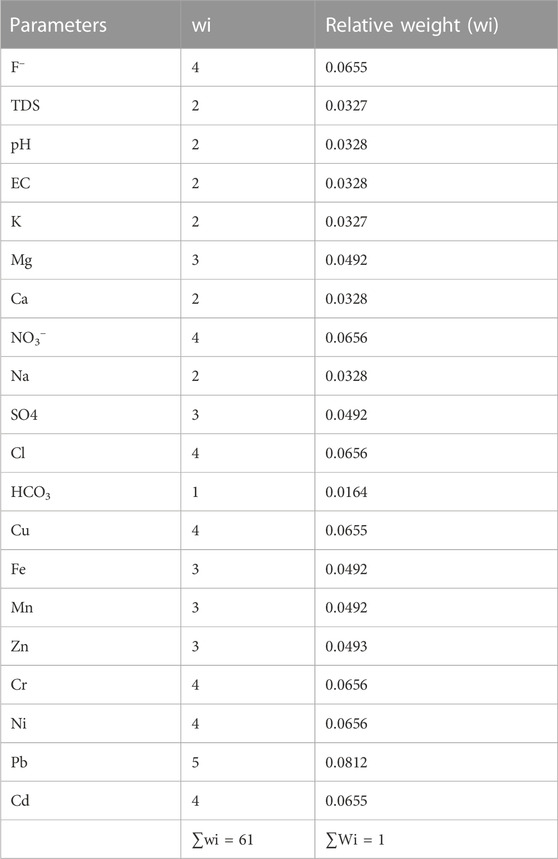
TABLE 1. Relative weights of parameters used in PIG and WQI evaluation.
The quality rating scale for each parameter (qi) was then calculated following Eq. (4)
Where Ci indicates the concentration of individual water parameters; Si is the WHO (2017) standard limit.
The sub-index of the ith parameter (SI), was thereafter computed using Eq. 5. Finally, the WQI was estimated as shown in Eq. 6
2.5.2 Pollution index of groundwater
The level of pollution from the individual chemical elements on the groundwater quality can be evaluated using the PIG. This index was proposed by Subba Rao (2012) and takes into consideration the values of both physicochemical and heavy metals. To do this, the relative weights (Rw) (varying between 1 and 5) are apportioned to each chemical parameter according to their relative effect on human health (Table 1). Thereafter, the weight parameter (Wp) is derived for each analyzed chemical parameter to calculate the relative importance of each parameter on the general drinking water quality (Eq. (7)). Furthermore, the individual parameter in each water sample is divided by the standard drinking water quality limit to determine the concentration status (Sc) for each sample point (Eq. (8)). The overall drinking water quality (Ow) is then derived following the relation in Eq. 9. Finally, the obtained Ow values were then summed up to determine the PIG of the individual groundwater sample locations (Eq. (10))
Based on the PIG classification scheme as proposed by Subba Rao (2012), PIG <1 denotes negligible pollution level, 1 ≥ PIG ≤1.5 depicts low pollution, 1.5 ≥ PIG ≤2 indicates moderate or mild pollution level, 2 ≥ PIG ≤2.5 indicates high pollution, and PIG >2.5 depicts very high pollution level.
2.6 Irrigation water quality assessment
A comprehensive assessment of the irrigation water quality was carried out by computing various irrigation parameters including magnesium hazard (MH), sodium adsorption ratio (SAR), residual sodium carbonate (RSC), Kelly’s Ratio, (KR), electrical conductivity (EC), potential salinity (PS), and permeability index (PI). The parameters were then combined to evaluate the joint influences from various chemical parameters on crop productivity. Crop yield and soil quality can be influenced by the quality of irrigation water; hence it becomes necessary to carry out a comprehensive assessment of irrigation water quality using various irrigation water quality indices (Wang et al., 2022) Thus, this necessitates the need for the appraisal of our water quality for irrigational purposes. The equations for the calculation of the various irrigation water quality indices and their respective references are presented in Table 2.
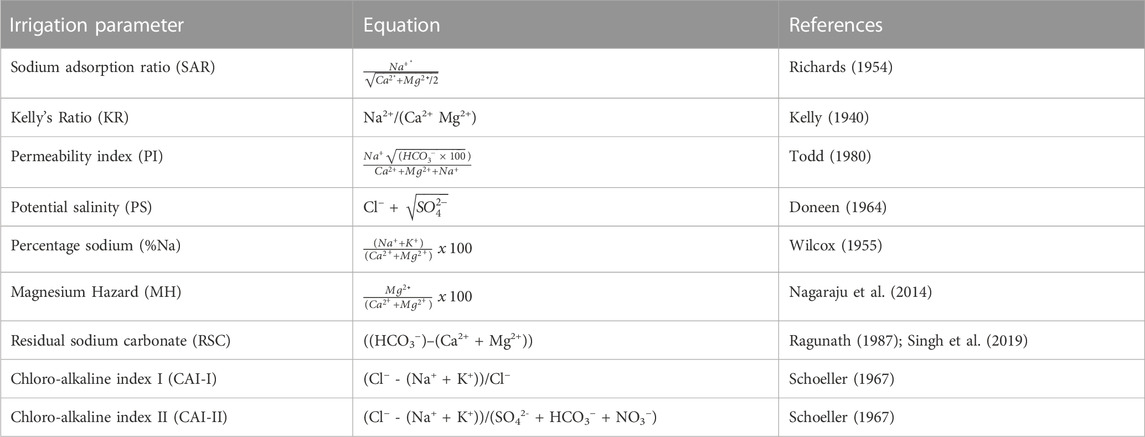
TABLE 2. Equations and references for irrigation water quality assessment.
2.7 Health risk assessment
Two main exposure pathways are taken into account while evaluating human health risks from drinking water, according to the US Environmental Protection Agency (US-EPA, 1989). The two significant mechanisms are exposure via dermal contact and exposure via ingestion or oral route (Rahman et al., 2021; Amiri et al., 2022). In this study, three groups of exposed individuals—men, women, and children—were taken into account when assessing the health risks of three selected elements (nitrate, chloride and fluoride). Both oral and dermal contact exposure pathways are used in the process of calculating the non-carcinogenic health risk, as given in the following equations:
a) Oral intake:
b) Dermal contact:
Chronic daily intake is denoted in Eq. 11 by “CDI” (in mg/kg/day); the concentration of individual elements is denoted by “C" (in mg L-1); and daily groundwater ingestion rate is denoted by “IR” (in L d-1), with 2.5 L d-1 for males and females and 1 L d-1 for children. EF denotes the exposure (in days/year). The exposure frequency is 365 days per year for males, females, and children. ED denotes the exposure duration (in a year); 12 years for children, 67 years for females, and 64 years for males. ABW indicates the average body weight, which is 65 kg for men, 55 kg for women, and 15 kg for children. The average exposure times (AET) for males, females, and children are given as 23,360 days, 24,455 days, and 4,380 days, respectively. The hazard quotient is denoted as HQ in Eq. 12
RfD represents the reference dosage of nitrate, chloride, and fluoride contamination (in mg/kg/day), which is 1.6 mg/kg/day, 0.1 mg/kg/day, and 0.06 mg/kg/day respectively. In Eq. 13, DAD denotes the dermal absorbed dose (mg/kg day); TC is the contact time (in h/day) taken as 0.4 h/day; Ki is the dermal adsorption parameters (in cm/h) taken as 0.001 cm h-1, and CF is the conversion factor taken as 0.001. EV denotes bathing frequency (in times/day) and is considered one time per day, whereas SSA denotes skin surface area (in cm2). SSA values are taken as 16,600 square centimeters for both males and females and 12,000 square centimeters for children. HI is the hazard index in Eqs. 14, 15, and its value denotes non-carcinogenic human health risks. A HI value larger than one indicates a potential human health danger from nitrate contamination, while HI value less than one indicates a tolerable level of human health risk (Amiri et al., 2020; Rahman et al., 2021; Amiri et al., 2022).
2.8 Multivariate statistical analysis
In the present study, two multivariate statistical models (Q-mode hierarchical cluster analysis and principal component analyses) were used to identify possible sources of contamination as well as the interrelationships between the water quality parameters and water quality indices. All analyses were performed using the IBM SPSS (v. 25) statistical model. Details of the methodology of the models have been described in section 3.
3 Results and discussion
3.1 Overall groundwater quality description
Overall physicochemical results of groundwater samples are presented in Supplementary Table S1 (Supplementary Material), while a descriptive statistical summary of physicochemical results is shown in Table 3. The results were also compared with standard limits of the World Health Organization (WHO, 2017) and Bureau of Indian standards (BIS, 2012). A classification criterion as per Langenegger (1990) for all the physicochemical parameters has also been provided (Table 4). The study area is an agrarian region saddled with intensive anthropogenic influxes from agricultural activities and poor management of its effluents from industries. Additionally, other human-mediated influx from poor solid waste management also poses as a major source of pollution to both the drinking and irrigation water quality, thereby putting more stress on the available groundwater sources. Hence, it was necessary to carry out a composite physicochemical analysis of all the groundwater quality parameters for both drinking and irrigation purposes.
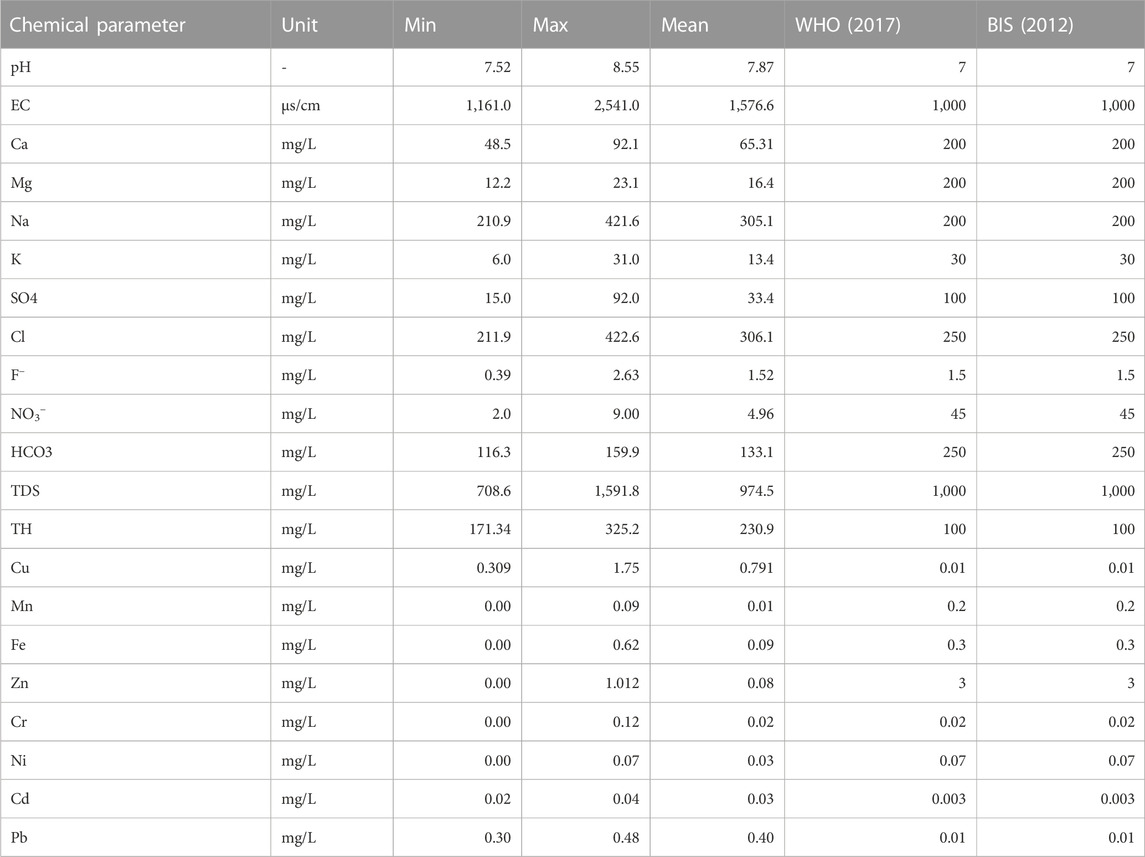
TABLE 3. Descriptive statistical summary of the physicochemical parameters compared to quality standard.
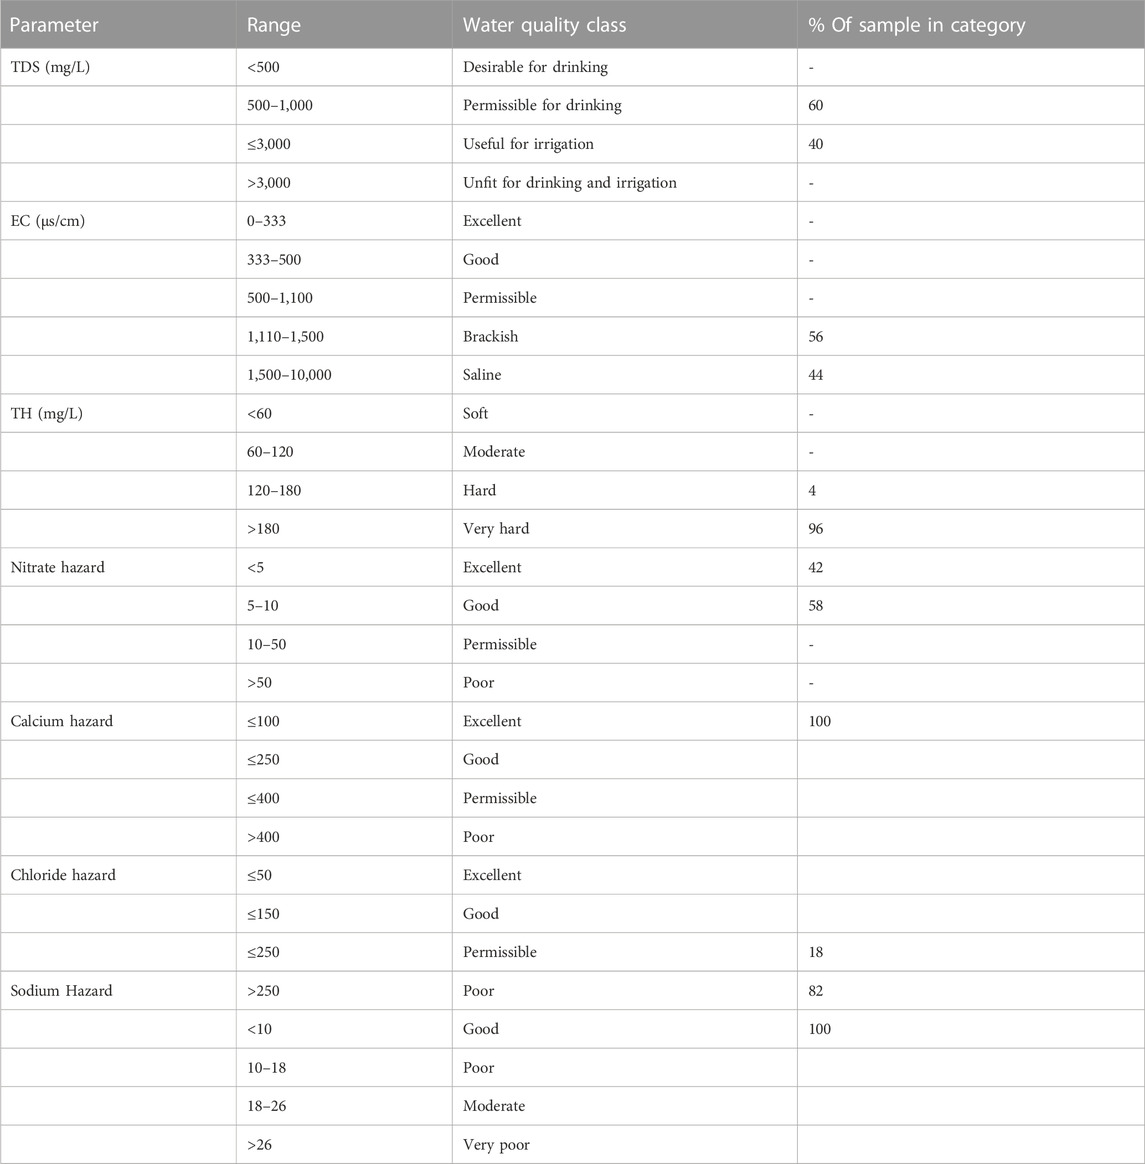
TABLE 4. Classification of all groundwater samples based on physicochemical characteristics (Modified after Langenegger, 1990; Davis and De Wiest, 1966; McGowan, 2000).
Generally, based on their values, EC, TH, Na+, Cl−, and F− , recorded their respective values above the WHO (2017) recommended standards for drinking water quality, while other parameters were within the required standard. The water conductivity (EC) ranged between 1,161 μS cm-1 and 2,541 μS cm-1 with a mean value of 1,576.6 μS cm-1. High electrical conductivity in groundwater has a direct bearing on the total dissolved solids in water (Igwe and Omeka, 2021). The high TDS values observed in this seem to correspond with the conductivity values observed. Moreover, the high EC values appear to be in tandem with the corresponding high concentration of dissolved ions such as Cl and Na in the water. The elevated concentration of EC in the results could be sourced from infiltration and dissolution of chemical constituents from agricultural return water. High water conductivity harms soil fertility and can affect crop roots, thereby reducing plant yield. (Singh et al., 2019). Based on the Langenegger (1990) classification scheme, 56% of the total water samples are brackish while 44% are saline (Table 4). Based on the Davis and De Wiest (1966) classification criterion for TDS for drinking and irrigation, 60% of the total groundwater samples fall under the “permissible” category for drinking, while 40% are useful for irrigation. TDS is an important indicator of dissolved chemical constituents in water. TDS ranged from 708.6 mg/L to 1,591.8 mg L-1 with an average value of 974.5 mg L-1 (Table 4). Results from Table 3 shows that the groundwater pH is alkaline with values varying between 7.5 and 8.5 (mean = 7.8). The high alkalinity observed in the water can be attributed to dilution and increased buffering from precipitation and rock water interaction (Aghamelu et al., 2022; Omeka et al., 2022b).
The total hardness (TH) ranged from 171.3 mg L-1–325.2 mg L-1 with a mean value of 230.98 mg L-1. Water hardness is controlled by geogenic processes such as the dissolution of calcium and magnesium-bearing minerals from rocks enriched in alkali Earth metals (Ca, Mg) and alkaline metals (Na and K). The study area is underlain by sands of various grades, gravels, silt, clay, and alluvium deposits. The sands and alluvium are highly enriched in silicate and feldspar minerals (Barzegar et al., 2018); thereby giving rise to the high concentration of these minerals and the corresponding elevated hardness. Based on the McGowan (2000) classification scheme, 4% and 96% of the total water samples were classified as hard and very hard, respectively. The implication of this is that the high TH values are a result of highly dissolved divalent metallic ions (such as Ca2+, Mg2+) from the underlying aquifer material (Unigwe et al., 2022).
Sodium (Na) concentration varied from 210.9 mg L-1–421.6 mg L-1, averaging 305.1 mg L-1 (Table 3). Based on their mean values, Na concentration in the analyzed groundwater samples is above the WHO (2017) prescribed standard for drinking water. The elevated concentration of Na in the groundwater could be attributed to geogenic controls, such as the dissolution of calcic-bearing mineral rocks that underlie the area. Chloride (Cl−) ranged from 210.9 mg L-1–421.6 mg L-1 having a mean value of 305.1 mg L-1, with values occurring above the WHO (2017) permissible limit. According to the chloride hazard classification criteria (Table 4), 82% of the water are of poor quality, while 18% occurs within the “permissible” class. According to Yıldız and Karakas (2019), if Cl− in irrigation water occurs at values above 100 mg L-1, it can result in the reduction of soil permeability, thereby leading to plant toxicity and a reduction in crop yield. Fluoride concentration varied from 0.39 mg L-1–2.63 mg L-1, recording an average concentration value of 1.52 mg L-1. Based on the mean values, the groundwater samples in the Firozabad city have F− concentration above the WHO required values for drinking water quality. Long-term ingestion of fluoride in drinking water, with concentration greater than 1.5 mg L-1, is known to be responsible for dental fluorosis (Kotecha et al., 2012; Dehghani et al., 2019). Similar results have been found in some studies in the Agra district, a nearby area (Ali et al., 2017). Based on the findings of Ali et al. (2017), fluoride concentration varied between 0.14 and 4.88 mg L-1 in 45 villages in the Agra district, with concentrations occurring above the WHO standards. A similar study by Amouei et al. (2012) also showed an elevated concentration of F− in drinking water wells at a concentration ranging between 0.11 and 3.59 mg L-1. There is a similarity in both areas in terms of anthropogenic influxes, this may account for the similar values in F− content observed for the present study.
Based on their mean values, the concentration of heavy metals among the analyzed groundwater samples decreased in the order of Cu > Pb > Fe > Zn > Ni > Cd > Cr > Mn. Among the heavy metals, Cd, Pb, Cu, and Cr occurred in a concentration above the WHO and BIS recommended standards for drinking water quality. Cd has been ranked among the first ten carcinogenic elements according to the Toxic Substances Disease and Registry (ASTDR, 2018). The concentration of Cd ranged from 0.02 to 0.04 mg L-1 with a mean value of 0.033 mg L-1. High Cd concentration in groundwater is usually associated with the weathering and dissolution of sulfide minerals such as chalcopyrite and pyrites in subsurface aquifers enriched in Pb and Zn (Obasi and Akudinobi, 2020; Omeka and Igwe, 2021). The subsurface geology of the present study area is devoid of such rock minerals. Hence, the high concentration of Cd among the water samples can be attributed to anthropogenic influxes emanating from poor waste management and agricultural activities. Long-term ingestion of Cd in drinking water has been reported to be responsible for human renal dysfunction and kidney disease (Obasi and Akudinobi, 2020; Devi et al., 2021). The concentration of Pb varied between 0.30 mg L-1 and 0.48 mg L-1 recording an average value of 0.40 mg L-1. Leaching from solid waste materials and agricultural effluents may have given rise to the high Pb concentration among the groundwater samples. The long-term consumption of Pb in drinking water has been reported to result in abnormities in human fetal development in pregnant (Tüzen, 2013; Kumar et al., 2022). The concentration of Cr ranged from 0.00 mg/L (below detection limit) to 0.12 mg/L, having a mean concentration of ≈0.03 mg/L; with concentration slightly occurring below the drinking water quality. The occurrence of Cr among the water samples can be attributed to geogenic sources from source rocks that make up the subsurface geology. Sands, silts, and alluvium have been reported to make up the major litho-stratigraphic constituent of the underlying geology. The dissolution of these rocks can serve as a natural source of Cr in the groundwater (Obasi and Akudinobi, 2020).
The results of physicochemical analysis have so far revealed that the groundwater from the Firozabad city is largely influenced by anthropogenic influxes from agricultural activities and to a lesser extent by geogenic processes such as rock water interaction, weathering, and dissolution of chemical species within the underlying aquifer system.
3.2 Dynamics of groundwater flow and contaminant transport
The geology of the area is underlain by sands, gravels, silt, and clay, with high primary porosity and permeability. Their high porosity and permeability properties can influence the movement of contaminant species into the aquifer through infiltration and percolation. Additionally, the groundwater depth-to water table has been found to vary between 2.42 and 25.1 m (during pre-monsoon) and 1.55–25.3 m during post-monsoon (Prasad, 2008). The low depth to water table together with the high permeability and porosity of the underlying geology could serve as sources for contaminant influx into the groundwater nearby industries and agricultural fields (Aghamelu et al., 2022; Okamkpa et al., 2022). An observation of Figure 1 shows that the groundwater flows dominantly towards the south-western direction of the area. The major water source in the area is made up of majorly hand-dug wells. However, these wells are not well cased, and are drilled very proximate to industries and agricultural fields. Additionally, the few boreholes within the area are drilled without consideration of environmental safety standards, hence making them vulnerable to contamination influx. Contaminants within a porous media tend to follow the trend of groundwater flow (Fetter, 2018).
Hence, it can be deduced that contaminants flow within the aquifer will tend to flow along the path of groundwater flow, towards adjacent aquifers through recharge and infiltration. In the study area, most of the streams serve as sinks for disposal of untreated industrial and agricultural waste water and effluents. These streams can serve as recharge to the aquifer, therefore exposing them to pollution. As observed in Figure 1, the vector lines tend to move dominantly from the northwestern direction towards the southwestern parts of the study area. The implication is that water wells around the south and southwestern parts will be highly susceptible to contaminant influxes. Unfortunately, most of the industrial activities within the Firozabad city are confined within the south-western region. It is therefore recommended that drinking water wells should be prohibited from being drilled within the southern and south-western regions until remedial measures are put in place to ameliorate the spread of contaminants. However, the north-western and south-eastern regions may be suitable sites for drilling boreholes and hand-dug wells for drinking purposes.
3.2 Drinking water quality assessment
3.2.1 Pollution index of groundwater
A descriptive statistical summary, as well as the rating scale of final PIG results (∑Ow), are presented in Table 5; Supplementary Table S2 (Supplementary Material) shows the detailed PIG results. From the detailed results of PIG (S2), the Ow for all individual analyzed parameters, except for Cu, recorded values less than 1.0 indicating that Cu had a greater impact on the groundwater quality. The overall PIG (∑Ow) ranged from 3.69 to 12.7 with a mean value of 6.79 (Table 5). According to the PIG classification criteria (Subba Rao, 2012), all the groundwater samples showed very high pollution (PIG >2.5). Results from PIG have so far shown that the groundwater quality of the study area is in a very deplorable state due to toxic element influxes from anthropogenic activities (such as the indiscriminate use of agrochemicals in agricultural fields). This calls for an urgent need for the implementation of remedial measures to protect the available groundwater resources.
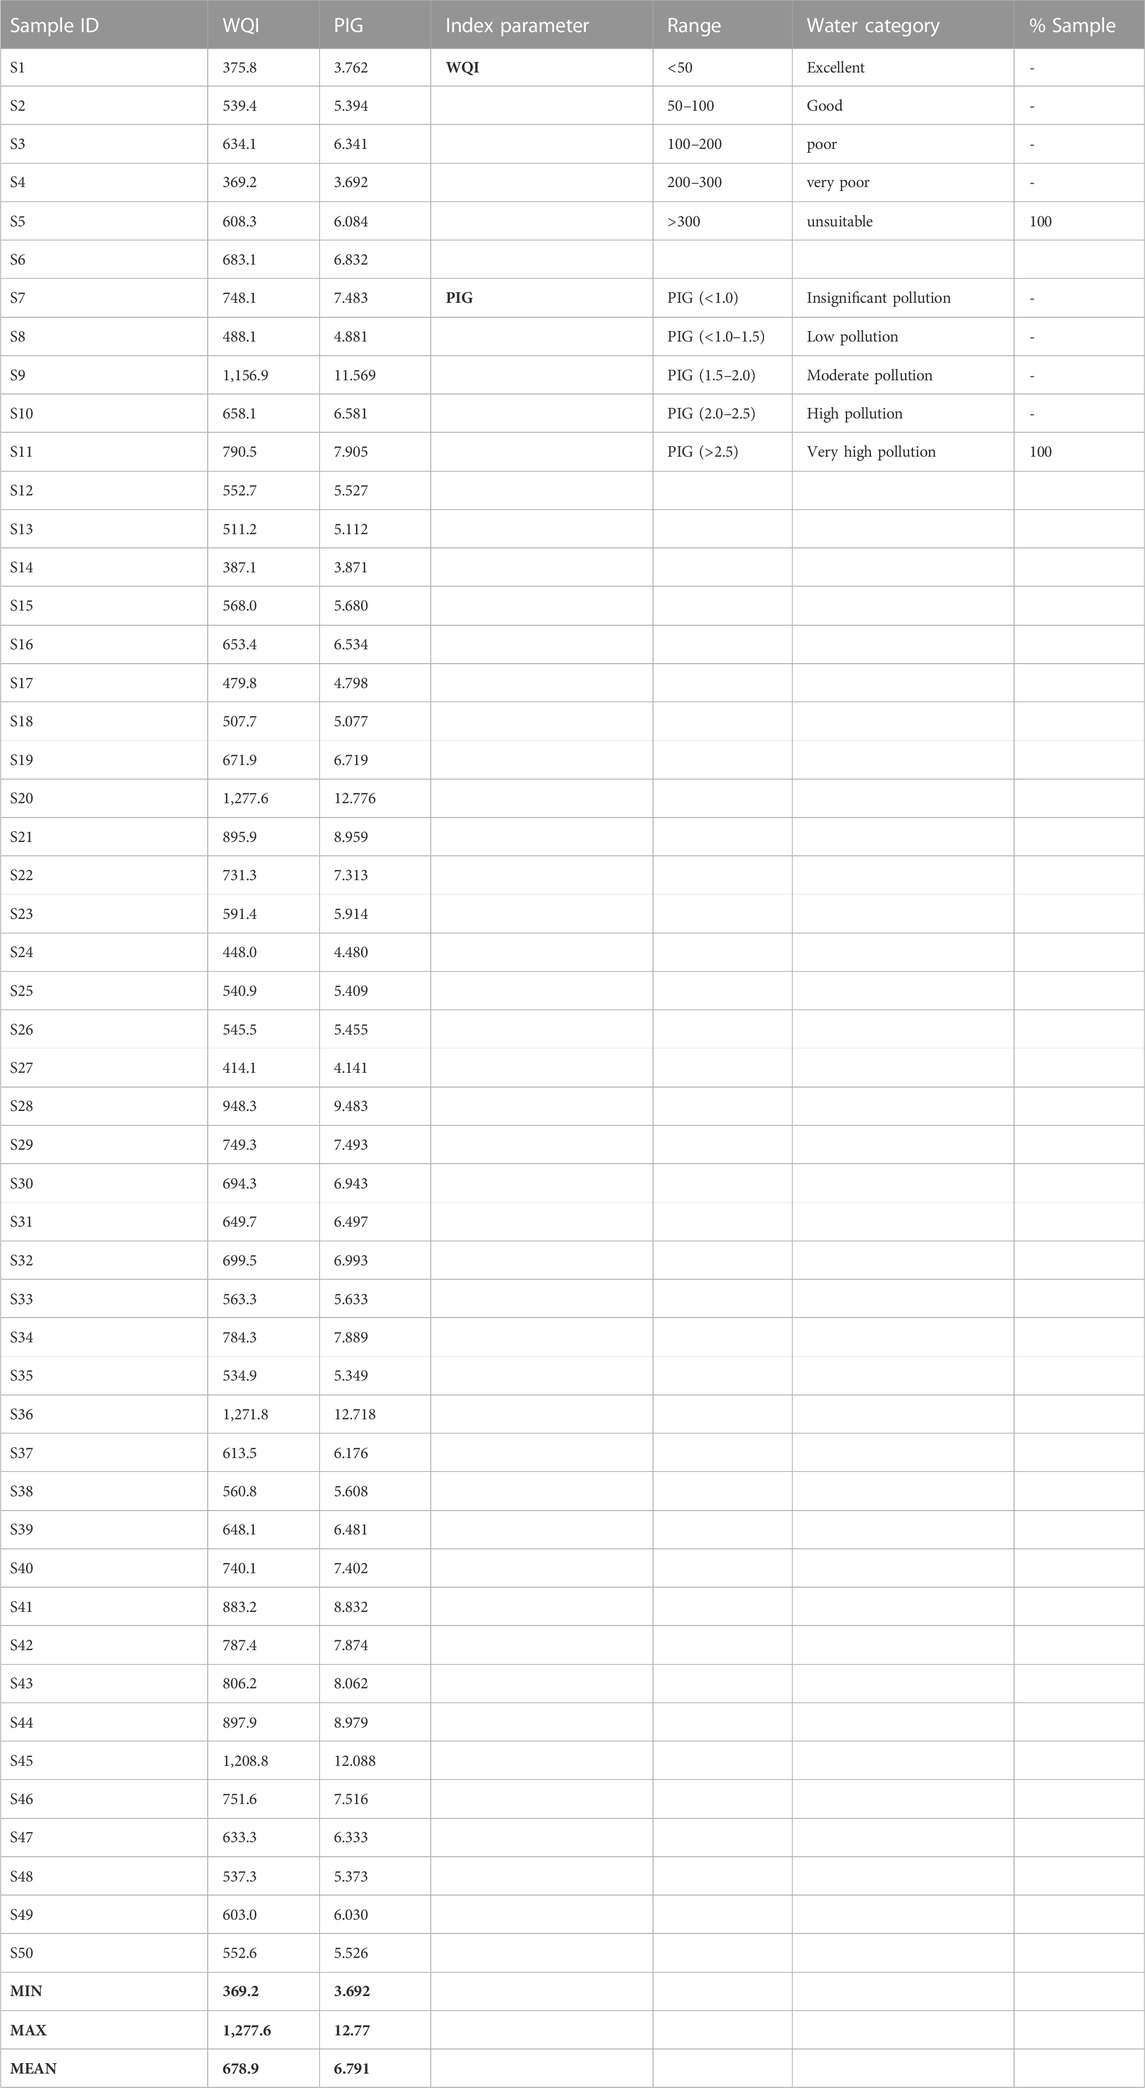
TABLE 5. Summary statistical results of WQI and PIG and their rating scale.
3.2.2 Water quality index
Table 5 shows the summary statistical results of WQI as well as their rating scale. The WQI results ranged between 369.2 and 1,277.6 with an average value of 678.9. The WQI classification criteria have been given as WQI <50 (excellent drinking water quality), WQI = 50–100 (good drinking water quality), WQI 100–200 (mild pollution or poor drinking water quality), WQI 200–300 (very poor drinking water quality); WQI >300 (unsuitable or critical drinking water condition) (Ukah et al., 2019). Following this classification index, all the groundwater samples appear to fall under unsuitable or critical drinking water conditions. The results of the WQI seem to be commensurate perfectly with those of PIG. Hence, the integration of the two models in this study validates each other in water quality analysis, and as such are considered good tools for water quality prediction.
3.3 Irrigation water quality assessment
A comprehensive assessment of the irrigation water quality was carried out by computing various irrigation parameters (MH, SAR, Na, RSC, KR, EC, PS, PI). The parameters were then combined to evaluate the joint influences from various chemical parameters on crop productivity. Previous studies have focused only on the evaluation of individual irrigation water quality parameters (Unigwe et al., 2022), it is thought that integrating the various irrigation water quality parameters will provide adequate information that will aid in the proper management of soil and irrigation water for enhanced agricultural productivity (Subba Rao, 2018).
3.3.1 Sodium adsorption ratio and salinity
The SAR is used to evaluate the amount of monovalent sodium (Na+) that is replaced by divalent ions, such as such Ca2+ and Mg2+. It is derived from the ratio of sodium hazard in irrigated water and its effect on soil. The soil structure can be affected by variations in ionic strength which is a function of dissolved ions in irrigation water. This variation can be depicted by the electrical conductivity values of the irrigation water (Aravinthasamy et al., 2019). Hence, the U.S Salinity Laboratory diagram (USSL, 1954) which combines the composite effects of SAR (S) and EC (C) on crop yield can be used for a comprehensive assessment of the effect of ionic strength on crop yield (Figure 2). According to the USSL (1954) classification criteria, the salinity hazard (C), can be grouped into four sub-zones: C1: <250 μS cm-1 (low salinity hazard), C2: 250–750 μS cm-1 (medium salinity hazard), C3: 750–2,250 μS cm-1 (high salinity hazard), and C4: >2250 μS cm-1 (very high-salinity hazard), with each group depicting good, poor moderate, and very poor water quality types respectively. On the other hand, sodium hazard (S), can be grouped into four sub-zones: S1: <10 (low sodium hazard), S2: 10–18 (medium sodium hazard), S3: 18–26 (high sodium hazard), and S4: >26 (very high sodium hazard), represented as good, poor, moderate, and very poor water quality types, respectively. Based on this classification chart, a total of 48 groundwater samples (96%) recorded a high salinity hazard (C3), while a very high salinity hazard (C4) was recorded in two samples (4%) (Table 6). It can therefore be depicted from Figure 2 that 96% of the water samples occurred within the C3-S3 zone (high salinity and high sodium hazard zone), while 4% occurred within the C3-S4 zone (high salinity and very high sodium hazard zone). According to Subba Rao (2017); Subba Rao (2018), the use of this water for irrigation will be unsuitable, especially when being used in soils with poor drainage. Even if the soil has good drainage capacity, special management approaches will need to be put in place to reduce the salinity (Aravinthasamy et al., 2019).
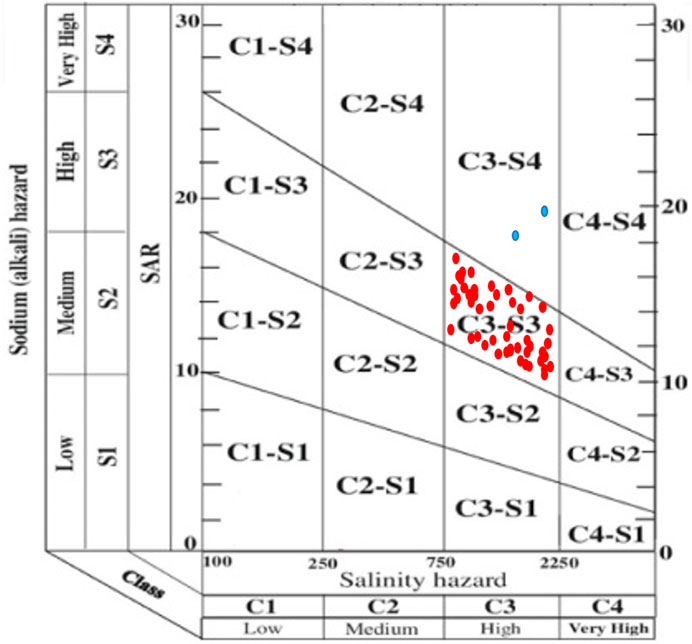
FIGURE 2. Irrigation water classification based on United States Salinity Laboratory diagram (USSL 1954).
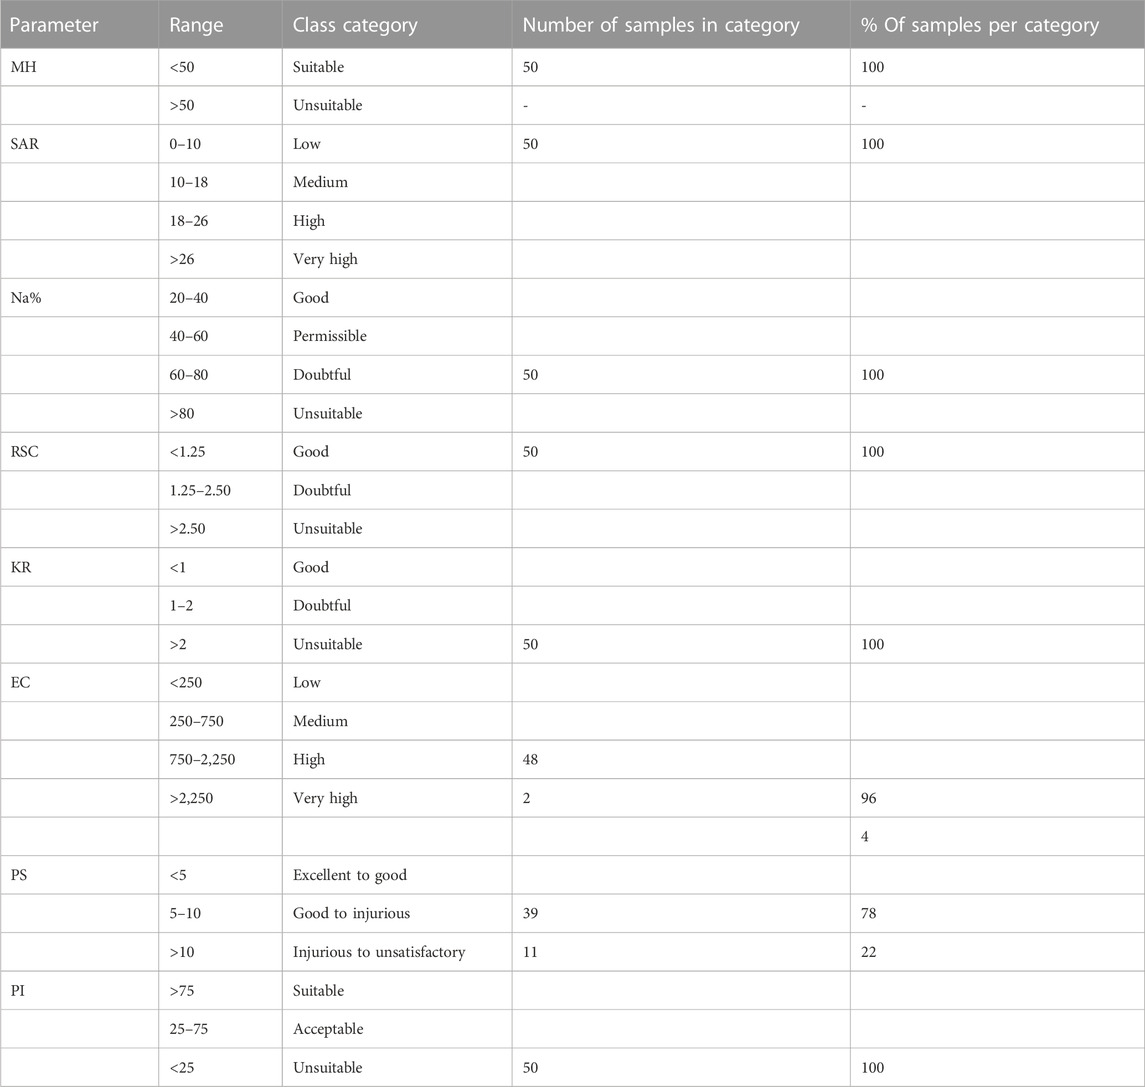
TABLE 6. Classification criteria of irrigation water quality parameters (in meq/L).
3.3.2 Sodium percent and salinity
Percent Na is evaluated as the increase in monovalent sodium ion (Na+) in irrigation water resulting from the ionic exchange occurring between divalent cations (Mg2+ and Ca2+) (Mohammed et al., 2017). The resultant increase in sodium ions in irrigation water can result in the formation of bicarbonates (HCO3−) and other precipitates in the soil. Through combination reaction, sodium ions can react with precipitates (CaCO3) to produce NaCO3 in the soil phase (Kumar et al., 2009). The occurrence of NaCO3 in the soil can lead to reduced permeability in soil, which can lead to stunted growth in plants (Ayers and Westcot, 1985; Todd and Mays, 2005). According to the classification scheme in Table 6, irrigation water quality based on sodium percent is grouped into five categories: excellent (Na% < 20), good (Na% 20–40) permissible (Na% 40–60), doubtful (Na% 60–80) and unsuitable (Na% > 80) as per Ayers and Westcot (1985). Accordingly, 100% of the water samples fall under the “doubtful” category. The Wilcox plot is used to show the relationship between the percent sodium and the electrical conductivity of water. According to the Wilcox plot (Figure 3), all the groundwater samples occur within the doubtful to unsuitable zone. The implication of this regarding the irrigation suitability assessment of Firozabad is that the increased sodium hazards from the exposure of the groundwater sources to contaminant influx will result in reduced crop yield in the area over time unless remedial measures are put in place.
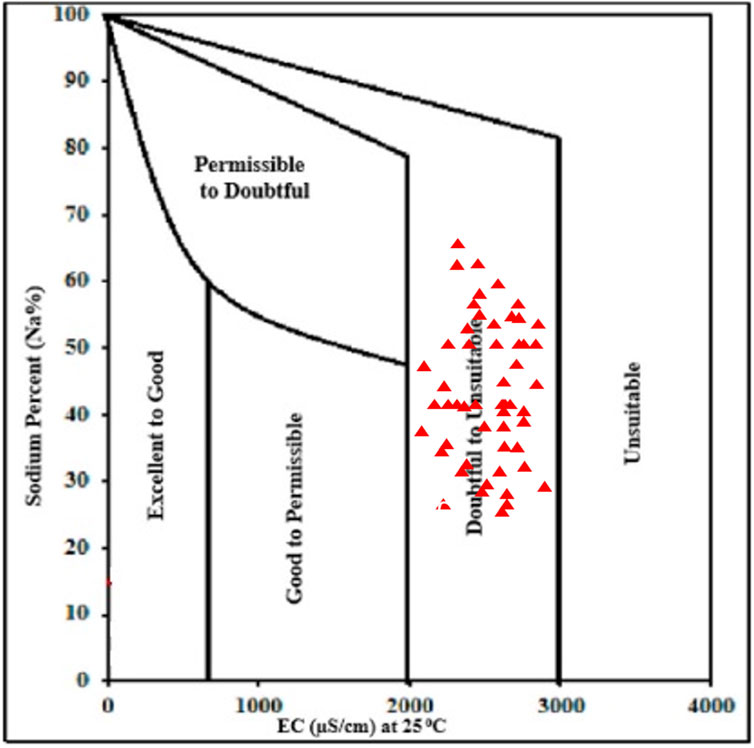
FIGURE 3. Irrigation water classification based on Wilcox diagram.
3.3.3 Magnesium hazard
MH depicts the level of elevated dissolved Mg2+ in irrigation water that may cause a reduction in crop yield. Based on the Ayers and Westcot (1985) classification scheme (Table 6), 100% of the water samples are suitable for irrigation based on magnesium hazard.
3.3.4 Permeability index
The PI evaluates the irrigation water quality based on the percentage of dissolved cations and anions in water (Ca2+, Mg2+, Na+) and anions (Cl−, HCO3−) in water (Donean, 1964). These dissolved chemical species are known to influence the permeability of soil (Unigwe C. O. et al., 2022). According to the Doneen (1964) classification criteria, proposed three water quality categories can be obtained based on the PI: Class I (100%), class II (75%–100%), class III (25%–75%), and class IV (<25%), with each class depicting excellent, good, doubtable, and unsuitable water quality classes respectively. Accordingly, in the present study, the PI varied from 2.97 to 4.05 with a mean value of 3.48 (Table 7). Based on the PI classification scheme (Table 6), 100% of the water samples are unsuitable for irrigation (class 1V).
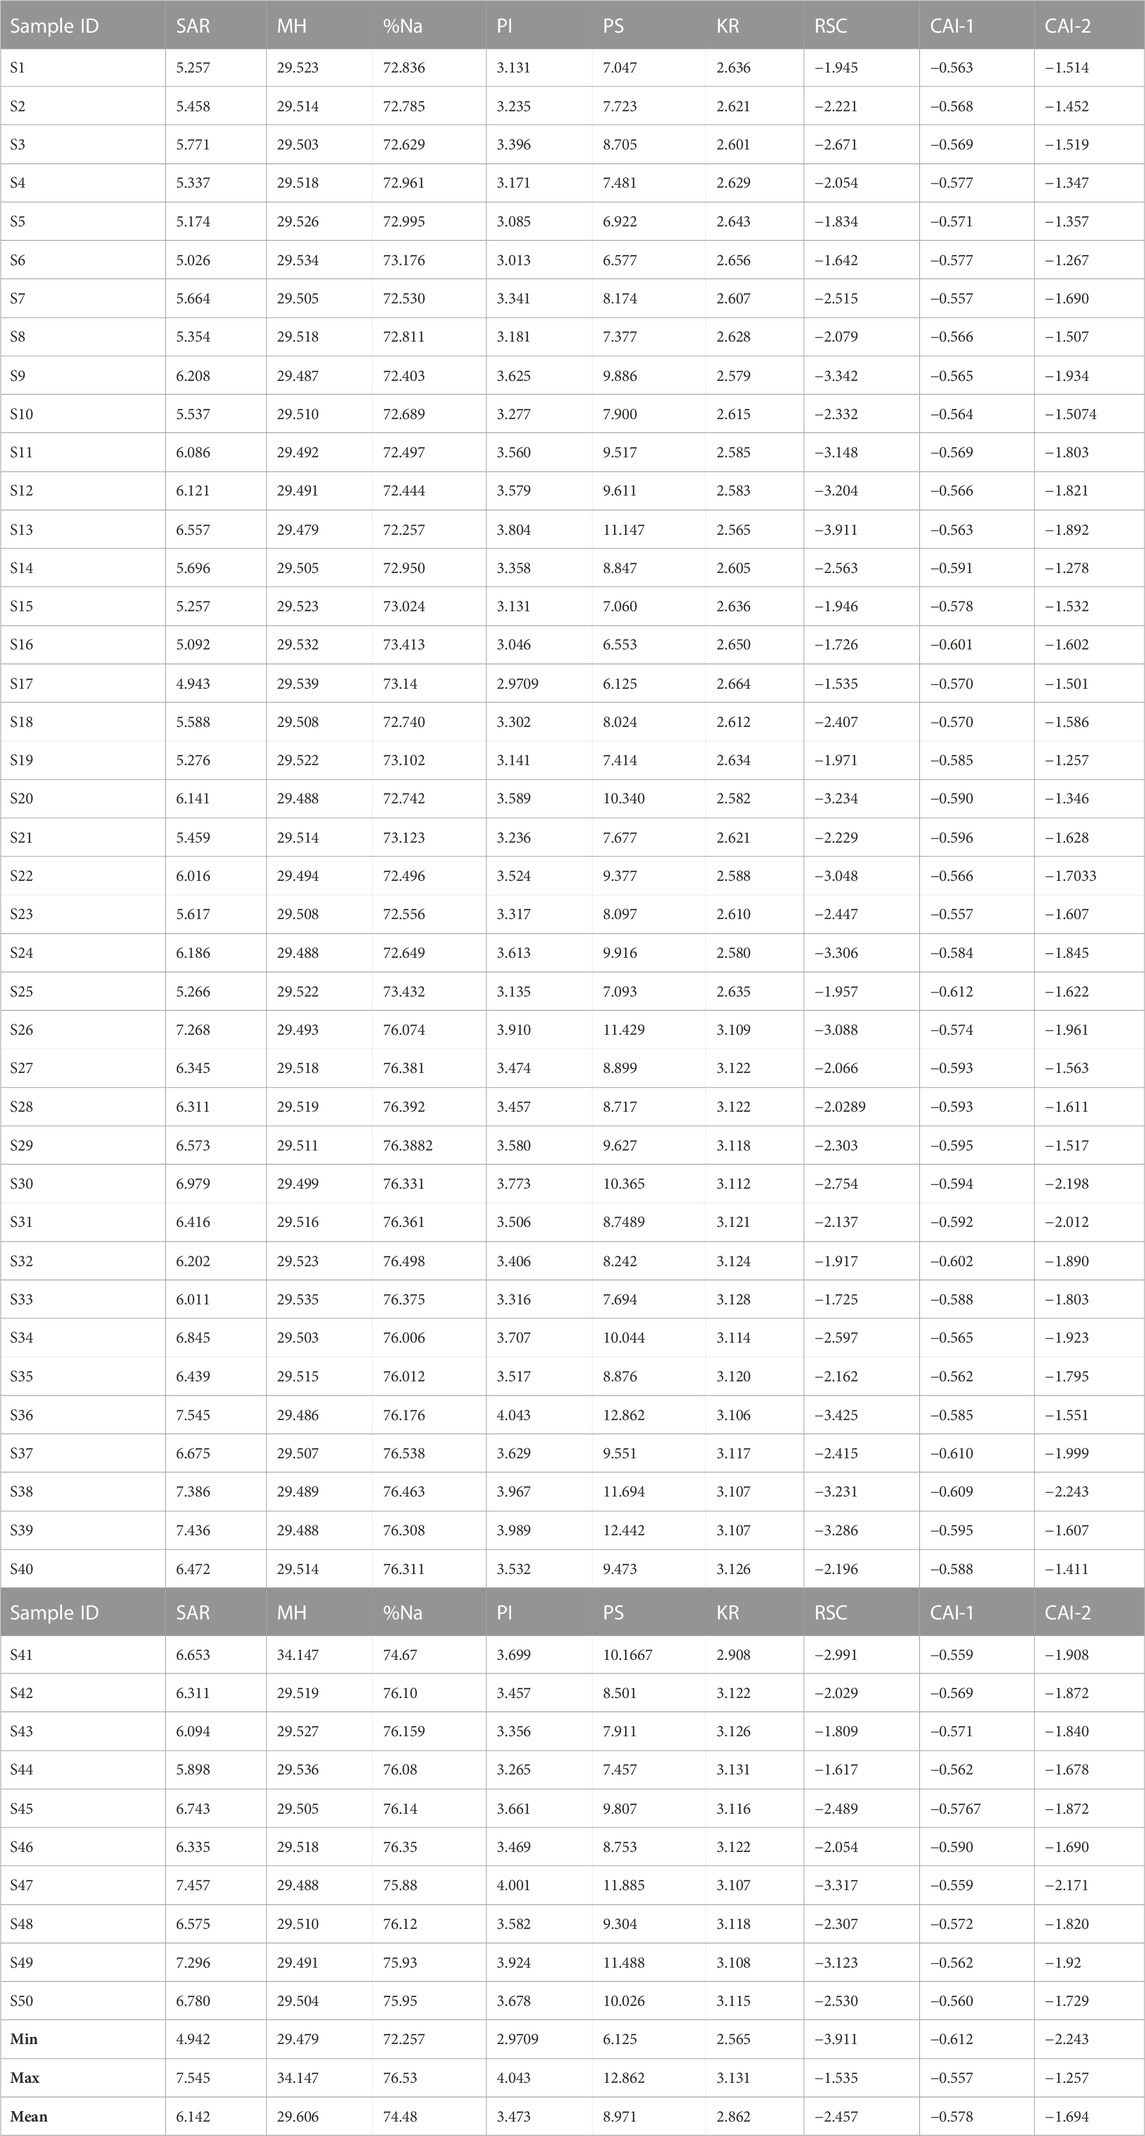
TABLE 7. Overall results of all irrigation water quality parameters (measured in meq/L).
3.3.5 Kelly’s ratio
Kelly’s ratio is a measure of monovalent Na+ ions against divalent Ca2+ and Mg2+ ions concentration irrigation water (Kelly 1940). According to the index, if the KR is greater than 2, it indicates an excess concentration of Na+; depicting unsuitable water for irrigation. On the other hand, KR less than two is indicative of low Na+ concentration in irrigation water. In the present study, KR ranged between 2.57 and 3.14 with an average value of 2.87 (Table 7). Following KR classification criteria (Table 6), all the water samples are unsuitable for irrigation.
3.3.6 Residual sodium carbonate
The RSC is used to evaluate the alkalinity hazard in the soil as a result of poor irrigation water quality. The index determines the elevated amount of dissolved Ca2+ and Mg2+ ionic species in water and their effect on irrigation water quality (Raghunath, 1987; Singh et al., 2019). According to this index, when the sum of bicarbonates and carbonates in water occurs in a concentration below that of Calcium and Magnesium, there is a likelihood of the excess precipitation of Ca2+ and Mg2+ in water which may impede crop yield when used for irrigation. Based on the RSC classification scheme, RSC <1.25 indicates suitable water; RSC = 1.25–2.5 indicates doubtful water and RSC> 2.5 signifies unsuitable water for irrigation (Raghunath, 1987). RSC for the present study varied between −3.93 and −1.55 with an average value of −2.46 (Table 7). Based on RSC classification criteria, all the water samples occur within the “good” category for irrigation water quality. The recorded negative RSC values observed in the present study are indicative of incomplete precipitation of divalent Mg2+ and Ca2+ in water. The incomplete precipitation of these ions in water occurred as a result of opposing the concentration of the ions which posed little or no threat to Na+ concentration in the water (Unigwe C. O. et al., 2022).
3.3.7 Chloro-alkaline index
The ionic exchanges occurring in water can be determined using the Chloro-alkaline indices (CAI-1 and CAI-2). The occurrence of chemical elements in water can be influenced by the ionic exchanges occurring between dissolved ions in water; and this may influence their interaction in the soil phase (Egbueri et al., 2021; Omeka et al., 2022b). Ion exchange occur in two phases-forward ion exchange (negative exchange) and reversed ion exchange (positive exchange). According to Schoeller (1967), the forward ion exchange involves the replacement of the monovalent ions (K+, Na+) with divalent ions (Ca2+, Mg2+). The reverse ion exchange process on the other hand is the displacement of alkaline-earth metals (Mg2+, Ca2+) by alkali metals (K+ and Na+) within the aquifer system. In the present study, the CAI-1 ranged from −0.61 to −0.55, with a mean value of −0.57, while CAI-2 ranged between −2.24 and −1.25 with an average value of −1.69 (Table 7). The results from the present study indicate that the reversed ion exchange appears to be the prevalent ion exchange process occurring within the groundwater aquifer system.
3.3.8 Potential salinity
The PS was developed by Doneen (1961) and explains the number of salts in irrigation water that are likely to accumulate in soil from irrigation. Over time, these salts tend to accumulate in concentration that may enhance their concentration in the soil phase (Singh et al., 2019). The index is represented as the concentration of Cl− plus half of SO42-. According to the PS index, PS < 5 is indicative of excellent to good water for irrigation; PS 5–10 indicates good to injurious irrigation water quality; PS > depicts injurious to unsatisfactory (Doneen 1961). Accordingly, the calculated PS for the present study varied between 6.13 and 12.87 averaging at 8.98 (Table 7). Based on the PS classification chart, 39 of the groundwater samples (78%) occur within the “Good to injurious” category while 11 of the analyzed groundwater samples (22%) are within the “Injurious to unsatisfactory” category (Table 6).
3.4 Health risk assessment
A comprehensive health risk assessment was carried out for all the analyzed groundwater samples used for drinking purposes. Health risk assessment was carried out for nitrate and fluoride. These elements were selected based on their elevated concentration among the analyzed groundwater samples, their release into the environment through intensive agricultural activities from the use of agrochemicals, their high anthropogenic variance (they occur from both point and non-point sources), and their high human health toxicity hazard. According to The National Research Council (NRC, 2001), long-term ingestion of fluoride in drinking water, at a concentration greater than 1.5 mg L-1 is known to be responsible for dental fluorosis. High nitrate ingestion in drinking water has been associated with life-threatening illnesses like methemoglobinemia (blue baby syndrome) and stomach cancer (Dehghani et al., 2019; Okamkpa et al., 2022).
The health risk assessment was carried out bearing in mind the population likely to be vulnerable to toxic element ingestion and dermal contact. To this end, three population sizes (male, female, and children) were considered in the risk assessment. Accordingly, two exposure pathways-ingestion (oral) and dermal contact were considered. This was done following the United States Environmental Protection Agency risk assessment criteria (US-EPA, 1989; 2017). Results of the hazard index for the three population sizes and exposure pathways are presented in Tables 8–10. To have a visual appraisal of the risk levels of these elements in the groundwater within the Firozabad city, a spatial distribution risk map was generated for Nitrate and fluoride for the three population sizes (Figures 4–7). Having a visual appraisal of the risk and hazard exposure levels in the area will aid decision-makers and water managers alike in futuristic water quality monitoring and assessment.
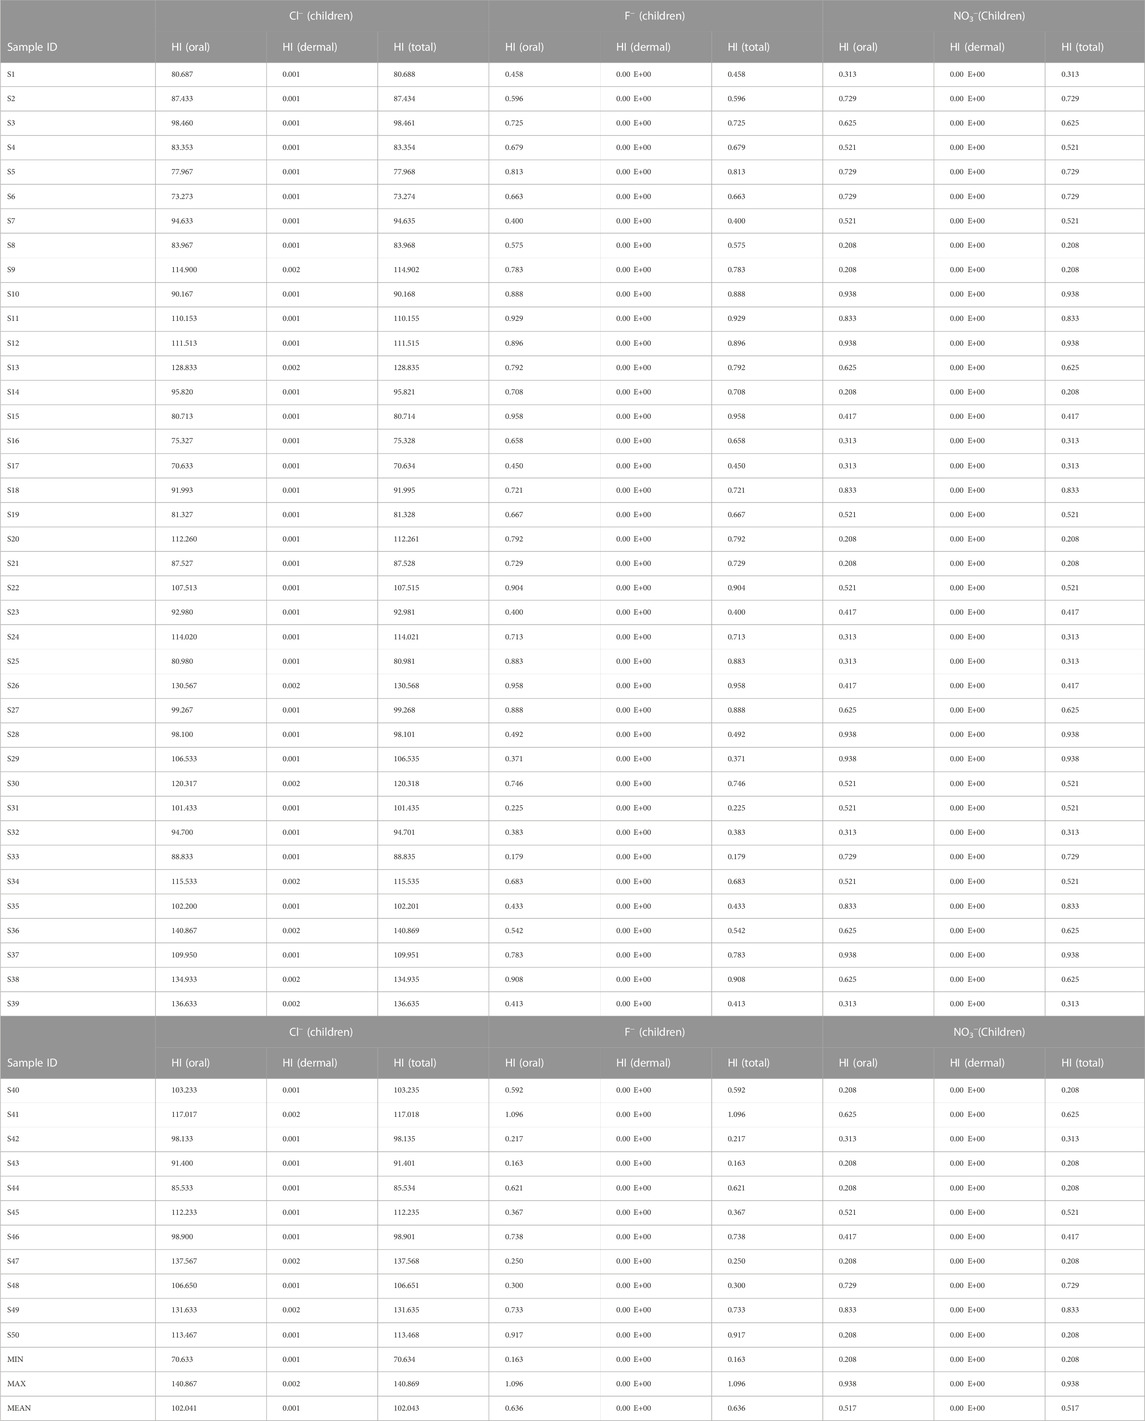
TABLE 8. Results of Chloride, fluoride and Nitrate health risk assessment for children population.
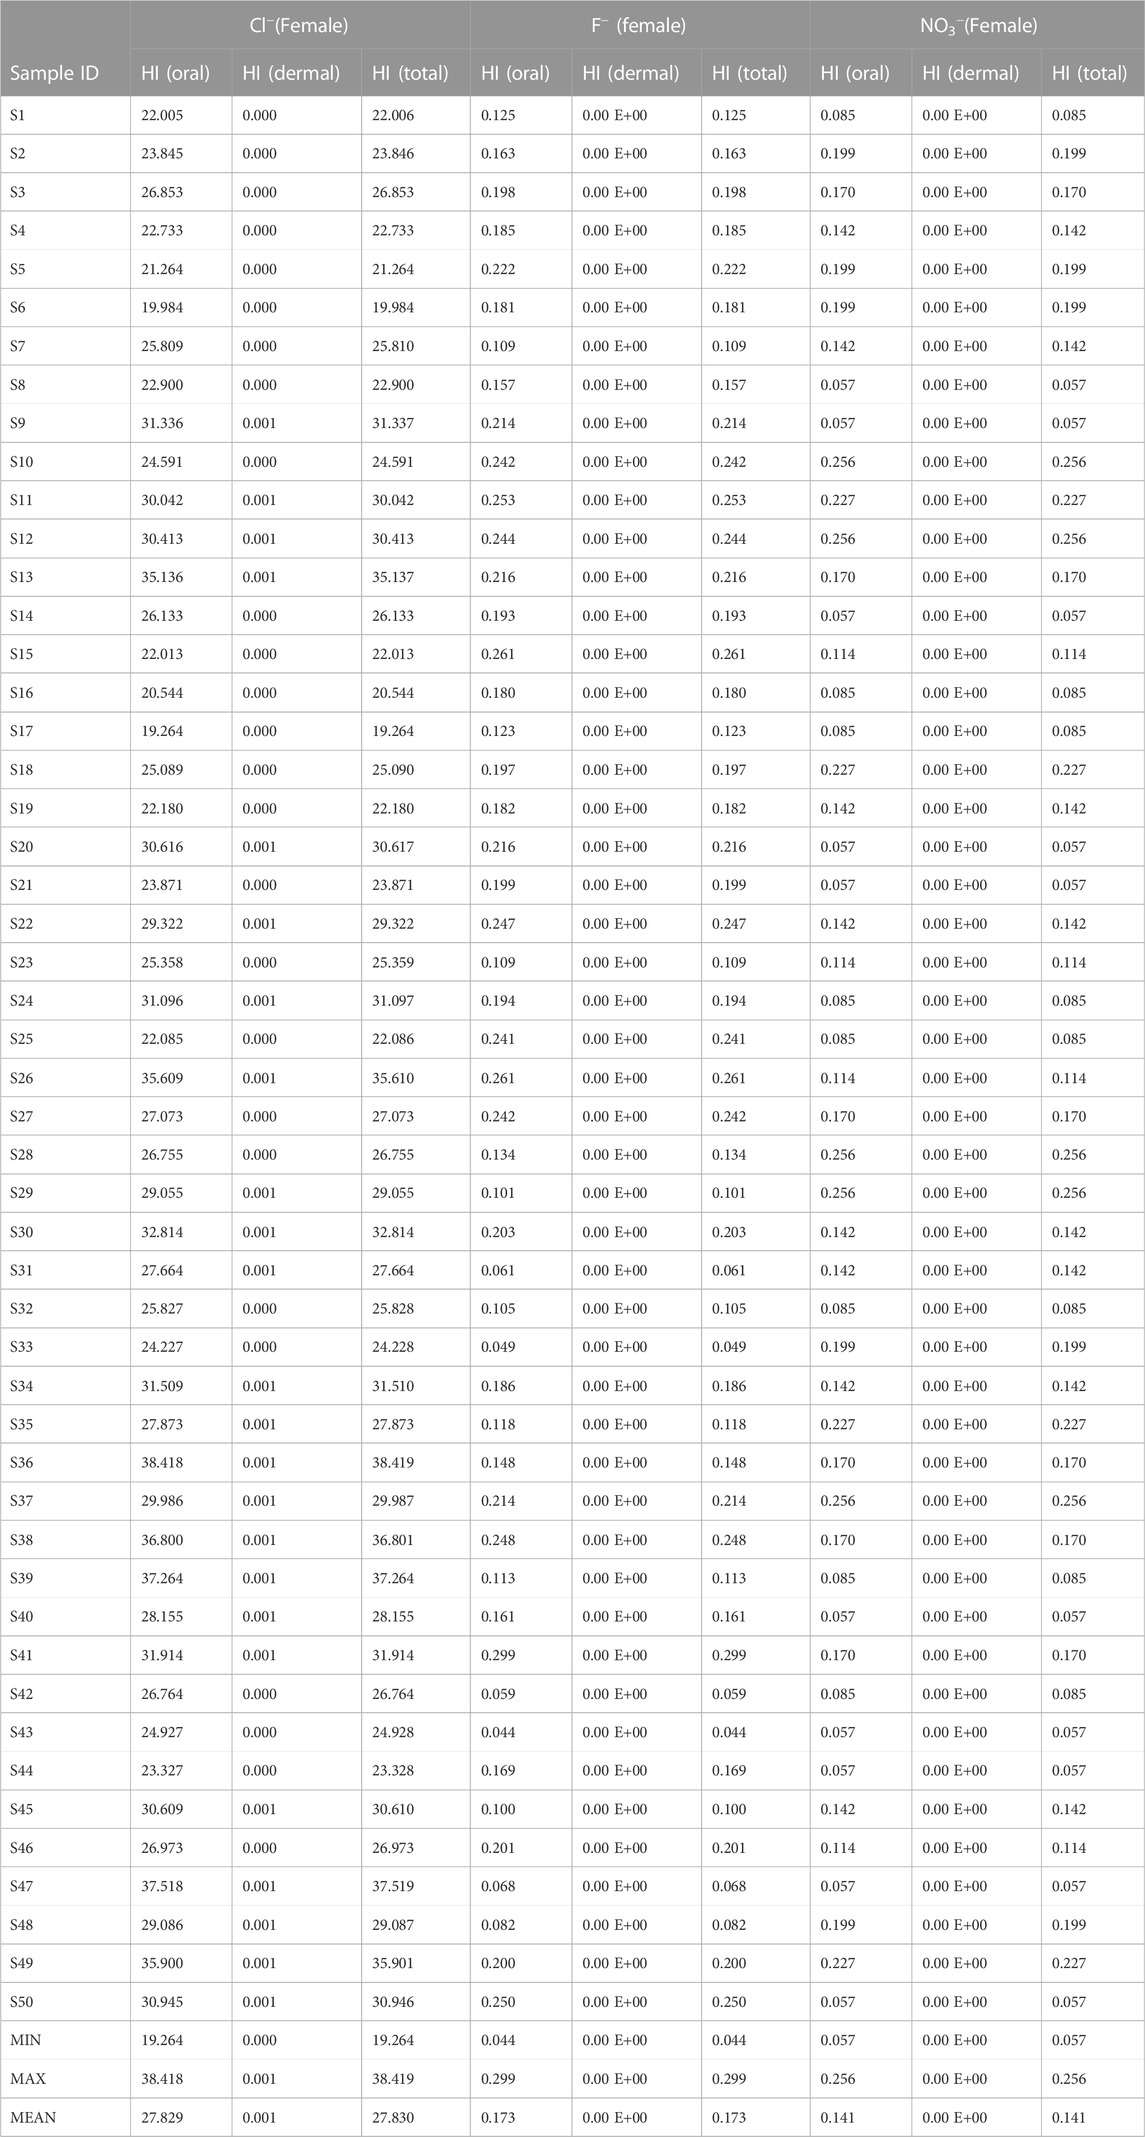
TABLE 9. Results of Chloride, fluoride and Nitrate health risk assessment for Female population.
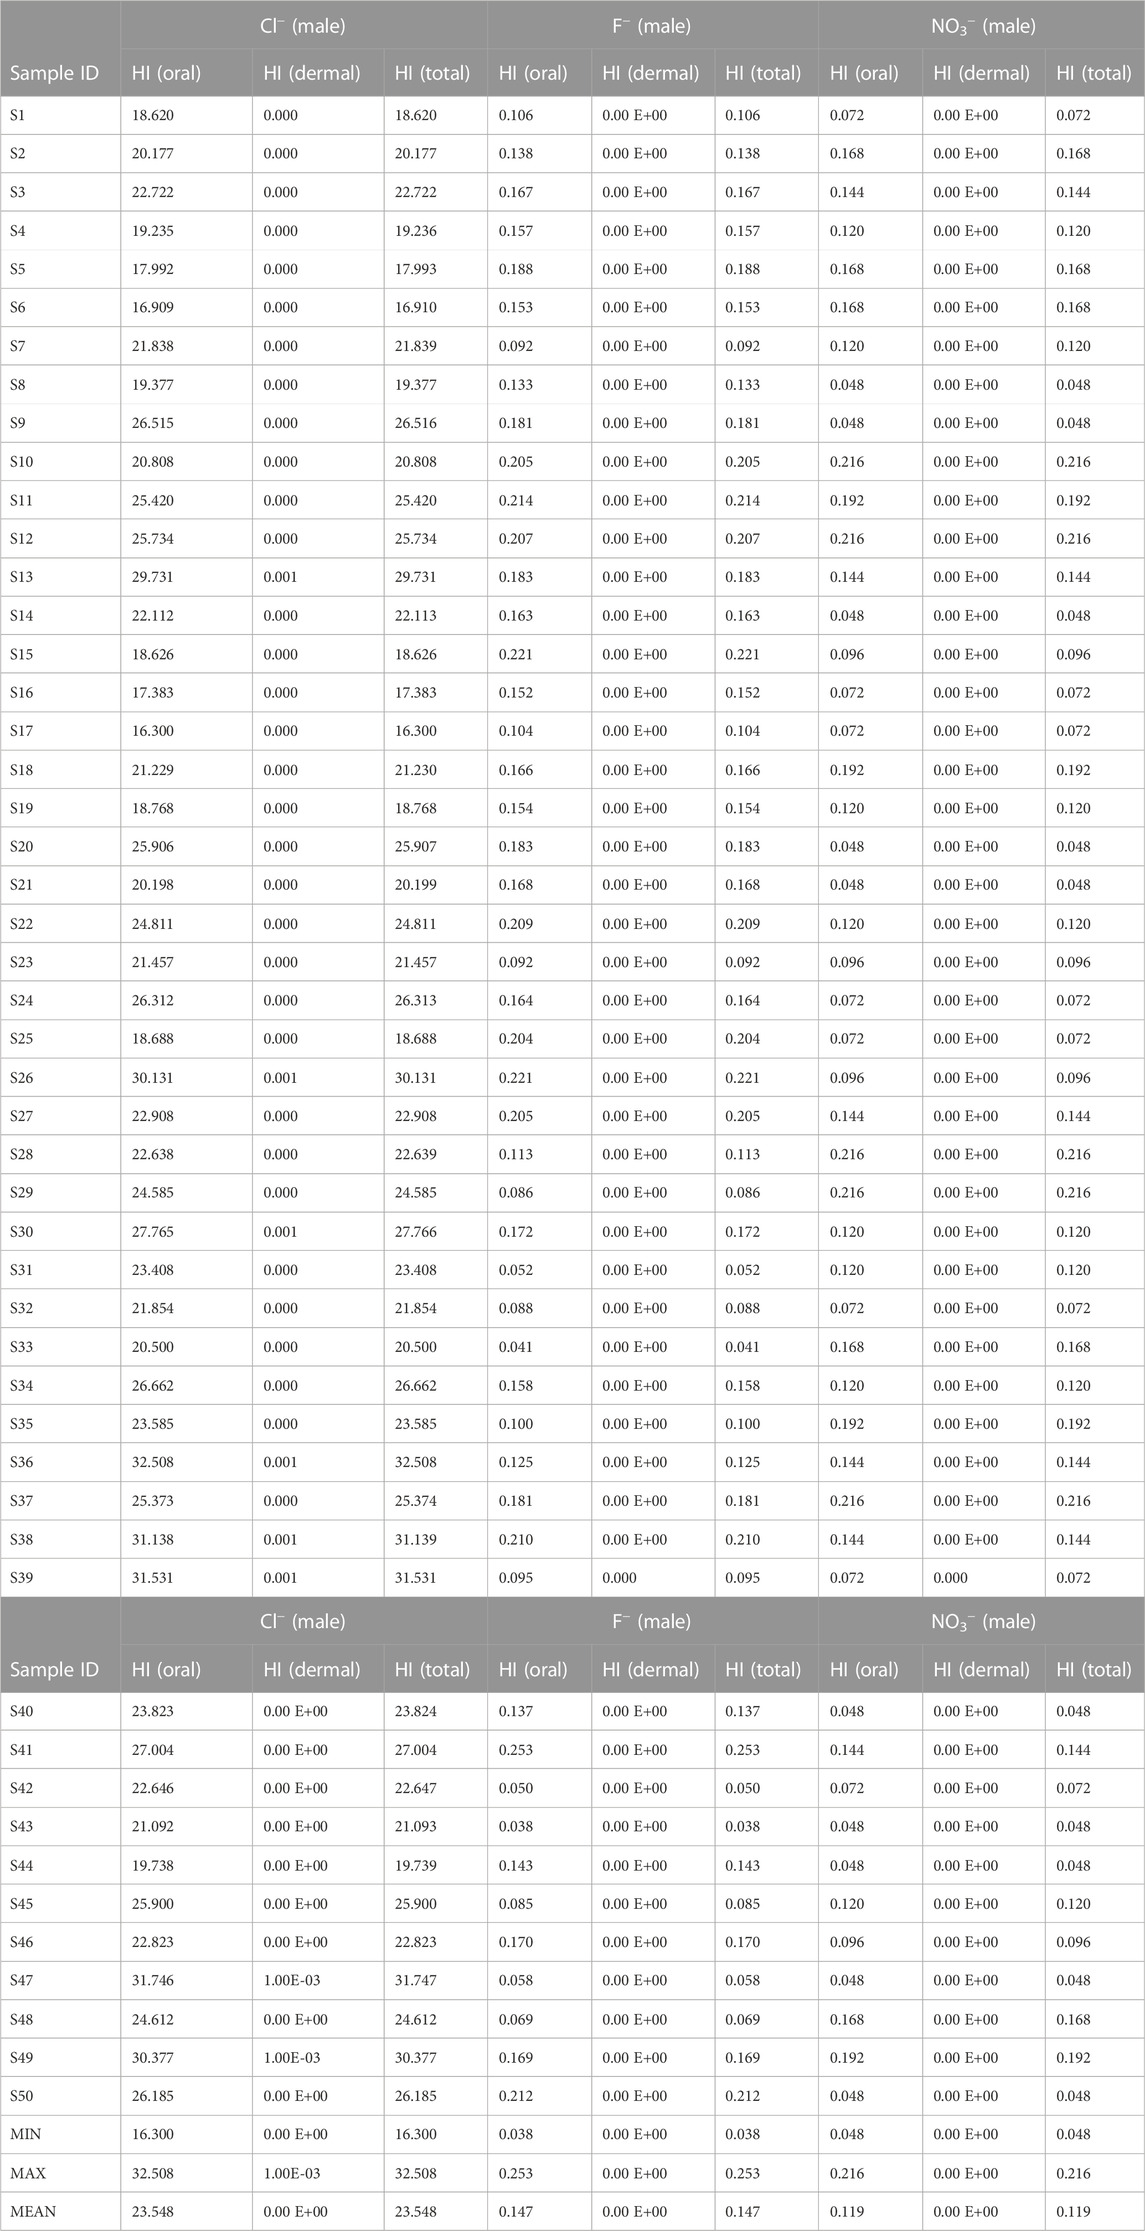
TABLE 10. Results of Chloride, fluoride and Nitrate health risk assessment for Male population.
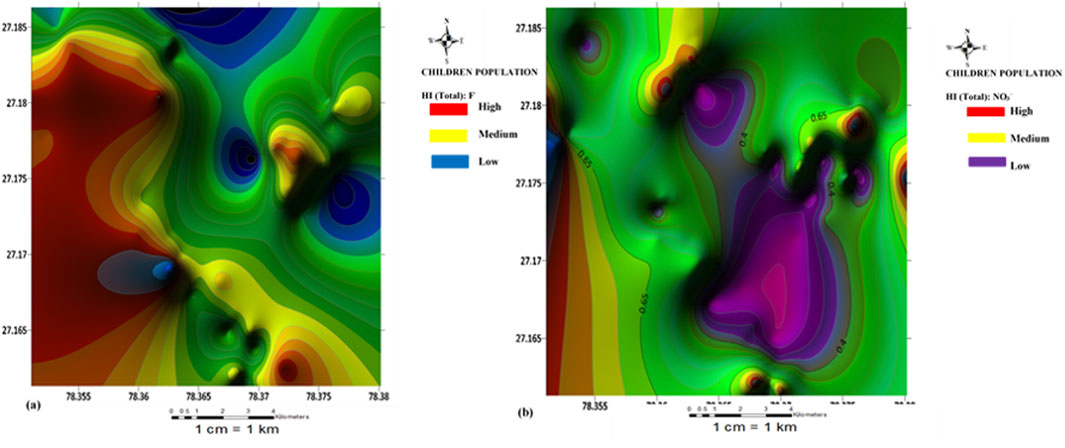
FIGURE 4. Spatial distribution health risk map of (A) fluoride and (B) nitrate risk for children population.
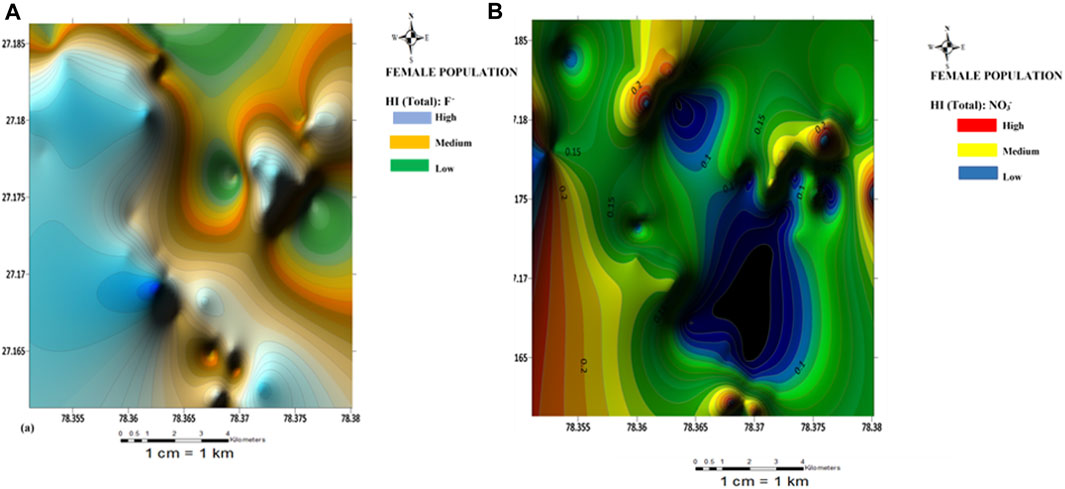
FIGURE 5. Spatial distribution health risk map of (A) fluoride and (B) nitrate risk for female population.
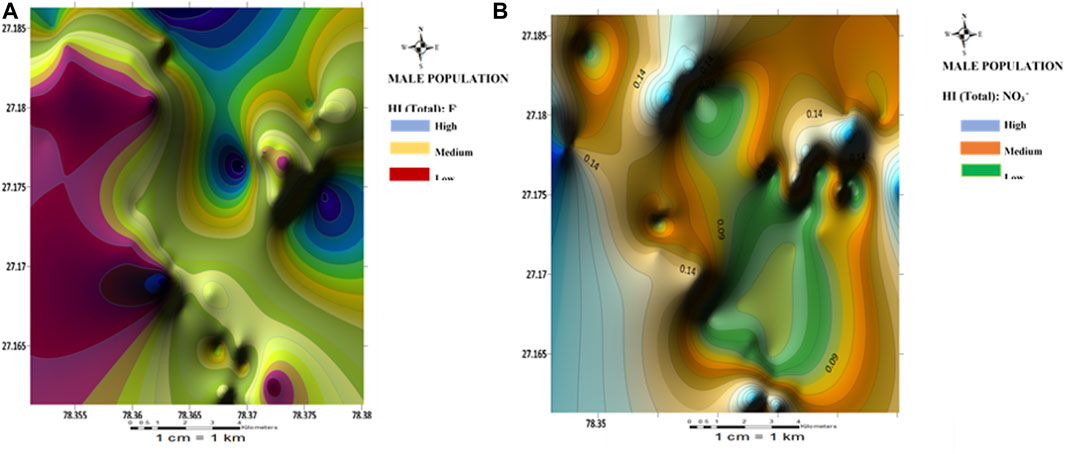
FIGURE 6. Spatial distribution health risk map of (A) fluoride and (B) nitrate risk for male population.
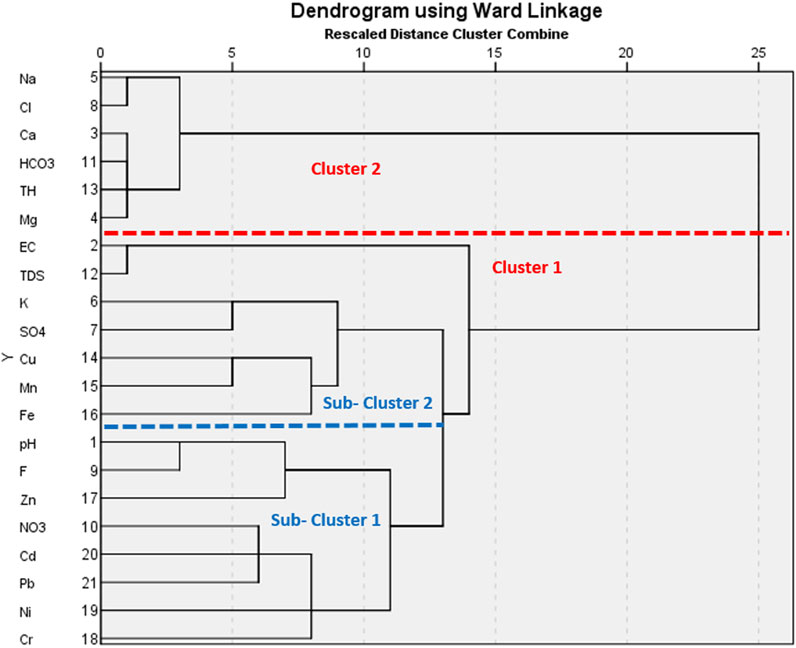
FIGURE 7. A dendrogram representing the cluster groupings of the groundwater samples based on WQI and PIG.
3.4.1 Nitrate health risk assessment
Results of the health risk assessment for the three population sizes are shown in Tables 8–10. Additionally, spatial maps were also generated based on the results of the Hazard index (HI(Total)) and presented in Figures 4–6. For the children population, the HI(Oral) ranged from 0.20 to 0.93 with a mean value of 0.51; the HI(dermal) all occurred at a negligible value (±0.00 E+00). For the female population, the HI(oral) ranged from 0.05 to 0.25 with a mean of 0.14; the HI(dermal) were all negligible (±0.00 E+00). However, for the male population, the HI(oral) ranged from 0.04 to 0.21 averaging at 0.11. Similarly, the HI (dermal) were all negligible values (±0.00 E+00). The results of the hazard index for all the population sizes have shown that the health hazards from dermal contact are at a very negligible level. The implication of this is that nitrate health risk from the consumption of groundwater in this study area is more associated with oral intake (ingestion) than dermal contact. As such, they are low nitrate risks from the use of water for bathing than drinking across all population sizes in the study area, although all the water samples appear to be within the safe water category based on nitrate concentration (US-EPA, 2017). According to the US-EPA (1989), HI < 1 signifies safe water while HI > signifies an adverse health risk to human health.
The HI(Total) values for the children population ranged from 0.20 to 0.93 with a mean of 0.51; for the Female population, it ranged from 0.05 to 0.25 with a recorded mean of 0.14. However, for the male, it varied between 0.048 and 0.216 with a mean of 0.19. Based on the overall HI results for nitrate, the risk level for three population sizes decreased in the order of children > female > male. This implies that over time the children population will be more susceptible to nitrate health risks (from drinking and bathing) than the adult population. This has been attributed to the lower body weight of children compared to adults (Rahman et al., 2021).
Spatial maps of nitrate health risks based on the HI (total) values for children, females, and males are shown in Figures 4B–6B. From the spatial maps, nitrate health risk appears to increase in the south-western parts of the study area, with some parts of the north-eastern parts showing increased risk levels. The increased risk levels towards the south-western parts can be attributed to the dominant flow trend within the study area. It must be noted that the groundwater flow map showed the groundwater to increase towards the south-western direction of the area. Hence, it is expected that contamination risks from nitrate pollution will also follow the same trend. The implication of this is that if remedial measures are not put in place to curb anthropogenic inputs of nitrate through the regulation of agricultural activities (such as the indiscriminate use of agrochemicals), water sources within the south-western parts of the area will continue to be at a deplorable state due to nitrate contamination, hence making water sources within this region unsuitable for both drinking and bathing.
3.4.2 Fluoride health risk assessment
The HI (oral) for the children population ranged from 0.16 to 1.09 with a mean value of 0.63; Fluoride health risk assessment: the HI (dental) range for the female population, were all negligible (±0.00 E+00). For the Female population, the HI(oral) varied from 0.04 to 0.29 with a mean of 0.17; the HI(dermal) were all negligible (±0.00 E+00). For the male population, however, the HI(oral) varied from 0.03 to 0.25 with a mean value of 0.14; the HI(dermal) were all negligible (±0.00 E+00). The results of fluoride health risks appear to be similar to those obtained for nitrate, with nitrate health risks from the consumption of groundwater appearing to be more associated with oral intake (ingestion) than dermal contact. A slight contrast was observed for the HI(oral) values for the children population. One sample (S41) showed HI values >1 (adverse human health risk). Higher risk values of fluoride were also observed for the children compared to the adult population. Implying that children around the Firozabad city will be more prone to dental fluorosis from the intake of water. From the spatial distribution maps for fluoride health risk for the children, female and male populations, fluoride risk appears to increase towards the north-western parts of the study area with considerable high-risk levels also found in patches around the southern and east-central parts of the study area (Figures 4A–6A). The variability of fluoride risks within the area can be highly attributed to the groundwater flow movement. This agrees with information obtained from the groundwater flow map. Hence, it can be agreed the use of the groundwater flow map in the visual assessment of groundwater is highly efficient.
3.4.3 Chloride health risk assessment
Results of the chloride health risk assessment are presented in Tables 8–10. As observed, very high hazard index (HIoral) values (HI > 1) are observed for all the water samples for all the population sizes. The high chloride content in the water can be attributed to inputs from untreated wastewater from the glass industry within the area. For the children population, the HI(oral) varied between 70.6 and 140.8 with a mean of 102.4; HI(dermal) ranged from 0.001 to 0.002 with a mean of 0.001. For the female population, the HI(oral) ranged from 19.264 to 38.418 averaging at 27.8; HI(dermal) ranged from 0.00 to 0.01 with a mean of 0.01.
3.5 Multivariate statistical analysis
3.5.1 Principal component analysis
Table 11 shows the unrotated principal component scores for both physicochemical and heavy metals of the analyzed groundwater samples. The principal component analysis was carried out to evaluate the relationship existing between the analyzed groundwater parameters, as well as validate the results of the physicochemical and heavy metals (Wagh et al., 2020). Data standardization was done based on the Kaiser (1960) normalization criterion where only component classes with eigenvalues ≥1 is considered significant. Accordingly, component loadings of <0.50 were considered low, those between 0.50 and 0.75 were considered medium while loadings >0.75 signified high loadings (Cui et al., 2011; Omeka et al., 2022a). A total of eight principal components (PCs) were extracted accounting for 79.78% of the overall data variance. The high number of extracted components observed from the results is an indication of high variability in the geochemical composition of the groundwater (Krishna-Kumar et al., 2014; Okamkpa et al., 2022). PC1 (with 29.271% variance) showed high positive significant loadings for Ca2+, Mg2+, Na+, Cl2− , HCO3−, and TH. This component class indicates that the chemical weathering and dissolution of major cations (Ca2+, Mg2+, Na+) and anions (HCO3−) within the groundwater aquifer system were major contributors to the groundwater hardness. The high significant loading observed for Cl− in this component class signifies that the source of contamination in the groundwater was from both geogenic and anthropogenic influxes. The occurrence of Cl− can be attributed to leaching from fertilizer application. PC2 which accounted for 11.17% of the total variance, showed positive significant loadings for EC and TDS and a significant negative loading (-0.552) for Cu. The implication of the loadings expressed in this component class is that the observed high conductivity of the water was influenced by the total dissolved species in the groundwater. The significant negative loading observed for Cu implies that the occurrence of Cu in the groundwater was from a different source from other elements. Cu may have been sourced from the leaching of solid waste materials and agricultural effluents.
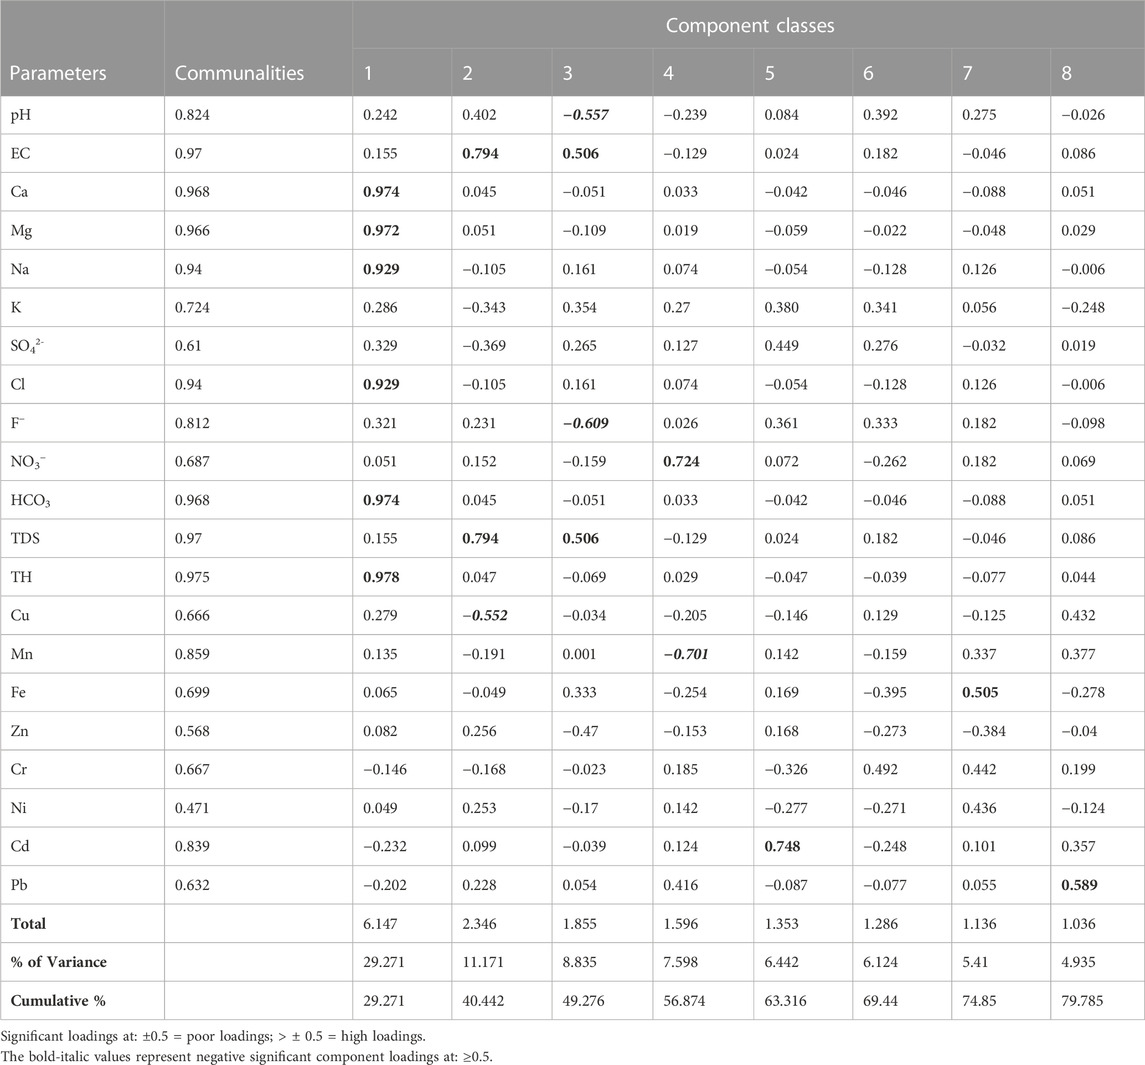
TABLE 11. Unrotated principal component scores for both physicochemical and heavy metals of the analyzed groundwater samples.
PC3 explained 8.835% of the variance, having positive significant loadings for EC and TDS and a negative significant loading for pH and F−. The significant negative loading observed for pH in this component class implies that the groundwater pH had little or no influence on the dissolution of chemical species in water and vice versa. Similarly, the negative significant loading (-0.609) observed for F− indicates that its concentration in the groundwater occurred from anthropogenic influxes from the use of agrochemicals. The highly significant loading observed for NO3−in PC4 affirms that the groundwater is being polluted by the leaching of fertilizer components probably from the N-P-K species. Negative significant loading was observed for Mn. This implies that the occurrence of Manganese in the groundwater was from a different source other than nitrate, possibly from the weathering and dissolution of underlying rock materials. Mn tends to form strong organic metal complexes with soil organic matter. Moreover, Mn usually occurs in association with other elements in water such as Fe, oxygen, sulphur, and chlorine (ATSDR 2012).
PC5 showed high significant loading for Cd. The high significant positive loading observed for Cd in this component class validates the results from the physicochemical analysis. High Cd concentration in groundwater is usually associated with the weathering and dissolution of sulfide minerals such as chalcopyrite and pyrites in subsurface aquifers enriched in Pb and Zn (Obasi and Akudinobi, 2020; Omeka and Igwe, 2021). These rock types are absent in the geology of the present study. Hence, its concentration may only have come from anthropogenic inputs from poor waste management and agricultural activities. PC7 and PC8 showed significant loadings for Fe and Pb respectively. Fe and Pb are chalcophile elements (they have the affinity to form complexes with sulphide mineral species). However, the present study area is devoid of sulphide mineral species within the subsurface. Hence, the occurrence of these elements could only be traced to anthropogenic influences from the leaching of agrochemicals into the groundwater aquifer system.
So far, results from PCA have shown that the groundwater quality of the Firozabad city is jointly influenced by geogenic (weathering and dissolution of rock mineral species) and anthropogenic influxes (leaching and infiltration of land-derived effluents from the use of agrochemicals).
3.5.2 Q-mode hierarchical cluster analysis
The Q-mode HCA was used in this study to have a comprehensive comparative assessment of the groundwater quality within the Firozabad city for drinking purposes (Figure 7). Sources of water pollution is known to be highly ubiquitous as a result, certain water sources may tend to be more vulnerable to pollution than others. Hence, it important to identify the groundwater sources with the highest exposure to contamination for proper remediation (Gaikwad et al., 2020; Aghamelu et al., 2022). The two numerical water quality indices (PIG and WQI) were validated using the HCA. The model standardization was done using the zero-score standardization criteria to minimize any bias that may arise from variation in outputs between the two numerical models (Gaikwad et al., 2020). To achieve this, a dendrogram was generated, with two major clusters and two sub-clusters produced as output (Figure 7). The first major cluster (Cluster 1) comprised fifteen groundwater samples (S1, S2, S6, S7, S9, S10, S12, S14, S15, S16, S17, S18, S19, S20, S21), accounting for fifteen water quality parameters (Cr, Ni, Pb, Cd, NO3, Zn, F, pH, Fe, Mn, Cu, SO4, TDS, and EC). The implication of this is that these groundwater samples are majorly exposed to the influx of the listed contaminant parameters. An observation of Table 6 shows that these listed water samples were among those with very high contamination levels from the results of PIG and WQI. The second cluster group accounted for six sample points (S3, S4, S5, S8, S11, S13), enlisted with Mg, TH, HCO3, Cl, Ca, and Na. These water samples had lower values compared to those obtained for Cluster 1. Although from the results of physicochemical analysis, Cl showed very high values, however, their overall input in groundwater quality seems to fall under the second cluster group.
Two sub-clusters were also generated from the Q-mode HCA. Among the sub-clusters, sub-cluster one accounted for eight water samples (S1, S9, S10, S17, S18, S19, S20, S21) enlisted with pH, Fe, Zn, NO3, Cd, Pb, Ni, and Cr. Sub-cluster two accounted for six water samples (S2, S6, S7, S12, S14, S15, S16) consisting of six water quality parameters (EC, TDS, K, SO4, Mn, Fe). Generally, the sub-clusters were more enlisted with heavy metals compared to the major cluster groups. This correlates well with the results of the physic-chemical analysis; the heavy metals showed very low concentration among the groundwater samples compared to other chemical parameters. Hence, the use of HCA in this analysis has been integral in validating the results of WQI, PIG, and physic-chemical analysis.
The Q-mode HCA has been successful in applying water quality assessment in other parts of the world. In Nigeria for instance, Unigwe C. O. et al. (2022) have used this model for the assessment of the pollution sources, and drinking water quality as well as the validation of two drinking water quality indices-water quality index (WQI) and overall index of pollution (OIP). Results from their study revealed that the majority of the water samples which showed high WQI and OIP values were grouped in the same cluster group, thereby validating the model in water quality assessment. In a similar study conducted in two metropolises in southeastern Nigeria, Omeka and Egbueri (2022) used the Q-mode HCA for the drinking water quality assessment of the Nnewi and Awka metropolises in southeastern Nigeria. In their study, the Q-mode HCA was used to validate two drinking water quality indices-WQI and the pollution index of groundwater (PIG). Their study showed that the results from HCA clustering were in perfect commensuration with those obtained from physicochemical analysis and health risk models. The study went further to show that based on the pollution level and agreement between the two models from the different water samples, the Awka area appear to be more prone to contaminant inputs compared to the Nnewi area. This variation was attributed to the lower depth of water table of the Awka area compared to Nnewi. The application of the Q-mode HCA in this study has shown that there is a relationship between the dissolved chemical species from both geogenic and anthropogenic influxes (mostly from poor industrial waste management and agriculture). These same species had a greater influence on the general water quality, as evidenced by their parity in the cluster groupings. Hence, the use of this model in this study is valid.
4 Conclusion and recommendations
This study carried out an integrated assessment of irrigation water quality, drinking water quality, and health risk assessment of groundwater resources from the industrial area located in the Firozabad city, Uttar Pradesh, India. The study integrated two multiple numerical water quality (PIG and WQI) and health risk assessment (HI and HQ) indices to assess the suitability of the groundwater for drinking purposes, as well as the associated health risks from their consumption by several age groups. Several irrigational suitability indices were also integrated to ascertain the suitability of the water for irrigation purposes. Finding from the physicochemical analysis revealed that some chemical and chemical elements (e.g., EC, TH, Na, Cl−, and F−) occurred in concentrations above the World Health Organization and Bureau of Indian Standards recommended standards for drinking water quality; attributed to the high influx from agricultural and industrial wastewater. PIG and WQI classified 100% of the groundwater as highly polluted and unsuitable for drinking, while the multivariate statistical models (Q-mode HCA and PCA) showed that the groundwater quality is jointly influenced by geogenic (weathering and dissolution of rock mineral species) and anthropogenic influxes (leaching and infiltration of land-derived effluents from the use of agrochemicals).
The majority of the irrigational water quality indices (sodium adsorption ratio, Kelly’s Ratio, permeability index, percent sodium) showed that the long-term use of the groundwater for irrigation in the area will result in reduced crop yield unless remedial measures are put in place. These results were strongly supported by the Wilcox and USSL plots; as the majority of the water samples plotted within the high salinity, high sodium hazard, and unsuitable zone for irrigation use. The non-carcinogenic health risk associated with chloride, nitrate, and fluoride ingestion and dermal contact was evaluated for three population sizes (children, females, and males). Results showed that the children population is more predisposed to Nitrate, Chloride, and fluoride health risks from oral intake and dermal contact. Geospatial maps revealed that risk levels from ingestion appear to increase in the western and northeastern parts of the study area.
From the findings of this study, it is highly recommended that special attention be given to the children population to avoid future health problems associated with contaminant ingestion. This can be done through adequate water treatment strategies and remedial measures such as pump-and-treat, and the construction of barrier walls around the drinking boreholes to avoid the further spread of contaminants. Additionally, special environmental management measures such as the use of biodegradable fertilizers, pre-treatment of industrial effluents before disposal, and reduction of soil salinity (through leaching with low salt-content water) will need to be put in place to improve soil quality and crop yield.
Data availability statement
The raw data supporting the conclusions of this article will be made available by the authors, without undue reservation.
Author contributions
AS contributed to conceptualization, manuscript-writing, review and editing, sampling, laboratory analysis, data analysis, TN contributed to resource funding, supervision, manuscript-review and editing; MO contributed to Manuscript design, Manuscript writing, map digitization, and data analysis; CU, IA, and SU contributed to the computation of numerical indices, manuscript-review and editing; AL contributed to resource funding, supervision, manuscript-review and editing, MR and BB contributed to manuscript review and editing, computation of numerical indices, PA contributed to mapping, manuscript-review and editing, AS, MA, Contributed to manuscript-writing, review and editing.
Conflict of interest
The authors declare that the research was conducted in the absence of any commercial or financial relationships that could be construed as a potential conflict of interest.
Publisher’s note
All claims expressed in this article are solely those of the authors and do not necessarily represent those of their affiliated organizations, or those of the publisher, the editors and the reviewers. Any product that may be evaluated in this article, or claim that may be made by its manufacturer, is not guaranteed or endorsed by the publisher.
Supplementary material
The Supplementary Material for this article can be found online at: https://www.frontiersin.org/articles/10.3389/fenvs.2023.1116220/full#supplementary-material
References
Abrahao, R., Causape, J., Garcıa-Garizabal, I., and Merchan, D. (2011). Implementing irrigation: Water balances and irrigation quality in the Lerma basin (Spain). Agric. Water Manag. 102, 97–104. doi:10.1016/j.agwat.2011.10.010
Adamu, C. I., Nganje, T. N., and Edet, A. (2015). Heavy metal contamination and health risk assessment associated with abandoned barite mines in Cross River State, southeastern Nigeria. Environ. Nanotechnol. Monit. Manag. 3, 10–21. doi:10.1016/j.enmm.2014.11.001
Agency for toxic substances & Disease Registry (ASTDR) (2018). Toxicological Profile for hazardous substances. US Department of Health and Human Service.
Aghamelu, O. P., Omeka, M. E., and Unigwe, C. O. (2022). Modeling the vulnerability of groundwater to pollution in a fractured shale aquifer in SE Nigeria using information entropy theory, geospatial, and statistical modeling approaches. Model. Earth Syst. Environ. 2022, 1–22. doi:10.1007/s40808-022-01640-y
Ali, S., Kumari, M., Gupta, S. K., Sinha, A., and Mishra, B. K. (2017). Investigation and mapping of fluoride-endemic areas and associated health risk—a case study of Agra, Uttar Pradesh, India. Hum. Ecol. Risk Assess. Int. J. 23 (3), 590–604. doi:10.1080/10807039.2016.1255139
Amiri, V., and Berndtsson, R. (2020). Fluoride occurrence and human health risk from groundwater use at the west coast of Urmia Lake, Iran. Arab. J. Geosci. 13, 921. doi:10.1007/s12517-020-05905-7
Amiri, V., Bhattacharya, P., and Nakhaei, M. (2021). The hydrogeochemical evaluation of groundwater resources and their suitability for agricultural and industrial uses in an arid area of Iran. Groundw. Sustain. Dev. 12, 100527. doi:10.1016/j.gsd.2020.100527
Amiri, V., Sohrabi, N., Li, P., and Amiri, F. (2022). Groundwater quality for drinking and non-carcinogenic risk of nitrate in urban and rural areas of Fereidan, Iran. Expo. Health. doi:10.1007/s12403-022-00525-w
Amouei, A., Mahvi, A., Mohammadi, A., Asgharnia, H., Fallah, S., and Khafajeh, A. (2012). Fluoride concentration in potable groundwater in rural areas of Khaf city, Razavi Khorasan province, Northeastern Iran. Int. J. Occup. Environ. Med. 3, 201–203.
Aravinthasamy, P., Karunanidhi, D., Subramani, T., Anand, B., Roy, P. D., and Srinivasamoorthy, K. (2019). Fluoride contamination in groundwater of the Shanmuganadhi River Basin (south India) and its association with other chemical constituents using geographical information system and multivariate statistics. Geochemistry 12, 55–87.
Ayers, R., and Westcot, D. (1985). Water quality for agriculture. Rome: FAO Irrigation and drainage paper 29 Rev. 1. Food and Agricultural Organization, 74.
Ayoob, S., Gupta, A. K., and Bhat, V. T. (2008). A conceptual Overview on sustainable technologies for the Defluoridation of drinking water. Crit Rev Environ. Sci. Technol. 38 (6), 401–470. doi:10.1080/10643380701413310
Barzegar, R., Moghaddam, A. A., Adamowski, J., and Nazemi, A. M. (2018). Assessing the potential origins and human health risks of trace elements in groundwater: A case study in the Khoy plain Iran. Environ. Geochem. Health 87, 981–1002. doi:10.1007/s10653-018-0194-9
Corwin, D. L., and Yemoto, K. (2017). Salinity: Electrical conductivity and total dissolved solids. Methods soil analysis. doi:10.2136/sssabookser5.3.c14
Cui, Z., Qiao, B. Z., and Wu, N. (2011). Contamination and distribution of heavy metals in urban and suburban soils in Zhangzhou City, Fujian, China. Environ. Earth Sci. 64 (6), 1607–1615. doi:10.1007/s12665-011-1179-5
Daw, R. K. (2004). “Experiences with domestic fluoridation in India,” in Proceedings of the 30th WEDC International Conference on People-Centred Approaches to Water and Environmental Sanitation, Vientiane, Lao PDR, 25, 467–473.
Dehghani, M. H., Zarei, A., Yousef, M., Asghari, F. B., and Haghighat, G. A. (2019). Fluoride contamination in groundwater resources in the southern Iran and its related human health risks. Desalin Water Treat. 153, 95–104. doi:10.5004/dwt.2019.23993
Devi, R., Behera, B., Raza, M. B., Mangal, V., Altaf, M. A., Kumar, R., et al. (2021). An insight into microbes mediated heavy metal detoxification in plants: A review. J. Soil Sci. Plant Nutr. 22, 914–936. doi:10.1007/s42729-021-00702-x
Doneen, L. D. (1964). Notes on water quality in agriculture published as a water science and engineering paper 4001. Oakland, CA, USA: Department of Water Science and Engineering, University of California.
Eaton, A. D., Clesceri, L. S., Greenberg, A. E., and Franson, M. A. H. (1995). APHA. AWWA, WEF, Standard methods for the examination of water and wastewater. 19th edn. Washington, DC, USA: APHA.
Edet, A. E., and Offiong, O. E. (2002). Evaluation of water quality pollution indices for heavy metal contamination monitoring: A study case from akpabuyo-odukpani area, lower cross river basin (southeastern Nigeria). Geol. J. 57, 295–304. doi:10.1023/b:gejo.0000007250.92458.de
Egbueri, J. C., Igwe, O., Omeka, M. E., and Agbasi, J. C. (2023). Development of MLR and variedly optimized ANN models for forecasting the detachability and liquefaction potential index of erodible soils. Geosystems Geoenvironment 2 (1), 100104. doi:10.1016/j.geogeo.2022.100104
Egbueri, J. C., Unigwe, C. O., Omeka, M. E., and Ayejoto, D. A. (2021). Urban groundwater quality assessment using pollution indicators and multivariate statistical tools: A case study in southeast Nigeria. Int. J. Environ. Anal. Chem. doi:10.1080/03067319.2021.1907359
FAO (2003). Unlocking the water potential of agriculture. Food and agriculture organization of the united nations. Rome: FAO.
Gaikwad, S. K., Kadam, A. K., Ramgir, R. R., Kashikar, A. S., Wagh, V. M., Kandekar, A. M., et al. (2020). Assessment of the groundwater geochemistry from a part of west coast of India using statistical methods and water quality index. HydroResearch 3, 48–60. doi:10.1016/j.hydres.2020.04.001
Igwe, O., and Omeka, M. E. (2021). Hydrogeochemical and pollution assessment of water resources within a mining area, SE Nigeria, using an integrated approach. Int. J. Energy Water Resour. 2021, 1–22. doi:10.1007/s42108-021-00128-2
Kadam, A., Wagh, V., Jacobs, J., Patil, S., Pawar, N., Umrikar, B., et al. (2022). Integrated approach for the evaluation of groundwater quality through hydro geochemistry and human health risk from Shivganga river basin, Pune, Maharashtra, India. Environ. Sci. Pollut. Res. 29 (3), 4311–4333. doi:10.1007/s11356-021-15554-2
Kaiser, H. F. (1960). The application of electronic computers to factor analysis. Educ. Psychol. Meas. 20, 141–151. doi:10.1177/001316446002000116
Kotecha, P. V., Patel, S. V., Bhalani, K. D., Shah, D., Shah, V. S., and Mehta, K. G. (2012). Prevalence of dental fluorosis & dental caries in association with high levels of drinking water fluoride content in a district of Gujarat, India. Indian J. Med. Res. 135, 873–877.
Krishna-Kumar, S., Bharani, R., Magesh, N. S., Godson, P. S., and Chandrasekar, N. (2014). Hydrogeochemistry and groundwater quality appraisal of part of south Chennai coastal aquifers, Tamil Nadu, India using WQI and fuzzy logic method. Appl. Water Sci. 4, 341–350. doi:10.1007/s13201-013-0148-4
Kumar, R., Qureshi, M., Vishwakarma, D. K., Al-Ansari, N., Kuriqi, A., Elbeltagi, A., et al. (2022). A review on emerging water contaminants and the application of sustainable removal technologies. Case Stud. Chem. Environ. Eng. 6, 100219. doi:10.1016/j.cscee.2022.100219
Kumar, S. K., Rammohan, V., Sahayam, J. D., and Jeevanandam, J. (2009). Assessment of groundwater quality and hydrogeochemistry of Manimuktha River basin, Tamil Nadu, India. Environ. Monit. Assess. 159, 341–351. doi:10.1007/s10661-008-0633-7
Langenegger, O. (1990). Groundwater quality in rural areas of western Africa, UNDP project INT/81/026, 10.
Liu, R., Zhu, H., Liu, F., Dong, Y., and El-Wardany, R. M. (2021). Current situation and human health risk assessment of fluoride enrichment in groundwater in the loess plateau: A case study of dali county, shaanxi province, China. China Geol. 4, 492–502. doi:10.31035/cg2021051
McGowan, W. (2000). Water processing: Residential, commercial, light-industrial. third ed. Lisle: Water Quality Association.
Mirzabeygi, M., Yousef, N., Abbasnia, A., Youzi, H., Alikhani, M., and Mahvi, A. H. (2017). Evaluation of groundwater quality and assessment of scaling potential and corrosiveness of water supply networks, Iran. J. Water Supply Resour. Technol. 66 (6), 416–425. doi:10.2166/aqua.2017.128
Mohammed, M. M., Murad, A., and Chowdhury, R. (2017). Evaluation of groundwater quality in the eastern district of abu Dhabi Emirate, UAE. Bull. Environ. Contam. Toxicol. 98, 1–7. doi:10.1007/s00128-016-2017-y
Mumtaz, N., Pandey, G., and Labhasetwar, P. K. (2015). Global fluoride occurrence, available technologies for fluoride removal and electrolytic deflluoridation: A review. Crit. Rev. Environ. Sci. Technol. 2015, 1046768. doi:10.1080/10643389.2015.1046768
National Research Council (NRC) (2001). National research Council. Washington, DC: National Academics Press.
Obasi, P. N., and Akudinobi, B. B. (2020). Potential health risk and levels of heavy metals in water resources of lead–zinc mining communities of Abakaliki, southeast Nigeria. Appl. Water Sci. 10, 184. doi:10.1007/s13201-020-01233-z
Okamkpa, J. R., Omeka, M. E., Igwe, O., and Iyiokwu, M. U. (2022). An integrated geochemical and spatiotemporal assessment of groundwater resources within an industrial suburb, Southeastern Nigeria. Int. J. Energy Water Resour. 2022, 1–20. doi:10.1007/s42108-022-00183-3
Omeka, M. E. (2023). Evaluation and prediction of irrigation water quality of an agricultural district, SE Nigeria: An integrated heuristic GIS-based and machine learning approach. Environ. Sci. Pollut. Res. doi:10.1007/s11356-022-25119-6
Omeka, M. E., and Egbueri, J. C. (2022). Hydrogeochemical assessment and health-related risks due to toxic element ingestion and dermal contact within the Nnewi-Awka urban areas, Nigeria. Environ. Geochem. health 2022, 1–29. doi:10.1007/s10653-022-01332-7
Omeka, M. E., Egbueri, J. C., and Unigwe, C. O. (2022b). Investigating the hydrogeochemistry, corrosivity, and scaling tendencies of groundwater in an agrarian area (Nigeria) using graphical, indexical, and statistical modeling. Arabian J. Geosciences 15 (13), 1–24. doi:10.1007/s12517-022-10514-7
Omeka, M. E., and Igwe, O. (2021). Heavy metals concentration in soils and crop plants within the vicinity of abandoned mine sites in Nigeria: An integrated indexical and chemometric approach. Int. J. Environ. Anal. Chem. 2021, 1–19. doi:10.1080/03067319.2021.1922683
Omeka, M. E., Igwe, O., Onwuka, O. S., Nwodo, O. M., Ugar, S. I., Undiandeye, P. A., et al. (2023). Efficacy of GIS-based AHP and data-driven intelligent machine learning algorithms for irrigation water quality prediction in an agricultural-mine district within the Lower Benue Trough, Nigeria. Environ. Sci. Pollut. Res. doi:10.1007/s11356-023-25291-3
Omeka, M. E., Igwe, O., and Unigwe, C. O. (2022a). An integrated approach to the bioavailability, ecological, and health risk assessment of potentially toxic elements in soils within a barite mining area, SE Nigeria. Environ. Monit. Assess. 194 (3), 212–230. doi:10.1007/s10661-022-09856-2
Prasad, J. (2008). Groundwater brochure of Firozabad district, Utter Pradesh. A.A.P ‘2007-2008’. 19.
Qadir, M., and Oster, J. D. (2004). Crop and irrigation management strategies for saline-sodic soils and waters aimed at environmentally sustainable agriculture. Sci. Total Environ. 323, 1–19. doi:10.1016/j.scitotenv.2003.10.012
Rahman, A., Mondal, N. C., and Tiwari, K. K. (2021). Anthropogenic nitrate in groundwater and its health risks in the View of background concentration in a semi-arid area of Rajasthan, India. Sci. Rep. 11, 9279. doi:10.1038/s41598-021-88600-1
Shahzad, A., Kumari, M., Kumar Gupta, S., Sinha, A., and Mishra, B. K. (2017). Investigation and mapping of fluoride-endemic areas and associated health risk—a case study of Agra, Uttar Pradesh, India. Hum. Ecol. Risk Assess. An Int. J. 23 (3), 590–604. doi:10.1080/10807039.2016.1255139
Shukla, S., Khan, R., Varshney, S. K., Ganguly, R., Amiri, V., Hussain, C. M., et al. (2022). Appraisal of groundwater chemistry, its suitability for crop productivity in Sonipat district and human health risk evaluation. Hum. Ecol. Risk Assess. An Int. J. 2022, 1–22. doi:10.1080/10807039.2022.2137779
Singh, G., Madhuri, S. R., and Arora, N. K. (2019). Integrated GIS-based modelling approach for irrigation water quality suitability zonation in parts of Satluj River Basin, Bist Doab region, North India. Appl. Sci. 1, 1438. doi:10.1007/s42452-019-1405-4
Sohrabi, N., Kalantari, N., Amiri, V., Saha, N., Berndtsson, R., Bhattacharya, P., et al. (2021). A probabilistic-deterministic analysis of human health risk related to the exposure to potentially toxic elements in groundwater of Urmia coastal aquifer (NW of Iran) with a special focus on arsenic speciation and temporal variation. Stoch. Environ. Res. risk Assess. 35 (7), 1509–1528.
Subba Rao, N. (2018). Groundwater quality from a part of Prakasam district, Andhra Pradesh, India. Appl. Water Sci. 80, 30. doi:10.1007/s13201-018-0665-2
Subba Rao, N. (2012). Pig: A numerical index for dissemination of groundwater contamination zones. Hydrol. Process. 26 (22), 3344–3350. doi:10.1002/hyp.8456
Tüzen, M. (2003). Determination of heavy metals in soil, mushroom, and plant samples by atomic absorption spectrometry. Microchem. J. 74 (3), 289–297. doi:10.1016/s0026-265x(03)00035-3
Ukah, B. U., Egbueri, J. C., Unigwe, C. O., and Ubido, O. E. (2019). The extent of heavy metals pollution and health risk assessment of groundwater in a densely populated industrial area, Lagos, Nigeria. Int. J. Energy Water Resour. 3, 291. doi:10.1007/s42108-019-00039-3
Unigwe, C. O., Egbueri, J. C., and Omeka, M. E. (2022a). Geospatial and statistical approaches to nitrate health risk and groundwater quality assessment of an alluvial aquifer in SE Nigeria for drinking and irrigation purposes. J. Indian Chem. Soc. 2022, 100479. doi:10.1016/j.jics.2022.100479
Unigwe, C. O., Igwe, O., Onwuka, O. S., Egbueri, J. C., and Omeka, M. E. (2022b). Roles of hydro-geotechnical and slope stability characteristics in the erosion of Ajali and Nanka geologic formations in southeastern Nigeria. Arab. J. Geosci. 15, 1492. doi:10.1007/s12517-022-10771-6
US-EPA (US Environmental Protection Agency) (2017). National recommended water quality criteria-aquatic life criteria table and human health criteria table. Available at: https://www.epa.gov.wqc/nationalrecommended-water-quality-criteria-aquatic-life-criteria-table.
USEPA (1989). Risk assessment guidance for Superfund, human health evaluation manual (Part A). Office of Emergency and Remedial Response, I. Washington, DC, USA: USEPA.
USSL (1954). Diagnosis and improvement of saline and alkaline soils. Agriculture Handbook No. 60 USDA. Guangzhou: USSL, 160.
Wagh, V., Mukate, S., Muley, A., Kadam, A., Panaskar, D., and Varade, A. (2020). Study of groundwater contamination and drinking suitability in basaltic terrain of Maharashtra, India through PIG and multivariate statistical techniques. J. Water Supply Res. Technology-Aqua 69 (4), 398–414. doi:10.2166/aqua.2020.108
Wang, F., Yang, H., Zhang, Y., Wang, S., Liu, K., Qi, Z., et al. (2022). Solute geochemistry and water quality assessment of groundwater in an arid endorheic watershed on Tibetan plateau. Sustain. Switz. 14. doi:10.3390/su142315593
Wang, Z., Wang, L. J., Shen, J. S., Nie, Z. L., Meng, L. Q., Cao, L., et al. (2021). Groundwater characteristics and climate and ecological evolution in the Badain Jaran Desert in the southwest Mongolian Plateau. China Geol. 4, 422–433. doi:10.31035/cg2021056
World Health Organization (WHO) (2017). Guidelines for drinking water quality. 3rd ed. Geneva: World Health Organization.
Xiao, Y., Hao, Q., Zhang, Y., Zhu, Y., Yin, S., Qin, L., et al. (2022b). Investigating sources, driving forces and potential health risks of nitrate and fluoride in groundwater of a typical alluvial fan plain. Sci. Total Environ. 802, 149909. doi:10.1016/j.scitotenv.2021.149909
Xiao, Y., Liu, K., Hao, Q., Li, Y., Xiao, D., and Zhang, Y. (2022c). Occurrence, controlling factors and health hazards of fluoride-enriched groundwater in the lower flood plain of Yellow River, Northern China. Expo. Health 14, 345–358. doi:10.1007/s12403-021-00452-2
Xiao, Y., Liu, K., Hao, Q., Xiao, D., Zhu, Y., Yin, S., et al. (2022a). Hydrogeochemical insights into the signatures, Genesis and sustainable perspective of nitrate enriched groundwater in the piedmont of Hutuo watershed, China. Catena (Amst) 212, 106020. doi:10.1016/j.catena.2022.106020
Xiao, Y., Liu, K., Yan, H., Zhou, B., Huang, X., Hao, Q., et al. (2021). Hydrogeochemical constraints on groundwater resource sustainable development in the arid Golmud alluvial fan plain on Tibetan plateau. Environ. Earth Sci. 80. doi:10.1007/s12665-021-10076-z
Yildiz, S., and Karakuş, C. B. (2019). Estimation of irrigation water quality index with development of an optimum model: A case study. Environ. Dev. Sustain. 22 (5), 4771–4786. doi:10.1007/s10668-019-00405-5
Keywords: fluoride health risk, firozabad, irrigation water quality, agricultural productivity, water quality
Citation: Saraswat A, Nath T, Omeka ME, Unigwe CO, Anyanwu IE, Ugar SI, Latare A, Raza MB, Behera B, Adhikary PP, Scopa A and AbdelRahman MAE (2023) Irrigation suitability and health risk assessment of groundwater resources in the Firozabad industrial area of north-central India: An integrated indexical, statistical, and geospatial approach. Front. Environ. Sci. 11:1116220. doi: 10.3389/fenvs.2023.1116220
Received: 05 December 2022; Accepted: 22 February 2023;
Published: 15 March 2023.
Edited by:
Yong Xiao, Southwest Jiaotong University, ChinaReviewed by:
Vahab Amiri, Yazd University, IranVasant Madhav Wagh, Swami Ramanand Teerth Marathwada University, India
Yinzhu Zhou, Center for Hydrogeology and Environmental Geology Survey, China
Copyright © 2023 Saraswat, Nath, Omeka, Unigwe, Anyanwu, Ugar, Latare, Raza, Behera, Adhikary, Scopa and Abdel Rahman. This is an open-access article distributed under the terms of the Creative Commons Attribution License (CC BY). The use, distribution or reproduction in other forums is permitted, provided the original author(s) and the copyright owner(s) are credited and that the original publication in this journal is cited, in accordance with accepted academic practice. No use, distribution or reproduction is permitted which does not comply with these terms.
*Correspondence: Michael E. Omeka, b21la2EuZWt1cnVAdW5pY2FsLmVkdS5uZw==, bWljaGFlbGVrdXJ1QGdtYWlsLmNvbQ==; Antonio Scopa, YW50b25pby5zY29wYUB1bmliYXMuaXQ=
†ORCID: Anuj Saraswat, orcid.org/0000-0003-3359-5218; Michael E. Omeka, orcid.org/0000-0003-0405-8616; Ifeanyi E. Anyanwu, orcid.org/0000-0002-0935-5479; Chinanu O. Unigwe, orcid.org/0000-0002-5952-1551; Md Basit Raza, orcid.org/0000-0003-4473-0737; Biswaranjan Behera, orcid.org/0000-0002-0337-9808; Antonio Scopa, orcid.org/0000-0001-8610-3323; Mohamed A. E. Abdel Rahman, orcid.org/0000-0001-8639-591X; Partha P. Adhikary, orcid.org/0000-0001-9292-8401