 Antti J. Rissanen1,2*
 Paavo Ojanen1,3Leena Stenberg1
 Tuula Larmola1
 Jani Anttila1Sakari Tuominen1
 Kari Minkkinen3Markku Koskinen4,5
 Raisa Mäkipää1
- 1Natural Resources Institute Finland (Luke), Helsinki, Finland
- 2Faculty of Engineering and Natural Sciences, Tampere University, Tampere, Finland
- 3Department of Forest Sciences, University of Helsinki, Helsinki, Finland
- 4Environmental Soil Science, Department of Agricultural Sciences, University of Helsinki, Helsinki, Finland
- 5Institute of Atmospheric and Earth System Research (INAR)/Forest Sciences, University of Helsinki, Helsinki, Finland
Ditches of forestry-drained peatlands are an important source of methane (CH4) to the atmosphere. These CH4 emissions are currently estimated using the IPCC Tier 1 emission factor (21.7 g CH4 m−2 y−1), which is based on a limited number of observations (11 study sites) and does not take into account that the emissions are affected by the condition and age of the ditches. Furthermore, the total area of different kinds of ditches remains insufficiently estimated. To construct more advanced ditch CH4 emission factors for Finland, we measured CH4 emissions in ditches of 3 forestry-drained peatland areas (manual chamber technique) and amended this dataset with previously measured unpublished and published data from 18 study areas. In a predetermined 2-type ditch classification scheme, the mean CH4 emissions (±standard error) were 2.6 ± 0.8 g CH4 m−2 y−1 and 20.6 ± 7.0 g CH4 m-2 y−1 in moss-covered and moss-free ditches, respectively. In a more detailed 4-type classification scheme, the yearly emissions were 0.6 ± 0.3, 3.8 ± 1.1, 8.8 ± 3.2, and 25.1 ± 9.7 g CH4 m−2 y−1 in Sphagnum-covered, Sphagnum- and vascular plant—covered, moss-free and vascular plant-covered, and plant - free ditches, respectively. Hence, we found that Tier 1 emission factor may overestimate ditch CH4 emissions through overestimation of the emissions of moss-covered ditches, irrespective of whether they harbor potentially CH4 conducing vascular plants. Based on the areal estimates and the CH4 emission factors for moss-covered and moss-free ditches, CH4 emissions of ditches of forestry-drained peatlands in Finland were 8,600 t a−1, which is 63% lower than the current greenhouse gas inventory estimates for ditch CH4 emissions (23,200 t a−1). We suggest that the Tier 1 emission factor should be replaced with more advanced emission factors in the estimation of ditch CH4 emissions of boreal forestry-drained peatlands also in other countries than in Finland. Furthermore, our results suggest that the current practice in Finland to minimize ditch-network maintenance by ditch cleaning will likely decrease CH4 emissions from ditches, since old moss-covered ditches have very low emissions.
1 Introduction
The concentration of the greenhouse gas (GHG) methane (CH4) has increased substantially since industrialization, with the current global yearly emissions averaging 576 Tg (550–594 Tg) based on top-down estimation (Saunois et al., 2020). Of these global emissions, approximately 60% stem from anthropogenic sources, mostly agriculture, waste treatment, biomass burning and fossil fuel industry (Saunois et al., 2020). In addition, drainage ditches and canals were recently estimated to contribute on average 1% to the global anthropogenic CH4 emissions, yet, their contribution to anthropogenic CH4 emissions can be much higher in densely drained areas (Peacock et al., 2021). Hence, inclusion of ditch and canal emissions into local and national GHG inventories will be crucial in assessing the impact of drained land on CH4 budgets, especially in densely drained countries (Peacock et al., 2021), like in Finland, where approximately 5.9 million ha of peatlands (ca. 17% of total land area of Finland) have been drained for forestry since the 1920s, an area equal to as much as 40% of the global estimate of 15 million ha of forestry-drained peatlands (Paavilainen and Päivänen, 1995).
Drainage of peatlands typically decreases CH4 emissions from soil and ground vegetation, but also creates ditches that have significant CH4 emissions (Martikainen et al., 1995; Roulet and Moore, 1995; von Arnold et al., 2005; Koskinen et al., 2016; Minkkinen et al., 1997; Minkkinen and Laine, 2006). The methane emissions from drainage ditches in Finland are currently estimated using the Tier 1 emission factor of the Intergovernmental Panel on Climate Change (IPCC) for ditches of temperate and boreal drained forest land and drained wetland (Supplementary Table S1; IPCC, 2014). This emission factor, however, is based on a limited number of studies, covering only 11 study sites (Supplementary Table S1; Roulet and Moore, 1995; Minkkinen and Laine, 2006; Sirin et al., 2012; Glagolev et al., 2008; von Arnold et al., 2005; Cooper and Evans, 2013; Cooper et al., 2014) of which only one study is from Finland, covering drained fen and bog sites of one peatland complex (Minkkinen and Laine, 2006). Furthermore, the Tier 1 emission factor does not take into account that different types of ditches (e.g., vegetated vs. non-vegetated) could vary in their CH4 emissions, and the information on the ditch types is impossible to extract for many of the study sites used in the calculations (Supplementary Table S1).
The currently published results of ditch CH4 emission from Finnish forestry-drained peatlands are still scarce, but they already show that the emissions have considerable variation, explained by the hydrology and the type of vegetation cover. The emissions are larger from ditches with moving water than with standing water, which is probably explained by higher input of dissolved methane from surrounding soils via drainage and ground water flow into ditches with moving water (Minkkinen and Laine, 2006). In addition, ditches with aerenchymous plants may have higher CH4 emissions than ditches with Sphagnum moss, as CH4 conducted through the aerenchyma can bypass the methanotrophic filter in oxic surface water, moss, sediment and peat layers, and plant root exudates can also increase methane emissions through several mechanisms (e.g., increasing microbial metabolism) (Schimel, 1995; Frenzel and Karofeld, 2000; Minkkinen and Laine, 2006; Waldo et al., 2019). The scarce published results also hint towards lower CH4 fluxes from moss-covered than moss-free ditches, but the effect of moss-cover remains to be confirmed as the sites of the previously studied moss-free and moss-covered ditches also differed in their nutrient status and forest harvesting treatment, both potentially affecting CH4 production within ditches and strips as well as CH4 transfer from strips to ditches (Minkkinen and Laine, 2006; Korkiakoski et al., 2020). In any case, moss-covered ditches have also shown to turn into occasional CH4 sinks, probably due to activity of methanotrophs within Sphagnum layer or in the sediment and peat below the Sphagnum layer (Raghoebarsing et al., 2005; Larmola et al., 2010; Korkiakoski et al., 2020). As it takes time before ditches are covered by mosses after ditch digging or cleaning, it can be also suggested that ditch age affects CH4 emissions.
As the forest floor of the forestry-drained peatlands is usually a small CH4 sink (Roulet and Moore, 1995; Ojanen et al., 2010; Korkiakoski et al., 2020), the emissions from the ditches determine whether these lands are net sources or sinks of CH4. Accurate methane budget calculations for forestry-drained peatlands followed by national greenhouse gas (GHG) inventories would greatly benefit from development of emission factors, which account the differences in CH4 emissions between ditches of varied age and vegetation cover. Furthermore, a more accurate estimate of the total area of different types of ditches is needed for more accurate calculations of the national GHG inventory. In southern Finland, 35%–43% moss-coverage has been estimated for 5–10-year-old ditches (Silver and Joensuu, 2005), but otherwise publications on ditch vegetation distribution are lacking.
The current CH4 emission data from ditches of forestry-drained boreal peatlands are still scarce and the accuracy of the peatland CH4 emission estimates cannot be improved without further measurements. Using data from 21 study areas covering different ditch vegetation cover and site nutrient status and spanning from southern Finland to southern Lapland, we aimed at developing CH4 emission factors that account for different types of ditches (in terms of vegetation cover), and thus should improve the accuracy of the CH4 emission estimation of forestry-drained peatlands. To further improve the accuracy of the CH4 emission estimation in the national GHG inventory, we also made an improved estimation of the total area of ditches and proportion of the different types of ditches in Finland.
2 Materials and methods
2.1 Study areas
Altogether, we used data from 21 forestry-drained peatland study areas representing different site types (nutrient status) and covering Finland from south to north (Table 1). The measurements were done within 25 years spanning 1996–2021 (Table 1). For four areas (Lakkasuo, Konilampi, Vesijako and Kalevansuo), data were obtained from previously published studies (Minkkinen and Laine, 2006; Koskinen et al., 2016; Minkkinen et al., 2018). For 14 areas, unpublished data measured in 2014–2015 were utilized (Table 1). Furthermore, for this study, we conducted CH4 flux measurements at three study areas (Table 1: Ränskälänkorpi, Lettosuo, Paroninkorpi) in 2021. These areas were selected, because they represent nutrient-rich drained peatland forests [Herb-rich (Rhtkg) and Vaccinium myrtillus type (Mtkg)] that are scarce in the previously measured datasets (Table 1), even though they comprise almost 40% of the current forestry-drained peatland area in Finland (Korhonen et al., 2021).
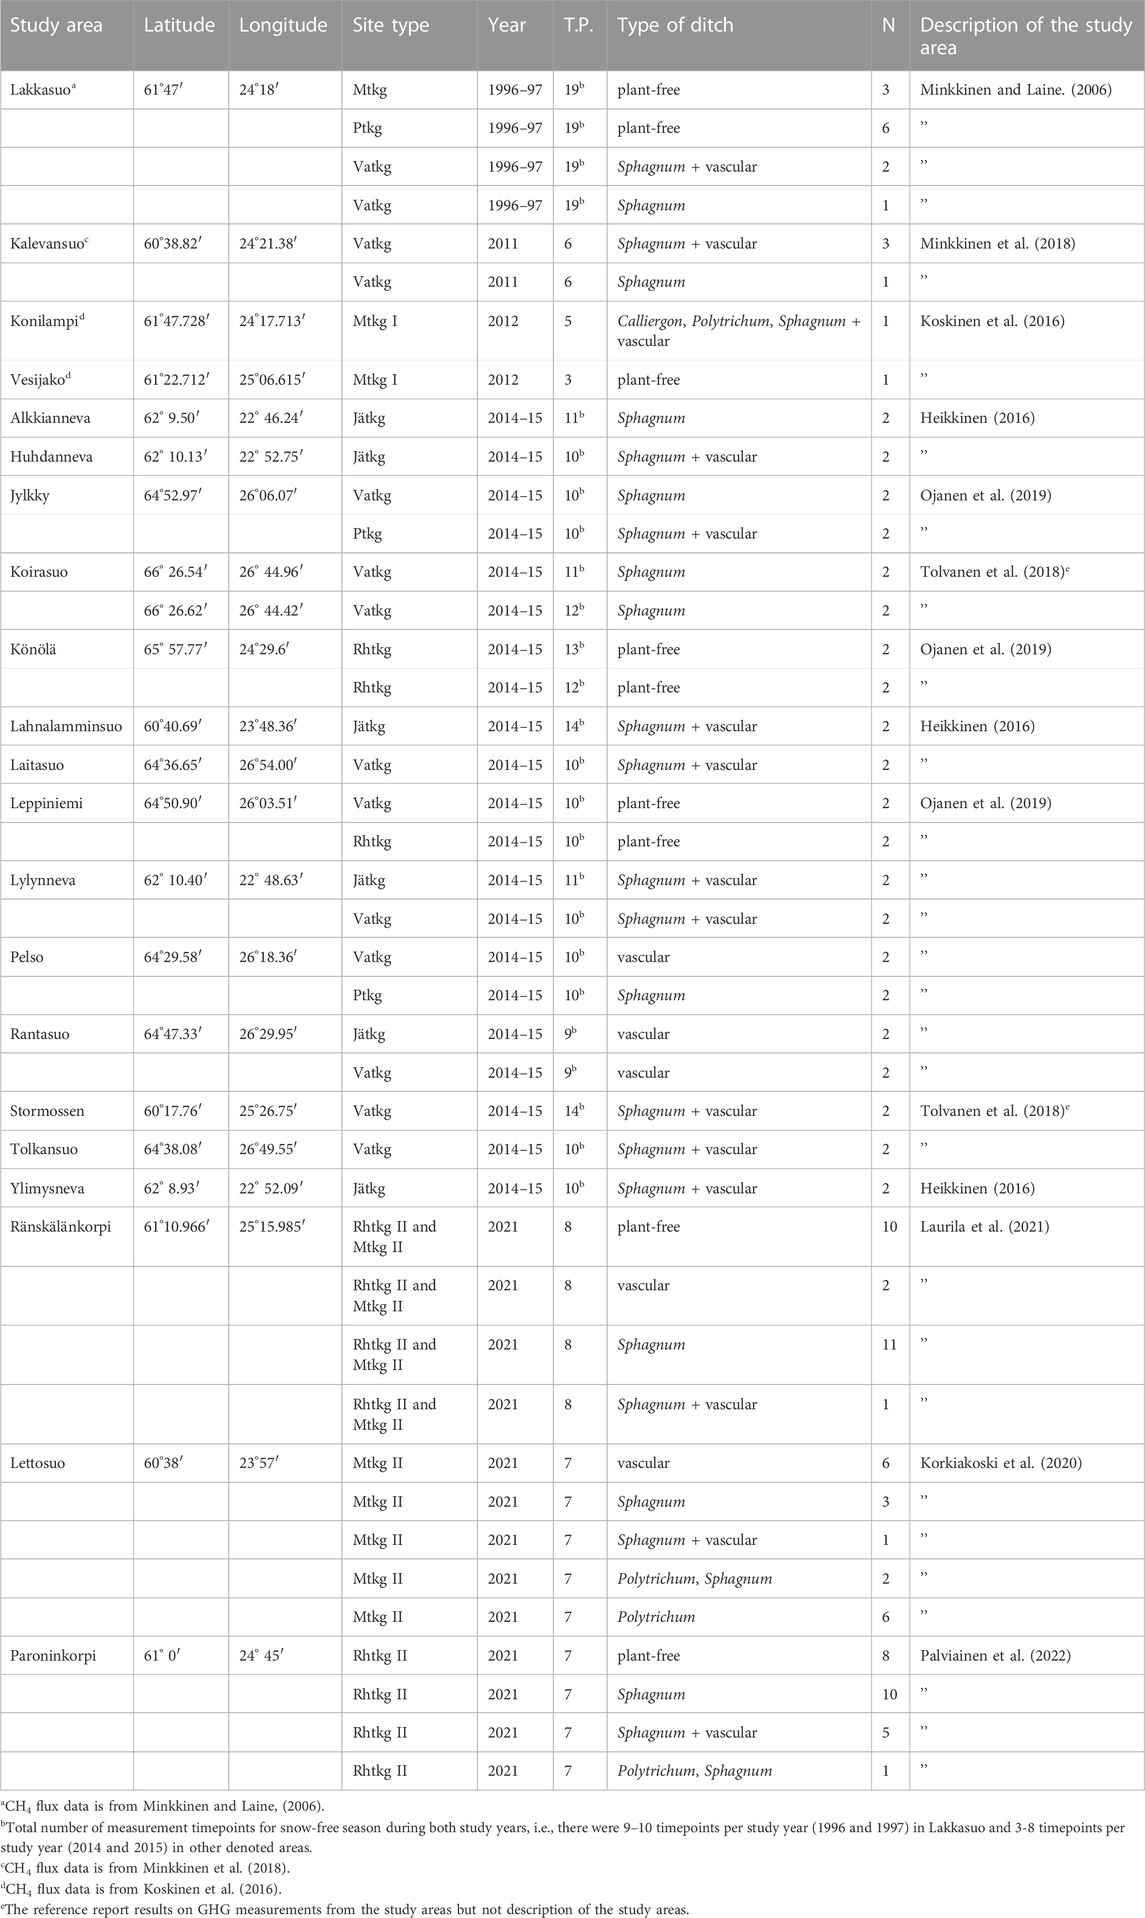
TABLE 1. Study areas (their location and nutrient status), year of CH4 flux measurements, number of measurement timepoints during snow-free season (T.P.), the types of ditches, number of measurement points belonging to the particular type of ditch (N), and reference for the description of the study area. Site types from the nutrient richest to the nutrient poorest type with their abbreviations (Laine et al., 2012): Herb-rich (Rhtkg), Vaccinium myrtillus (Mtkg), Vaccinium vitis-idaea (Ptkg), Dwarf-shrub (Vatkg), Lichen (Jätkg). I and II describe the status of the tree stand prior drainage, if known: treed (I), sparsely treed or treeless (II). CH4 flux data from four (i.e., Lakkasuo, Kalevansuo, Konilampi and Vesijako) out of the total of 21 study areas was previously published (see references in footnotes).
2.2 CH4 flux measurements
Depending on the study area, there were 1–24 measurement points from which the CH4 emissions were measured 3–19 times during 1–2 snow-free seasons, mostly between May–October (Table 1). The CH4 fluxes were measured using the manual closed chamber method at each study area. For Lakkasuo, Konilampi, Vesijako and Kalevansuo, the measurements, gas analyses [gas chromatograph (GC)] and flux calculation were reported previously (Minkkinen and Laine, 2006; Koskinen et al., 2016; Minkkinen et al., 2018). Measurements (using an opaque round closed floating chamber) and GC analyses for the dataset from 2014 to 15 (Table 1) were conducted as previously described (Ojanen et al., 2019). Furthermore, concentration-time graphs of the 2014–15 data were visually inspected for patterns indicating CH4 ebullition events (i.e., release of CH4 bubbles) or analyzer malfunction. Such flux estimates were excluded from the dataset. Altogether, on average 13.1% of the flux estimates, varying from 0% to 40.9% for single study areas, of the 2014–2015 dataset were excluded.
For the dataset measured in 2021 (Ränskälänkorpi, Lettosuo and Paroninkorpi), the gas analyses were made using a portable gas analyser (LI-COR LI-7810, 1 measurement per second) from the headspace of an opaque closed floating chamber (d 31.5 cm, h 31 cm, equipped with a fan) for a time period of 3 min after placing the chamber at the measurement point. After manual trimming of anomalies in the gas concentration data caused by placement and removal of the chamber in the beginning and at the end of the measurement period, respectively, fluxes were calculated based on linear fit between gas concentration and time [linregress routine of SciPy (v. 1.7.0); Virtanen et al., 2020], accounting for chamber temperature, volume and area, using an in-house script (available from https://github.com/janivaltteri/manual-chamber-data-server/blob/main/dataserver/application/fluxcalc.py).
We acknowledge that CH4 measurements from wet surfaces are very sensitive to interferences. It is difficult to place the chamber firmly into the open water or plant-covered ditch surface in a gas-tight manner. Furthermore, pressing the chamber too hard on the measurement surface can disturb the water column and/or sediment surface and lead to inadvertently enhanced gas transfer or even inadvertent CH4 ebullition causing overestimation of the CH4 fluxes (Matthews et al., 2003). This makes it impossible to determine whether disturbances detected in concentration-time data are due to natural CH4 ebullition or the disturbances caused by the measurement procedure. Hence, the CH4 concentration-time graphs of the portable analyser measurements were manually screened for patterns indicating interference of measurements, gas leaks, CH4 ebullition events or analyser malfunctioning resulting in exclusion of such data (see examples in the Supplementary Material; Supplementary Figure S1). The possible anomalies in the concurrently measured CO2 (data not shown) were used as to help in detecting the possible gas leaks, chamber interference and analyzer malfunctioning. We monitored CH4 ebullition specifically using a bubble collector (Huttunen et al., 2001) in an open water (moss-free) ditch in one of the study areas, Ränskälänkorpi during June-October 2021, and found that ebullition was infrequent, occurring only in two occasions: mid July and early August.
In the plant-free, open water ditches, we also noticed that when a downstream measurement point was measured soon (within few minutes) after measurement of a nearby (only 1–2 m apart) upstream measurement point, the disturbance and mixing of the water upstream could lead to biased, comparatively high CH4 flux estimates at the downstream point, which can be due to inadvertently enhanced gas transfer or even inadvertent CH4 ebullition, as explained above (Matthews et al., 2003). There were one such occasion in Ränskälänkorpi (points 321/322 at 5 August 2021), one occasion in Lettosuo (points 121/122 at 21 July 2021) and four occasions in Paroninkorpi (points 421/422 at 24 August 2021 and 18 October 2021; points 431/432 at 28 July 2021 and 7 September 2021), where downstream point had 3.4, 2.9, and 2.0–28.4 times as high CH4 flux as the upstream point, respectively. Hence, such data were also discarded from further analyses.
Altogether, the manual screening procedure removed 26 (13.7%), 43 (35.2%), and 37 (25.5%) flux estimates resulting in 164, 79, and 108 accepted flux estimates for Ränskälänkorpi, Lettosuo and Paroninkorpi, respectively. The accepted CH4 fluxes used in this study are available in the Dataset 1 [All datasets (i.e., Datasets 1–6) are freely available from https://doi.org/10.5281/zenodo.7341325].
2.3 Water level, temperature and precipitation
Temperature in the ditches of Ränskälänkorpi, Lettosuo and Paroninkorpi in 2021 were measured using iButton loggers (Maxim Integrated, USA) (see Dataset 2). Furthermore, water table level (WT) of the measurement points was recorded during gas flux measurements using a measurement stick permanently attached to ditch bottom (with a measurement scale). WT was recorded as relative to the WT level in the beginning of June 2021 (see Dataset 3).
For all the datasets, the data on air temperature and precipitation for the study years and 30-year comparison period (1 January 1991–31 December 2020) were gathered from the nearest grid point in the 10 km × 10 km grid dataset of Finnish Meteorological Institute (Venäläinen et al., 2005) (see the Supplementary Material, Supplementary Figures S2–S22). In the Lakkasuo dataset in 1996–1997 (Supplementary Figure S2), the year 1997 was warmer and drier than 1996. The summer temperatures were higher than the 30-year average in 1997, while temperature did not differ from the 30-year average in 1996. Precipitation was similar with the 30-year average in 1997 but higher than that in July and November and lower than that in August and September in 1996. In the Kalevansuo dataset in 2011 (Supplementary Figure S3), the summer was warmer, and July, September and December had higher precipitation than the 30-year average. In the Konilampi and Vesijako dataset in 2012 (Supplementary Figures S4, S5), temperature was comparable to while precipitation was generally higher than the 30-year average. In the dataset of several study areas in 2014–2015 (Supplementary Figure S6–19), the year 2014 was generally warmer and drier than the year 2015. Compared to the 30-year average, the temperatures were slightly higher in summer 2014 but not in 2015. Precipitation was also generally higher than the 30-year average in 2015 whereas it was comparable to the 30-year average in 2014, except for some single rainy months, for example, August 2014 in Könölä, when precipitation was higher than the 30-year average (Supplementary Figure S10). In the Ränskälänkorpi, Lettosuo and Paroninkorpi datasets in 2021 (Supplementary Figures S20–22), the summer was warmer, and May and August had higher and July lower precipitation than the 30-year average.
2.4 Development of CH4 emission factors
The measurement points in the study areas were classified into different ditch types utilizing field observations and photographs. The classification was based on the presence/absence of moss cover and vascular plants (Table 1). Finally, in the development of the CH4 emission factors, 2-type and 4-type classification schemes were used. The 2-type scheme classified measurement points into 1. moss-covered and 2. moss-free, because presence or absence of moss-cover was the most conspicuous factor differing between the study ditches (Table 1). This classification scheme also best supported the estimation of the area of different types of ditches and total ditch CH4 emissions of Finland (see below). The majority of the moss-covered measurement points were covered by Sphagnum mosses, yet some were covered also by other mosses (Table 1, Dataset 1). The ditch types in the 4-type classification scheme were: 1. Sphagnum-covered, vascular plant-free ditches (in short: Sphagnum), 2. Sphagnum- and vascular plant - covered ditches (Sphagnum + vascular), 3. moss-free, vascular plant—covered ditches (vascular), and 4) moss- and vascular plant-free ditches (plant-free). The purpose of the 4-type classification scheme was to develop the most detailed classification possible, considering also the effect of vascular plants in increasing ditch CH4 emissions (e.g., Minkkinen and Laine, 2006), yet each ditch type still containing adequate number of replicates for statistical testing of differences in the CH4 emissions between ditch types (Table 1, Dataset 1). Additionally, there were 10 measurement points, representing rare ditch types in the dataset, which were included in the 2-type classification scheme in the class of moss-covered ditches (Table 1, Dataset 1). These remained outside of the 4-type classification scheme, including ditches covered with Polytrichum commune (common hair moss), co-covered with P. commune and Sphagnum mosses, and co-covered with Calliergon stramineum (calliergon moss), P. commune, Sphagnum mosses and vascular plants, due to too low number of replicates.
Annual CH4 emissions were calculated separately for each measurement point. Emissions were calculated first for the snow-free season simply based on the mean of the measured fluxes during May–October. The only exception was Ränskälänkorpi where the autumn’s last timepoint was at 19 November 2021, which, according to the weather data and field observation still represented snow-free season. For the datasets with two study years (1996–97 and 2014–15, see Table 1), the snow-free season emission was first calculated separately for each study year, after which the mean of the two snow-free seasons was considered as the snow-free season emission for the measurement point. Snowy season (November–April) daily emissions were calculated based on the published relationship between mean daily snow-free season and mean daily snowy season emissions/sinks estimated from data of forestry-drained and undrained peatland soils, which were measured throughout the year (Ojanen et al., 2019), as follows:
where y is the snowy season daily emission/sink and x is the snow-free season daily emission/sink (Ojanen et al., 2019). Only the increasing part of the parabola resulting from equation 2 was considered. Snowy season CH4 emission reached its maximum value, 41.89 mg CH4 m−2 d−1, at snow-free season emission of 528.43 mg CH4 m−2 d−1. Therefore, for snow-free season emissions >528.43 mg CH4 m−2 d−1, the snowy season emission was set at 41.89 mg CH4 m−2 d−1, which happened at only three plant-free measurement points in the Lakkasuo study area (with snow-free season emissions of 536.40, 631.69, and 677.60 mg CH4 m−2 d−1). We acknowledge that the equations used to estimate the winter fluxes are based on data which are not from ditches but from soils of forestry-drained and undrained peatlands (Ojanen et al., 2019). This is because winter ditch measurements have been conducted only in Lakkasuo and Lettosuo (Minkkinen and Laine, 2006; Korkiakoski et al., 2020). However, according to Eq. 2, the snowy season emission is comparatively low, only approximately 8%–16% of the snow-free season emission. This agrees well with the previous ditch data from Lakkasuo, where mean emissions in February were on average 16% of the mean snow-free season emissions (Minkkinen and Laine, 2006), and from Lettosuo, where winter emissions were negligible (i.e., ∼0% of the snow-free season emissions) (Korkiakoski et al., 2020).
The daily snow-free and snowy season emissions were converted into seasonal emissions [i.e., for snow-free (May-October, 184 days) and snowy season emission (Nov-April, 181 days)]. The yearly CH4 emission factor was then calculated as a sum of snow-free and snowy-season emissions for each measurement point. Thereafter, a study area specific emission factor was calculated for each ditch type as mean of all the ditch-type specific measurement points of the particular study area (Table 1). For some study areas, several emission factors were calculated for the same ditch type, if the measurement points represented several site types (Lakkasuo, Leppiniemi, Lylynneva, and Rantasuo), or the area consisted of two separate study sites (Koirasuo, Könölä) (Table 1). The calculated yearly emission factors are available in Dataset 4.
We tested first if site type or dataset type affected the analysis of the differences in yearly CH4 emission factors between different types of ditches. For that, we employed two-way analysis of variance (2-ANOVA). Two models were built, one with 2-type classification (i.e., between moss-covered and moss-free) and site type as factors, and another with 2-type classification and dataset type as factors. For the site type—factor, the study areas were grouped into two groups, 1. Nutrient-rich, including Herb-rich (Rhtkg I and Rhtkg II) and V. myrtillus type (Mtkg I and Mtkg II), and, 2. Nutrient-poor, including Vaccinium vitis-idaea (Ptkg), Dwarf-shrub (Vatkg), and Lichen type (Jätkg) (Table 1). For the dataset type—factor, there were also two groups, 1. Old data, measured during multiple years between 1996 and 2015, with long chamber closure time (20–35 min) and analyzed with GC, and, 2. New data, measured in 2021, with short chamber closure time (3 min) and analyzed with portable gas analyzer (See Table 1 and above for the description of the CH4 flux measurements).
After the preliminary 2-ANOVA analyses showing non-significant effect of site type and dataset type on CH4 emission factors (reported below in Results), the final tests on the differences in yearly CH4 emission factors between different types of ditches were done using t-test and one way analysis of variance (1-ANOVA) for the 2-type and 4-type classification schemes, respectively. Pairwise analyses following 1-ANOVA were conducted via t-test with Holm-Bonferroni adjustment of the p-value. Before t-tests and ANOVA analyses (1-ANOVA and afore-mentioned 2-ANOVA), the data were boxcox-transformed to improve the normality and variance homoscedasticity, which were tested using Shapiro-Wilk and Levene tests, respectively, and also inspected visually from residuals. Before boxcox-transformation, a constant (2 g/m2/y) was added to each value, to make all the values positive. In addition to t-test and 1-ANOVA, the differences in CH4 emission factors between ditch types were assessed via comparison of 95% confidence intervals, which were computed using a non-parametric bootstrap method due to non-normal distribution of the data. All the analyses were conducted in R (v. 4.1.1) (R Core Team, 2021) via R studio (v. 1.4.1106) (RStudio Team, 2020) using the packages MASS (v. 7.3.54) (Venables and Ripley, 2002), stats (v. 4.1.1) (R Core Team, 2021), car (v. 3.1.0) (Fox and Weisberg, 2019) and Hmisc (v. 4.7.0) (Harrell, 2022), and results visualized using the package ggplot2 (v. 3.3.6) (Wickham, 2016).
2.5 Estimation of the areal extent of different types of ditches in Finland
We estimated the areal extent of different types of ditches by 1) building a model to classify ditches into moss-covered and moss-free ditches, and 2) applying the classification model across Finland. We used SINKA database (Penttilä and Honkanen, 1986) to build the classification model. The SINKA database consists of a systematic subsample of the 7th National Forest Inventory field plots on drained peatlands. The field measurements were carried out in 1984–2013 in Southern Finland and in 2001–2013 in Northern Finland. Detailed descriptions of the SINKA data can be found in Penttilä and Honkanen (1986) and previous studies utilizing the data (Repola et al., 2018; Hökkä et al., 2020). In addition to tree stand properties, the field observations included various ditch properties such as depth, age, width, slope, ditch condition, and primary and secondary factors that diminish ditch condition (FDC). In this study, the FDCs were categorized into two classes: 1) Sphagnum mosses and 2) other reasons (such as grasses and weeds, erosion, siltation, logging residues, etc.). Sphagnum mosses were assumed to represent mosses in general as other moss species were not stated in the list of FDCs.
Before utilizing the SINKA data for model building, we checked the data to remove observations unsuitable for this study. In addition to the observations that were found suspicious by Hökkä et al. (2020), the following conditions were used in outlining the data. If ditch condition was marked as “good” or “almost good”, the FDC was allowed to be empty, but otherwise empty FDC observations were removed from the data. Only the ditches made by excavator and ditches classified as drainage ditches (lateral ditches) were included in the model building. Older digging methods were excluded to keep the data consistent with the currently existing forest ditches. FDC was included in the list of observations in the SINKA data only after 1990, which also limits the amount of data.
For model building, the ditches were classified as moss-covered if either primary or secondary FDC was Sphagnum. The accepted data consisted of 2,922 observations of which 1,358 (46%) were moss-covered ditches. The data were shuffled, and similar amount of moss-covered and moss-free observations were picked for model building. The data were divided into training (70%) and validation (30%) data sets to build a random forest (RF) classification model. The model was built using the randomForest package (v. 4.7–1.1) (Liaw and Wiener, 2002) in R. We tested multiple variable combinations and calculated classification error for moss-covered and moss-free ditches using the validation data set (Dataset 5; Dataset 6). In addition, we calculated errors for Southern Finland (north coordinate <7,200 000 in EPSG:2,393 projection) and Northern Finland to make sure the model would not produce geographically biased results. As the tested models tended to overestimate moss-covered ditches in the south and underestimate them in north, we also calculated over/underestimation percentage for both areas. The model for classifying the ditches was chosen based on 1) the availability of data to apply the model across Finland, and 2) the ability of the model to produce accurate and unbiased results for both ditch types and in the south and the north.
To apply the classification model across Finland, we constructed a spatial dataset where forestry-drained peatlands were segmented and assigned with various properties, similar to that described by Haakana et al. (2022). The segmented dataset covered whole Finland. The properties of each segment included segment area, length of ditches, stand volume separately for tree species, site fertility class, elevation, and temperature sums. Stand data were obtained from multisource national forest inventory data. Ditch lengths were calculated as a sum of ditch lines overlapping each segment. Ditch lines and elevation were available as open data from the National Land Survey of Finland. Temperature sums (above 5°C) were obtained from Finnish Meteorological Institute open data and presented as mean values from years 1980–2010. Ditch ages (latest ditching years) were obtained from the Finnish Forest Centre open data. Ditch age was available for 47% of the total ditch area. The classification model was then applied for the segmented data, and as a result the shares of moss-covered and moss-free ditches within Finland were obtained. The areas of both ditch types were calculated assuming 1 m ditch width similarly to the procedure in national GHG inventory (NIR Finland, 2022).
3 Results
3.1 Measured CH4 fluxes in 2021
In this study, we report the temporal variation of ditch CH4 emissions in different types of ditches in detail for the dataset gathered in 2021. The other datasets (from 1996 to 97, 2011, 2012 and 2014–15, see Table 1) were only used in calculations of the CH4 emissions factors (see further). To observe the temporal variation in different types of ditches of the other datasets, we encourage the reader to utilize the CH4 flux data published in Dataset 1.
Overall variation in ditch CH4 fluxes was high, ranging from −412–4,012 µg CH4 m−2 h−1 across the whole dataset, and from −412–3,666 μg CH4 m−2 h−1, from −287–3,816 µg CH4 m−2 h−1 and from −165–4,012 µg CH4 m−2 h−1 for the nutrient-rich peatland forests Ränskälänkorpi, Lettosuo and Paroninkorpi, respectively (Table 2). In addition to the considerable temporal dynamics, which was especially apparent in moss-free ditches, this variation was caused by differences in the vegetation community between the measurement points (Figure 1). The CH4 fluxes were generally higher at moss-free (i.e., open water) measurement points than at moss-covered points (Figure 1). The latter ones could even turn into CH4 sinks occasionally during July-August in Ränskälänkorpi and Lettosuo (Figures 1A, B), which was associated with dry conditions, i.e., high air and ditch temperature (Supplementary Figures S20–23) and lowered WT (Supplementary Figure S24). Furthermore, moss-covered points with vascular plants had occasionally higher CH4 fluxes than moss-covered points which were vascular plant - free (Figure 1). The CH4 fluxes at moss- and vascular plant - covered measurement points were even higher than at plant-free (i.e., moss- and vascular plant—free) points in Ränskälänkorpi in June and July and in Paroninkorpi in July (Figures 1A, C). In the Lettosuo study area, it was also possible to compare CH4 flux between measurement points covered by two different moss genera (Figure 1B). The magnitude and temporal variation in CH4 flux profiles were quite similar between points covered by Polytrichum and Sphagnum mosses (Figure 1B). Yet, CH4 sink was slightly more efficient in Polytrichum- than in Sphagnum-covered measurement points during July, and Polytrichum - covered points had higher CH4 emissions in late September (Figure 1B).
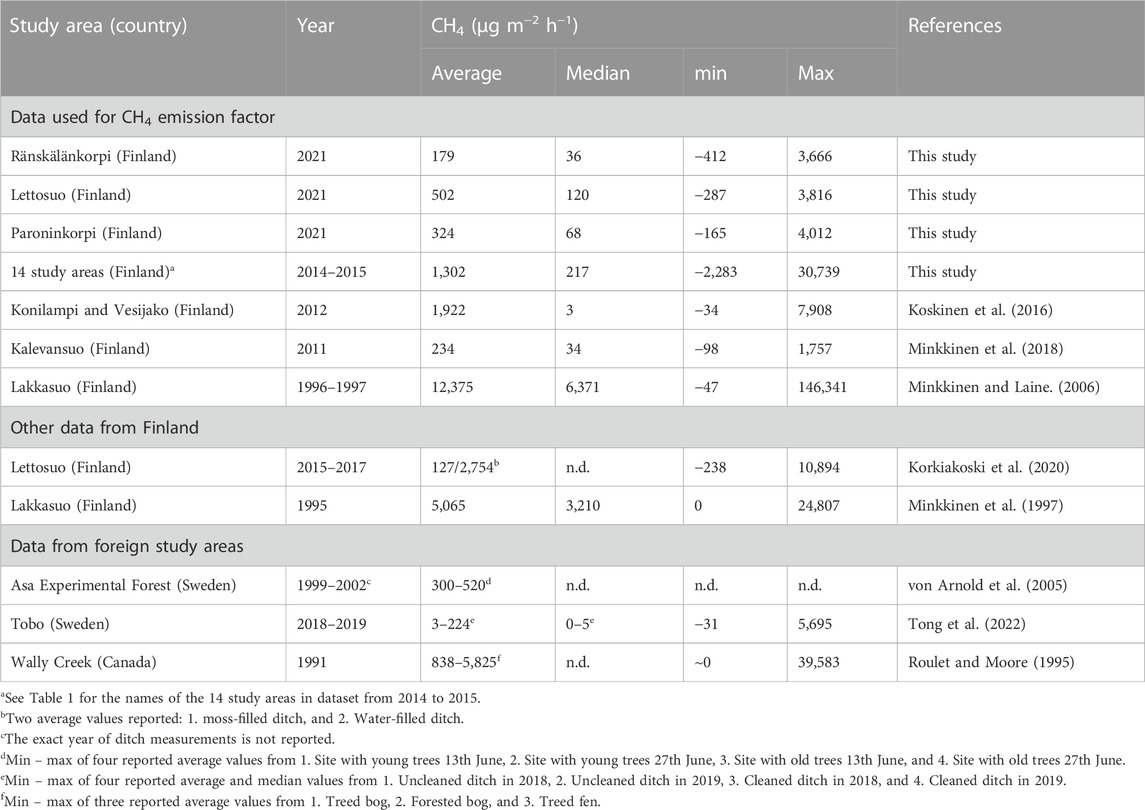
TABLE 2. Average, median and range of CH4 emission/sink measurements from ditches of boreal forestry-drained peatlands in Finland and in other countries.
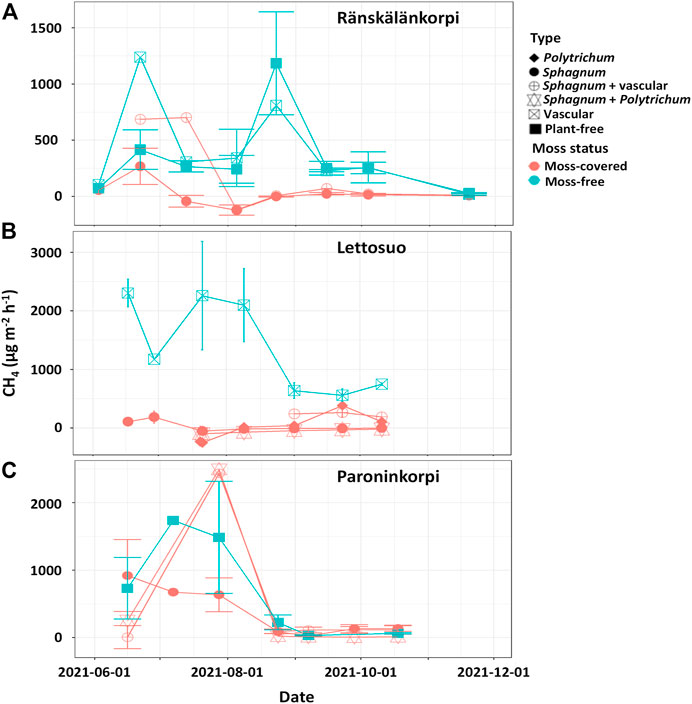
FIGURE 1. Temporal variation of measured CH4 flux in different types of measurement points of ditches (average +/- SE) at (A) Ränskälänkorpi, (B) Lettosuo, and (C) Paroninkorpi forestry-drained peatland area in 2021.
3.2 CH4 emission factors
The ditches in the whole dataset consisting of 21 study areas were classified using 2-type and 4-type classification schemes (Table 1, Dataset 1). According to the preliminary 2-ANOVA analyses, ditch type (i.e., moss-free and moss-covered) had an effect (p < 0.05), while either the site type (nutrient-rich vs. nutrient-poor) or the dataset type (old data 1996–2015 vs. new data 2021) did not affect the CH4 emission factor (p > 0.05, Supplementary Figures S25, S26). However, there was a tendency, albeit only marginally significant (0.05 < p < 0.10), for the CH4 emission to be lower in nutrient-rich than in nutrient-poor sites (Supplementary Figure S25). In addition, based on visual observation of the Supplementary Figure S26, the CH4 emission factor tended to be lower, albeit not statistically significantly, in the new than in the old dataset. As the new dataset consisted only of nutrient-rich sites (i.e., Rhtkg or Mtkg, Table 1), we cannot conclude to what extent the marginally significant differences in CH4 emission factor between the nutrient-rich and the nutrient-poor sites stem from differences in fertility and to what extent from differences in methods between the old and the new datasets (see Materials and Methods). Therefore, and given the non-significant effects of site and dataset type on CH4 emission factor, we decided to calculate the final CH4 emission factors only for different ditch types irrespective of the site type (Table 3).

TABLE 3. CH4 emission factors [mean, standard error (SE), 95% confidence interval (CI), range and number of replicates (N)] for different types of ditches of boreal forestry-drained peatlands in Finland. Different letters in D column show statistical differences between ditch types in the 2-type (t-test, t (31) = −4.0336, p < 0.001) and 4-type classification schemes (1-ANOVA, F (3, 33) = 10.53, p < 0.001; Pairwise t-test with Holm-Bonferroni adjustment of the p-value, p < 0.05), which were also further confirmed by comparison of 95% CIs (i.e., non-overlapping 95% CIs indicate significant difference). The Tier 1 CH4 emission factor (mean, 95% CI and N) for ditches of drained forest land and drained wetland of temperate and boreal area is shown for comparison.
In the 2-type classification scheme, the CH4 emission factor for moss-covered ditches was approximately 1/8 of that for moss-free ditches (Table 3; Figure 2). In the 4-type classification scheme, the CH4 emission factor was lowest for Sphagnum-covered, vascular plant-free ditches, being approximately 1/6 of that for Sphagnum- and vascular plant-covered ditches. The highest emission factors were estimated for plant-free ditches (Table 3; Figure 3). They were approximately 41 and 7 times as high as for the Sphagnum-covered, vascular plant-free and Sphagnum- and vascular plant—covered ditches, respectively (Table 3; Figure 3). The second highest emission factor was observed for moss-free, vascular plant-covered ditches, which differed statistically significantly only from Sphagnum-covered, vascular plant-free ditches (Table 3; Figure 3). Emission factors were also calculated for rare ditch types (those represented by ≤ 2 replicate estimates) including ditches covered with Polytrichum (moss), co-covered with Polytrichum and Sphagnum, and co-covered with Calliergon (moss), Polytrichum, Sphagnum and vascular plants, with the values of same magnitude as Sphagnum-covered, vascular plant-free ditches in the 4-type classification scheme (Table 3). These data were included in analyses based on the 2-type classification (in the type of moss-covered ditches) but was left out from the analyses based on the 4-type classification.
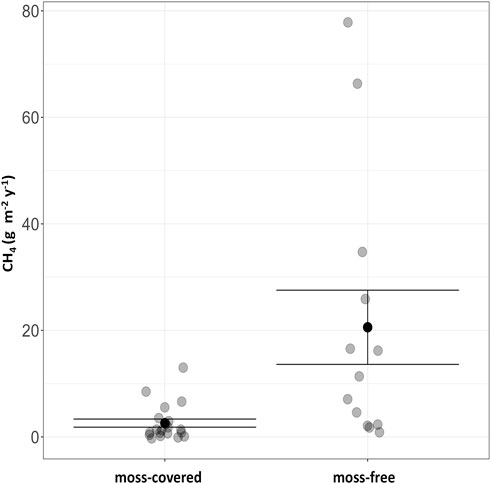
FIGURE 2. CH4 emission factors in the 2-type classification scheme of ditches of boreal forestry-drained peatlands. Shown are average ± SE (in black) calculated from the replicate observations (in grey). The difference between the groups is statistically significant (t-test; t (31) = −4.0336, p < 0.001).
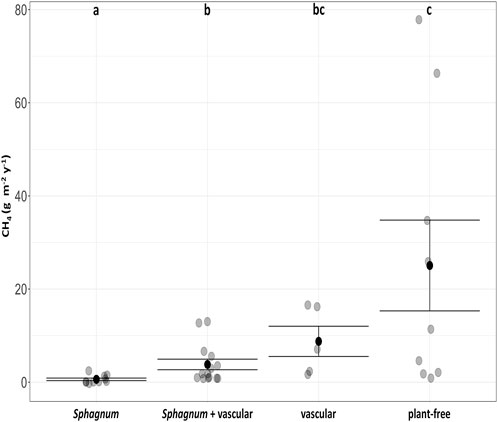
FIGURE 3. CH4 emission factors in the 4-type classification scheme of ditches of boreal forestry-drained peatlands. Shown are average ± SE (in black) calculated from the replicate observations (in grey). Different letter (top-part of the figure) denote significant pairwise differences between groups (1-ANOVA, F (3, 33) = 10.53, p < 0.001; Pairwise t-test with Holm-Bonferroni adjustment of the p-value, p < 0.05).
The mean and 95% confidence interval of the default Tier 1 emission factor for CH4 emissions of ditches of drained forest land and drained wetland of temperate and boreal area (IPCC, 2014) was compared with those developed in this study for different types of ditches of forestry-drained boreal peatlands of Finland (Table 3). Based on the comparison of means and overlapping 95% confidence intervals, the Tier 1 emission factor is similar to our estimates of average CH4 emission factors for moss-free ditches in the 2-type classification scheme and Sphagnum-free vascular plant-covered and plant-free ditches in the 4-type classification schemes (Table 3). In contrast, it is 8 times as high as our estimates for moss-covered ditches in the 2-type classification scheme, and 36 times as high as our estimates for Sphagnum-covered vascular plant-free ditches in the 4-type classification scheme (Table 3). It is also 6 times as high as our estimates for Sphagnum-and vascular plant - covered ditches in the 4-type classification scheme, yet there is slight overlap in the 95% confidence intervals (Table 3). The Tier 1 emission factor is also higher than those estimated for the rare ditch types, i.e., those including also other moss taxa than Sphagnum (Table 3).
3.3 Estimation of the areas of various ditch types
We estimated the area of moss-covered and moss-free ditches of forestry-drained peatlands of Finland. The tested RF classification models produced overall errors with validation data varying from 11% to 19%. Based on mean decrease in accuracy, the most important variables included ditch properties (age, depth, and width) and those related to climatic conditions (north coordinate, temperature sum, and elevation), and peat layer thickness (Dataset 5). In addition, including site fertility, tree species type (coniferous/deciduous), or ditch spacing among the variables improved model performance in many cases. Models RF1, RF3, RF5, and RF25 provided the lowest average of different error types (<12%). Most of the tested models had a tendency to underestimate the area of moss-covered ditches in the north. The model selected for application over Finland (RF25) was able to produce relatively unbiased results with low errors (11%–13%).
The selected model (RF25) included ditch age, north coordinate, elevation, and temperature sum as continuous variables and site fertility as a class variable (Figure 4, Supplementary Figure S27). In nutrient poor sites (V. vitis-idaea type (Ptkg), Dwarf-shrub type (Vatkg)), older age increased the probability of moss-coverage in a ditch until the ditch was 40 years old (Figure 4E). In more fertile sites (Herb-rich type (Rhtkg), V. myrtillus type (Mtkg)), moss-coverage increased until ditch was 30 years old (Figure 4F). North coordinate, elevation, and temperature sum together represent climate conditions in the classification model. The probability of moss coverage increased towards warmer conditions in all ditches (Figures 4A–D). However, the effect was more substantial in less fertile sites.
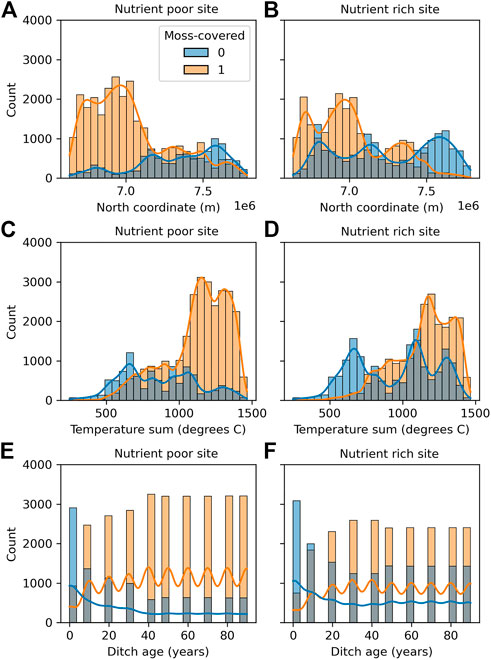
FIGURE 4. Demonstration of classification model RF25 results using regular point grid (10 km spacing within whole Finland, resulting in 3,829 grid points) and varying ditch age (0, 10, ..., 90 years) separately for nutrient poor (A,C,E) and nutrient rich sites (B,D,F). In total, there were 76,580 points to classify. Note that the distributions demonstrate model performance within the 76,580 points, and thus the figures do not represent the real distributions of moss-coverage in Finland since the geographical distribution of ditches and their parameters are different in reality. Note also that the grey bars in the figure represent the areas where the orange and blue bars for moss-covered and moss-free ditches overlap.
Ditch age was available for 47% of the total ditch area. Ditch age varied from 1 to 115 years with mean age being 37 years. The model RF25 was applied over these ditches, and model RF42 was applied to ditches with missing ditch age data. With an overall error of 19%, the model RF42 did not perform as well as models with ditch age as a variable (Dataset 5). A small percentage of ditches did not have all the required variables available for the selected models, and it was assumed that the proportions of moss-covered and moss-free ditches in the results also represent those ditches (Table 4). Applying the models for the segmented data over Finland resulted in 68,359 ha (67%) of moss-covered ditches and 33,349 ha (33%) of moss-free ditches. In southern Finland, 79% of the ditches were classified moss-covered, while in northern Finland 41% were moss-covered. 69% of the ditches were located in southern Finland (70,322 ha).
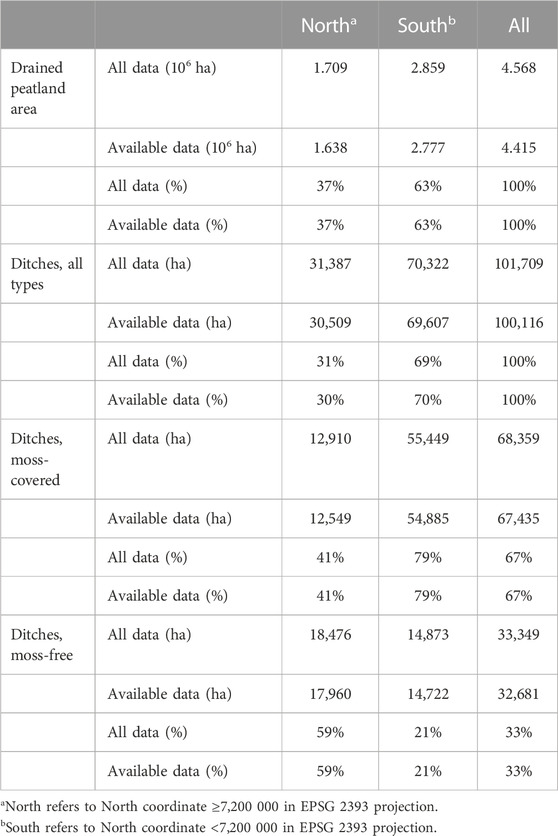
TABLE 4. Drained peatland areas and ditch areas in all segmented data and within the data where parameters were available for application for the random forest classifiers RF25 (segments with ditch age available) and RF42 (segments without ditch age available) (see Datasets 5 and 6).
3.4 Ditch CH4 emissions of forestry-drained boreal peatlands in Finland
With the mean emission factors (Table 3) and estimated ditch areas for moss-covered and moss-free ditches (Table 4), the total ditch CH4 emissions for Finland were 8,600 t a−1 (Table 5). Overall variation in CH4 emissions caused by the 95% confidence level of the emission factor was from 4,000 t a−1 (−54%) to 14,100 t a−1 (+63%).
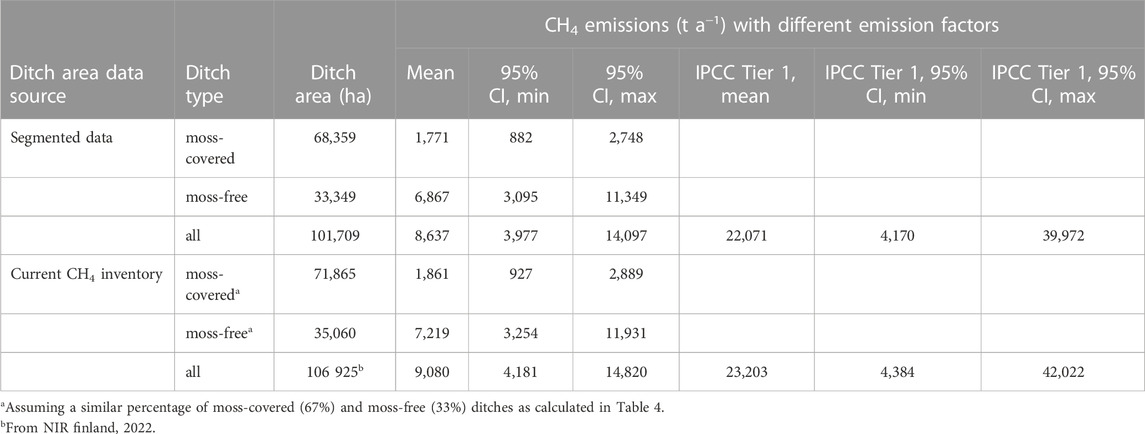
TABLE 5. Ditch areas and CH4 emissions for moss-covered and moss-free ditches in Finland. The shares of moss-covered and moss-free ditch areas (Table 4) are based on the results from models RF25 and RF42 (see Datasets 5 and 6). For emission factors (mean and 95% confidence interval (CI)), see Table 3.
4 Discussion
Our results show that the currently used IPCC Tier 1 emission factor likely overestimates CH4 emissions of ditches of boreal, forestry-drained peatlands in Finland through large overestimation of the emissions of moss-covered ditches, irrespective of whether they harbor potentially CH4 conducing vascular plants (Table 3; Figures 2, 3). Consequently, the usage of the here-developed emission factors and the ditch-type specific areal estimates would lead to a 63% lower estimate of ditch CH4 emissions than previously estimated for the greenhouse gas reporting in Finland (Table 5). Based on the comparison of hourly CH4 fluxes between foreign datasets and the compiled Finnish dataset used for calculation of the CH4 emission factors in this study, the magnitude of CH4 fluxes from ditches of forestry-drained peatlands is not generally different between Finland and other countries (Table 2). This suggests that the Tier 1 emission factor overestimates CH4 emissions of ditches of forestry-drained boreal peatlands also in other countries than in Finland.
4.1 CH4 fluxes of ditches of Ränskälänkorpi, Lettosuo and Paroninkorpi
Overall, the CH4 fluxes measured from the ditches of the three relatively nutrient-rich peatland forests in southern Finland (study sites in Ränskälänkorpi, Lettosuo and Paroninkorpi) in 2021 were of similar magnitude as measured previously for the Finnish site Kalevansuo and study areas in Sweden (Table 2). However, the fluxes were generally lower than measured previously for other Finnish sites as well as for study areas in Canada (Table 2). It is not in the scope of this study to assess the factors affecting differences in CH4 emissions between study areas. However, it can be speculated that the differences between our study and the study from Canada can be due to much younger ditches (ditches dug 7 years before sampling) in the Canadian study area (Roulet and Moore, 1995) than in Ränskälänsuo, Lettosuo and Paroninkorpi (>50 years) (Laurila et al., 2021; Palviainen et al., 2022) during the time of measurements. For Lettosuo, the fluxes measured in this study in 2021 were at the lower end of range measured previously in 2015–2017 (Table 2). This can be due to higher summer temperatures (higher than the 30-year average, Supplementary Figure S21) in 2021 than in 2015–2017 (generally lower than the 30-year average) (Korkiakoski et al., 2020).
The higher fluxes in moss-free than in moss-covered measurement points, and the occurrence of occasional CH4 sinks in moss-covered points (Figure 1), agree with results from previous studies (Minkkinen and Laine, 2006; Korkiakoski et al., 2020). This may be explained by active CH4 - consuming bacteria (methanotrophs) living in and on mosses, especially in and on Sphagnum mosses (Raghoebarsing et al., 2005; Kolton et al., 2022), and in water and sediments below the mosses. In fact, the moss-covered measurement points of two study areas, Ränskälänkorpi and Lettosuo, turned into net CH4 sinks in mid-summer when the WT was at relatively low level (Figures 1A, B; Supplementary Figure S24). This was probably due to decreased WT inducing aerobic conditions and consequently increasing aerobic CH4 oxidation and decreasing in situ methanogenesis. This condition agrees with that in the strips of forestry-drained peatlands which are usually net CH4 sinks (e.g., Huttunen et al., 2003; Korkiakoski et al., 2020). Input of dissolved CH4 from surrounding peat strips via drainage and ground water can be also expected to be lower during periods of low WT, which further decreases emissions from ditches. In addition, it has been shown that Sphagnum leachates potentially inhibit methanogenesis further decreasing methane emissions from moss-covered ditches (Medvedeff et al., 2015).
A slightly stronger occasional CH4 sink was noticed in Polytrichum-covered than in Sphagnum-covered measurement points, and there was also general similarity in the extent and temporal variation in net CH4 fluxes and sinks between Polytrichum and Sphagnum—covered points in Lettosuo (Figure 1B). This suggests that besides Sphagnum, methane oxidation may be associated also with Polytrichum mosses, but further studies are needed to confirm whether Polytrichum mosses harbor active methanotrophs in or on their cells, or whether methanotrophs inhabit the surface sediment or peat below the moss. The occasional high fluxes from moss-covered measurement points having vascular plants also agree with previous studies and is likely due to CH4 being conducted through the aerenchyma of the plants into atmosphere, bypassing the sediment, peat, water and moss-associated methanotrophs (Figure 1) (Schimel, 1995; Frenzel and Karofeld, 2000; Minkkinen and Laine, 2006). Furthermore, plant root exudates can also increase methane production (Waldo et al., 2019).
In addition to the absence of moss-associated methanotrophs, the high CH4 emissions from moss-free open water ditches can be also partially due to higher input of dissolved CH4 from surrounding peat strips via drainage and ground water. Contribution of strip CH4 in ditch emissions has been considered to be especially important in moss-free ditches with moving water, which have much higher CH4 emissions than those with stagnant water (Minkkinen and Laine, 2006; Sirin et al., 2012).
4.2 CH4 emission factors
CH4 emissions from moss-free ditches were much higher than those from moss-covered ditches and the presence of vascular plants increased CH4 emissions from moss-covered ditches (Table 3; Figure 2; Figure 3). These results are consistent with earlier studies (Minkkinen and Laine, 2006; Korkiakoski et al., 2020). Interestingly, there was also a tendency, albeit not statistically significant, for the presence of vascular plants decreasing CH4 emissions from moss-free ditches compared to those without vascular plants (Table 3; Figure 3). As vascular plants can be speculated more likely to take root in stagnant than in flowing water, we assume that the presence and absence of vascular plants in moss-free ditches can reflect water flow dynamics in ditches. Hence, the moss-free ditches with vascular plants more likely include ditches with stagnant water than those without vascular plants. As discussed above, the CH4 emissions are lower from ditches with stagnant than with flowing water (Minkkinen and Laine, 2006; Sirin et al., 2012).
It should be noted here that our estimates on the CH4 emission factors are based on diffusive fluxes, hence, excluding possible ebullition (see Material and Methods). The only existing studies on CH4 ebullition of ditches of boreal forestry-drained peatlands were done in one of our study sites, Lakkasuo, and showed no ebullition in vegetated ditches (Sphagnum and vascular plants) but only in non-vegetated, open water ditches, yet contributing there only 0.2%–22% of the diffusive flux (Minkkinen et al., 1997; Minkkinen and Laine, 2006). Furthermore, our non-quantitative measurements in a non-vegetated, open water ditch in Ränskälänkorpi also suggest that ebullition occurs only infrequently (see Materials and Methods). Hence, our estimates on ditch CH4 emissions can be underestimated, but we do not consider this to affect the major patterns detected in this study. However, due to the rarity of the ebullition data, we think that there is a need for further studies on the quantitative importance of ebullitive CH4 fluxes of different types of ditches of boreal forestry-drained peatlands.
We also acknowledge that there are subjective factors causing uncertainty in the CH4 emission results. As the CH4 measurements from wet surfaces are prone to interferences (gas leaks, unwanted chamber movement, measurement-induced ebullition, and analyzer malfunction), the measurement quality can differ between different persons conducting the measurements. In addition, the post-measurement manual screening of the concentration-time graphs to detect and discard the interfered flux data is partially a subjective process. The visual but not statistically significant difference in CH4 emissions between old data (1996–2015) and new data (2021) (Supplementary Figure S26) also hints towards the possibility that the new measurement method (i.e., short chamber closure time; portable gas analyzer) would lead to lower estimates of CH4 emissions than the old method (long chamber closure time; GC) used in majority of the previous studies (Supplementary Table S1). This could be tested in future studies, because the new method is being increasingly used. We also acknowledge that the calculation of the CH4 emission factors was based on a simplified approach, i.e., calculation of mean snow-free season CH4 emission and estimation of the snowy season emission from the snow-free season emission using published equations (see Materials and Methods). Future studies could also measure snowy season emissions, despite they should not much affect the yearly CH4 emission estimate (i.e., are only on average 0%–16% of snow-free season emissions) of ditches of boreal, forestry-drained peatlands (Minkkinen and Laine, 2006; Korkiakoski et al., 2020). In future, process-based modelling, taking into account factors known to affect microbial processes and ditch CH4 emissions, e.g., temperature, hydrological conditions, water movement, water quality, vascular plant and moss community, and moss-associated methanotrophy, could be useful in even more accurate estimations of ditch CH4 emissions and in predicting their changes under changing climate and forestry and land-use practices.
Within time, the majority of ditches of forestry-drained peatlands can be expected to be covered by mosses. For instance, in southwestern Finland mosses typically cover 35% and 43% of the ditches already 5 or 10 years after ditch cleaning, respectively (Silver and Joensuu, 2005). Also, in our model (RF25), age increased the probability of moss-coverage in a ditch until the ditch was 30–40 years old (Figures 4E, F; Supplementary Figure S27). Based on our results on the much lower CH4 emissions estimated for moss-covered than for moss-free ditches, ditch age leads to decreased CH4 emissions. Active ditch network maintenance via ditch cleaning, i.e., removal of soil, moss and other plants from ditches, is a typical forestry practice to sustain and improve the drainage conditions of forest soils (Nieminen et al., 2018). In rotation forestry, which is the most common forest management method in Finland and the other Nordic countries, ditch cleaning is applied to lower the increased water table level, caused by decreased evapotranspiration after clearcutting, to enhance growth of new tree seedlings. Based on our results, removing moss-cover of the ditches is expected to increase their CH4 emissions. Hence, this suggests that the current practice in Finland, towards minimizing ditch network maintenance (i.e., ditch cleaning) to decrease the discharge of suspended solids, would also decrease the ditch CH4 emissions.
However, according to the only existing study, a case study from Sweden, on the effects of post-harvest ditch cleaning on ditch CH4 emissions in forestry-drained peatlands, cleaned ditches have lower CH4 emissions than uncleaned ditches during the first 2 years after ditch cleaning (Tong et al., 2022). This can be due to higher occurrence of water-logged conditions in uncleaned than in cleaned ditches (Tong et al., 2022). Waterlogged conditions likely enhance methanogenesis via anaerobiosis. Furthermore, in uncleaned ditches, vascular plants likely conduct CH4 to the atmosphere and generate labile methanogenic compounds. However, the ditches studied by Tong et al. (2022) were relatively dry, which may have had increased soil aeration leading to decreased CH4 emissions via increased and decreased within-ditch CH4 oxidation and methanogenesis, respectively. Dry conditions (low WT) can be also expected to have decreased ditch CH4 emissions via decreasing CH4 transport from strips to ditches. The contrary outcomes by our study and Tong et al. (2022) suggests that the effects of ditch cleaning on ditch CH4 emissions depend on the hydrological conditions and the prior extent and quality of plant and moss coverage, and, thus, require further studies. However, it must be noted that while Tong et al. (2022) compared the CH4 emissions of newly cleaned ditches to those of old ditches, the ditches in our dataset had not been cleaned lately making it difficult to directly compare the studies. Furthermore, in contrast to Tong et al. (2022) including only one study area, our dataset of 21 study areas covered ditches of varying hydrological conditions (from dry to wet) and study years with varying temperature and precipitation compared to the 30-year average (Supplementary Figures S2–S22). Hence, combining data from these 21 study areas, we can generalize to ditches of boreal forestry-drained peatlands to conclude that removal of moss-cover via ditch cleaning likely increases CH4 emissions from ditches.
It should be, however, noted, that without ditch cleaning after clearcutting, the increase in the water table level can cause the CH4 sink of forest floor to decrease and can even turn the forest floor to a CH4 source (Korkiakoski et al., 2019). In contrast, in continuous cover forestry, where only part of the tree stand is removed in cuttings, ditch cleaning is not necessary, since the water level is kept at a sufficiently low level by sustained evapotranspiration (Leppä et al., 2020a; Leppä et al., 2020b). Consequently, as suggested by results of Korkiakoski et al. (2020), the forest floor CH4 emissions do not increase after partial harvesting. Recent modelling results also suggest that financially profitable continuous cover forestry may be sustained without ditch network maintenance when the post-harvest basal area is higher than 10 m2 ha-1 (Juutinen et al., 2021).
Soil preparation after clearcuttings, via mounding and scalping, can also affect the forest floor CH4 emissions (Pearson et al., 2012). In addition to mounding, ditch-mounding is an often-applied method to create mounds for tree seedlings to enhance their growth. Digging of the mound material results in shallow ditches, which can affect water flow directions but do not belong to the main ditch networks and hence have only marginal effects on the drying process of forestry-drained peatlands. The surface area of ditches resulting from ditch-mounding is currently not known but can be reasonably large. Their CH4 emissions are also not taken into account in the national GHG inventory (NIR Finland, 2022). Given the high CH4 emissions detected in this study for plant-free ditches, we suggest that the CH4 emissions of the ditches resulting from ditch-mounding should be taken into account in future GHG inventories.
4.3 CH4 emissions from ditches of forestry-drained peatlands in Finland
Our results suggest that ditch CH4 emission estimate for Finland (Table 5) may be clearly smaller (8,637 t a−1) than previously estimated for the greenhouse gas reporting (23,203 t a−1) (NIR Finland, 2022). This is a result of the lower emission factors for moss-covered ditches that were discussed above, and the proportions of ditch area estimates for ditch types. We estimated that 67% of the ditches were moss-covered. Silver and Joensuu. (2005) found that in southwestern Finland mosses typically cover 35% and 43% of the ditches already 5 or 10 years after ditch cleaning, respectively. The average ditch in Finland is most likely older because ditch cleaning is recommended at 20–40-year intervals (Vanhatalo et al., 2019). Thus, it can be assumed that in southern Finland the moss-coverage would be clearly over 43%. Based on the restricted SINKA data, which covered wider geographic area, average ditch age was 18 and 19 years, and the share of moss-covered ditches was 53% and 38% in southern and northern Finland, respectively. The higher proportion of moss-covered ditches can be at least partly explained by the older ditches in the data used in this study. The occurrence of ditch cleaning has been strongly decreasing in Finland in the last 20 years (Natural Resources Institute Finland, 2022), which could explain the high mean age of ditches.
The random forest model was based on drainage ditches which leads to uncertainties in estimating other ditch types. Collector ditches and main ditches are typically deeper and carry more water which increases the possibility for erosion. Applying our classification model to such ditches could overestimate the moss-coverage because ditch depth data was not available. However, drainage ditches are the most typical ditch type in forestry drainage and thus the overall overestimation should not be large.
In the selected classification model (RF25), the probability for moss-covered ditches increased with ditch age until ditches were 30–40 years old (Figures 4E, F; Supplementary Figure S27). After that the situation was quite stable. This could indicate that moss-coverage is established within 40 years if it is established at all. In fertile sites, moss coverage was established sooner than in less fertile sites. However, it should also be noted that most of the ditches in the training data were less than 40 years old which could lead to stable classification results in older ditches. In the model results, the probability for moss-coverage was higher in less fertile sites (Figure 4). Such a trend can also be seen in the sites listed in Table 1. Silver and Joensuu. (2005) also found out that Sphagnum moss coverage in peatland ditches was higher in less fertile sites. Possible reasons could include that Sphagnum mosses typically grow in nutrient poor sites and light conditions in ditches are more favorable in less fertile sites with sparser tree stands. Sparser tree stand can also help in keeping water table level from falling below ditch bottom level during dry periods which can be beneficial for mosses. However, the specific mechanisms behind the differences caused by site fertility remain unclear and require further studies.
5 Conclusion
Moss-free ditches may have several times higher methane emissions than moss-covered ditches in forestry-drained boreal peatlands. The IPCC default Tier 1 emission factor significantly overestimates CH4 emissions of moss-covered ditches of forestry-drained boreal peatlands in Finland and the use of ditch type-specific emission factors can improve substantially the accuracy of ditch emissions estimates. The majority of the ditches (67%) were classified as moss-covered ditches, which together with the new emission factors resulted in 63% lower CH4 emission estimate for ditches of peatland forests in Finland than in the current GHG inventory. Furthermore, our results indicate that the current practice in Finland to minimize ditch-network maintenance by ditch cleaning will likely decrease CH4 emissions from ditches, since old moss-covered ditches have very low CH4 emissions.
Data availability statement
The datasets presented in this study can be found online in Zenodo repository: https://doi.org/10.5281/zenodo.7341325.
Author contributions
AR, Formal analysis, Investigation, Writing-Original Draft, Writing-Review and Editing, Visualization. PO, Conceptualization, Formal analysis, Investigation, Writing-Review and Editing, Project Administration, Funding acquisition. LS, Formal analysis, Investigation, Writing-Review and Editing, Visualization. TL, Conceptualization, Investigation, Writing-Review and Editing, Project Administration, Funding acquisition. JA, Software, Formal analysis, Resources, Data curation, Writing-Review and Editing. ST, Methodology, Formal analysis, Investigation, Writing-Review and Editing. KM, Investigation, Writing-Review and Editing, Funding acquisition. MK, Investigation, Writing-Review and Editing. RM, Conceptualization, Writing-Review and Editing, Project Administration, Funding acquisition, Resources. All authors have read and agreed to the published version of the manuscript.
Funding
This study was part of Maaperätiedon kehittäminen (MaaTi) project funded by Ministry of Agriculture and Forestry of Finland. The measurements of the 2014–2015 data were funded by LIFE+ (LIFEPeatLandUse, LIFE12ENV/FI/150). Open access funding was provided by Tampere University.
Acknowledgments
We thank Timo Penttilä for providing us with data, Hannu Hökkä for supporting the processing of SINKA data and random forest model building, Petri Salovaara for coordinating the field measurements. We also want to thank Kyle Eyvindson, Aura Salmivaara, Andras Balazs, and Markus Haakana for providing and helping with the drained peatland segmented data. In addition, the following persons are acknowledged for their contribution in flux measurements in the field: Ilona Kerovuori, Juulia Suikula, Oona Keskisaari, Tiia Määttä, Tiina Heikkinen, Angela Lafuente, Kaisa Silvan, Mari Parkkari and Raimo Pikkupeura. The authors also wish to acknowledge CSC—IT Center for Science, Finland, for computational resources. Reviewers are acknowledged for their valuable comments and suggestions that improved the paper.
Conflict of interest
The authors declare that the research was conducted in the absence of any commercial or financial relationships that could be construed as a potential conflict of interest.
Publisher’s note
All claims expressed in this article are solely those of the authors and do not necessarily represent those of their affiliated organizations, or those of the publisher, the editors and the reviewers. Any product that may be evaluated in this article, or claim that may be made by its manufacturer, is not guaranteed or endorsed by the publisher.
Supplementary material
The Supplementary Material for this article can be found online at: https://www.frontiersin.org/articles/10.3389/fenvs.2023.1121969/full#supplementary-material
References
Cooper, M. D. A., Evans, C. D., Zielinski, P., Levy, P. E., Gray, A., Peacock, M., et al. (2014). Infilled ditches are hotspots of landscape methane flux following peatland re-wetting. Ecosystems 17, 1227–1241. doi:10.1007/s10021-014-9791-3
Cooper, M., and Evans, C. (2013). “CH4 emissions from ditches in a drained upland blanket bog, North Wales, UK,” in Emissions of greenhouse gases associated with peatland drainage waters. Report to Defra under project SP1205: Greenhouse gas emissions associated with non-gaseous losses of carbon from peatlands – fate of particulate and dissolved carbon (Food and Rural Affairs, UK: Report to the Department of Environment).
Fox, J., and Weisberg, S. (2019). An R companion to applied regression. Third Edition. Thousand Oaks, California (USA): Sage. Avaliable At: https://socialsciences.mcmaster.ca/jfox/Books/Companion/.
Frenzel, P., and Karofeld, E. (2000). CH4 emission from a hollow-ridge complex in a raised bog: The role of CH4 production and oxidation. Biogeochemistry 51, 91–112. doi:10.1023/A:1006351118347
Glagolev, M. V., Chistotin, M. V., Shnyrev, N. A., and Sirin, A. A. (2008). The emission of carbon dioxide and methane from drained peatlands changed by economic use and from natural mires during the summer-fall period (on example of a region of Tomsk oblast). Agrokhimija 5, 46–58.
Haakana, M., Tuominen, S., Heikkinen, J., Peltoniemi, M., and Lehtonen, A. (2022). Spatial patterns of biomass change across Finland in 2009–2015. bioRxiv. doi:10.1101/2022.02.15.480479
Harrell, F. E. (2022). Hmisc: Harrell miscellaneous. R package version 4.7-0. Avaliable At: https://CRAN.R-project.org/package=Hmisc.
Heikkinen, T. K. (2016). Ennallistamisen vaikutus metsänkasvatuskelvottomien karujen keidassoiden metaanivirtoihin. Master thesis. Helsinki, Finland: University of Helsinki. Avaliable At: http://urn.fi/URN:NBN:fi:hulib-201606092345.
Hökkä, H., Stenberg, L., and Laurén, A. (2020). Modeling depth of drainage ditches in forested peatlands in Finland. Balt. For. 26, 453. doi:10.46490/BF453
Huttunen, J. T., Lappalainen, K. M., Saarijärvi, E., Väisänen, T., and Martikainen, P. J. (2001). A novel sediment gas sampler and a subsurface gas collector used for measurement of the ebullition of methane and carbon dioxide from a eutrophied lake. Sci. Total Environ. 266, 153–158. doi:10.1016/s0048-9697(00)00749-x
Huttunen, J. T., Nykänen, H., Martikainen, P. J., and Nieminen, M. (2003). Fluxes of nitrous oxide and methane from drained peatlands following forest clear-felling in southern Finland. Plant Soil 255, 457–462. doi:10.1023/A:1026035427891
IPCC (2014). 2013 supplement to the 2006 IPCC guidelines for national greenhouse gas inventories: Wetlands. Switzerland: IPCC.
Juutinen, A., Shanin, V., Ahtikoski, A., Rämö, J., Mäkipää, R., Laiho, R., et al. (2021). Profitability of continuous-cover forestry in Norway spruce dominated peatland forest and the role of water table. Can. J. For. Res. 51, 859–870. doi:10.1139/cjfr-2020-0305
Kolton, M., Weston, D. J., Mayali, X., Weber, P. K., McFarlane, K. J., Pett-Ridge, J., et al. (2022). Defining the Sphagnum core microbiome across the North American continent reveals a central role for diazotrophic methanotrophs in the nitrogen and carbon cycles of boreal peatland ecosystems. mBio 13, e03714–e03721. doi:10.1128/mbio.03714-21
Korhonen, K., Ahola, A., Heikkinen, J., Henttonen, H., Hotanen, J., Ihalainen, A., et al. (2021). Forests of Finland 2014–2018 and their development 1921–2018. Silva Fenn. 55, 10662. doi:10.14214/sf.10662
Korkiakoski, M., Ojanen, P., Penttilä, T., Minkkinen, K., Sarkkola, S., Rainne, J., et al. (2020). Impact of partial harvest on CH4 and N2O balances of a drained boreal peatland forest. Agric. For. Meteorol. 295, 108168. doi:10.1016/j.agrformet.2020.108168
Korkiakoski, M., Tuovinen, J., Penttilä, T., Sarkkola, S., Ojanen, P., Minkkinen, K., et al. (2019). Greenhouse gas and energy fluxes in a boreal peatland forest after clear-cutting. Biogeosciences 16, 3703–3723. doi:10.5194/bg-16-3703-2019
Koskinen, M., Maanavilja, L., Nieminen, M., Minkkinen, K., and Tuittila, E-S. (2016). High methane emissions from restored Norway spruce swamps in southern Finland over one growing season. Mires Peat 17, 1–13. doi:10.19189/MaP.2015.OMB.202
Laine, J., Vasander, H., Hotanen, J. P., Nousiainen, H., Saarinen, M., and Penttila, T. (2012). Suotyypit ja turvekankaat – opas kasvupaikkojen tunnistamiseen. Helsinki: Metsäkustannus Oy, 160.
Larmola, T., Tuittila, E., Tiirola, M., Nykänen, H., Martikainen, P. J., Yrjälä, K., et al. (2010). The role of Sphagnum mosses in the methane cycling of a boreal mire. Ecology 91, 2356–2365. doi:10.1890/09-1343.1
Laurila, T., Aurela, M., Hatakka, J., Hotanen, J., Jauhiainen, J., Korkiakoski, M., et al. (2021). Set-up and instrumentation of the greenhouse gas (GHG) measurements on experimental sites of continuous cover forestry. Natural resources and bioeconomy studies 26. Helsinki, Finland: Natural Resources Institute Finland.
Leppä, K., Hökkä, H., Laiho, R., Launiainen, S., Lehtonen, A., Mäkipää, R., et al. (2020b). Selection cuttings as a tool to control water table level in boreal drained peatland forests. Front. Earth Sci. 8, 576510. doi:10.3389/feart.2020.576510
Leppä, K., Korkiakoski, M., Nieminen, M., Laiho, R., Hotanen, J. P., Kieloaho, A. J., et al. (2020a). Vegetation controls of water and energy balance of a drained peatland forest: Responses to alternative harvesting practices. Agric. For. Meteorol. 295, 108198. doi:10.1016/j.agrformet.2020.108198
Liaw, A., and Wiener, M. (2002). Classification and regression by randomForest. R. News 2, 18–22. Avaliable At: https://CRAN.R-project.org/doc/Rnews/.
Martikainen, P. J., Nykänen, H., Alm, J., and Silvola, J. (1995). Change in fluxes of carbon dioxide, methane and nitrous oxide due to forest drainage of mire sites of different trophy. Plant Soil 168/169, 571–577. doi:10.1007/BF00029370
Matthews, C. J. D., Louis, St.V. L., and Hesslein, R. H. (2003). Comparison of three techniques used to measure diffusive gas exchange from sheltered aquatic surfaces. Environ. Sci. Technol. 37, 772–780. doi:10.1021/es0205838
Medvedeff, C. A., Bridgham, S. D., Pfeifer-Meister, L., and Keller, J. K. (2015). Soil Biol. biochem. 86, 34–41. doi:10.1016/j.soilbio.2015.03.016
Minkkinen, K., Laine, J., Nykänen, H., and Martikainen, P. J. (1997). Importance of drainage ditches in emissions of methane from mires drained for forestry. Can. J. For. Res. 27, 949–952. doi:10.1139/x97-016
Minkkinen, K., and Laine, J. (2006). Vegetation heterogeneity and ditches create spatial variability in methane fluxes from peatlands drained for forestry. Plant Soil 285, 289–304. doi:10.1007/s11104-006-9016-4
Minkkinen, K., Ojanen, P., Penttilä, T., Aurela, M., Laurila, T., Tuovinen, J., et al. (2018). Persistent carbon sink at a boreal drained bog forest. Biogeosciences 15, 3603–3624. doi:10.5194/bg-15-3603-2018
Natural Resources Institute Finland (2022). Statistics database. Finland: Natural Resources Institute Finland. Avaliable At: https://statdb.luke.fi/PXWeb/pxweb/en/LUKE/.
Nieminen, M., Piirainen, S., Sikström, U., Löfgren, S., Marttila, H., Sarkkola, S., et al. (2018). Ditch network maintenance in peat-dominated boreal forests: Review and analysis of water quality management options. Ambio 47, 535–545. doi:10.1007/s13280-018-1047-6
NIR Finland (2022). Greenhouse gas emissions in Finland 1990 to 2021. National inventory report under the UNFCC and the kyoto protocol. Finland: Statistics Finland. Avaliable At: https://unfccc.int/documents/461893.
Ojanen, P., Minkkinen, K., Alm, J., and Penttilä, T. (2010). Soil–atmosphere CO2, CH4 and N2O fluxes in boreal forestry-drained peatlands. For. Ecol. Manag. 260, 411–421. doi:10.1016/j.foreco.2010.04.036
Ojanen, P., Penttilä, T., Tolvanen, A., Hotanen, J., Saarimaa, M., Nousiainen, H., et al. (2019). Long-term effect of fertilization on the greenhouse gas exchange of low-productive peatland forests. For. Ecol. Manag. 432, 786–798. doi:10.1016/j.foreco.2018.10.015
Paavilainen, E., and Päivänen, J. (1995). Peatland forestry. Heidelberg: Springer Berlin. doi:10.1007/978-3-662-03125-4
Palviainen, M., Peltomaa, E., Laurén, A., Kinnunen, N., Ojala, A., Berninger, F., et al. (2022). Water quality and the biodegradability of dissolved organic carbon in drained boreal peatland under different forest harvesting intensities. Sci. Total Environ. 806, 150919. doi:10.1016/j.scitotenv.2021.150919
Peacock, M., Audet, J., Bastviken, D., Futter, M. N., Gauci, V., Grinham, A., et al. (2021). Global importance of methane emissions from drainage ditches and canals. Environ. Res. Lett. 16, 044010. doi:10.1088/1748-9326/abeb36
Pearson, M., Saarinen, M., Minkkinen, K., Silvan, N., and Laine, J. (2012). Short-term impacts of soil preparation on greenhouse gas fluxes: A case study in nutrient-poor, clearcut peatland forest. For. Ecol. Manag. 283, 10–26. doi:10.1016/j.foreco.2012.07.011
Penttilä, T., and Honkanen, M. (1986). Suometsien pysyvien kasvukoealojen (SINKA) maastotyöohjeet [Field work guide for measuring permanent peatland sample plots]. Metsäntutkimuslaitoksen Tied. 226, 98.
R Core Team (2021). R: A language and environment for statistical computing. Vienna, Austria: R Foundation for Statistical Computing. Avaliable At: https://www.R-project.org/.
Raghoebarsing, A. A., Smolders, A. J., Schmid, M. C., Rijpstra, W. I., Wolters-Arts, M., Derksen, J., et al. (2005). Methanotrophic symbionts provide carbon for photosynthesis in peat bogs. Nature 436, 1153–1156. doi:10.1038/nature03802
Repola, J., Hökkä, H., and Salminen, H. (2018). Models for diameter and height growth of Scots pine, Norway spruce and pubescent birch in drained peatland sites in Finland. Silva Fenn. 52, 10055. doi:10.14214/sf.10055
Roulet, N. T., and Moore, T. R. (1995). The effect of forestry drainage practices on the emission of methane from northern peatlands. Can. J. For. Res. 25, 491–499. doi:10.1139/x95-055
RStudio Team (2020). RStudio. Boston, Massachusetts (USA): Integrated Development for R. RStudio, PBC. Avaliable At: http://www.rstudio.com/.
Saunois, M., Stavert, A. R., Poulter, B., Bousquet, P., Canadell, J. G., Jackson, R. B., et al. (2020). The global methane budget 2000–2017. Earth Syst. Sci. Data 12, 1561–1623. doi:10.5194/essd-12-1561-2020
Schimel, J. P. (1995). Plant transport and methane production as controls on methane flux from arctic wet meadow tundra. Biogeochemistry 28, 183–200. doi:10.1007/BF02186458
Silver, T., and Joensuu, S. (2005). Ojien kunnon säilymiseen vaikuttavat tekijät kunnostusojituksen jälkeen [The condition and deterioration of forest ditches after ditch network maintenance]. Suo 56, 69–81. Avaliable At: http://www.suo.fi/article/9839.
Sirin, A. A., Suvorov, G. G., Chistotin, M. V., and Glagolev, M. V. (2012). Values of methane emission from drainage ditches. Environ. Dyn. Glob. Clim. Change 3, 1–10. doi:10.17816/edgcc321-10
Tolvanen, A., Saarimaa, M., Ahtikoski, A., Haara, A., Hotanen, J., Juutinen, A., et al. (2018). “Quantification and valuation of ecosystem services to optimize sustainable re-use for low-productive drained peatlands,” in LIFEPeatLandUse (LIFE12 ENV/FI/000150) 2013 – 2018, LAYMAN’S report (Helsinki, Finland: ENVFI).
Tong, C. H. M., Nilsson, M. B., Sikström, U., Ring, E., Drott, A., Eklöf, K., et al. (2022). Initial effects of post-harvest ditch cleaning on greenhouse gas fluxes in a hemiboreal peatland forest. Geoderma 426, 116055. doi:10.1016/j.geoderma.2022.116055
Vanhatalo, K., Väisänen, P., Joensuu, S., Sved, J., Koistinen, A., and Äijälä, O. (2019). Metsänhoidon suositukset suometsien hoitoon, työopas. Tapion julkaisuja: Tapio. Avaliable At: https://tapio.fi/wp-content/uploads/2020/09/Metsanhoidon_suositukset_suometsien-hoitoon_TAPIO_2019.pdf.
Venables, W. N., and Ripley, B. D. (2002). Modern applied statistics with S. Fourth edition. New York: Springer.
Venäläinen, A., Tuomenvirta, H., Pirinen, P., and Drebs, A. (2005). A Basic Finnish climate data set 1961–2000—description and illustrations. Helsinki, Finland: Finnish Meteorological Institute. doi:10.13140/RG.2.2.24473.62567
Virtanen, P., Gommers, R., Oliphant, T. E., Haberland, M., Reddy, T., Cournapeau, D., et al. (2020). SciPy 1.0: Fundamental algorithms for scientific computing in Python. Nat. Methods 17, 261–272. doi:10.1038/s41592-019-0686-2
von Arnold, K., Weslien, P., Nilsson, M., Svensson, B. H., and Klemedtsson, L. (2005). Fluxes of CO2, CH4 and N2O from drained coniferous forests on organic soils. For. Ecol. Manag. 210, 239–254. doi:10.1016/j.foreco.2005.02.031
Waldo, N. B., Hunt, B. K., Fadely, E. C., Moran, J. J., and Neumann, R. B. (2019). Plant root exudates increase methane emissions through direct and indirect pathways. Biogeochemistry 145, 213–234. doi:10.1007/s10533-019-00600-6
Keywords: methane, IPCC emission factor, greenhouse gas (GHG), peatland, ditch, drainage, forestry, moss
Citation: Rissanen AJ, Ojanen P, Stenberg L, Larmola T, Anttila J, Tuominen S, Minkkinen K, Koskinen M and Mäkipää R (2023) Vegetation impacts ditch methane emissions from boreal forestry-drained peatlands—Moss-free ditches have an order-of-magnitude higher emissions than moss-covered ditches. Front. Environ. Sci. 11:1121969. doi: 10.3389/fenvs.2023.1121969
Received: 12 December 2022; Accepted: 24 March 2023;
Published: 05 April 2023.
Edited by:
David Widory, Université du Québec à Montréal, CanadaReviewed by:
Gerald Jurasinski, University of Rostock, GermanyMichelle Garneau, Université du Québec à Montréal, Canada
Copyright © 2023 Rissanen, Ojanen, Stenberg, Larmola, Anttila, Tuominen, Minkkinen, Koskinen and Mäkipää. This is an open-access article distributed under the terms of the Creative Commons Attribution License (CC BY). The use, distribution or reproduction in other forums is permitted, provided the original author(s) and the copyright owner(s) are credited and that the original publication in this journal is cited, in accordance with accepted academic practice. No use, distribution or reproduction is permitted which does not comply with these terms.
*Correspondence: Antti J. Rissanen, YW50dGkucmlzc2FuZW5AdHVuaS5maQ==