 Sudeep Banad
 Yongping Wei
 C. T. Dhanya
 Ron Johnstone2
- 1The UQ-IITD Academy of Research (UQIDAR), Indian Institute of Technology, Delhi, India
- 2School of Earth and Environmental Sciences, University of Queensland, St Lucia, QLD, Australia
- 3Department of Civil Engineering, Indian Institute of Technology, Delhi, India
River systems have been stressed by the construction of dams and regulation structures which influence aquatic ecosystem integrity. Previous studies considered the general significance of regional streamflow regimes for aquatic communities, but they did not investigate the influence of specific components of flow regimes on aquatic ecosystems under the combined impact of regulation and extreme drought events, limiting our ability to design and implement precise environmental flow management strategies. This study aims to quantify the relationship between macroinvertebrate biotic indices and ecologically important streamflow characteristics derived from five natural flow regime components by investigating the spatiotemporal variation in the macroinvertebrate assemblage in regulated and unregulated reaches and identifying specific flow indices that have a direct impact on macroinvertebrates in the Goulburn basin in Victoria, Australia during the Millennium Drought period. The relationship between dominant flow metrics and macroinvertebrates indices was investigated using boosted regression trees (BRT). The results revealed a significant difference in hydrological variability between regulated and unregulated reaches. The regulated reaches demonstrated reduced hydrological variability during low flow periods, and rapid increase in discharge during high flow periods when compared to unregulated reach. Unregulated reach had 38% more taxa richness than regulated reach impacted by hydropeaking. Eight indicator taxa were identified in the unregulated reach, and they exhibited a higher Stream Invertebrate Grade Number Average Level (SIGNAL 2) score, indicating that they were highly sensitive species. The maximum flow in June was the most important flow parameter that influences the macroinvertebrate indices as per the BRT model. Better management of environmental flows will benefit from identifying which aspects of the natural flow regime impact stream ecosystems and predicting the consequences of altered flow regimes on aquatic ecosystems.
1 Introduction
Despite covering less than 1% of the Earth’s surface, freshwater ecosystems support 9.5% of all known species (Dudgeon et al., 2006). River systems have been increasingly stressed by the construction of dams and water diversion schemes to meet the rising demand for energy and water (Grill et al., 2019). As a result, the flows downstream of these regulatory structures are heavily modified. The regulatory structures have a direct influence on the five flow regime components that constitute the natural flow regime—magnitude, frequency, duration, timing, and rate of change. They influence aquatic ecosystem integrity through their effects on nutrient availability and biological interaction, and also have a negative influence on the river morphology and connectivity (Poff et al., 1997; Bunn and Arthington, 2002; Pringle, 2003; Poff and Zimmerman, 2010; Satake and Ueno, 2013). It is increasingly evidenced that river connectivity loss has compromised the river’s essential functions of providing diverse habitats and maintaining ecosystem integrity (Carlisle et al., 2011; Ellis and Jones, 2013; Tonkin et al., 2018; Reid et al., 2019). Climate change, specific changes in the frequency and intensity of extreme events, is expected to exacerbate these problems even further (IPCC, 2014). In the south of Australia, the response and recovery of aquatic communities to modifications in flow and longer-duration droughts is a key concern for river management authorities (Pollack et al., 2011).
Previous research into the relationships between river regulation and aquatic communities discovered that dams have significantly altered aquatic communities, with regulatory structures acting as a barrier to lotic fauna migration (Nilsson et al., 2005; Pelicice et al., 2015; Chi et al., 2017; Wang et al., 2020). Dams were found to influence both the structure and functional traits of fish communities (Arthington et al., 2004; Arthington et al., 2014). It was also found that biotic indices reacted negatively to regulation (Gillespie et al., 2015), altered flow regimes caused by hydropower production resulted in direct mortality in macroinvertebrates (Beghelli et al., 2012; Bruno et al., 2013), and the undisturbed forested habitats have higher macroinvertebrate abundance than hydrologically altered habitats (Asmamaw et al., 2021). These studies considered the general importance of regional streamflow regimes for aquatic communities, but they did not directly quantify the relationship between flow regimes and biotic assemblages (Fremier and Strickler, 2011; Wohl, 2012). Steel et al. (2018) focussed on spring snowmelt flows and their impact on macroinvertebrate community, while studying the relationship between streamflow and macroinvertebrates. Furthermore, there is limited understanding of the combined impact of regulation and extreme drought events on aquatic ecosystems, specifically considering the changes in flow regime (Chessman, 2015; Grabowski and Gurnell, 2016). This has compromised our capacity for designing and implementing more precise environmental flow regimes that support multiple ecological functions and aquatic biodiversity with less trade-off of flows for economic development (Poff and Zimmerman, 2010; Yarnell et al., 2016).
This paper seeks to better understand how aquatic communities respond to flow changes caused by regulation during extreme droughts. Our analysis specifically examines the spatio-temporal impact of regulation and the Millennium drought on macroinvertebrate communities to support environmental flow design and management for both regulated and unregulated river reaches. The macroinvertebrate assemblages will be examined as they are key species in the aquatic food web and are ideal for understanding how the entire aquatic food web responds to changes in natural streamflow (Wilkinson et al., 2019). In addition, when compared to fish and certain other aquatic species, the movement of macroinvertebrate assemblages is generally smaller in scale and more representative of local environmental changes. However, it is important to note that some macroinvertebrate species, particularly aquatic insects, can have flying adults that enable dispersal overland and waterborne drifting (Dos Santos et al., 2011; Goteli and Colwell, 2011; Armanini et al., 2014; White et al., 2017; Wang et al., 2020). Specifically, we aim to quantify the relationship between macroinvertebrate biotic indices and ecologically relevant streamflow characteristics based on five components of the flow regime in both regulated and unregulated reaches of the Goulburn River, Australia from 2005 to 2011, which corresponded to Australia’s Millennium Drought period, the longest continuous period of below-median rainfall in southeast Australia (Van Dijk et al., 2013).
2 Methods
2.1 Study area
Goulburn River is part of the Murray-Darling Basin (MDB), which is one of the world’s largest drainage systems (Leblanc et al., 2012). The Goulburn River rises in the Great Dividing Range and joins the Murray River upstream of Echuca in Victoria, Australia. Goulburn Valley covers only 16,800 km2 or less than 2% of the MDB’s total area, but it accounts for nearly 11% of the MDB’s annual inflow. The Goulburn River is well-known for its environmental, Aboriginal cultural heritage, and recreational values. The catchment’s average rainfall ranges from 1,600 mm in the south to 500 mm in the north. The Goulburn River has two instream storages, Lake Eildon (3,334 GL) and Goulburn Reservoir (25.5 GL), both of which are connected to off-stream storage, Waranga Basin (432 GL). Green Lake (28 GL) is another Goulburn River off-stream storage area. The Goulburn River is one of MDB’s most intensively regulated rivers, supporting a large irrigation area of over 15,000 ha (Davies et al., 2010). The Millennium Drought, which lasted from 1997 to 2009, resulted in record low water availability. By 2007, Victoria’s primary water storages had only 26% of their long-term normal volume, and the average annual rainfall was 13% lower than the long-term average (DELWP, 2016)). The drought had a massive environmental impact, causing the extinction of riparian, floodplain, wetland, and lake species, as well as iconic trees such as the river red gum and many bird and fish species (Mac Nally et al., 2011; Ellis and Jones, 2013; Van Djik et al., 2013).
The Goulburn River is home to a range of native flora and fauna species which are threatened. These species depend on aquatic habitats directly or indirectly. A total of 85 riverine bird species have been recorded in the Goulburn Broken catchment, 25 of these are recognised as threatened (www.vewh.vic.gov.au), 18 native and nine introduced fish species are found in the Goulburn River system (www.mdba.gov.au). Additionally, a vast range of invertebrates inhabit the Goulburn riverine environment and play an important role in maintaining the riverine food web. The operation of Lake Eildon and the Goulburn Weir has significantly altered the river’s natural flow regime. During dry periods, the flow below these structures is primarily determined by irrigation demand and other consumptive demands, resulting in low flow in winter/spring and high flow in summer/autumn (Patil et al., 2020). This disrupts the natural flow pattern and has an impact on the Goulburn Valley River ecosystem, which was rated as having very poor health in the Sustainable River Audit (SRA) 1 and SRA 2 assessments (Davies et al., 2010; Davies et al., 2012). The Goulburn Broken Catchment Management Authority oversees managing water entitlements for the environment, environmental deliveries are only a small proportion of flow in the river (11% of total available volume). Nearly 400 GL of high-security environmental water rights in the Goulburn River are used to meet local environmental objectives and downstream environmental flows in the Murray River (John et al., 2021).
Based on the possible influence of regulation structures, we divided the Goulburn River into five hydrologically distinct reaches in this study, as shown in Figure 1. The study area design is inspired by previous studies by Petts, (2009), Chee et al., (2009) and the system map of Victorian Environmental Water Holder, 2015 authority (https://www.vewh.vic.gov.au/rivers-and-wetlands/northern-region/goulburn-river). Reach 1 is the unregulated upper Goulburn River from its headwaters to Lake Eildon; previous research has largely overlooked this section of the river. Reach 2 runs from Lake Eildon to Seymor and is heavily regulated as well as influenced by hydropeaking. Reach 3 connects Seymor to the Nagambie. Reach 4 Nagambie to Loch Garry. Reach 5 Loch Garry to the River Murray.
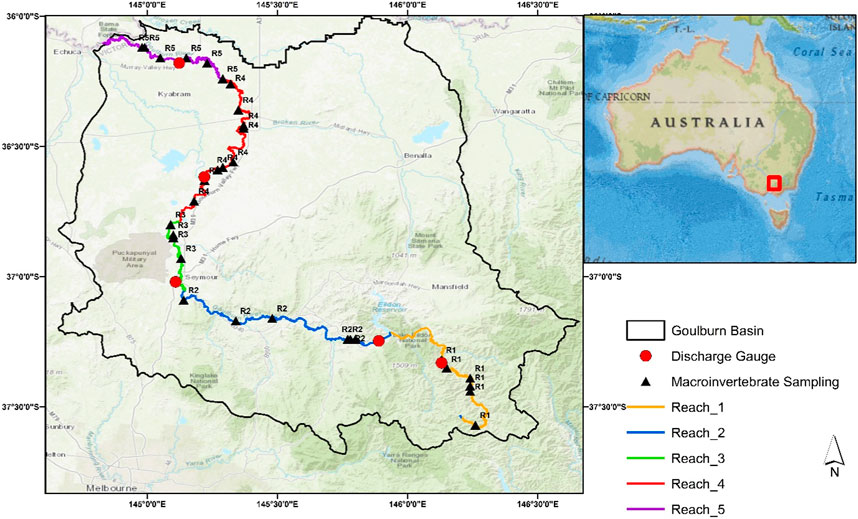
FIGURE 1. Map of the Goulburn River Catchment with macroinvertebrate sampling sites and hydrologic gauge stations.
2.2 Macroinvertebrate data processing
Macroinvertebrate data were obtained from the Sustainable Rivers Audit (Murray-Darling Basin Authority, 2019, SRA; Davies et al., 2010). The benthic macroinvertebrate sampling was conducted from 2005 to 2011, every alternate year as part of Sustainable River Audit (SRA). The number of sites was determined by power analyses at the valley scale, and a stratified-random sampling approach was used to select 35 sites per valley. The sampling protocol, which was based on the Australian River Assessment Scheme, was refined during a pilot audit (AUSRIVAS). When possible, both edge and riffle habitats were sampled, and sampling was done during low-flow conditions in either spring or autumn. For our study, we selected 31 (four sites had inconsistent data) macroinvertebrate sampling sites in the Goulburn River basin (Davies et al., 2010). Reach 1, 2, 3, 4 and 5 each had 6, 6, 4, 8, and 7 sampling sites, respectively. Macroinvertebrates were sampled using the AUSRIVAS kick sampling method, macroinvertebrates samples were collected using a 250 µm mesh pond net. Sample processing also followed AUSRIVAS protocols with live or laboratory sorting and identification.
The macroinvertebrates were identified up to the family level. Four indicators most frequently used in biomonitoring surveys were calculated to identify both spatial and temporal variation in macroinvertebrates (De Cáceres and Legendre, 2009), namely, richness, abundance, Shannon diversity and Ephemeroptera, Plecoptera, Trichoptera (EPT) Index. Macroinvertebrate richness is the number of benthic taxa in the sample. Abundance represents the number of individuals of each family in the sample. Higher values of richness and abundance indicate better habitat conditions for benthic invertebrates. Shannon diversity (a measure of diversity) was calculated using the proportion of individuals per taxon (Magurran, 2005). The EPT percentage was calculated as the proportion of all individuals belonging to the Ephemeroptera (mayflies), Plecoptera (stoneflies), and Trichoptera (caddisflies) families (Barbour, 1999). Because Ephemeroptera, Plecoptera, and Trichoptera include many families that are sensitive to poor water quality and habitat disturbance, the EPT indicator is used to express overall stream condition (Thomson et al., 2012).
To understand the spatial and temporal aspects of community distribution, non-metric multidimensional scaling (NMDS) was used to examine the general trends in macroinvertebrate communities between sampling sites and years. The invertebrate data were square-root transformed before analysis. Indicator analysis was then used to check which taxa contributed to distinct community structures between the study reaches. Determining a small set of indicator taxa is essential for long-term environmental surveillance. The “multipatt” function in R’s indicspecies package (de Cáceres et al., 2015) was used to analyse indicator taxa. A site randomization procedure that reallocates samples among sample groups was used to test the significance (999 permutations).
2.3 Hydrological data processing
We examined five major hydrological gauging stations in the Goulburn catchment for this study: Doherty, Eildon, Seymor, Murchison, and McCoy Bridge (Figure 1). We made certain that the gauge stations chosen were spatially distributed in accordance with the study reaches. Doherty is the upstream station, located in reach 1 of the basin’s unregulated section. Eildon station is located just below Lake Eildon (reach 2), Seymor station is in reach 3. Murchison is in reach 4 and the most downstream station, McCoy Bridge in reach 5. Although historic flow data for all five stations (dating back to 1977) were available from the Department of Environment, Land, Water, and Planning (DELWP, 2019; Erdozain et al., 2019) (https://data.water.vic.gov.au/static.htm) and the Bureau of Meteorology Australia (BoM, 2009) (http://www.bom.gov.au/water/floods/floodWarningServices.html).
As macroinvertebrate data was only available from 2005 to 2011, we considered flow data from all stations from 2005 to 2011 to quantify specific streamflow metrics that influence macroinvertebrates. Previous research has focused on average flow conditions (Moss et al., 1987; Townsend et al., 1997), variation in mean daily flow (Horwitz, 1978), flow skewness, and peak discharges (McMahon et al., 1992; Nathan and McMahon, 1992). Recent research has begun to evaluate hydrologic indices using a multivariable approach to understand how the magnitude, frequency, duration, timing, and rate of change represent the five most critical components of the flow regime to regulate the ecological processes in river ecosystems (Boulton, 2003; Olden and Poff, 2003).
In this analysis, we wanted to select hydrologic indices that characterise the Goulburn basin in terms of biologically relevant flow variables and describe overall variability in hydrologic regimes. Eight-six flow-based indicators from these five critical components of the flow regime (magnitude, frequency, duration, timing, and rate of change) were calculated to comprehensively reflect the influence of hydrological metrics (Supplementary Table S1) on macroinvertebrates indices. Out of this, the dominant flow indices were identified using Principal Component Analysis (PCA) with the method outlined by Olden and Poff (2003), Change (2014) to minimize the redundancy between the hydrologic variables. The set of dominant indices was further examined with the Pearson correlation and the indices with r-value greater than 0.9 were removed, to handle the collinearity (White et al., 2017). Finally, we added a categorical variable ‘regulation’ (1- present, 0- absent). This variable was used to separate reach 1 which was non-regulated from the remaining four reaches.
2.4 Relationship analysis
Boosted regression trees (BRT) were used for assessing the relationship between dominant flow metrics and macroinvertebrates indices. BRT, which draws on insights from both the statistical and Machine Learning (ML) traditions, employs a boosting technique to adaptively combine a large number of relatively simple tree models to optimise prediction performance (Elith et al., 2008; Yu et al., 2020). BRT can accept predictors that are numeric, categorical, or binary (Elith et al., 2008), and they do not assume normality, nor a linear relationship between predictor and response variable.
BRT models were used to explain macroinvertebrate community variation based on the dominant set of hydrologic variables. To reduce overfitting, the learning rate was set to 0.001. Because the invertebrate sample size was small, 0.75 of the training data samples were used to build each tree, and stochastic gradient boosting was used to minimise prediction error (De’ath, 2007). The complexity of the tree was chosen to allow for second-order interaction effects. A five-fold cross-validation technique was used to determine the number of trees with the lowest prediction error (De’ath, 2007), which was also used to evaluate the BRT performance.
3 Results
3.1 Flow regimes
Lake Eildon is an important water reservoir, especially during wetter months when it accumulates a large volume of water. During the drier seasons and summer months, the stored water is gradually released to meet consumer demands. These changes driven by regulation were prominent in reach 2 which is just below reservoir Eildon. Reach 2 experienced a rapid increase in discharge peaks which was not exhibited by the station Doherty, located in unregulated reach 1 (Figure 2). The Acheron, Taggerty, and Yea Rivers are among the unregulated tributaries that contributed to flow variability downstream of Lake Eildon. The Broken River and Seven Creeks, which flow downstream of Goulburn Weir, added flow variation to Goulburn’s regulated downstream reach 4.
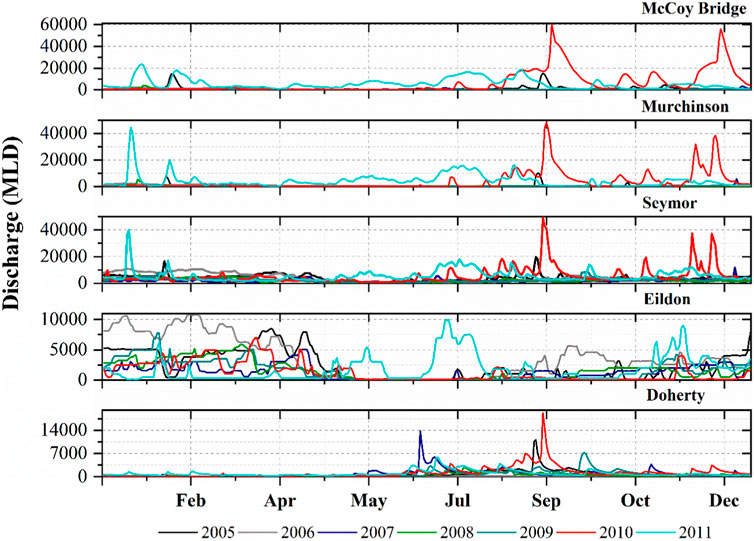
FIGURE 2. Discharge series at each of the five stations Doherty is in reach 1, Eildon in reach 2, Seymor reach 3, Murchinson reach 4 and McCoy Bridge reach 5.
The study period was heavily influenced by the Millennium Drought, and the study reaches experienced a longer duration of low flows from 2005 to 2009, particularly the upper and lower reaches (reach 1, reach 4 and reach 5). During the drought years, the Doherty station recorded a 28% decrease in total annual flows compared to the long-term average, as well as the lowest summer and autumn flows on record (19,005 MLD and 12,488 MLD respectively). The drought ended in 2010 when a powerful La Nina event brought widespread heavy rainfall and flooding (Hendon et al., 2014), and except for Eildon, Lake Eildon reservoir was at 29% capacity in 2010 and the majority of the inflow was used to fill the capacity. The impact of La Nina can be seen in the peaks of the remaining stations for 2010.
To ensure that the majority of the variation is captured and that various aspects of the flow regimes are adequately represented in model results, the hydrologic indices for all five stations were meticulously examined. The unregulated Doherty station still followed a natural hydrograph pattern with low flows during the summer season (December to February) and the 3 months with the most flow were July, August, and September. The operation of Lake Eildon has reduced the July-September flows passing Eildon to 33% of the annual total, allowing a 23 percent increase in the January-March flows. The hydrologic indices that take frequency into account revealed that the number of low pulse count events was higher in unregulated reach 1 Doherty station than in downstream reach 2 and reach 3.
The results of PCA, where the first three principal component axes are statistically significant. The three axes together explain 94% variation. We then selected 27 indices with the highest percentage contribution from these axes (Figure 3). These indices were tested for collinearity and finally, we selected 9 significant and noncollinear hydrologic variables presented in Table 1. These nine hydrologic variables for five-gauge stations were used as inputs for the BRT model.
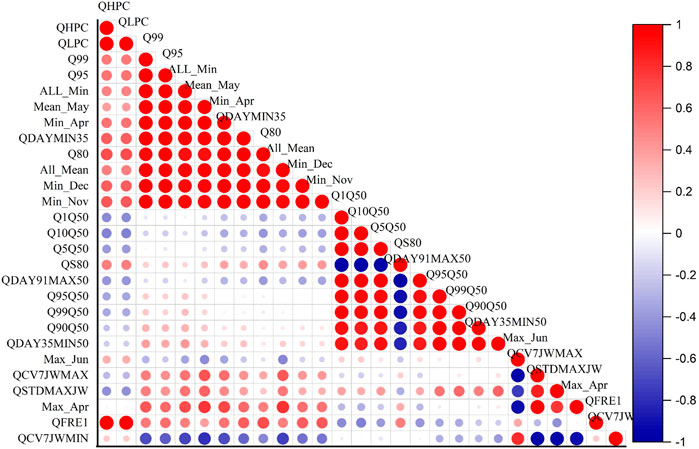
FIGURE 3. The significance of each variable from collinearity test. The blue segment of the correlation colour bar indicates a strong negative correlation, and the red segment indicates a strong positive correlation.
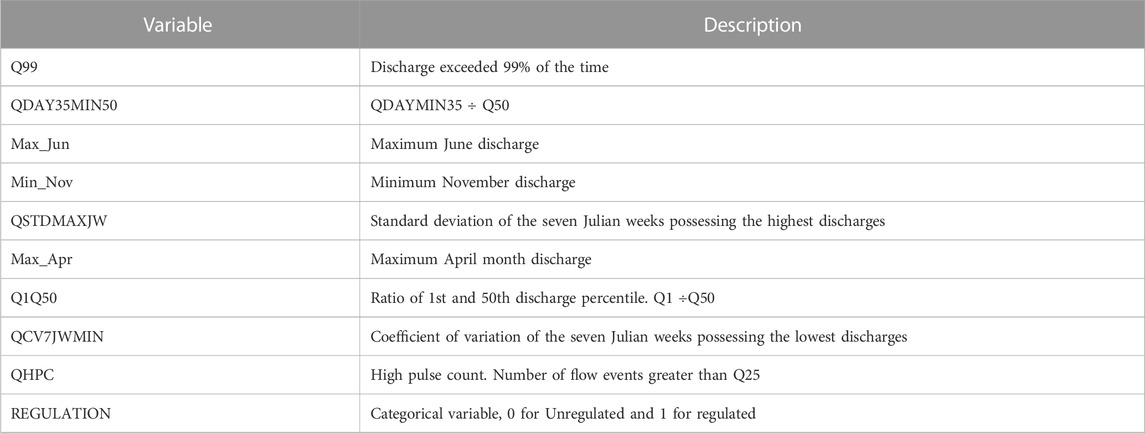
TABLE 1. Final hydrologic variables selected for boosted regression tree model.
3.2 Macroinvertebrate indices and community composition
In total, a substantial number of macroinvertebrates, amounting to 9,133 individuals from 98 families, were collected in this study. The analysis demonstrated a significant variation among the different reaches, as depicted in Figure 4B. Among the collected macroinvertebrate taxa, Diptera, Ephemeroptera, Hemiptera, and Trichoptera were found to be the dominant orders, collectively constituting 73% of the total macroinvertebrate abundance. Corixidae, Chironomidae, Leptoceridae, Leptophlebiidae and Veliidae were the dominant families constituting nearly half of the sampled macroinvertebrates.
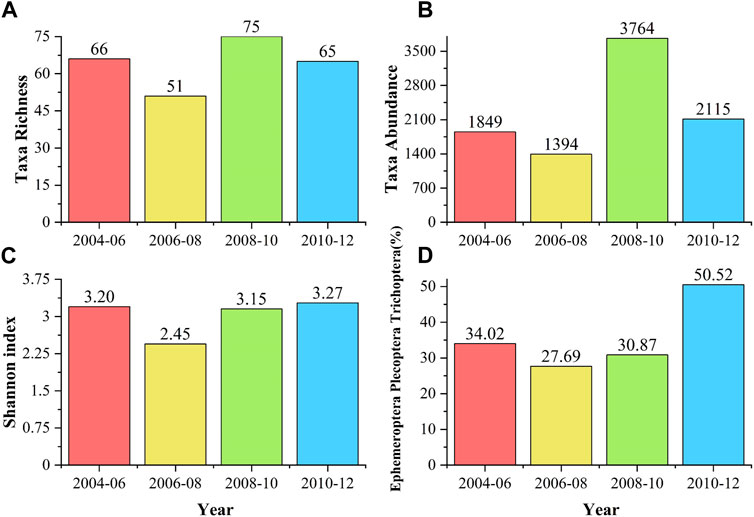
FIGURE 4. Analysis of macroinvertebrate indices by collection year (A) richness (B) abundance (C) Shannon index (D) Ephemeroptera Plecoptera Trichoptera (EPT) Index.
All four macroinvertebrate indices were higher in samples collected in the 2008–10 and 2010–12 cycles. When compared to drought-year samples, the 2008–10 and 2010–12 samples had a 12% increase in richness and a 35% increase in abundance (Figure 4A). The EPT index was also higher in post-drought year samples.
Figure 5 depicts the distribution of taxa among the study reaches. The unregulated reach (R1) had a 61.1% higher taxa richness score (30.67) compared to the regulated reach (19.06). An analysis of variance (ANOVA) was performed to evaluate the influence of the Reach on the taxa richness. The results indicated a statistically significant impact [F (4, 26) = 2.814, p = 0.045]. The analysis demonstrated notable disparities among the means of the groups, suggesting that the “Reach” factor had a significant impact on the outcome. The results of the ANOVA test examining the effect of reach on taxa abundance revealed that the main effect of reach was not statistically significant [F (4, 26) = 1.14, p = 0.360]. The mean taxa abundance value for R1 (462) was better compared to the regulated reaches. The reach just below Lake Eildon had the least taxa abundance.
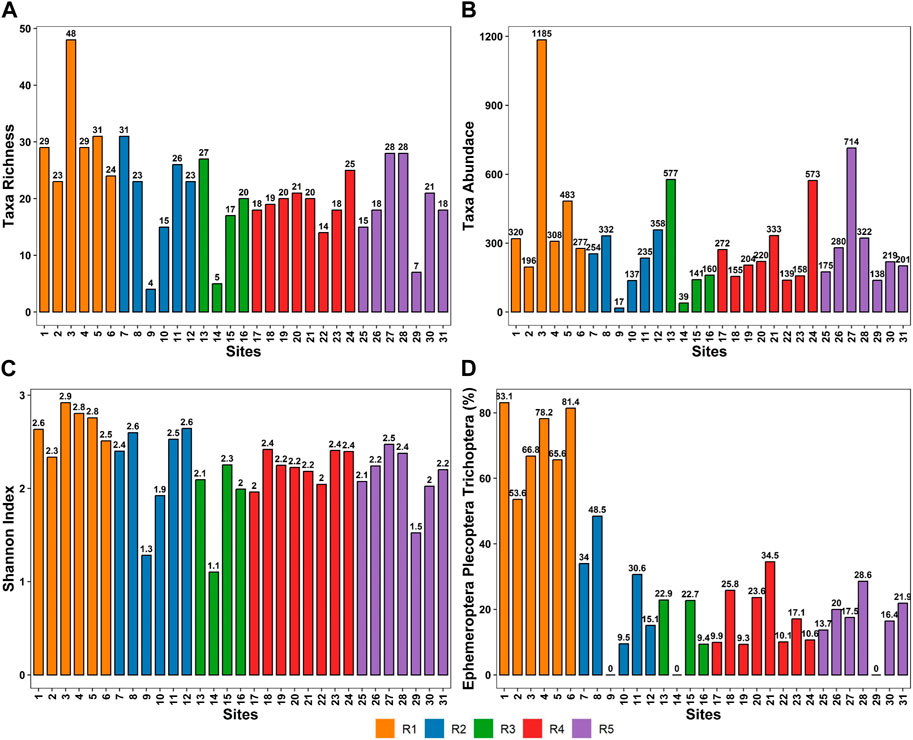
FIGURE 5. Analysis of macroinvertebrate indices by reach, each column represents the value in that site (A) richness (B) abundance (C) Shannon index (D) EPT index.
The reach variable influenced macroinvertebrate diversity significantly [F (4, 26) = 3.508, p = 0.0203]. This suggests that the regulated and unregulated stretches of the river had a considerable impact on the Shannon Diversity of macroinvertebrates. The EPT index had the most drastic variability among reaches, according to the reach-by-reach analysis. Reach 1 had an average EPT index value of 71%, indicating that the majority of the macroinvertebrates in the area are sensitive to human impact. Reach 2, Reach 3, Reach 4 and Reach 5 had EPT index values of 22%, 14%, 17.5% and 16.5%, respectively, indicating that macroinvertebrates with high resistance to human impact and pollution were sampled (Figure 5). The ANOVA results indicate a significant and substantial main effect of Reach on the EPT Index [F (4, 26) = 24.49, p < .001]. This finding suggests that there are notable differences in the EPT Index values across the different reaches. The effect size (Eta2 = 0.79) indicates that approximately 79% of the variability in the EPT Index can be attributed to the variation in Reach. This strong effect size further supports the importance of Reach in influencing the EPT Index values.
Atyidae (6%), Baetide (4%), Chirnomidae (16%), Corixide (7%), Leptocervidae (5%), and Melonthidae (4%) were the most dominant macroinvertebrates between 2004–06 and 2006–08. The majority of these had low SIGNAL 2 scores, indicating high pollution tolerance and resistance to reduced flows (Figure 6). Gripopterygidae (9%), Hydroptilidae (6%), Simuliidae (5%), and Tipulidae (4%) were highly dominant invertebrates in the post-drought sample, these taxa prefer turbulent rocky substrate. These are pollutant sensitive and have high SIGNAL 2 scores. The Shannon index values indicated that taxa diversity was slightly higher in the post-drought period. Two-dimensional NMDS (k = 2, stress = 0.153) was plotted to visualise the dissimilarity among macroinvertebrate communities according to study reaches.
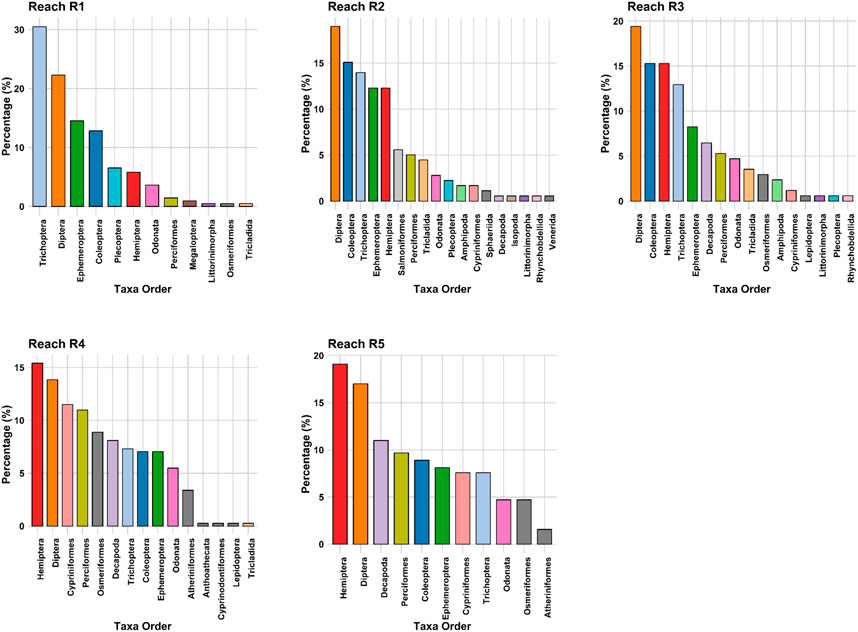
FIGURE 6. Percentage of taxa per taxa group in the five reaches of the Goulburn River.
Reach 2 sampling sites were isolated remaining invertebrate sampling sites. The variation in community assemblage across the reaches was also visible in the NMDS plot (Figure 7). The invertebrate communities from reaches 1 was clearly clustered, indicating a similar composition. The downstream reach 4 and 5 also had a cluster. It also suggests that the invertebrates in these reaches were similar across the sampling period. Table 2 summarises the findings of the indicator taxa analysis. The invertebrates identified as indictor taxa in reach 1 had a higher SIGNAL 2 score, indicating that they were highly sensitive taxa (the mean SIGNAL score for reach 1 was 7.75). The remaining reaches did not have any single indicator taxa with higher IndVal(>0.7).
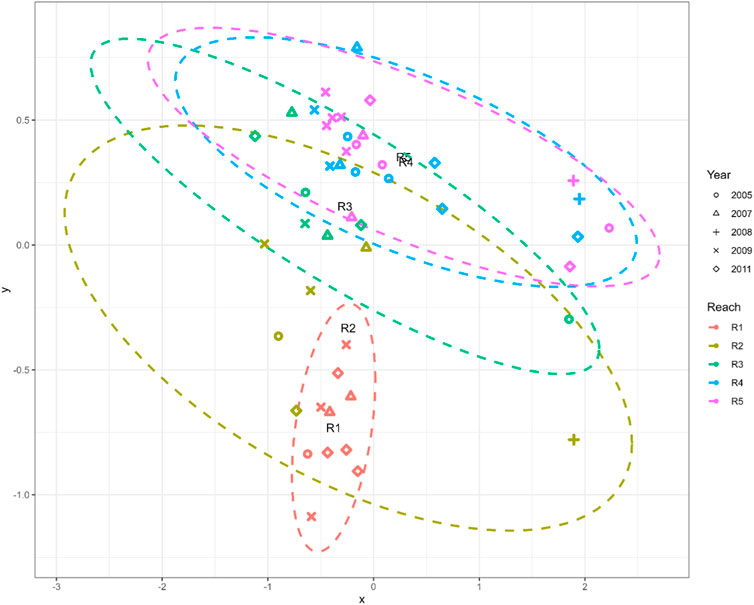
FIGURE 7. NMDS plot of reach and taxa.
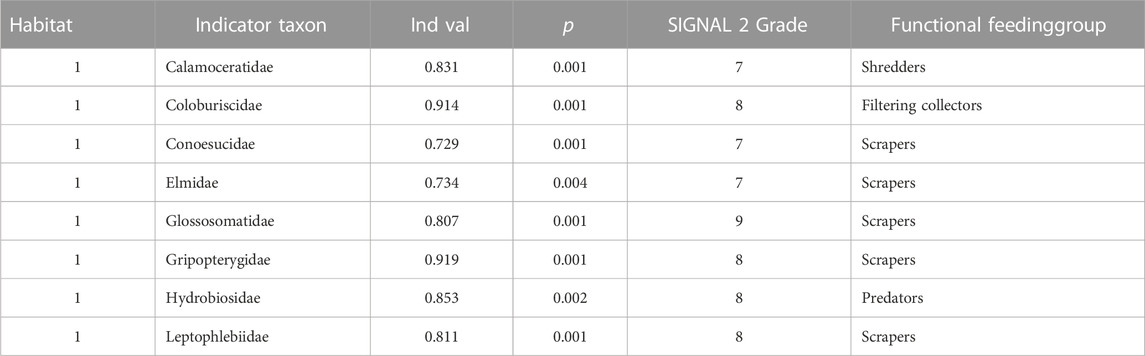
TABLE 2. Indicator taxa and SIGNAL 2 Grade.
3.3 Boosted regression trees
The maximum discharge for June (Max Jun) had the highest impact on all four invertebrate indices (Figure 8). Max Jun had the highest relative influence (RI) of 29.97% when it came to taxa richness. The coefficient of variation of seven Julian weeks with the lowest discharge (QCV7JWMIN), which is a variable that considers flow timing, had the second-highest RI score of 29.6%. The discharge that exceeds 99% of the time (Q99) also had RI greater than 20%. The ratio of average 35-day minimum discharge to median discharge (QDAY35MIN50) was also found to be positively related to taxa richness (RI = 2.6%). When the regulation was included as a categorical variable, the RI was 6.1%. The minimum November discharge (Min Nov) and the ratio of discharge that exceeds 1% of the time to median discharge (Q1Q50) had no discernible effect on taxa richness. This model correlated 0.483 (0.078), explaining 25.17% of the original deviance.
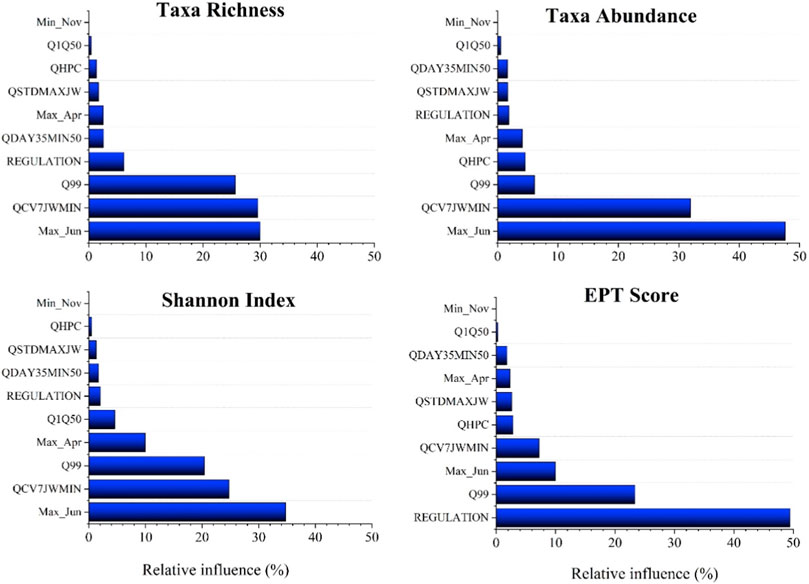
FIGURE 8. Boosted regression tree results of relative importance score for taxa richness, taxa abundance, Shannon index and EPT Index.
Max Jun also had a strong influence on taxa abundance, with a RI of 47.62%. The coefficient of variation of the seven Julian weeks with the lowest discharge (QCV7JWMIN) was the second-best variable, with a RI of 31.93%. The relationship with discharges that exceeded 99% of the time (Q99) and taxa abundance was also influential, with a RI of 6.10%. Maximum April discharge (Max Apr)) had a 4.08% relative influence. All the remaining variables had a RI of less than 2%. The taxa abundance model had the lowest correlation 0.24 (0.07) and explained 8.3% of the original deviance.
The taxa diversity also was strongly influenced by maximum June month discharge (RI = 34.77%), followed by QCVJWMIN with 24.75%. The discharge which exceeds 99% of the time had a RI of 20.42. Maximum April flow had a 9.92% influence, followed by the ratio of discharge that exceeds 1% of the time to median discharge (Q1Q50). The model correlation was 0.43 (0.08), and the original deviation was explained to the tune of 19.15%.
The BRT model for EPT index clearly highlighted the influence of regulation. The regulation had the strongest relationship with EPT index, with RI of 49.45%. This was clearly visible in the reach-wise EPT index analysis (Figure 5). The unregulated reach 1 had EPT index of 71% indicating highly sensitive macroinvertebrate taxa in unregulated reaches. Q99 was the second most important variable with RI of 23.33%. Maximum June month flow also had 10% RI score. The model correlation was the highest of all models, at 0.65 (0.063), explaining 68.28% of the original deviance.
4 Discussion and conclusion
While ecologists acknowledge the importance of the natural flow regime in shaping the structure and function of aquatic ecosystem communities for ecological protection and restoration (Poff et al., 1997; Richter et al., 1997), this paper aimed to develop an understanding of the specific elements of the natural flow regime that most profoundly influence aquatic life for improving reach-wise (both regulated and unregulated) environmental flow design and management. Addressing these questions is crucial for developing environmental flow strategies and effectively allocating environmental water resources in terms of timing and place. Previous studies have highlighted the degradation of the Goulburn-Broken catchment’s ecosystem due to alterations in streamflow patterns (Patil et al., 2020). To achieve this, the Goulburn River area was divided into five distinct reaches, allowing for an examination of the impact of regulation on macroinvertebrate communities. Additionally, the study period coincided with the Millennium Drought, providing an opportunity to investigate the effects of prolonged low flows on macroinvertebrate communities. We selected streamflow variables that represent variation in streamflow while also being ecologically relevant and influencing macroinvertebrate assemblages. Then, using PCA and a noncollinearity test, we chose nine variables that represent all five flow regime components and explain significant variance in the streamflow data. We calculated taxa richness, abundance, diversity, and the EPT index across sampling sites and years in both regulated and unregulated reaches to better understand the macroinvertebrate community structure. We investigated the relationship between macroinvertebrate indices and ecologically relevant flow metrics with the BRT. Our finding revealed a significant difference in hydrological variability between regulated and unregulated reaches. In comparison to the unregulated reach, the regulated reaches showed less hydrological variability during low flow periods and a rapid increase in discharge during high flow periods. All four macroinvertebrate indices performed better in samples collected from the unregulated reach 1 of the Goulburn River. When compared to regulated reaches the unregulated reach 1 had 61.1% higher taxa richness score. The EPT index clearly showed the impact of regulation structures, with unregulated reach having EPT score of 71% indicating presence of highly sensitive Ephemeroptera, Plecoptera, and Trichoptera families. In Reach 1, indicator taxa included a collection of all functional feeding groups (scrapers, shredders, collectors, and predators), whereas in regulated reaches there were no indicator taxa. The main reason is that hydropeaking has an impact on downstream regulatory structures, and changes associated with it include changes in water quality, habitat changes, and food availability (Gieswein et al., 2017; Elgueta et al., 2021). In terms of temporal variation, macroinvertebrates that mature quickly survived the Millennium Drought longer, and samples collected shortly after the drought (2010–12 cycle) had higher values of taxa richness, abundance, and diversity.
Annual peak flows are recognized to cause river-wide disturbances, resetting seasonal lotic food webs and controlling taxa composition (Power and Dietrich, 2002; Power et al., 2008; Rehn, 2009). In our study, we observed that minimum flow (Q99) also had a strong influence, but with a negative relationship, indicating that sudden increases in flow may be detrimental to macroinvertebrates. Maximum flow in June exhibited a significant positive influence on all four macroinvertebrate indices, with richness, abundance, and diversity indices displaying RI scores greater than 30% according to BRT analysis. The onset of the winter season and the associated peak flow in June can alter morphology and impact biota (Ward and Stanford, 1995). Winter flows also support thermophilic taxa sensitive to water surface temperature. The coefficient of variation of streamflow across the Julian weeks, a metric representing timing, strongly influenced macroinvertebrate indices, underscoring the importance of incorporating timing into environmental flow planning to restore ecological integrity and diversity (Steel et al., 2018).
Therefore, we recommend that environmental flow management should focus on the regulated reaches, and more attention should be paid to the downstream reaches. The minimum flow (Q99), maximum flow in June, and streamflow across the Julian weeks should be taken into consideration in the design and implementation of environmental flow management. The findings of the study align with the proposed watering actions recommended by the Victorian Environmental Water Holder, 2016 (VEWH). These actions suggest maintaining a low flow throughout the year and implementing environmental releases during the winter season (https://www.vewh.vic.gov.au/rivers-and-wetlands/northern-region/goulburn-river).
Our study sheds light on the substantial impacts of both regulation and the Millennium Drought on macroinvertebrate communities within the Goulburn Basin. Beyond the immediate implications for the studied region, these findings hold relevance for general science and ecosystem management on a broader scale. By demonstrating the intricate interactions between hydrological alterations, ecological responses, and the complexities of flow regimes, our study contributes to a broader understanding of how anthropogenic and climatic changes can shape aquatic ecosystems. From a management standpoint, our findings offer insights that can be applied not only to the Goulburn Basin but also to other river systems facing similar challenges worldwide. The intricate relationships we’ve uncovered between flow regimes and macroinvertebrate communities have the potential to inform more precise and effective environmental flow management strategies. By emphasizing the significance of considering multiple components of the flow regime, our study provides valuable guidance for sustainable water resource management, enhancing aquatic biodiversity, and mitigating the impacts of changing hydrological conditions. It should be noted that the short period for the benthic macroinvertebrate sampling has compromised our analysis for a longer period, although much longer data in hydrological metrics is available.
Data availability statement
Publicly available datasets were analyzed in this study. This data can be found here: https://www.gbif.org/dataset/f38cc07c-49a8-4ca4-8882-5cdde1733c12.
Ethics statement
The manuscript presents research on animals that do not require ethical approval for their study.
Author contributions
SB: Conceptualization, Data collection, Analysis, Writing, Revising. YW: Conceptualization, Review and editing. CD: Conceptualization, Review and editing. RJ: Review and editing. All authors contributed to the article and approved the submitted version.
Funding
This research was funded by the University of Queensland and the Indian Institute of Technology, Delhi Research Academy (UQIDAR).
Acknowledgments
The authors would like to express their gratitude to Rupesh Patil for his assistance with data availability. The Murray Darling Basin Authority deserves our thanks for providing the macroinvertebrate data.
Conflict of interest
The authors declare that the research was conducted in the absence of any commercial or financial relationships that could be construed as a potential conflict of interest.
Publisher’s note
All claims expressed in this article are solely those of the authors and do not necessarily represent those of their affiliated organizations, or those of the publisher, the editors and the reviewers. Any product that may be evaluated in this article, or claim that may be made by its manufacturer, is not guaranteed or endorsed by the publisher.
Supplementary material
The Supplementary Material for this article can be found online at: https://www.frontiersin.org/articles/10.3389/fenvs.2023.1134108/full#supplementary-material
References
Armanini, D. G., Chaumel, A. I., Monk, W. A., Marty, J., Smokorowski, K., Power, M., et al. (2014). Benthic macroinvertebrate flow sensitivity as a tool to assess effects of hydropower related ramping activities in streams in Ontario (Canada). Ecol. Indic. 46, 466–476. doi:10.1016/j.ecolind.2014.07.018
Arthington, A. H., Bernardo, J. M., and Ilhéu, M. (2014). Temporary rivers: linking ecohydrology, ecological quality and reconciliation ecology. River Res. Appl. 30 (10), 1209–1215. doi:10.1002/rra.2831
Arthington, A. H., Lorenzen, K., Pusey, B. J., Abell, R., Halls, A. S., Winemiller, K. O., et al. (2004). River fisheries: ecological bases for management and conservation.
Asmamaw, M., Mereta, S. T., and Ambelu, A. (2021). Response of macroinvertebrates to changes in stream flow and habitat conditions in Dinki watershed, central highlands of Ethiopia. Ecol. Indic. 133, 108448. doi:10.1016/j.ecolind.2021.108448
Barbour, M. T. (1999). Rapid bioassessment protocols for use in wadeable streams and rivers: periphyton, benthic macroinvertebrates and fish. Office of Water: US Environmental Protection Agency.
Beghelli, F. G. D. S., Santos, A. C. A. D., Urso-Guimarães, M. V., and Calijuri, M. D. C. (2012). Relationship between space distribution of the benthic macroinvertebrates community and trophic state in a Neotropical reservoir (Itupararanga, Brazil). Biota Neotropica 12, 114–124. doi:10.1590/s1676-06032012000400012
Boulton, A. J. (2003). Parallels and contrasts in the effects of drought on stream macroinvertebrate assemblages. Freshw. Biol. 48 (7), 1173–1185. doi:10.1046/j.1365-2427.2003.01084.x
Bruno, M. C., Siviglia, A., Carolli, M., and Maiolini, B. (2013). Multiple drift responses of benthic invertebrates to interacting hydropeaking and thermopeaking waves. Ecohydrology 6 (4), 511–522. doi:10.1002/eco.1275
Bunn, S. E., and Arthington, A. H. (2002). Basic principles and ecological consequences of altered flow regimes for aquatic biodiversity. Environ. Manag. 30 (4), 492–507. doi:10.1007/s00267-002-2737-0
De Cáceres, M., and Legendre, P. (2009). Associations between species and groups of sites: indices and statistical inference. Ecology 90 (12), 3566–3574. doi:10.1890/08-1823.1
Carlisle, D. M., Wolock, D. M., and Meador, M. R. (2011). Alteration of streamflow magnitudes and potential ecological consequences: a multiregional assessment. Front. Ecol. Environ. 9 (5), 264–270. doi:10.1890/100053
Chee, Y. E., Webb, J. A., Stewardson, M., and Cottingham, P. (2009). Victorian environmental flows monitoring andassessment program: monitoring and evaluation of environmental flow releases in the Goulburn River. Report prepared for the Goulburn broken catchment management authority and the department of sustainability and environment. Canberra: eWater Cooperative Research Centre.
Chessman, B. C. (2015). Relationships between lotic macroinvertebrate traits and responses to extreme drought. Freshw. Biol. 60 (1), 50–63. doi:10.1111/fwb.12466
Chi, S., Li, S., Chen, S., Chen, M., Zheng, J., and Hu, J. (2017). Temporal variations in macroinvertebrate communities from the tributaries in the three gorges reservoir catchment, China. Rev. Chil. Hist. Nat. 90 (1), 6–11. doi:10.1186/s40693-017-0069-y
Davies, P. E., Harris, J. H., Hillman, T. J., and Walker, K. F. (2010). The sustainable rivers audit: assessing river ecosystem health in the Murray–Darling Basin, Australia. Mar. Freshw. Res. 61 (7), 764–777. doi:10.1071/mf09043
De'Ath, G. (2007). Boosted trees for ecological modeling and prediction. Ecology 88 (1), 243–251. doi:10.1890/0012-9658(2007)88[243:btfema]2.0.co;2
De Cáceres, M., Chytrý, M., Agrillo, E., Attorre, F., Botta-Dukát, Z., Capelo, J., et al. (2015). A comparative framework for broad-scale plot-based vegetation classification. Appl. Veg. Sci. 18 (4), 543–560. doi:10.1111/avsc.12179
DELWP (Department of Environment, Land, Water and Planning) (2016). Managing extreme water shortage in Victoria.
DELWP (Department of Environment, Land, Water and Planning) (2019). Water monitering. http://data.water.vic.gov.au/static.htm (accessed online February 28, 2019).
Dos Santos, D. A., Molineri, C., Reynaga, M. C., and Basualdo, C. (2011). Which index is the best to assess stream health? Ecol. Indic. 11 (2), 582–589. doi:10.1016/j.ecolind.2010.08.004
Dudgeon, D., Arthington, A. H., Gessner, M. O., Kawabata, Z. I., Knowler, D. J., Lévêque, C., et al. (2006). Freshwater biodiversity: importance, threats, status and conservation challenges. Biol. Rev. 81 (2), 163–182. doi:10.1017/s1464793105006950
Elgueta, A., Górski, K., Thoms, M., Fierro, P., Toledo, B., Manosalva, A., et al. (2021). Interplay of geomorphology and hydrology drives macroinvertebrate assemblage responses to hydropeaking. Sci. Total Environ. 768, 144262. doi:10.1016/j.scitotenv.2020.144262
Elith, J., Leathwick, J. R., and Hastie, T. (2008). A working guide to boosted regression trees. J. Animal Ecol. 77 (4), 802–813. doi:10.1111/j.1365-2656.2008.01390.x
Ellis, L. E., and Jones, N. E. (2013). Longitudinal trends in regulated rivers: a review and synthesis within the context of the serial discontinuity concept. Environ. Rev. 21 (3), 136–148. doi:10.1139/er-2012-0064
Erdozain, M., Kidd, K., Kreutzweiser, D., and Sibley, P. (2019). Increased reliance of stream macroinvertebrates on terrestrial food sources linked to forest management intensity. Ecol. Appl. 29 (4), e01889. doi:10.1002/eap.1889
Fremier, A. K., and Strickler, K. M. (2011). Topics in river structure and function. BioScience. Introduction to selected paper compilation
Gieswein, A., Hering, D., and Feld, C. K. (2017). Additive effects prevail: the response of biota to multiple stressors in an intensively monitored watershed. Sci. Total Environ. 593, 27–35. doi:10.1016/j.scitotenv.2017.03.116
Gillespie, B. R., Brown, L. E., and Kay, P. (2015). Effects of impoundment on macroinvertebrate community assemblages in upland streams. River Res. Appl. 31 (8), 953–963. doi:10.1002/rra.2785
Gotelli, N. J., and Colwell, R. K. (2001). Quantifying biodiversity: procedures and pitfalls in the measurement and comparison of species richness. Ecol. Lett. 4 (4), 379–391. doi:10.1046/j.1461-0248.2001.00230.x
Grabowski, R. C., and Gurnell, A. M. (2016). Hydrogeomorphology—ecology interactions in river systems. River Res. Appl. 32 (2), 139–141. doi:10.1002/rra.2974
Grill, G., Lehner, B., Thieme, M., Geenen, B., Tickner, D., Antonelli, F., et al. (2019). Mapping the world’s free-flowing rivers. Nature 569 (7755), 215–221. doi:10.1038/s41586-019-1111-9
Hendon, H. H., Lim, E. P., Arblaster, J. M., and Anderson, D. L. (2014). Causes and predictability of the record wet east Australian spring 2010. Clim. Dyn. 42, 1155–1174. doi:10.1007/s00382-013-1700-5
Horwitz, R. J. (1978). Temporal variability patterns and the distributional patterns of stream fishes. Ecol. Monogr. 48 (3), 307–321. doi:10.2307/2937233
John, A., Horne, A., Nathan, R., Fowler, K., Webb, J. A., and Stewardson, M. (2021). Robust climate change adaptation for environmental flows in the Goulburn River, Australia. Front. Environ. Sci. 9, 573. doi:10.3389/fenvs.2021.789206
Leblanc, M., Tweed, S., Van Dijk, A., and Timbal, B. (2012). A review of historic and future hydrological changes in the Murray-Darling Basin. Glob. Planet. Change 80, 226–246. doi:10.1016/j.gloplacha.2011.10.012
Mac Nally, R., Cunningham, S. C., Baker, P. J., Horner, G. J., and Thomson, J. R. (2011). Dynamics of Murray-Darling floodplain forests under multiple stressors: the past, present, and future of an Australian icon. Water Resour. Res. 47 (12). doi:10.1029/2011wr010383
McMahon, T. A., Finlayson, B. L., Haines, A. T., and Srikanthan, R. (1992). Global Runoff -continental comparisons of annual flows and peak discharges. Catena. Germany: CremlingenDestedt, 166.
Magurran, A. E. (2005). Species abundance distributions: pattern or process? Funct. Ecol. 19 (1), 177–181. doi:10.1111/j.0269-8463.2005.00930.x
Moss, D., Furse, M. T., Wright, J. F., and Armitage, P. D. (1987). The prediction of the macroinvertebrate fauna of unpolluted running-water sites in Great Britain using environmental data. Freshw. Biol. 17, 41–52. doi:10.1111/j.1365-2427.1987.tb01027.x
Murray-Darling Basin Authority (2019). Sustainable rivers audit. Occurrence dataset. doi:10.15468/etifyb
Nathan, R. J., and McMahon, T. A. (1992). Estimating low flow characteristics in ungauged catchments. Water Resour. Manag. 6 (2), 85–100. doi:10.1007/bf00872205
Nilsson, C., Reidy, C. A., Dynesius, M., and Revenga, C. (2005). Fragmentation and flow regulation of the world's large river systems. Science 308 (5720), 405–408. doi:10.1126/science.1107887
Olden, J. D., and Poff, N. L. (2003). Redundancy and the choice of hydrologic indices for characterizing streamflow regimes. River Res. Appl. 19 (2), 101–121. doi:10.1002/rra.700
Patil, R., Wei, Y., Pullar, D., and Shulmeister, J. (2020). Evolution of streamflow patterns in Goulburn-Broken catchment during 1884–2018 and its implications for floodplain management. Ecol. Indic. 113, 106277. doi:10.1016/j.ecolind.2020.106277
Pelicice, F. M., Pompeu, P. S., and Agostinho, A. A. (2015). Large reservoirs as ecological barriers to downstream movements of Neotropical migratory fish. Fish Fish. 16 (4), 697–715. doi:10.1111/faf.12089
Petts, G. E. (2009). Instream flow science for sustainable river management. JAWRA J. Am. Water Resour. Assoc. 45 (5), 1071–1086. doi:10.1111/j.1752-1688.2009.00360.x
Poff, N. L., Allan, J. D., Bain, M. B., Karr, J. R., Prestegaard, K. L., Richter, B. D., et al. (1997). The natural flow regime. BioScience 47 (11), 769–784. doi:10.2307/1313099
Poff, N. L., and Zimmerman, J. K. (2010). Ecological responses to altered flow regimes: a literature review to inform the science and management of environmental flows. Freshw. Biol. 55 (1), 194–205. doi:10.1111/j.1365-2427.2009.02272.x
Pollack, J. B., Kim, H. C., Morgan, E. K., and Montagna, P. A. (2011). Role of flood disturbance in natural oyster (Crassostrea virginica) population maintenance in an estuary in South Texas, USA. Estuaries Coasts 34 (1), 187–197. doi:10.1007/s12237-010-9338-6
Power, M. E., and Dietrich, W. E. (2002). Food webs in river networks. Ecol. Res. 17 (4), 451–471. doi:10.1046/j.1440-1703.2002.00503.x
Power, M. E., Parker, M. S., and Dietrich, W. E. (2008). Seasonal reassembly of a river food web: floods, droughts, and impacts of fish. Ecol. Monogr. 78 (2), 263–282. doi:10.1890/06-0902.1
Pringle, C. (2003). What is hydrologic connectivity and why is it ecologically important? Hydrol. Process. 17 (13), 2685–2689. doi:10.1002/hyp.5145
Rehn, A. C. (2009). Benthic macroinvertebrates as indicators of biological condition below hydropower dams on west slope Sierra Nevada streams, California, USA. River Res. Appl. 25 (2), 208–228. doi:10.1002/rra.1121
Reid, A. J., Carlson, A. K., Creed, I. F., Eliason, E. J., Gell, P. A., Johnson, P. T., et al. (2019). Emerging threats and persistent conservation challenges for freshwater biodiversity. Biol. Rev. 94 (3), 849–873. doi:10.1111/brv.12480
Richter, B., Baumgartner, J., Wigington, R., and Braun, D. (1997). How much water does a river need? Freshw. Biol. 37 (1), 231–249. doi:10.1046/j.1365-2427.1997.00153.x
Satake, K., and Ueno, R. (2013). Distribution of freshwater macroinvertebrates in streams with dams and associated reservoirs on a subtropical oceanic island off southern Japan. Limnology 14 (2), 211–221. doi:10.1007/s10201-012-0393-5
Steel, A. E., Peek, R. A., Lusardi, R. A., and Yarnell, S. M. (2018). Associating metrics of hydrologic variability with benthic macroinvertebrate communities in regulated and unregulated snowmelt-dominated rivers. Freshw. Biol. 63 (8), 844–858. doi:10.1111/fwb.12994
Thomson, J. R., Bond, N. R., Cunningham, S. C., Metzeling, L., Reich, P., Thompson, R. M., et al. (2012). The influences of climatic variation and vegetation on stream biota: lessons from the Big Dry in southeastern Australia. Glob. Change Biol. 18 (5), 1582–1596. doi:10.1111/j.1365-2486.2011.02609.x
Tonkin, J. D., Heino, J., and Altermatt, F. (2018). Metacommunities in river networks: the importance of network structure and connectivity on patterns and processes. Freshw. Biol. 63 (1), 1–5. doi:10.1111/fwb.13045
Townsend, C. R., Scarsbrook, M. R., and Dolédec, S. (1997). The intermediate disturbance hypothesis, refugia, and biodiversity in streams. Limnol. Oceanogr. 42 (5), 938–949. doi:10.4319/lo.1997.42.5.0938
Van Dijk, A. I., Beck, H. E., Crosbie, R. S., De Jeu, R. A., Liu, Y. Y., Podger, G. M., et al. (2013). The Millennium Drought in southeast Australia (2001–2009): natural and human causes and implications for water resources, ecosystems, economy, and society. Water Resour. Res. 49 (2), 1040–1057. doi:10.1002/wrcr.20123
Wang, J., Ding, C., Heino, J., Jiang, X., Tao, J., Ding, L., et al. (2020). What explains the variation in dam impacts on riverine macroinvertebrates? A global quantitative synthesis. Environ. Res. Lett. 15 (12), 124028. doi:10.1088/1748-9326/abc4fc
Ward, J. V., and Stanford, J. A. (1995). The serial discontinuity concept: extending the model to floodplain rivers. Regul. rivers Res. Manag. 10 (2-4), 159–168. doi:10.1002/rrr.3450100211
White, J. C., Hannah, D. M., House, A., Beatson, S. J., Martin, A., and Wood, P. J. (2017). Macroinvertebrate responses to flow and stream temperature variability across regulated and non-regulated rivers. Ecohydrology 10 (1), e1773. doi:10.1002/eco.1773
Wilkinson, C. L., Yeo, D. C., Tan, H. H., Fikri, A. H., and Ewers, R. M. (2019). Resilience of tropical, freshwater fish (Nematabramis everetti) populations to severe drought over a land-use gradient in Borneo. Environ. Res. Lett. 14 (4), 045008. doi:10.1088/1748-9326/ab0128
Yarnell, S., Peek, R., Epke, G., and Lind, A. (2016). Management of the spring snowmelt recession in regulated systems. JAWRA J. Am. Water Resour. Assoc. 52 (3), 723–736. doi:10.1111/1752-1688.12424
Keywords: aquatic ecosystem, taxonomic composition, flow metrics, environmental flows, macroinvertebartes
Citation: Banad S, Wei Y, Dhanya CT and Johnstone R (2023) Effects of altered streamflow on macroinvertebrate taxonomic richness and composition in the Goulburn River, Australia. Front. Environ. Sci. 11:1134108. doi: 10.3389/fenvs.2023.1134108
Received: 29 December 2022; Accepted: 17 October 2023;
Published: 06 November 2023.
Edited by:
Venkatramanan Senapathi, Alagappa University, IndiaReviewed by:
Ming-Chih Chiu, Chinese Academy of Sciences (CAS), ChinaRenato Tavares Martins, National Institute of Amazonian Research (INPA), Brazil
Copyright © 2023 Banad, Wei, Dhanya and Johnstone. This is an open-access article distributed under the terms of the Creative Commons Attribution License (CC BY). The use, distribution or reproduction in other forums is permitted, provided the original author(s) and the copyright owner(s) are credited and that the original publication in this journal is cited, in accordance with accepted academic practice. No use, distribution or reproduction is permitted which does not comply with these terms.
*Correspondence: Sudeep Banad, c3VkZWVwYmFuYWRAZ21haWwuY29t