 Jiangbo Wang1†
 Yufan Wu
- 1College of Architecture, Nanjing Tech University, Nanjing, China
- 2College of Ecology and Engineering, Shanghai Institute of Technology, Shanghai, China
Based on the PLUS model, research proposed a method to adjust the probability of land use transition to reduce the calculation error of the number of pixels. The refined algorithm is applied to simulate Shenzhen land use situation in 2030 under a progressive scenario using three periods of Shenzhen land use data in 2000, 2010 and 2020. Then, InVEST model was employed to evaluate the distribution situation and future trends of habitat quality in Shenzhen during the study period. Following are the conclusions: 1) The construction land in Shenzhen expanded rapidly and the ecological land gradually shrank during the research period. The proportion of artificial surface area increased by about 45.4% (304.98 km2) within 20 years. 2) By simulating the land use situation of Shenzhen in 2030, the results revealed that the land use change of Shenzhen in the future is mainly concentrated in the central and western regions. 3) The overall average habitat quality of Shenzhen was at a medium level, but the habitat quality showed a continuous degradation trend in each year throughout the study period. Spatially, the habitat quality degradation are mainly concentrated in Shenzhen’s central and western region. 4) Under the natural development scenario, Shenzhen’s habitat quality would experience a sharp decline by 2030. The habitat quality of the conservation area is guaranteed to a certain degree, but the artificial surface expansion outside the area will still affect the habitat quality in the boundary constraint scenario; Only in scenario of ecological priority, the habitat quality of Shenzhen has been restored and improved to a large extent. 5) In order to slow down the degradation trend and improve the regional ecological environment. It is necessary not only to strictly implement various protection boundaries delineated in the context of Territorial Spatial Planning, but also to implement the policy of “Clear waters and green mountains are as good as mountains of gold and silver” in the process of urban development. Government should reasonably control the scale of cities, optimize the ecological compensation mechanism, and implement ecological restoration policies such as returning farmland to forests and returning farmland to grassland.
1 Introduction
Habitat quality refers to the capacity of ecosystem to provide resources needed for surviving and procreating under specific spatio-temporal conditions for individuals and groups, which is an significant factor in maintaining regional sustainable development (Hall et al., 1997; Liu and Wang, 2018). With the current background of global urbanization, the rapid development of construction land will surely result in the loss of forest, wetlands, and other areas with ecological services, altering regional habitat quality’s spatial distribution and the flow of materials and energy (Feng et al., 2018). Therefore, we analyzed the evolution characteristics of regional land use evolution, then simulates future urban land use, and investigate the relationship between urban growth and regional habitat quality. For relevant departments to carry out land resource optimization and ecological preservation in order to preserve regional sustainable development, analysis results can serve as a theoretical foundation and point of reference (Bai et al., 2019).
Presently, the majority of land use change prediction models are based on meta-cellular automata, such as CA-Markov (Ouyang et al., 1999; Nelson et al., 2009), CA-ABM(Xia et al., 2020; Chen et al., 2017; Liu et al., 2020), FLUS(Liu et al., 2017), and CLUE-S (Verburg et al., 2002). However, the Markov models cannot describe changes on a spatial scale. CA-ABM model has difficulty reflecting the impact of factors such as socio-economic conditions on urban land use patterns. Accurately capturing spatial variations in land use change under various zones is difficult for FLUS models. The CLUE-S model ignores the possibility of non-dominant land class transformation in its application and requires the use of a separate mathematical model for the non-spatial module (Qiao et al., 2022). The land expansion analysis method (LEAS) and CA based on multiple random seeds (CARS) are introduced in the patch generation land use change simulation (PLUS) model to solve these issues. It simultaneously combines the benefits of great accuracy and speed, making it capable of simulating the intricate evolution of various land types (Liang et al., 2021). By adjusting the model parameters, it can better meet the needs of various scenario simulations in different regions and under different policies. The model has performed well in the application of different spatial scales such as county (Lai et al., 2022),city (Xu et al., 2022; Ji et al., 2022; Yang S. et al, 2022), and province (Wang et al., 2022). At present, the majority of research in the field of land use scenario simulation calculate the number of land pixels for various future scenarios by directly adjusting the probability of land use transfer to acquire the number of land use pixels, oblivious to the fact that the adjusted probability of land transfer does not total to 1, which inevitably generates a certain degree of inaccuracy and affects the accuracy of the final results. Therefore, in order to reduce simulation inaccuracy, it is necessary to improve the calculation method for land use transfer probability for various scenarios.
Land-use change affects material exchange in the regions, thus affecting regional habitat quality. Therefore, spatial visual assessment of habitat quality can act as a guide for the development of regional ecological conservation. Nowadays the evaluation models of habitat quality mainly include ARIES model (Villa et al., 2009), SoLVES model (Sherrouse et al., 2011; Brown and Brabyn, 2012) and InVEST model (Tallis et al., 2011). Among them, InVEST model is widely used due to its high evaluation accuracy, good visualization and perfect theoretical system (Redhead et al., 2016; Han et al., 2022; Ding et al., 2022; Shao et al., 2022). In recent years, scholars around the world have employed the InVEST model to assess habitat quality from multiple perspectives, including urban agglomerations (Wu et al., 2021; Liu et al., 2021), provincial areas (Jing and Zhao, 2021; Liang et al., 2020) and municipal areas (Gao et al., 2022; Feng et al., 2022; Li et al., 2022; Zhao et al., 2022a), and have all achieved excellent research results. Currently, there aren't many research that analyze the traits of historical land use development and simulate and forecast future changes in regional habitat quality by combining the PLUS model with the InVEST model.
In the Guangdong-Hong Kong-Macao Greater Bay Area, Shenzhen is one of the core cities. Under rapid urbanization, its built-up area has expanded rapidly in the past 20 years, and regional resource constraints have been continuously strengthened, resulting in a gradual deterioration of the habitat quality. Research proposes a method for adjusting the probability of land use transfer to reduce simulation error. Based on this method, we simulates and analyzes the land use changes and habitat quality in Shenzhen in 2030 under multiple scenarios of progressive using land use data from 2000, 2010, and 2020. Moreover, features of land use evolutionary and the relationship between habitat quality and urban expansion in Shenzhen over the last 20 years was discussed in this article. Research also provides theoretical support and reference for the implementataion of ecological protection work in the context of current Territorial Spatial Planning of China with a view to better understand the evolution of Shenzhen landuse in the previous 20 years.
2 Materials and methods
2.1 Overview of the research area
Shenzhen is located between 113°43′ and 114°38′ East longitude and 22°24′ and 22°52′ North latitude. It is situated on the east shore of the Pearl River Estuary, east to Daya Bay, west to Lingding Ocean, south to Hong Kong, and north to Huizhou and Dongguan. With nine administrative districts and one new district under its jurisdiction, Shenzhen is one of the GBA’s essential cities and it covers an area of 1997.47 km2. By the end of 2021, Shenzhen has a total population of 17.68 million and its GDP has reached 3.07 trillion RMB.
Shenzhen is located in a subtropical region, influenced by the southeastern monsoon, with high temperatures and rainfall throughout the year; the topography is dominated by plains and low rolling hills, with mountains such as Maluan Mountain, Wutong Mountain and Paiya Mountain mostly located in Shenzhen’s eastern and central regions. In general, the quality of Shenzhen’s environment gradually decreases from east to west. This is due to the fact that Shenzhen’s nature reserves, such as the Dapeng Peninsula Nature Reserve, the Overseas Chinese Town Nature Reserve and several country parks, are mostly located in central and eastern Shenzhen, while the core built-up areas of Shenzhen are located in a flat area along the southwestern coast (Figure 1). Habitat quality is closely associated with ecological elements such as forest and grassland, and with the urban expansion brought about by urban construction, built-up areas have replaced the original ecological space. The relationship between human and nature in Shenzhen is becoming increasingly tense, and the environment in nature reserves and within built-up areas has been damaged to different degrees.
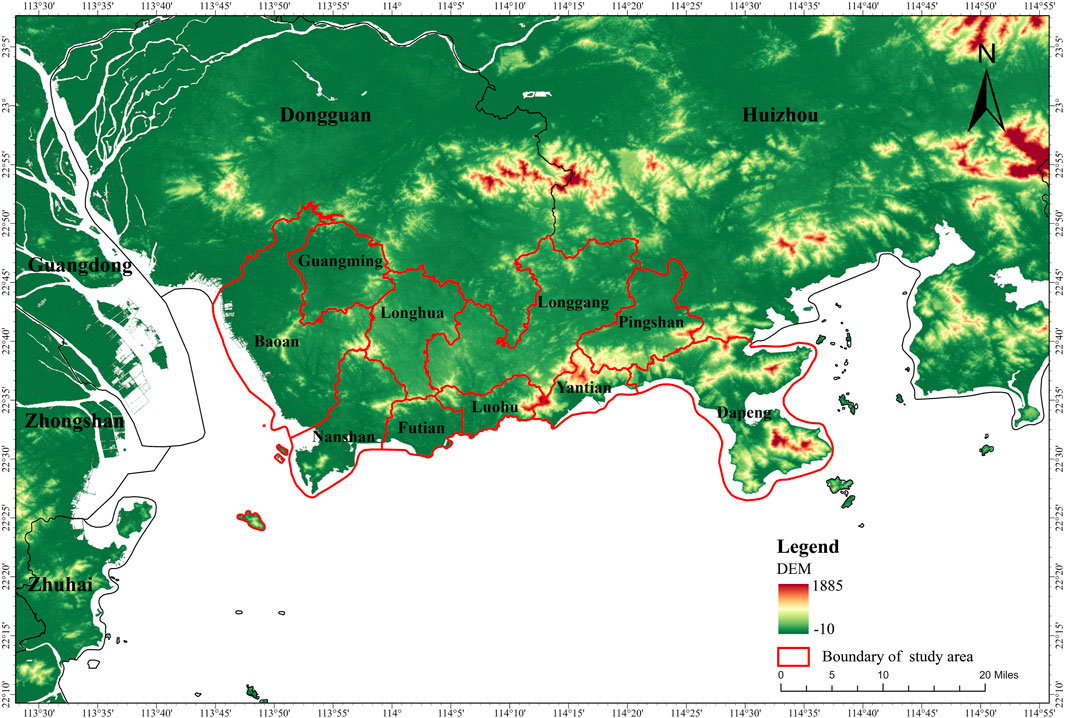
FIGURE 1. Schematic diagram of the study area.
2.2 Model selection and scenario design
2.2.1 PLUS model
The PLUS (Patch-Generating Land Use Simulation) model is a simulation model of future land use change that integrates the Land Expansion Analysis Strategy (LEAS) module and the Cellular Automata (CA) model based on multi-class random patch seeding. By evaluating the spatial characteristics of various types of land use expansion and the driving forces between the two stages of land use data, the model utilizes the random forest algorithm to sample the land expansion and calculate the likelihood that each type of land would be developed. Then the comprehensive landuse change probability is obtained based on the adaptive inertial competition mechanism of roulette. The ultimate land use mode is optimized by integrating random patch generation, transition transition matrix, and threshold decline mechanism at last.
2.2.1.1 LEAS (Land Expansion Strategy Analysis)
The Random Forest (RF) algorithm is employed to explore the drivers and factors of expansion of each category separately, as well as maintain the probability that each driver will contribute to the expansion of each land use category during the study period. This is accomplished by extracting the various land use expansion parts between the two periods of land use change. The RF algorithm in LEAS is to determine the probability of the occurrence of local classes on a single grid by random sampling the spatial data, and the following is its mathematical expression:
Where
A meta-cellular automaton model (CARS) based on a multi-type stochastic seed mechanism: it combines “Top To Down” (land class demand) and “Down To Top” (land class competition) effects; the “bottom-up " effect integrates neighbourhood weights, transformation cost matrices and decreasing thresholds, etc. During the simulation, land use demand influences local land use competition through an adaptive inertia coefficient that drives the amount of land use towards a setting target, with the following mathematical expression.
Where
It should be noted that in this study PLUS model’s scenario simulation is realized by controlling the number of pixels of different regions under future different scenarios, in other word, the urban development of different scenarios is designed by adjusting the transfer probability of the land use. However, only adjusting the transfer probability of the land type will cause the sum of probabilities not to be 1, resulting in a large error in the number of pixels. Therefore, the unadjusted probability must be also adjusted for the land type transition probability. Here, the author proposes a method for calculating adjustment factors of land types without probability adjustment. The mathematical expression is as follows:
Where
2.2.2 The InVEST model
The InVEST model’s Habitat Quality module is based on land cover use type data, and uses the influence factors such as habitat suitability, stressor sensitivity, distance and weight of stressors to assess habitat quality. It considers the habitat quality as a continuous variable, which can be used to characterize the habitat quality. To a certain extent, it serves as a proxy for biodiversity in that the higher the HQI, the better the quality of the habitat and the greater the quantity of biodiversity. The following are index mathematical expression:
Where the habitat quality index is
Where
Based on the relevant literature (Wang et al, 2023; Zhao et al., 2022b; Lei et al., 2022; Yang et al., 2021), distance of maximum influence, weight of the threat variables, the type of spatial attenuation, and the sensitivity of each land use type to the threat variables are the primary parameters that need to be adjusted in accordance with the unique circumstances of the research area. Taking into consideration the specific development of Shenzhen, this study defines the artificial surface that have a threatening effect on surface habitats, bare land and cultivated land as threat factors. The habitat suitability, the sensitivity of different habitats to threat factors (Table 1) and the maximum influence distance and weight of each factor are set based on the actual situation (Table 2).
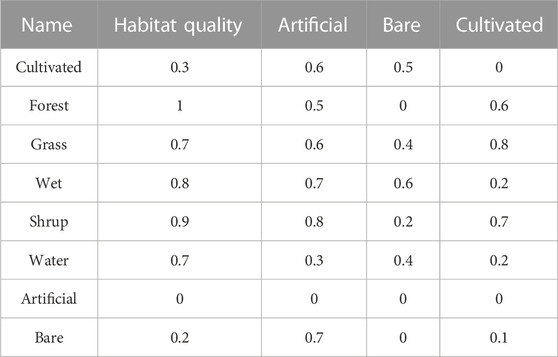
TABLE 1. Suitability of each type of habitat and its sensitivity to stress factors.
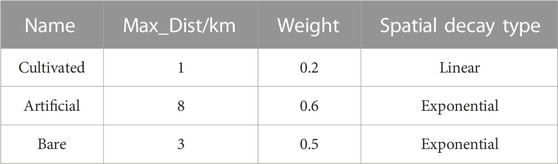
TABLE 2. Stress factors affect distance, weight and spatial attenuation type.
2.2.3 Multi-scenario design based on pixel number constraint
We design a total of three typical scenario models of natural development, boundary constraint, and ecological priority, which are imployed to simulate and forecast the pixel quantity and spatial distribution of various land utilizes in Shenzhen in 2030. These models are based on the latest Territorial Spatial Planning of China and the relevant regulations of economic development and environment conservation in the study region. The pixel number of the natural development scenario and the boundary constraint scenario is predicted through the Markov chain. The number of pixels in the ecological priority scenario is determined based on the Markov chain and the land transfer probability parameter mentioned above. The following are setting of each scenario.
(1) Scenario 1: Natural development scenario. Regardless of the overall urban planning factors and the current protection factors for ecological land, but only based on the historical urban expansion trend, the historical land use transfer probability is used to simulate the urban development in 2030, the number of pixels of various types of land in 2030 is predicted by the Markov chain out.
(2) Scenario 2: Boundary constraint scenario. Based on the Territorial Spatial Planning’s latest edition and the natural development scenario (Shenzhen Municipal People’s Government, 2020), the area within the scope of " red line of land ecological protection, red line of marine ecological protection, natural ecological space, permanent basic agricultural land, and strictly protected shoreline” is regarded as the restricted conversion area, and the pixel numbers of various lands are consistent with the natural development scenario.
(3) Scenario 3: Ecological Priority Scenario, which is based on the fact that Shenzhen has gradually entered the stage of high-quality urban development, and the new round of Territorial Spatial Planning will create an ecological city with “forests in the city, blue water in the city, and cultivated land in the city.” Therefore, the pixel numbers are restricted to reduce the transfer probability limit on the basis of the boundary constraint scenario, and the probability of conversion of arable land and forest land to man-made surface is reduced by 30%, while the probability of conversion of grassland, water, shrubland and wetland to man-made surface is reduced by 20%.
2.3 Data sources and processing
2.3.1 Main data source
This study selects the 30-m resolution GlobeLand30 dataset as the source of land use data in Shenzhen. This global land cover dataset was produced by China and has a spatial resolution of 30 m, meanwhile data including the years of 2000, 2010, and 2020. The selected images used in this data production are primarily 30-m multispectral images, including multispectral images from the Landsat TM5, ETM+, OLI, and China Environmental Disaster Reduction Satellite. In order to increase accuracy, the 2020 data version also takes use of the 16-m-resolution Gaofen-1 multispectral photography. The 2010 data’s overall accuracy is 83.50%, and its Kappa coefficient is 0.78 the 2020 data’s overall accuracy is 85.72%, and its Kappa coefficient is 0.82, both of which can satisfy the research’s accuracy requirements (Chen et al., 2016; Chen et al., 2014).
2.3.2 Driving factor data
Considering the availability of data, research combined field investigation with reference of existing relevant studies (Wang et al., 2022; Zhang et al., 2022; Liu et al., 2022; Sun et al., 2023) and finally 14 driving factors were selected from natual and socio-economic aspects:elevation, slope direction, average annual temperature, slope, annual precipitation, GDP grid data, NDVI, population grid data, distance to different levels roads, distance to water area, and distance to settlements. Among them, ASTER GDEM 30 m resolution digital elevation data is attained from the geospatial data cloud (http://www.gscloud.cn/), the slope and aspect data are calculated from the elevation data; traffic road network, settlement and river data are obtained from the Open Street Map website, and the Euclidean distance to different levels roads, settlements and rivers are calculated by OSM data. The administrative boundary data of each district in Shenzhen is obtained from the 1:1000000 public version of the fundamental geographic information data released by the National Basic Geographic Information Centre in 2021, the relevant statistics are obtained from the Shenzhen Bureau of Statistics, while Chinese Academy of Science’s Resource and Environment Science and Data Centre is where the rest of data are obtained. Data are uniformly used at a resolution of 30 m, and the 1 km GDP and population spatial grid data of 1 km resolution were resampled to 30 m resolution, the coordinate system was WGS 1984 UTM Zone 50 N, the processing platform was ArcGIS Pro 2.8.6, the detailed parameters are shown in Table 3, and the specific methodological process is shown in Figure 2.
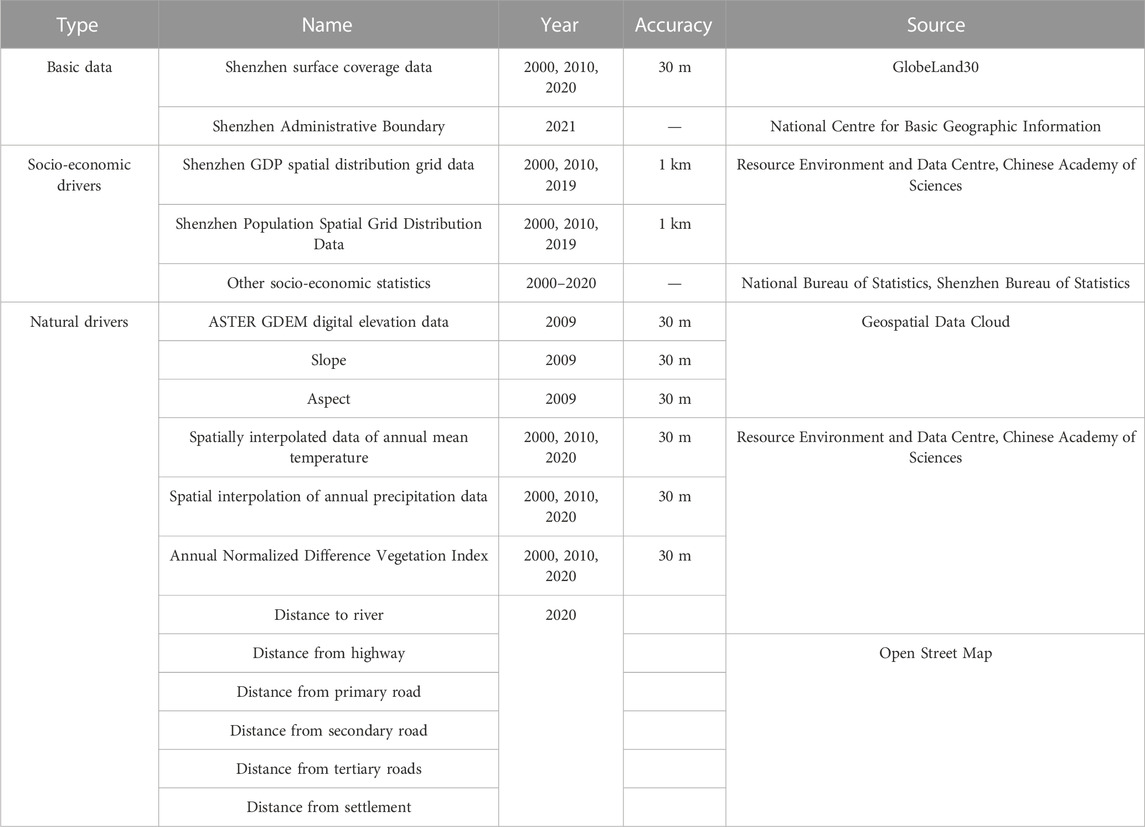
TABLE 3. Basic and driving factor data of research.
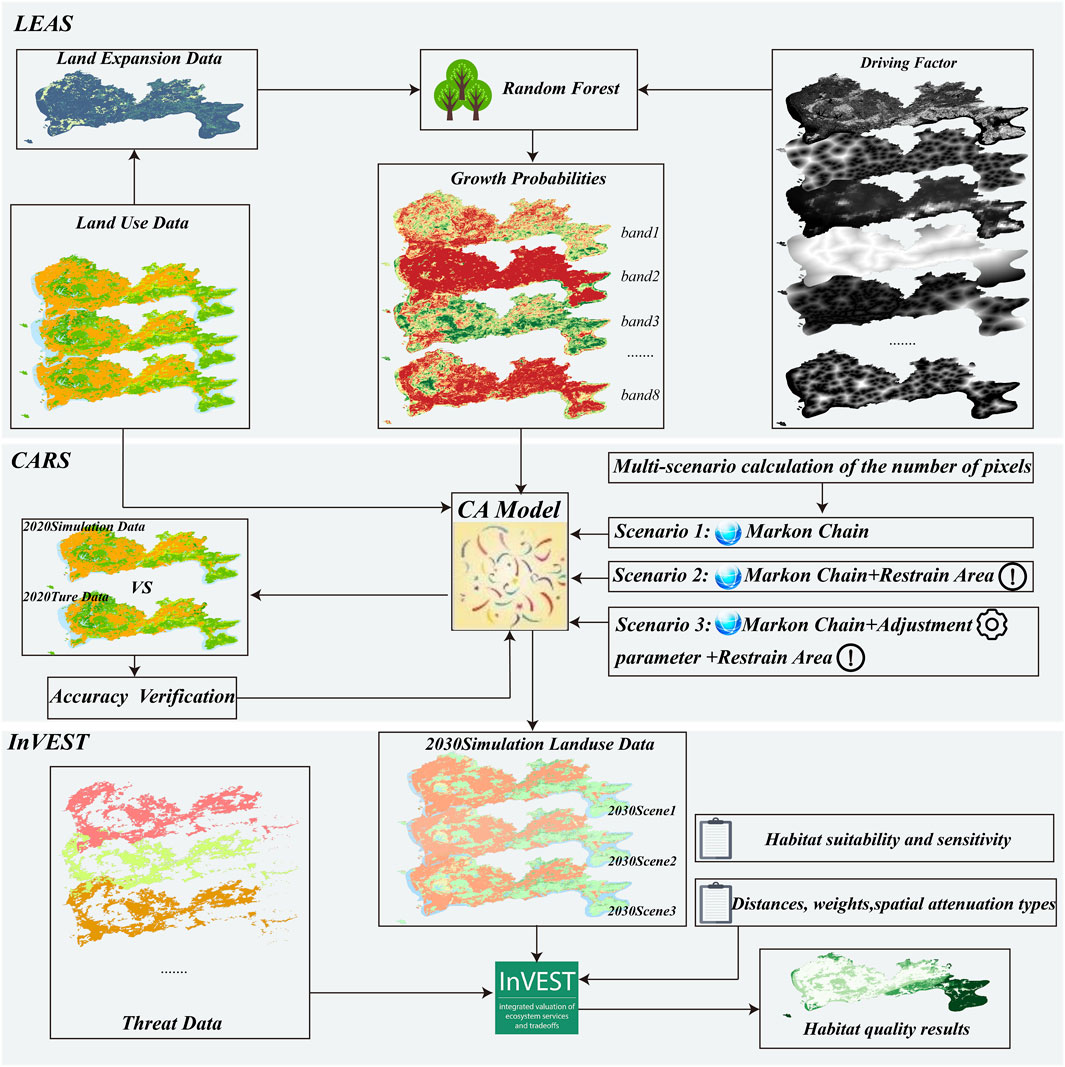
FIGURE 2. Schematic diagram of the data processing flow.
3 Results
3.1 Land use change characteristics and prediction
3.1.1 Analysis of land use characteristics between 2000 and 2020
It is characterised by “a steep increase in construction land and a steady decline in ecological land” in Shenzhen between 2000 and 2020. The main manifestation is that the Shenzhen’s artificial surface area grew by 304.98 km2 in 20 years, which is about 45.4% of the original area. The change rate of artificial surface area was 14.16 km2/a−1 in 2000–2010, and the rate kept increasing to 16.32 km2 in 2010–2020. In addition to the artificial surface, the area of other landuse types showed a decline during 2000–2020. Among them, water area declined by 90.38 km2 (change rate −4.52 km2/a−1), cultivated land decreased by 78.78 km2 (change rate −3.93 km2/a−1), grassland decreased by 71.33 km2 (change rate −3.57 km2/a−1) and woodland decreased by 60.08 km2 (change rate −3.01 km2/a−1). Based on the two period’s land use conversion matrix, it is evident that the rapid increase of the artificial surface area in Shenzhen during the research period is due to the extensive transfer of water, grassland, forest land, and arable land into 48.1 km2 of grassland and 40.53 km2 of water area were transferred into artificial surface between 2000 and 2010, while the area of artificial surface in Shenzhen (26.64 km2) was only 15.82% of the transferred area (168.32 km2) in the first 10 years (Figure 3A). Shenzhen maintained this trend in the second decade of the study period, with the transfer of cultivation, forests, grasses, wetlands and water area to artificial surface continuing, the area of artificial surface transferr-out area (43.61 km2) accounting for only 21.08% of the transferr-into area (206.83 km2) (Figure 3B).
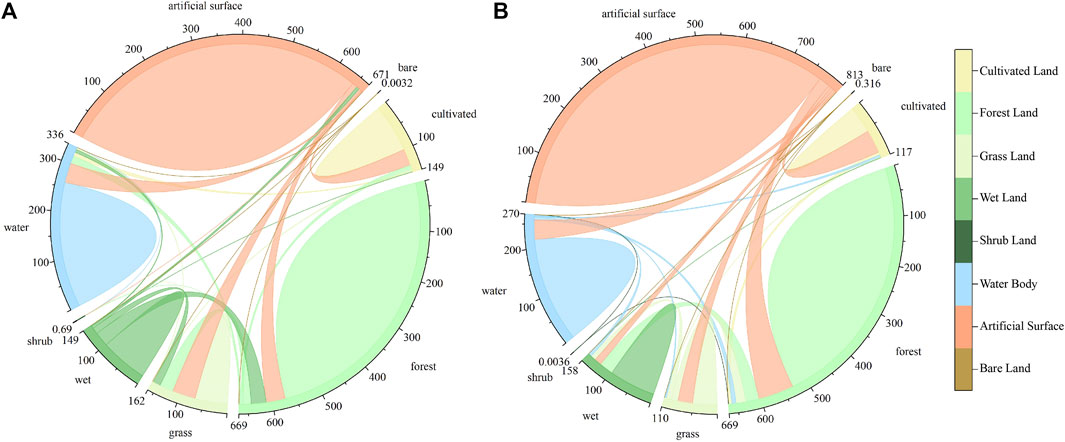
FIGURE 3. Land Use Conversion ratio chord chart for the Years (A) 2000–2010 and (B)2010–2020.
Spatially, The evolution characteristic that Shenzhen mainly shows is “ecological space reduced continuously while construction land expanding rapidly” (Figures 4A–C). During the research period, Shenzhen’s urban spatial expansion can be divided into two types, the first one is the internal-fill type, such as Luohu District and Futian District. Due to nature conservation policies and administrative boundaries, there is limited land available outside the district for development, and therefore the district is constantly expands the non-construction land with internal “holes.” The second type is the external-expansion type, such as in Baoan District and Nanshan District, where built-up areas have expanded by encroaching on external ecological spaces such as cultivation, forests, grasses, wetlands and water area. Large-scale reclamation projects were carried out in Baoan and Nanshan District, and a large amount of water area in the areas around Qianhai and Shenzhen Bay was converted to consturction land to satisfy the requirements of urban development during the research period.
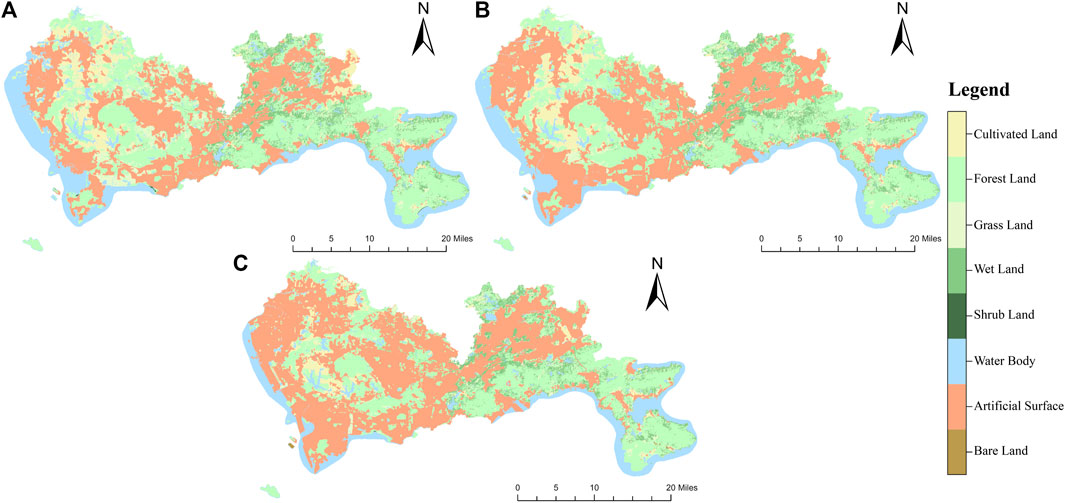
FIGURE 4. Land use situation of Shenzhen in (A) 2000, (B) 2010, and (C) 2020.
3.1.2 Multi-scenario analysis of land use simulation
The PLUS model was employed to predict a multi-case land use scenario for Shenzhen in 2030 based on the land use data in 2000, 2010, and 2020. Firstly, the LEAS module in the PLUS model was employed to maintain the development probabilities of different landuse types based on the current landuse data and the 14 selected socio-economic and natural drivers, followed by the simulation of the 2020 landuse situation based on the CARS module, which was compared with the real land use situation in Shenzhen in 2020, resulting in a kappa coefficient of 0.823 and overall accuracy of 0.891, showing the simulation results have a high level of spatial coherence, which can satisfy the simulation accuracy requirements of this research. Therefore, the real 2020 Shenzhen landuse data is used to predict the land use situation of Shenzhen in 2030.
It has been revealed through simulating Shenzhen’s land use situation in 2030 that the center and western regions of the city will experience the majority of the city’s land use changes. In Scenario 1, urban development continues the historical trend, with built-up areas in each region expanding through external-expansion and internal-fill. Among them, the central and western regions represented by Nanshan, Baoan and Longhua districts are expanding rapidly, while the eastern part of Shenzhen, represented by Dapeng New District, changes less (Figure 5A). The built-up surface area of Shenzhen increases by 131.6 km2 in this scenario, of which 84.1 km2 forest land and 22.2 km2 cultivated land are transferred into respectively (Figure 6A). In this scenario, as there is no restricted area for land conversion, forest lands and grasslands located in the planned ecological conservation zone are encroached upon by the artificial surface, e.g., the structure of the ecological conservation zone of Phoenix Hill—Balcony Hill—Changlingpi is somewhat damaged by the built-up area. The occurrence of reclamation in the Shenzhen’s western part, i.e., the Bao’an Airport area, which has caused damage to the planned coastal ecological landscape zone of the Pearl River Estuary and Shenzhen Bay, shows that urban expansion in Shenzhen under natural scenarios will undoubtedly cause greater damage to the urban ecosystem.
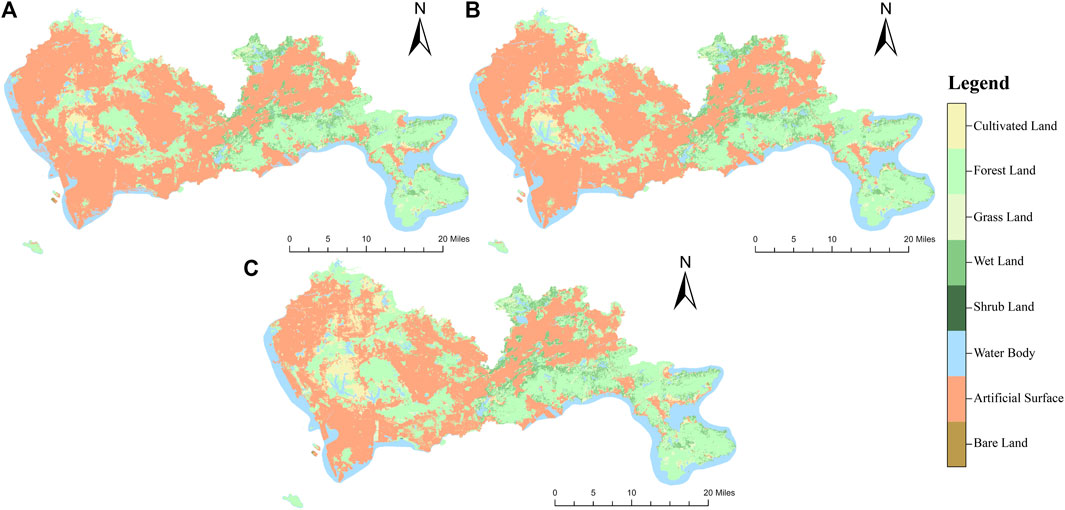
FIGURE 5. The land use situation of Shenzhen in 2030 under the scenario of (A) natural development, (B) boundary constraint and (C) ecological priority.
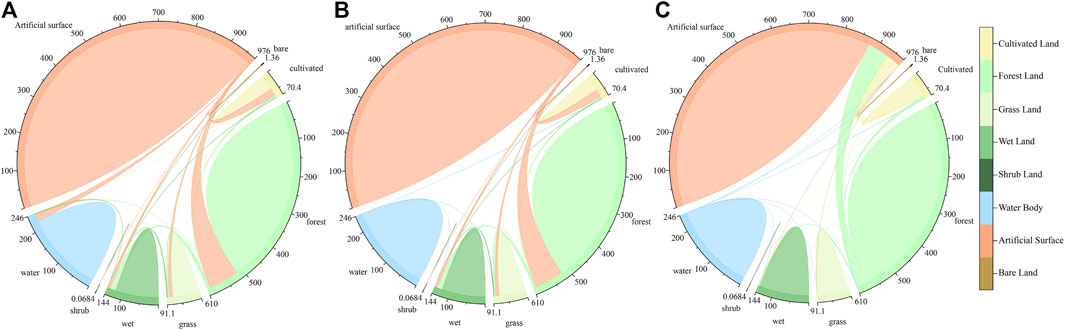
FIGURE 6. The chord diagram of land use conversion in 2030 Shenzhen under the scenario of (A) natural development, (B) boundary constraint and (C) ecological priority.
Scenario 2 sets clear boundary limits on urban expansion, which plays a essential conservation role in the ecological space in the restricted regions (Figures 5B; 6B). The built-up area switches to internal infill expansion of green space, such as farm and forest, in contrast to Scenario 1, where regional expansion is constrained, which causes some injury to the local environment. It is significant to realize that both scenarios 1 and 2 have reclamation in the western part of Shenzhen, and the new Territorial Spatial Planning documents stipulate that shoreline of this section is to be optimised for use, suggesting that Shenzhen may continue to reclaim land in the western part of the sea to meet urban development needs in the future.
Scenario 3 is based on the fact that Shenzhen has gradually entered the stage of high-quality urban development, with an increase of 47.8 km2 in forest area, an increase of 21.8 km2 in cultivated land and a decrease of 65.1 km2 in artificial surface area compared to 2020, with no more conversion of water area to other land types and the disappearance of reclamation development (Figures 5C; 6C). The spatial changes in this scenario are characterised by a gradual ‘dissipation’ of consturction land, i.e., a gradual reduction in the density of consturction land, and an increase in the connectivity of urban ecological space while maintaining the original polycentric urban structure of Shenzhen, indicating that the concept of ecological priority development plays a significant role in the optimisation and maintenance of the urban ecosystem.
3.2 Comparative analysis of spatio-temporal evolution of habitat quality and multi-scenario simulation
3.2.1 Habitat quality evolution characteristics in Shenzhen 2000–2020
Land-use change brings about changes in regional habitat quality through the movement of regional material elements. Based on the analysis of the evolution of land use in Shenzhen, we evaluated the habitat quality in Shenzhen at different time periods to further explore the characteristics of change and response relationships between land use and regional habitat quality. By importing the current land use data, ecological stress factor data and factor sensitivity data into the InVEST model, we obtained the Shenzhen habitat quality data in the years 2000, 2010, and 2020, with the range of habitat quality factors being (0-1). The greater the habitat quality, the more comprehensive the ecosystem services, and the more favorable it is for the preservation of biodiversity, the higher the value. In order to present the evolution process of habitat quality in different years, the habitat quality results of the three-phase were divided into four categories in ArcGIS, namely, 0–0.15, 0.15–0.42, 0.42–0.70, and 0.70–1, which correspond to four levels of habitat quality: poor, medium, good, and excellent respectively.
From municipal perspective, the average habitat quality of Shenzhen has been at an intermediate level since 2000, but the habitat quality has shown a decreasing trend in each year, with poor habitat quality area increasing by about 150.83 km2 and the good habitat quality area decreasing by about 125.52 km2 in 2 decades. Spatially, the degraded habitat quality area are mainly concentrated in the Shenzhen’s central and western regions. From 2000 to 2020, the extensive expansion of the built-up area of Shenzhen’s central area and the reclamation projects in the Baoan and Nanshan districts in the west part have led to a significant reduction in regional habitat quality due to intensive human activities.
Combined with the spatial expansion of artificial surface in each period, it can be concluded that the spatial degradation of habitat quality in Shenzhen is closely related to the expansion of artificial surface. On the one hand, the expansion of artificial land surfaces encroaches on a large amount of ecological space, and on the other hand, it brings about intensive human activity, further improving the intensity of land use, increasing the distance and weight of various stressor, and destroying the regional habitats quality (Figure 7).
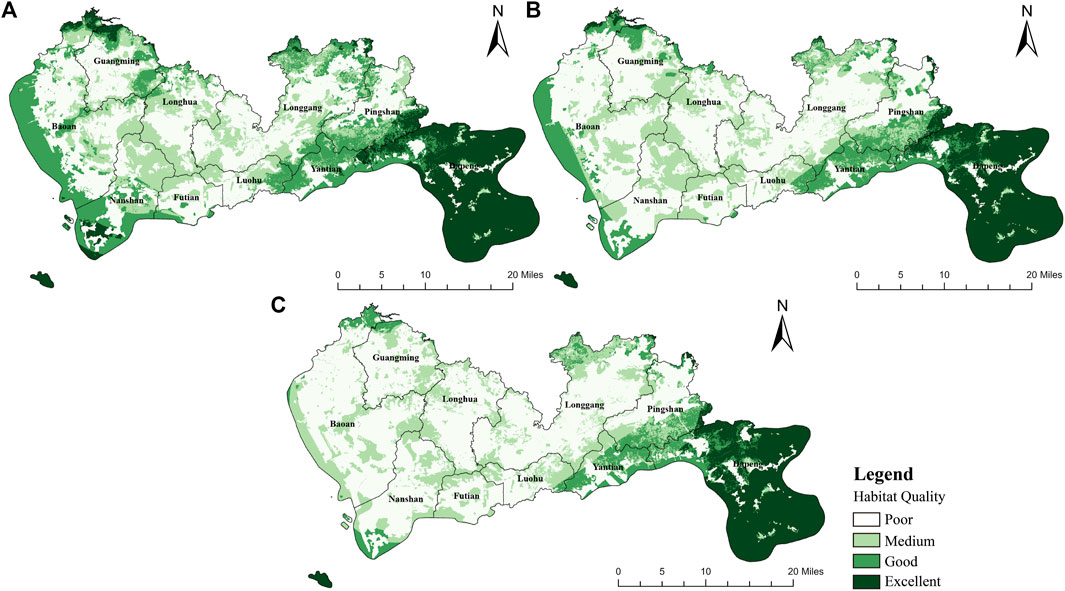
FIGURE 7. Spatial distribution of Shenzhen’s habitat quality in (A) 2000, (B) 2010 and (C) 2020.
For different districts, each was classified into three categories by method of natural break point according to the average annual degradation of habitat quality from 2000 to 2020: severely degraded, moderately degraded and slightly degraded, it can be seen that the degree of degradation in each district of Shenzhen shows the spatial characteristics of “Gradual increase from east to west.” The slightly degraded areas are Yantian District, Luohu District, Pingshan District and Dapeng New District in Shenzhen’s central and eastern area; the moderately degraded areas are Longgang District and Futian District in central Shenzhen; and the severely degraded areas are Baoan District, Longhua District, Nanshan District and Guangming District in western Shenzhen.
As the most severely degraded area in Shenzhen in the last 20 years, the poor habitat quality area in Baoan District increased by about 24% (95.8 km2) and the excellent habitat quality area gradually disappeared. The large-scale reclamation projects were carried out in the western and northern coastal areas of Baoan District, and a large number of industrial zones and industrial parks were built and expanded in Baoan’s eastern and central region during the study period. The extensive expansion of the built-up areas gradually destroyed the balance of the regional ecosystem, as a result, the quality of regional habitats was significantly reduced. By 2020, medium habitat quality areas in Baoan District will mostly be clustered in the Fenghuang Mountain, Tie Gang Reservoir and Balcony Mountain areas, while the rest will be fragmented and scattered. The habitat quality of Nanshan District, which is adjacent to Baoan District, is similar to that of Baoan District, with the number of areas with poor habitat quality increasing by 33.8% (69.3 km2) and the proportion of excellent habitat quality area reducing from 10.5% (21.5 km2) to 2.9% (5.9 km2) during the research period. The large-scale reclamation along the coast of Nanshan District and the expansion of the internal built-up area had led to the degradation of the habitat quality in this area by 2020. Medium-quality habitat areas in Nanshan District are the Xilin Reservoir in the north, the Tanglang Mountain Park area in the east, and the Nanshan Park area along the coast in the south.
The medium-degraded area of habitat quality in Shenzhen lies in Futian District and Longgang District in central Shenzhen. The percentage of areas with good habitat quality in Futian District decreased by 11.7% (9.3 km2) during the research period, and the spatial degradation mainly existed in the mangrove reserve in the southwestern part of Futian District. Mangroves were affected by artificial surface expansion, resulting in a reduction in mangrove area and a decline in ecological services, leading to moderate degradation of habitat quality. Longgang District is located in the northeastern part to Futian District, and the artificial surface has expanded by encroaching on the forest land in the southwestern, central and northeastern regions. Therefore, There is a “radiating” degradation for the habitat quality in this area, covering the surrounding areas of Luohu, Yantian and Pingshan.
The Dapeng New Area, Luohu District, Yantian District and Pingshan District in eastern Shenzhen showed mild degradation of habitat quality during the research period. Due to better natural conditions, the ecological structure of these areas is interconnected. Large-scale natural reserves such as Wutongshan National Forest Park, Huaqiaocheng National Wetland Park and Dapeng Peninsula National Geological Park together form a green spatial ecological conservation belt from west to east. Due to policy protection, the expansion of artificial surfaces in this category is limited during the research period, thus with less impact on the habitats quality within the region. The change in habitat quality in this type of area is mainly caused by the expansion of artificial surfaces in Longgang District, and the habitat quality shows a radial degradation towards the southeast.
3.2.2 Comparative analysis of habitat quality multi-scenario simulation
Based on the 2030 Shenzhen multi-scenario landuse predict results obtained by the PLUS model, the stressor data within each scenario was extracted and imported into InVEST, the results are displayed in Figures 8, 9.
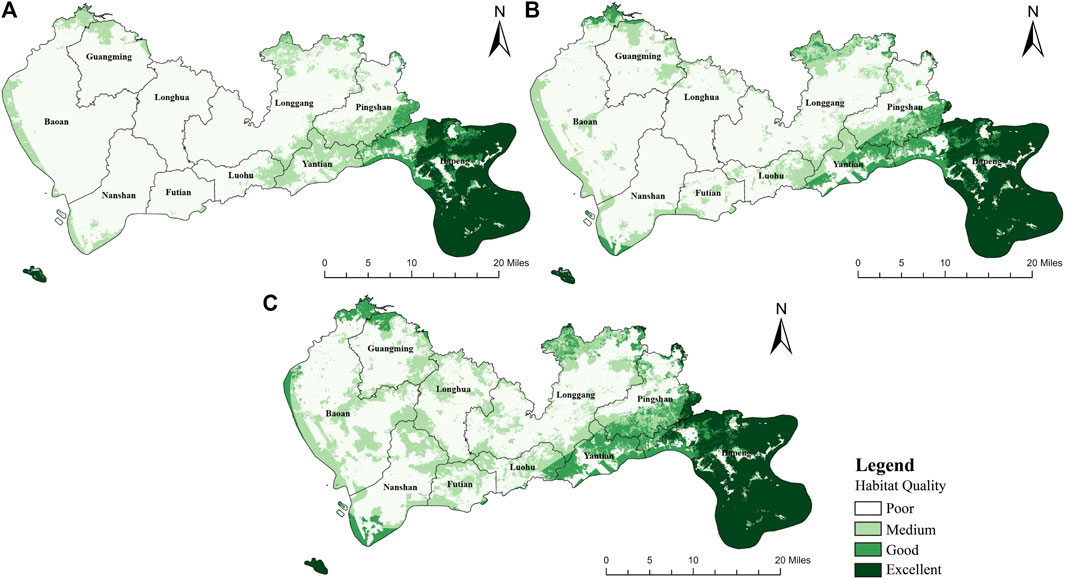
FIGURE 8. Spatial distribution of Shenzhen’s habitat quality under the scenario of (A) natural development, (B) boundary constraint and (C) ecological priority.
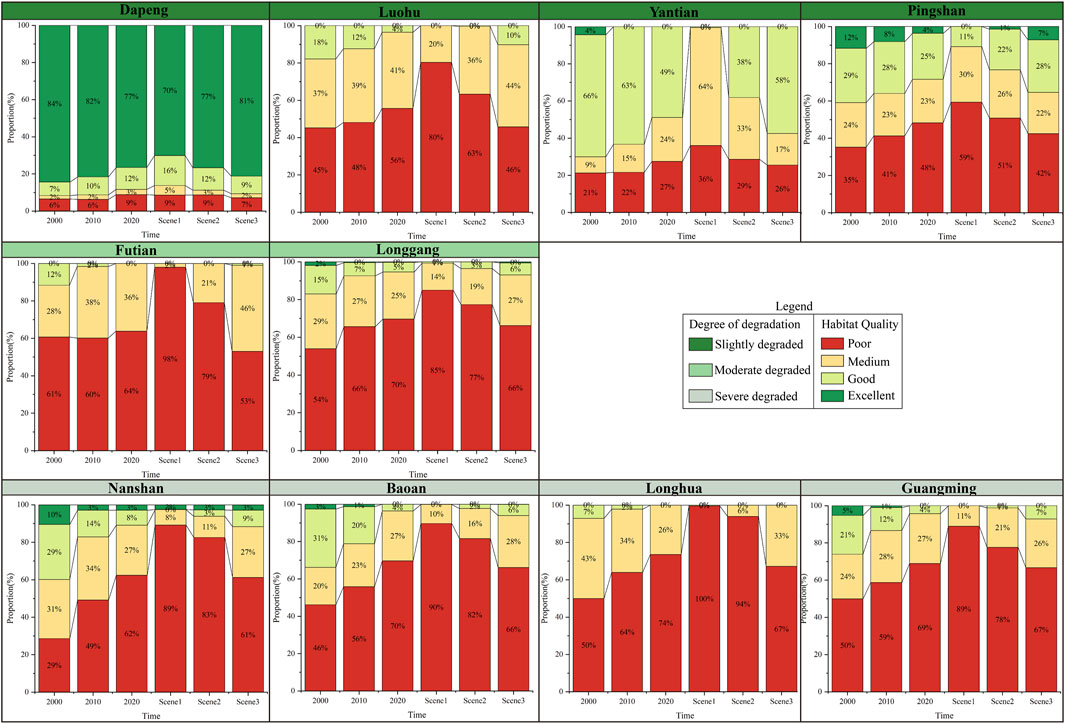
FIGURE 9. Histogram of the proportion of habitat quality area in each district of Shenzhen.
3.2.2.1 Scenario 1
In natural development scenario, the habitat quality of the whole area of Shenzhen shows “overall degradation” (Figure 8A), with an average of 0.18, a decrease of about 24.5% compared with that in 2020. The percentage of areas with poor habitat quality climbed from 53.9% to 70%, an increase of about 16.1% (343.9 km2), while the proportion of medium, good and excellent habitat quality areas decreased by about 9.69% (207.45 km2), 4.87% (104.25 km2) and 1.57% (33.63 km2) respectively. In Scenario 1, good and excellent habitat quality areas in Shenzhen only exist in Dapeng New District and Pingshan District in the east, and the habitat quality in the rest areas is medium and poor, indicating that if Shenzhen does not restrict the future urban development, its habitat quality will face the risk of comprehensive degradation, which will have a considerable effect on the local ecological system.
3.2.2.2 Scenario 2
Under the clear red line restrictions of ecological protection, Shenzhen exhibited the characteristic of “Significant degradation in Midwest, slight degradation in East” (Figure 8B), with an average habitat quality of 0.22, a decrease of about 8.9% compared with 2020. The significantly degraded areas in the midwest are mainly located in the Balcony Hill Forest Park, Tanglang Mountain Park, Shiyan Wetland Park and other regional ecological spaces. Among which, the most obvious habitat degradation is in Baoan District, where the medium habitat degrade to poor habitat area will reach 43.7 km2. Although there are clear ecological protection restrictions in Scenario 2, and there is no transformation within the boundary, the habitat quality here will still be affected by artificial surface expansion. This shows that the ecological protection red line is effective for maintaining the quality of urban habitats, but the expansion of artificial areas outside the protection red line will still affect the regional habitat quality to a certain degree.
3.2.2.3 Scenario 3
In the ecological priority scenario, the overall habitat quality in Shenzhen has been significantly improved, with an average habitat quality of 0.26, an increase of about 9.3% compared with 2020 (Figure 8C). The proportion of excellent and good habitat quality areas increases by 1.16% (24.8 km2) and 1.45% (30.97 km2) respectively, while the poor habitat quality area decreases by about 80.25 km2. The change in this scenario is mainly due to the improvement of habitat level or spatial expansion relying on the original ecological space. For example, in the simulation of this scenario, the proportion of the good quality area in Luohu District increased by 6.7% (5.3 km2), spatially showing that the good habitat in the eastern region gradually expanded westward, and the medium quality habitat in the central region gradually grew and spread. In general, in the ecological priority scenario, a certain amount of artificial surface and cultivated land will be transferred to forest and grassland based on the clear boundaries of ecological protection, and the regional ecological space is increased. The landscape connectivity has been improved, the degree of habitat fragmentation has been reduced, and the habitat quality in Shenzhen has been better restored and improved.
After multi-scenario prediction and comparative analysis of habitat quality, it can be state that under the scenario of natural development, the artificial surface will maintain its historical expansion trend and Shenzhen may face a total degradation of habitat quality in 2030; under the boundary constraint scenario, the habitat quality of the restricted development area is safeguarded to a certain extent, but the expansion of the artificial surface outside the restricted area will still affect the habitat quality within the protected area; Only in scenario of ecological priority, the habitat quality of Shenzhen has been restored and improved to a large extent, mainly becauseon the one hand, the restricted reserves have played a role in ecological conservation, and on the other hand, the transformation of urban development policies has restricted the further expansion of the city’s scale. A certain area of artificial surface is transformed into forest land, grassland, wetland and water area, which contributes to enhancing the quality of the regional habitat.
Consequently, in order to enhance Shenzhen’s urban habitats and revive their quality, government must not only strictly implement the various ecological protection boundaries delineated in the context of national land space, but also implement the policy of “Clear waters and green mountains are as good as mountains of gold and silver” in urban development. Reasonably control the scale of the city, optimize the ecological compensation mechanism, improve the connectivity of regional landscapes, vigorously implement ecological restoration policies such as returning farmland to forests and animal breeding grounds to pastures, and strengthen the comprehensive improvement of ecological space.
4 Discussion
Based on the PLUS model, research proposed a method to adjust the probability of land use transition to reduce the calculation error of the pixels number. The InVEST model was employed to simulate the distribution situation of land use and habitat quality in Shenzhen in 2030 within the context of Territorial Spatial Planning by design three simulation scenarios. In addition to the innovation of adjustment parameters, the scenario setting of this research is progressive in order to better reflect the measures that have a high impact on the habitat quality in the scenario design, which is different from the classic land use scenario simulation (Yang et al., 2022b; Chen et al., 2022). We found that the additional boundary restrictions in Scenario 2 compared to Scenario 1 had a limited effect on improving regional habitat quality, since human activities in the outer areas still have a radiating effect on the inner boundaries, and it is therefore necessary to consider further conservation space based on boundary restrictions in the future. In addition, we find that reclamation occurs along the western coast of Shenzhen in both Scenarios 1 and 2, and after analysing the current policy guidelines, it can be deduced that reclamation is likely to continue along the western coast of Shenzhen in the future to meet future urban development needs. Only in Scenario 3, with a combined approach of boundary restrictions and ecological protection policies, can regional habitat quality be effectively restored and improved, proving that policy factors are an element that cannot be ignored in ecological protection efforts. The “Two Mountains” theory was proposed by China President Xi Jinping in 2005 as an significant ecological theory based on the harmonious unity of human and nature, with the goal of achieving the shared prosperity of human and the natural. Under the guidance of this theory, the Chinese government has launched a large number of environmental protection regulations and policies. For example, Shenzhen has issued the (Shenzhen 14th Five-Year Plan for Ecological Protection) and (Shenzhen Special Economic Zone Ecological Protection Regulations), and so on. Focusing on international key issues such as the atmosphere, water, sea, noise and climate change, government are making great efforts to improve regional environmental quality. As a result, the overall ecological and environmental advantages have been transformed into green economic development advantages. By 2020, the water quality compliance rate of all drinking water sources in Shenzhen is 100%, and the water quality of the eastern sea area reach the highest national water quality standard. In terms of soil, the safe utilisation rate of contaminated cultivated land and contaminated construction land in the city reached 100%; in terms of air, Shenzhen’s PM2.5 dropped to 19 ug/m3 and the air quality rate reached 97%. Therefore, the practice of ecological preservation can actively incorporated with the “two mountains” theory in the framework of the present “three lines” of China territorial spatial planning, which can significantly enhance the quality of regional habitats and promote the balance between humans and nature. The research can help government better understand the Shenzhen’s land use evolution in the previous 20 years, meanwhile provide theoretical support and guidence for the implementation of ecological evaluation and preservation work in different region of China under the current Territorial Spatial Planning. However, there are still deficiencies in the research, such as fewer source years, the prediction accuracy of the pixel numbers in varuous scenarios still needs to be improved. The follow-up will improve the above deficiencies.
5 Conclusion
(1) The construction land in Shenzhen expanded rapidly, and the ecological land gradually shrank during the research period. Among them, the large-scale transfer of cultivated land, forest land, grassland, and water area land increased the proportion of artificial land surface area by about 45.4% (304.98 km2) within 20 years. The spatial expansion mode of built-up areas in Shenzhen is mainly divided into internal filling and external expansion. Among which, the internal filling is mainly affected by natural conservation policies or administrative boundaries, and the external development area of the built-up area is limited.
(2) By simulating the comparative analysis of land use in various scenarios in Shenzhen in 2030, it can be concluded that the land use change of Shenzhen will mainly be concentrated in the central and western regions. In the natural development scenario, the urban blue-green space is gradually shrinking due to the expansion of the original urban built-up area, and the western reclamation phenomenon is serious. In the boundary constraint scenario, the boundary constraint plays a good role in ecological conservations, but the urban built-up area will turn to the unrestricted area for expansion, and the phenomenon of reclamation in the west still exists. In the ecological priority scenario, the density of artificial surface land decreases, the area of forest land, grassland, water areas and other land types increases, without reclamation appearance.
(3) The overall average habitat quality in Shenzhen was at a medium level during the research period, but the habitat quality showed a steady degradation trend in each year. The area of poor habitat quality increased by about 150.8 km2, while the good habitat quality decreased by about 125.5 km2. Spaitally, the degradation area of habitat quality are mainly concentrated in the Shenzhen’s central and western regions.
(4) According to the comparative analysis of the habitat quality of multiple scenarios in 2030, we get the following conclusions: in the natural development scenario, the habitat quality of Shenzhen will face a comprehensive degradation situation in 2030. In the scenario of boundary constraints, the habitat quality of the conservative area is guaranteed to a certain degree, but artificial surface expansion outside the area of restricted will still affect their habitat quality. Only in the scenario of ecological priority, the habitat quality of the whole area of Shenzhen has been restored and improved to a large extent.
(5) It is necessary not only to strictly implement the various ecological protection boundaries delineated in land space, but also to implement the policy of “Clear waters and green mountains are as good as mountains of gold and silver” in urban development to slow down the degradation and further improve it. Reasonably control the scale of the city, optimize the ecological compensation mechanism, and implement ecological restoration policies such as returning farmland to forests and animal breeding grounds to pastures.
Data availability statement
Publicly available datasets were analyzed in this study. This data can be found here: https://www.webmap.cn/main.do?method=index, https://www.resdc.cn/, https://www.gscloud.cn/, https://www.openstreetmap.org/, http://www.globallandcover.com/, http://tjj.sz.gov.cn/tjsj/index.html.
Author contributions
Conceptualization, JW and YW; methodology, YW; software, YW; validation, YW, JW, and AG; formal analysis, YW; investigation, JW; resources, AG; data curation, AG; writing—original draft preparation, YW; writing—review and editing, JW; supervision, AG; project administration, AG; funding acquisition, JW and AG.
Funding
This research was supported by the National Natural Science Foundation of China, grant number 51978329, 51778364.
Conflict of interest
The authors declare that the research was conducted in the absence of any commercial or financial relationships that could be construed as a potential conflict of interest.
Publisher’s note
All claims expressed in this article are solely those of the authors and do not necessarily represent those of their affiliated organizations, or those of the publisher, the editors and the reviewers. Any product that may be evaluated in this article, or claim that may be made by its manufacturer, is not guaranteed or endorsed by the publisher.
Supplementary material
The Supplementary Material for this article can be found online at: https://www.frontiersin.org/articles/10.3389/fenvs.2023.1146347/full#supplementary-material
References
Bai, L., Xiu, C., Feng, X., and Liu, D. M. (2019). Influence of urbanization on regional habitat quality: A case study of changchun city. Habitat Int. 93, 102042. doi:10.1016/j.habitatint.2019.102042
Brown, G., and Brabyn, L. (2012). The extrapolation of social landscape values to a national level in New Zealand using landscape character classification. Appl. Geogr. 35, 84–94. doi:10.1016/j.apgeog.2012.06.002
Chen, B., Zhang, Y., and Jiang, D. (2017). Urban land expansion in Fuzhou City based on coupled cellular automata and agent-based models (CA-ABM). Prog. Geogr. 36 (5), 626–634.
Chen, J., Ban, Y., and Li, S. (2014). China: Open access to Earth land-cover map. Nature 514 (7523), 434. doi:10.1038/514434c
Chen, J., Chen, J., and Liao, A. (2016). Remote sensing mapping of global land cover. Beijing: Science Press.
Chen, L., Cai, H., Zhang, T., Zhang, X., and Zeng, H. (2022). Multi-scenario simulation analysis of land use in Rao River Basin based on Markov-FLUS model. Acta Ecol. Sin. 42 (10), 3947–3958.
Ding, Y., Wang, L., Gui, F., Zhao, S., and Zhu, W. (2022). Carbon stocks in the circum-Hangzhou Bay ecosystem based on the InVEST model and PLUS model. Environ. Sci., 1–12.
Feng, S., Sun, R., and Chen, L. (2018). Spatial and temporal evolution of habitat quality in Beijing based on land use pattern changes. J. Ecol. 38 (12), 4167–4179.
Feng, W., Lin, M., Gong, J., Zhao, J., Zhong, L., and Liu, H. (2022). Temporal and spatial differentiation characteristics of habitat quality in Zhongshan City based on FLUS-In VEST model. Ecol. Sci. 41 (03), 16–23.
Gao, Z., Wang, X., Sui, X., Wang, X., Fan, Y., Zhu, Q., et al. (2022). Multi-scenario prediction of habitat quality in Nanjing based on FLUS and InVEST models. J. Agric. Resour. Environ. 39 (05), 1001–1013.
Hall, L., Krausman, P., and Morrison, M. (1997). The habitat concept and a plea for standard terminology. Wildl. Soc. Bull. 25 (1), 173–182.
Han, J., Cui, J., Yang, W., Xu, Y., Qin, D., and Gao, F. (2022). Analysis of soil erosion changes and drivers in low hill areas based on InVEST model. Soil water conservation Res. 29 (05), 32–39.
Ji, Y., Jia, L., Yang, L., Li, Y., and Dong, Q. (2022). Spatial and temporal evolution and prediction analysis of habitat quality in Yulin City coupled with InVEST-PLUS model. J. Soil Water Conservation, 1–10.
Jing, X., and Zhao, Q. (2021). Research on the spatiotemporal changes of habitat quality in guizhou province based on the InVEST model. Territ. Nat. Resour. Study 05, 1–5.
Lai, Z., Chen, C., Chen, J., Wu, Z., Wang, F., and Li, S. (2022). Multi-scenario simulation of land-use change and delineation of urban growth boundaries in county area: A case study of xinxing county, Guangdong province. Land 11, 1598. doi:10.3390/land11091598
Lei, J., Chen, Y., Chen, Z., Chen, X., Wu, T., and Li, Y. (2022). Spatial and temporal evolution of habitat quality in three watersheds of Hainan Island based on the InVEST model. J. Appl. Ecol. 33 (09), 2511–2520. doi:10.13287/j.1001-9332.202209.019
Li, X., Liu, Z., Li, S., and Li, Y. (2022). Multi-scenario simulation analysis of land use impacts on habitat quality in tianjin based on the PLUS model coupled with the InVEST model. Sustainability 14, 6923. doi:10.3390/su14116923
Liang, X., Guan, Q., Clarke, K. C., Liu, S., Wang, B., and Yao, Y. (2021). Understanding the drivers of sustainable land expansion using a patch-generating land use simulation (PLUS) model: A case study in wuhan, China. Comput. Environ. Urban Syst. 85, 101569. doi:10.1016/j.compenvurbsys.2020.101569
Liang, X., Yuan, L., Ning, L., Song, C., Cheng, C., and Wang, X. (2020). Spatial pattern of habitat quality in heilongjiang province and its influencing factors based on InVEST model. J. Beijing Normal Univ. Sci. 56 (06), 864–872.
Liu, C., and Wang, C. (2018). Spatial and temporal evolutionary characteristics of habitat quality in loess hilly areas based on land use change - an example from Yuzhong County. J. Ecol. 38 (20), 7300–7311.
Liu, D., Zheng, X., and Wang, H. (2020). Land-use simulation and decision-support system (LandSDS): Seamlessly integrating system dynamics agent based model and cellular automata. Ecol. Model. 417, 108924. doi:10.1016/j.ecolmodel.2019.108924
Liu, H., Lin, M., Zhou, R., and Zhong, L. (2021). Spatial-temporal evolution analysis of habitat quality in Guangdong-Hong Kong-Macao Greater Bay Area based on InVEST model. Ecol. Sci. 40 (03), 82–91.
Liu, X., Liang, X., Li, X., Xu, X ., Ou, J ., Chen, Y ., et al. (2017). A future land use simulation model (FLUS) for simulating multiple land use scenarios by coupling human and natural effects. Landsc. Urban Plan. 168, 94–116. doi:10.1016/j.landurbplan.2017.09.019
Liu, X., Liu, Y., Wang, Y., and Liu, Z. (2022). Evaluating potential impacts of land use changes on water supply–demand under multiple development scenarios in dryland region. J. Hydrology 610, 127811. doi:10.1016/j.jhydrol.2022.127811
Nelson, E., Mendoza, G., Regetz, J., Polasky, S., Tallis, H., Cameron, D. R., et al. (2009). Modeling multiple ecosystem services,biodiversity conservation,commodity production,and tradeoffs at landscape scales. Front. Ecol. Environ. 7, 4–11. doi:10.1890/080023
Ouyang, Z., Wang, R., and Zhao, J. (1999). Ecosystem services and their valuation. Chin. J. Appl. Ecol. 10 (5), 635639.
Qiao, Z., Jiang, Y., He, T., Lu, Y., Xu, X., and Yang, J. (2022). Advances in land-use change simulation research. J. Ecol. 42 (2), 5165–5176.
Redhead, J., Stratford, C., Sharps, L., Jones, G., Ziv, D., Clarke, T., et al. (2016). Empirical validation of the InVEST water yield ecosystem service model at a national scale. Sci. Total Environ. 569-570 (569-570), 1418–1426. doi:10.1016/j.scitotenv.2016.06.227
Shao, Z., Chen, R., Zhao, J., Xia, C., He, Y., and Tang, F. (2022). Spatial and temporal evolution and prediction of ecosystem carbon stocks in Beijing based on FLUS and InVEST models. J. Ecol. (23), 1–14.
Shenzhen Municipal People's Government (2020). Shenzhen territorial spatial master plan (2020-2035) (draft) formula reading. Available at: http://www.sz.gov.cn/szzt2010/wgkzl/jcgk/jcygk/zdzcjc/content/post_8858880.html.
Sherrouse, B., Clement, J., and Semmens, D. (2011). A GIS application for assessing,mapping, and quantifying the social values of ecosystem services. Appl. Geogr. 31, 748–760. doi:10.1016/j.apgeog.2010.08.002
Sun, X., Xue, J., and Dong, L. (2023). Temporal and spatial change and prediction of carbon storage in Nanjing ecosystem based on PLUS model and InVEST model. J. Ecol. Rural Environ. 39 (01), 41–51.
Tallis, H., Ricketts, T., Guerry, A., Nelson, E., Ennaanay, D., Wolny, S., et al. (2011). InVEST 2.0 beta User's Guide. Stanford: The Natural Capital Project.
Verburg, P., Soepboer, W., Veldkamp, A., Limpiada, R., Espaldon, V., and Mastura, S . (2002). Modeling the spatial dynamics of regional land use: The CLUE-S model. Environ. Manag. 30 (3), 391–405. doi:10.1007/s00267-002-2630-x
Villa, F., Ceroni, M., Bagstad, K., Gary, J., and Sergey, L. (2009). “ARIES (artificial intelligence for ecosystem services): A new tool for ecosystem services assessment, planning, and valuation,” in Proceedings of the 11th Annual BioEcon Conference on Economic Instruments to Enhance the Conservation and Sustainable Use of Biodiversity.
Wang, J., Wang, W., and Hai, M. (2022). Simulation analysis of land use change in Shandong Province based on PLUS model. Land Nat. Resour. Res. (06), 1–8.
Wang, J., Zhang, J., Xiong, N., Liang, B., Wang, Z., and Cressey, E. (2022). Spatial and temporal variation, simulation and prediction of land use in ecological conservation area of western beijing. Remote Sens. 14, 1452. doi:10.3390/rs14061452
Wang, Y., Lan, A., Fan, Z., Lin, S., and Zhu, N. (2023). Analysis of spatial and temporal variation characteristics and drivers of habitat quality in the Chishui River Basin based on the InVEST model. China Rural Water and Hydropower (01), 17–23. doi:10.12396/znsd.220968
Wu, L., Sun, C., and Fan, F. (2021). Estimating the characteristic spatiotemporal variation in habitat quality using the InVEST model—a case study from Guangdong–Hong Kong–Macao greater Bay area. Remote Sens. 13, 1008. doi:10.3390/rs13051008
Xia, M., Zhang, Y., Zhang, Z. H., Liu, J., Ou, W., and Zou, W. (2020). Modeling agricultural land use change in a rapid urbanizing town: Linking the decisions of government,peasant households and enterprises. Land Use Policy 90, 104266. doi:10.1016/j.landusepol.2019.104266
Xu, L., Guo, C., and Luo, S. (2022). Study on habitat quality in Kunming based on PLUS model and InVEST model. Ecol. Environ. Monit. Three Gorges, 1–19.
Yang, L., Wang, J., and Zhou, W. (2022b). Coupling evolution analysis of LUCC and habitat quality in Dongting Lake Basin based on multi-scenario simulation. China Environ. Sci., 1–17.
Yang, S., Su, H., and Zhao, G. (2022a). A multi-scenario simulation of urban ecosystem service value based on PLUS model--Hanzhong City as an example. Arid Zone Resour. Environ. 36 (10), 86–95.
Yang, W., Li, S., Peng, S., Li, Y., Zhao, S., and Qiu, L. (2021). Identification of biodiversity important areas by InVEST model taking into account topographic relief - an example from Yunnan Province. J. Appl. Ecol. 32 (12), 4339–4348. doi:10.13287/j.1001-9332.202112.004
Zhang, S., Yang, P., Xia, J., Wang, W., Cai, W., Chen, N., et al. (2022). Land use/land cover prediction and analysis of the middle reaches of the Yangtze River under different scenarios. Sci. Total Environ. 833, 155238. doi:10.1016/j.scitotenv.2022.155238
Zhao, Y., Qin, M., Pang, Y., Wang, Z., and Shi, Q. (2022a). Simulation of ecological spatial carbon sink evolution and driving factors in the Beibu Gulf urban agglomeration based on FLUS-InVEST model. Soil Water Conservation Bull. 42 (03), 345–355.
Keywords: land use evolution, plus, invest, habitat quality, multiscenario prediction
Citation: Wang J, Wu Y and Gou A (2023) Habitat quality evolution characteristics and multi-scenario prediction in Shenzhen based on PLUS and InVEST models. Front. Environ. Sci. 11:1146347. doi: 10.3389/fenvs.2023.1146347
Received: 17 January 2023; Accepted: 06 February 2023;
Published: 15 February 2023.
Edited by:
Haozhi Pan, Shanghai Jiao Tong University, ChinaReviewed by:
Chen Zeng, Huazhong Agricultural University, ChinaZhe Feng, China University of Geosciences, China
Copyright © 2023 Wang, Wu and Gou. This is an open-access article distributed under the terms of the Creative Commons Attribution License (CC BY). The use, distribution or reproduction in other forums is permitted, provided the original author(s) and the copyright owner(s) are credited and that the original publication in this journal is cited, in accordance with accepted academic practice. No use, distribution or reproduction is permitted which does not comply with these terms.
*Correspondence: Aiping Gou, YWlwaW5nZ291QGhvdG1haWwuY29t
†These authors have contributed equally to this work and share first authorship