- 1College of Geography and Environment Science, Northwest Normal University, Lanzhou, China
- 2Arid Land Research Center, Tottori University, Tottori, Japan
- 3Cryosphere Research Station on the Qinghai-Tibet Plateau, State Key Laboratory of Cryospheric Science, Northwest Institute of Eco-Environment and Resources, Chinese Academy of Sciences, Lanzhou, China
- 4Alliance of Bioversity International and International Centre for Tropical Agriculture, Beijing, China
- 5 Institute of Agricultural Resources and Regional Planning of Chinese Academy of Agricultural Sciences, Beijing, China
Taking the Mongolian Plateau as the research area, this paper studied the vegetation growth from 2001 to 2018. We quantified the vegetation growth changes based on changes in gross primary productivity (GPP) and leaf area index (LAI) and their relationships to climate variables using correlation analysis, partial correlation analysis and multiple correlation analysis. The results showed that from 2001 to 2018 both GPP and LAI showed an increasing trend, with great heterogeneities among different areas and land cover types. The largest increase of GPP and LAI occurred in the northeast plateau with the land cover types of forest and cropland. The main driving factor of vegetation growth was precipitation, while temperature was significantly negatively correlated with vegetation growth. The CO2 concentration had a significant impact on the GPP in farmland, and the increase of solar radiation had a significant impact on tundra. Our study highlights the importance of precipitation in regulating vegetation growth in the Mongolian Plateau, challenging the prevailing views that the temperature dominates the vegetation growth in the northern ecosystems.
1 Introduction
Vegetation is one of the key components in the terrestrial ecosystem, and it controls the exchange of materials and energy between the land and the atmosphere. Vegetation is also an important indicator of regional or global ecological change (Kapfer et al., 2017; Zhou et al., 2020). In recent years, climate change has significantly affected vegetative ecosystem production (Ritchie, 1986; Bachelet et al., 2001; Theurillat and Guisan, 2001) and species distribution, e.g., decreased cold-adapted species and increased warm-adapted species (Gottfried et al., 2012). Vegetation growth is considered to be a response and feedback to global environmental changes, and monitoring vegetation dynamics is critical for understanding the structure and function of ecosystems and developing policies for sustainable ecosystem development (Richardson et al., 2013; Bai et al., 2022).
There are multiple indices that can be used to reflect the vegetation changes (Piao et al., 2020). Among these indices, gross primary productivity (GPP) and leaf area index (LAI) can provide useful information to understand changes in terrestrial ecosystems and global carbon budgets in the context of climate change (Bai et al., 2022; Chen et al., 2022). GPP is defined as the carbon absorbed by terrestrial ecosystems through plant photosynthesis. Due to global warming and human activities, the terrestrial GPP has changed significantly during the past decades. Overall, the global GPP has increased with significant annual variability (Ballantyne et al., 2017; He et al., 2022), while future changes in GPP at the regional scale remain highly uncertain (You et al., 2020). The LAI, defined as one-half of the total leaves area per unit ground area, reflecting the growth of natural vegetation, is used as the input parameter in many biophysical and physiological process models (Liang et al., 2015). The gross primary productivity of OCO-2 solar-induced chlorophyll fluorescence (GOSIF GPP) (Li and Xiao, 2019) and the GLOBMAP leaf area index products have been widely used to analyze vegetation change and its response to climate change (Liu et al., 2012).
Climate change and its impact on terrestrial ecosystems have attracted widespread attention (Bao et al., 2014). Globally, CO2 fertilization is the main driver of the vegetative greenness, with other factors including anthropogenic warming, precipitation, and solar radiation that are dominant drivers of the vegetation growth at regional scales (Li et al., 2021; Bai et al., 2022). In high latitudes and high altitudes where temperature is usually a limiting factor, global warming has a positive impact on vegetation growth, especially for ecosystems at high latitudes, and increasing air temperature promotes photosynthesis of vegetation (Wu et al., 2015). Meanwhile, global warming leads to more frequent extreme events such as extreme heat, precipitation, and drought, which have negative impacts on ecosystems (King et al., 2017). In particular, global warming can induce drought in several semi-arid and arid regions due to increasing evapotranspiration (Miao et al., 2020). In arid and semi-arid regions, precipitation is also usually a limiting factor for vegetation growth (Snyder and Tartowski, 2006).
In the high latitudes of the Northern Hemisphere, climate change has significantly changed the vegetation growth, distribution, growth, and species composition of vegetation. These changes can create significant feedback for climate change (Han et al., 2022). It has been suggested that the high latitudes in the Northern Hemisphere are warming faster than the global average (Hu et al., 2022). It should be noted that different areas in the high latitudes of the Northern Hemisphere also belong to arid and semi-arid regions (Huang et al., 2016). Therefore, it could be inferred that temperature, precipitation, CO2 concentration, and human activities may have important effects on the vegetation growth in these cold and arid regions. However, the relative importance of these factors in determining the vegetation growth remains unknown. These knowledge gaps impede our understanding of future terrestrial changes in the Northern Hemisphere.
As an important component of the East Asian ecosystem, the Mongolian Plateau plays an important role in the regional and even global carbon cycle (Wei et al., 2023). Due to the arid climate, the Mongolian Plateau ecosystem is relatively fragile (Liu et al., 2023). The Mongolian Plateau also belongs to the southern boundary areas of the northern permafrost zone. Due to its lower latitudes, the Mongolian permafrost regions are sensitive to climate warming (Zhao et al., 2015; Meng et al., 2019). Therefore, the response of vegetation growth to climate change in the Mongolian Plateau is a good indicator for the northern permafrost ecosystem changes in the future, and understanding the response of vegetation to climate change and its driving factors can shed light on the future changes of the vast northern permafrost regions. In addition, this knowledge can provide a scientific basis for policymakers to make necessary decisions and actions to conserve the environment to achieve sustainable development goals.
In this study, we selected the Mongolian Plateau as the study area. We analyzed the spatial and temporal distribution of GPP and LAI data in this area from 2001 to 2018, and we also examined the relationships between vegetation indices and different climate variables. The main goals of our research are to 1) investigate the changing trend of vegetation GPP and LAI on the Mongolian Plateau from 2001 to 2018 and 2) examine the response of GPP and LAI to different climatic factors, including CO2 concentrations, air temperature, precipitation, and solar radiation. The results of this study can improve our understanding of the changing patterns of vegetation and their underlying mechanisms in the cold and arid regions, and also serve as a scientific basis for the ecosystem management in these regions.
2 Study area and data
2.1 Study area
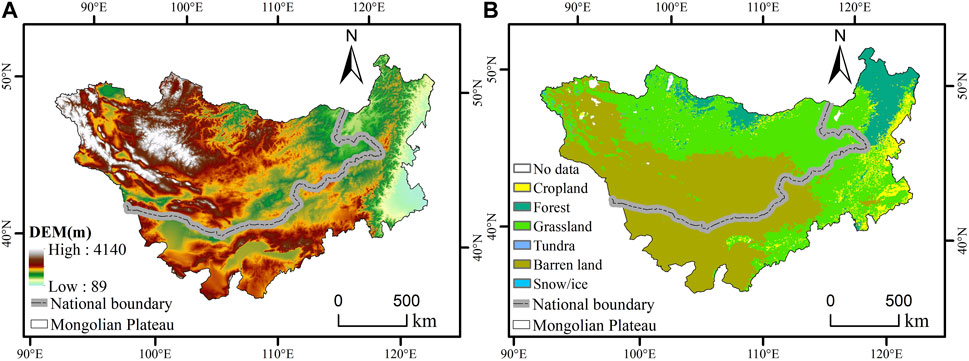
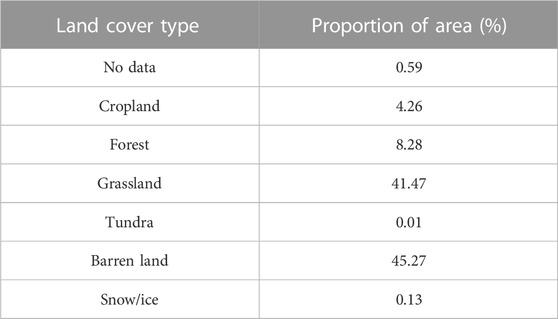
The Mongolian Plateau (Figure 1) covers an area of about 2.7 million km2 and spans 35°–55° north latitude and 85°–130° east longitude. It is located in the hinterland of the Asian continent. The topography of the plateau varies significantly. It is high in the west and low in the east, rising from 89 m above the sea level in eastern Inner Mongolia to 4,140 m above the sea level in western Mongolia, with an average elevation of 1,288 m. The Mongolian Plateau is dominated by an arid and semi-arid continental monsoon climate, with cold and dry winters and warm summers (Miao et al., 2017). In Mongolia, the average annual temperature from 1980 to 1999 ranged from −4.3°C in the northern high-altitude forest to 6.8°C in the eastern low-latitude forest. Average annual precipitation ranged from 60 to 410 mm, and the corrected precipitation ranged from 74 to 479 mm (Snyder and Tartowski, 2006). Most of the precipitation falls between June and August, with the peak growing season reaching its maximum in August (John et al., 2016). The Mongolian Plateau shows notable latitude zonation in terms of terrain, climate, and biological communities (Zhou et al., 2018). The plateau consists of three major biological communities (desert, grassland, and forest), whose distribution is mainly determined by the precipitation gradient (John et al., 2016). The unique geographical location and climatic environment of the Mongolian Plateau have resulted in rich and diverse vegetation types. From the northeast to the southwest, forests (northern Sayan Mountains, northern Kent Mountains, and Greater Khingan Range of Inner Mongolia), grasslands (central and northwestern Mongolia), the Gobi Desert (southwest Mongolia and southwest Inner Mongolia), sparse vegetation (southwest Inner Mongolia), farmland, and shrub vegetation are mainly distributed in central and eastern Inner Mongolia. Among them, grasslands accounted for 41.47% of the total area, distributed in the northern and eastern regions. Forests accounted for 8.28% of the total area, mainly distributed in the Greater Khingan Range in the northeastern part of the plateau, the Kent Mountains, and the Sayan Mountains in the north (Table 1).
2.2 Data resources
Land cover data were downloaded from the website (https://doi.pangaea.de/10.1594/PANGAEA.913496) (Liu et al., 2020) and were classified into seven categories, namely cropland, forest, grassland, shrub, tundra, barren land, and snow/ice. Climate data were downloaded from the WorldClim website (https://www.worldclim.org/data/monthlywth.html), through the CRU-TS-4.03 data dimension reduction. We selected the maximum temperature (°C), minimum temperature (°C), and precipitation (mm) data. The spatial resolution was 2.5'(about 21 km2). Solar radiation data (W/m2) were obtained from the National Tibetan Plateau Data Center (http://data.tpdc.ac.cn) with a spatial resolution of 10 km (Tang, 2019). SIF–GPP data (g C m−2 year−1) were downloaded from the website (https://globalecology.unh.edu/), the spatial resolution was 0.05° [15]. The carbon dioxide concentration data (mol−1) were downloaded from the GES DISC website (https://disc.gsfc.nasa.gov/datasets/SNDRAQIL3CMCCP_2/summary) with the spatial resolution of 1° × 1°. Soil moisture and soil temperature data were also downloaded from the GES DISC website (https://disc.gsfc.nasa.gov/datasets/AMSRE_AVRMO_005/summary?keywords=soil%20moisture%20L4) with the spatial resolution of 1° × 1°. The product of the global leaf area index was downloaded from the website (https://www.resdc.cn/data.aspx?DATAID=336) with the spatial resolution of 8 km. The time span of all variables was unified into 2001–2018, the time resolution was a year, the spatial resolution was resampling 0.05°, and the reprojection was Albers projection.
2.3 Methodology
2.3.1 Slope analysis
The changing trend of GPP and LAI was analyzed by unary linear regression method. The calculation formula is as follows:
where θslope is the changing rate of the variable x, n is the number of the years, i is the year i, and xi is the variable x of the year i.
The significance of the change trend can be determined by the F test, and the calculation formula is as follows:
where
2.3.2 Correlation analysis, partial correlation analysis and multiple correlation analysis, and significance test
The correlation coefficient can reveal the correlation between two variables, and the Pearson coefficient is calculated as follows:
Among them, Rx,y is the correlation coefficient between variables x and y, and
The coefficients of partial correlation analysis reflect the essential relationship between variables. The second-order partial correlation analysis was used, and the calculation formula is as follows:
where y represents GPP or LAI. The variables 1, 2, and 3 represent climatic factors. Ry1,23 represents the partial correlation coefficient between GPP or LAI and the specific climate factor after fixing the other two climate variables.
The significance test of the partial correlation coefficient was based on the t-test, and the significance level (α = 0.05) was calculated by the following formula:
where R stands for the partial correlation coefficient, n is the sample size, and m is the number of independent variables.
The multiple correlation analysis was used to analyze the correlation degree index between a single factor and multiple factors under the joint effects of multiple influencing factors. The calculation formula is as follows:
where
The significance test of multiple correlation coefficients was based on the F test, and the significance level (α = 0.05) was calculated by the following formula:
where n is the number of samples, k is the number of independent variables, and F is the significance test statistic.
3 Results
3.1 Spatial and temporal distribution and changing trends of GPP and LAI
The GPP and LAI showed similar trends, with 94.05% of the areas with significant positive relationships, and the SIF–GPP provided more detailed information than the LAI, especially in forest areas (Figure 2). The distribution pattern of GPP on the Mongolian Plateau from 2001 to 2018 showed considerable spatial heterogeneities (Figure 2). The GPP values ranged from 0 to 1,441.36 g C m−2 year−1, with an average value of 286.76 g C m−2 year−1. The high values were mainly distributed in the northern and northeastern areas. The LAI showed a similar spatial pattern with GPP. The LAI ranged from 0 to 4.53, with an average value of 0.29 (Supplementary Figure S1). GPP and LAI values were the highest in farmland and forest vegetation types (Supplementary Table S1). Evidently, the northeastern regions of the Mongolian Plateau, the Greater Khingan Range, the northern Sayan Mountains, and the Kent Mountains have higher GPP and LAI.
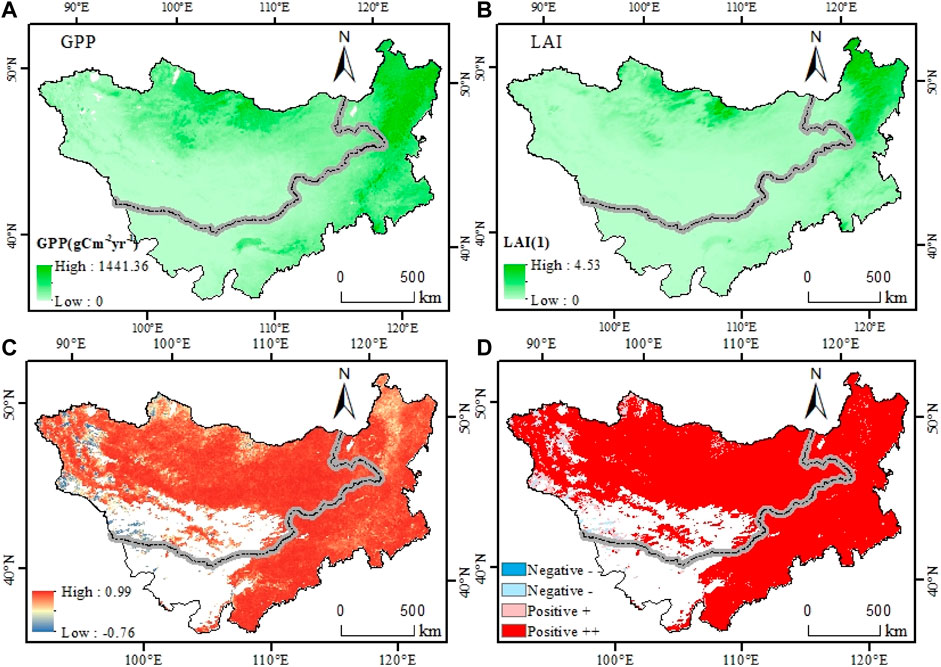
FIGURE 2. Spatial distribution of the average annual values of GPP (A) and LAI (B) during 2001–2008 in the Mongolian Plateau. Correlation (C) and significance (D) of GPP and LAI. −, non-significant negative correlation; −−, significant negative correlation; +, non-significant positive correlation; and ++, significant positive correlation.
The changing trend of GPP showed an overall increasing trend, with a higher rate in the northern, eastern, and southern parts. The lower increasing rate appeared in the southwest, central, and northwestern regions (Figure 3). A total of 89.8% showed an increasing trend and 10.2% of the area showed a decreasing trend. Among them, 56.1% of the area showed no significant increase, and 33.7% of the area showed significant increase. Of the total area, 9.2% showed a significant decrease, and 1.0% of the area showed a significant decrease. The changing pattern of the LAI was similar to that of GPP. In total, 89.8% of the total regions showed an increasing trend, and 9.2% of the area showed no significant decrease. There was only about 1.0% of the total area that showed a significant decrease. For the areas with increasing trends, 33.68% of the total area showed significant increase, and 56.1% of the total areas showed no significant increase. GPP was highly correlated with the LAI, and SIF–GPP could show more details than the LAI, especially in the forest area (Ersi et al., 2023).
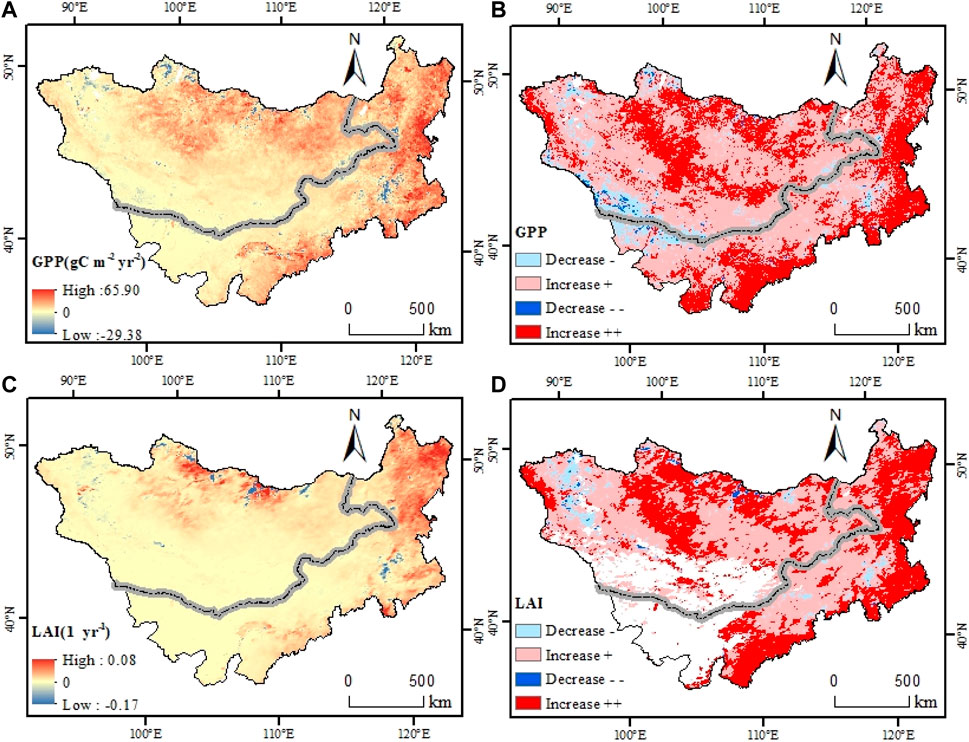
FIGURE 3. Changing trend (A,C) and significance (B,D) of GPP and LAI in the Mongolian Plateau during 2001–2018. −, Non-significant decrease; −−, Significant decrease; +, Non-significant increase; ++, Significant increase.
3.2 Changes in CO2 and climate variables
The annual mean CO2 concentration was higher in the northwest and lower in the northeast (Supplementary Figure S2). Precipitation and soil moisture showed a decreasing trend from the northeast to the southwest. The solar radiation was higher in the southwest and lower in the northeast. Soil temperature, the maximum air temperature, the minimum air temperature, and the mean air temperature decreased from the south to the north.
During 2001–2018, CO2 concentrations showed an increasing trend (Figure 4). The precipitation presented increasing trends in most areas. The solar radiation increased in the central part and decreased in the surrounding part. Soil moisture and soil temperature showed slight changes. Overall, air temperatures increased on the plateau, with some areas showing a decreasing trend in the Northeastern Plateau.
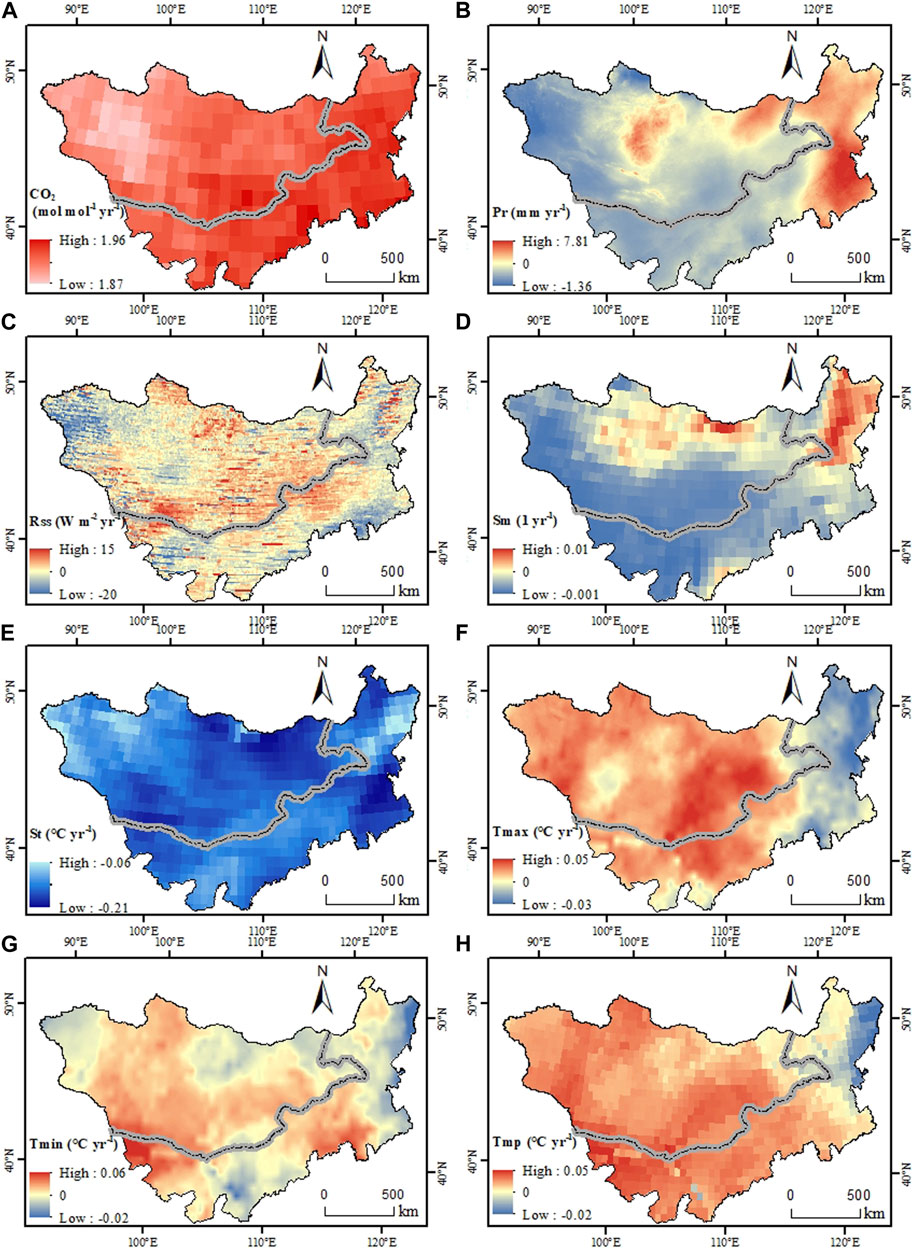
FIGURE 4. Changing trends of CO2 concentrations and climate factors over the Mongolian Plateau during 2001–2018: (A) CO2 concentration; (B) Pr, precipitation; (C) Rss, solar radiation; (D) SM, soil moisture; (E) St, soil temperature; (F) Tmax, the average values of the maximum air temperature for 12 months of the year; (G) Tmin, the average values of the minimum temperature for 12 months of the year; and (H) Tmp, annual mean air temperature.
3.3 Correlation between climate variables and GPP and LAI
We calculated the correlation coefficients and their significant levels between GPP and climate variables (Figure 5; Supplementary Figure S3). GPP was positively correlated with CO2 (89.86% of the total area), precipitation (90.11% of the area), and soil moisture (95.40% of the total area), while it was negatively correlated with soil temperature (90.04% of the total area). GPP was also largely negatively correlated with the maximum and minimum temperature, occupying 68.52% and 58.74% of the total area, respectively (Supplementary Table S2). The areas with negative correlation between GPP and mean temperature accounted for 64.99% of the total area.
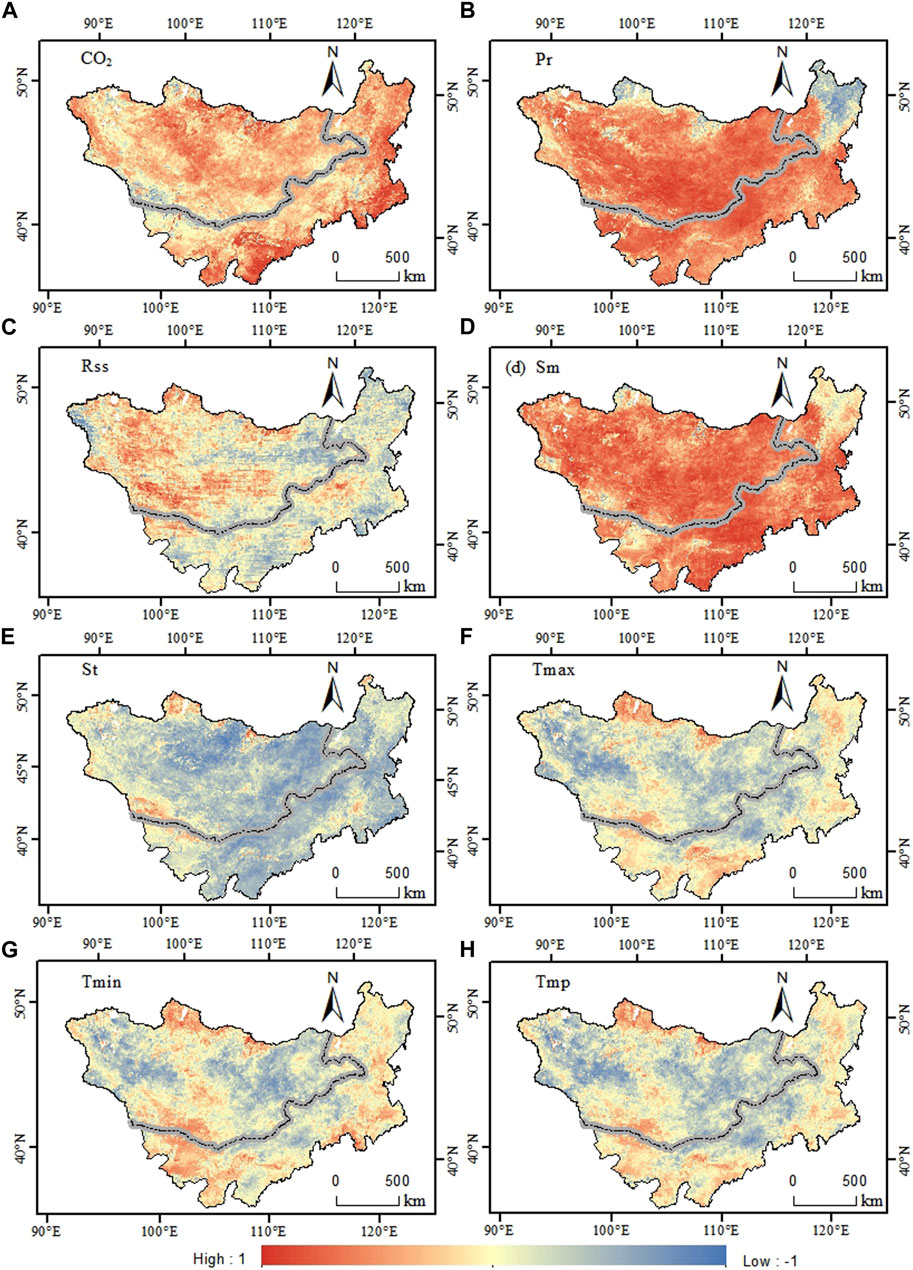
FIGURE 5. Correlation coefficients among GPP and environmental factors: (A) CO2 concentration, (B) precipitation, (C) solar radiation, (D) soil moisture, (E) soil temperature, (F) maximum air temperature, (G) minimum air temperature, and (H) mean air temperature.
The LAI was positively correlated with CO2 (93.50% of the total area), precipitation (92.02% of the total area), and soil moisture (97.24% of the total area) (Figure 6; Supplementary Figure S4; Supplementary Table S3). The LAI was largely negatively correlated with soil temperature (91.81% of the total area), maximum air temperature (71.50% of the total area), minimum air temperature (62.18% of the total area), and mean air temperature (69.38% of the total area).
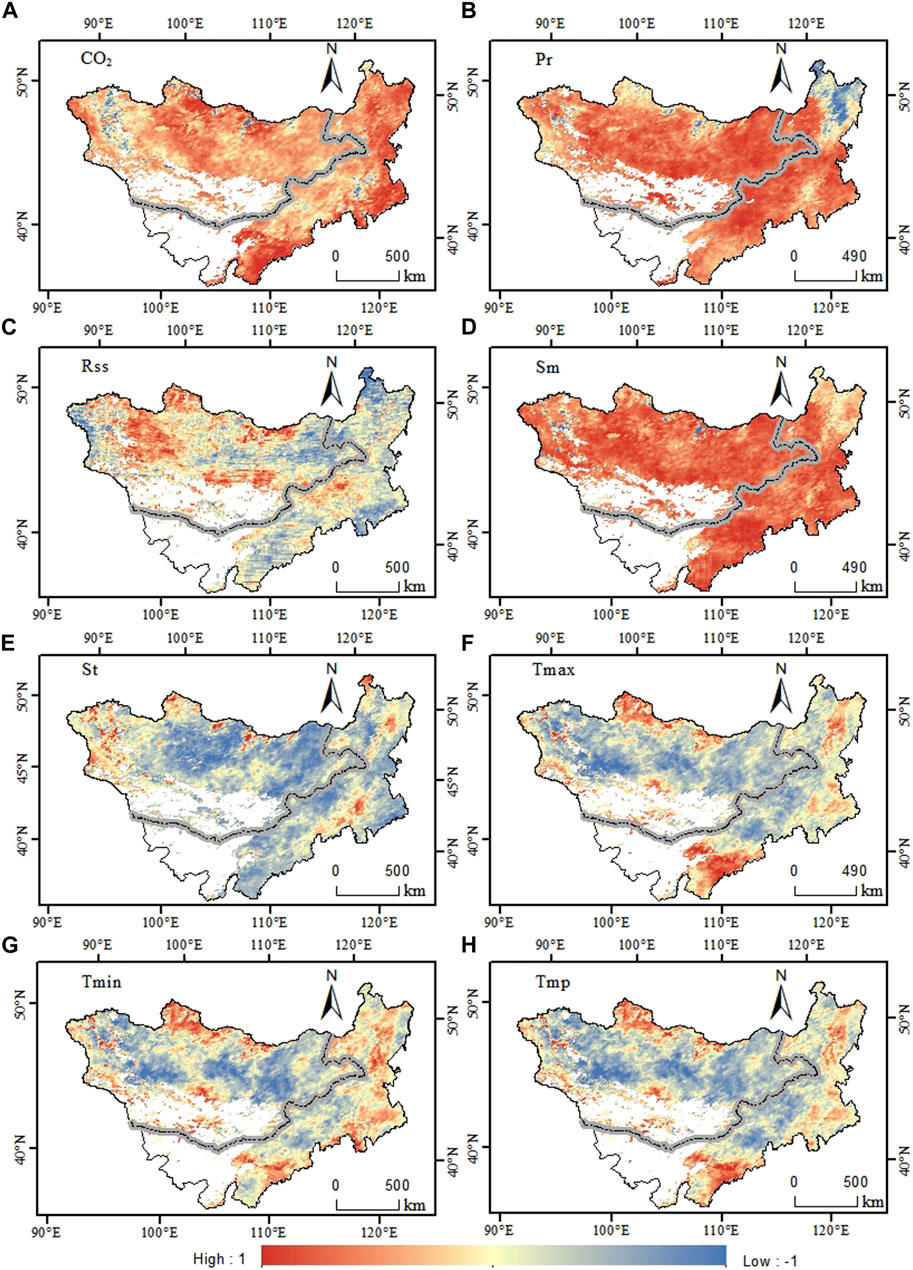
FIGURE 6. Correlation coefficients between LAI and environmental factors: (A) CO2 concentration, (B) precipitation, (C) solar radiation, (D) soil moisture, (E) soil temperature, (F) maximum air temperature, (G) minimum air temperature, and (H) mean air temperature.
The positive effects of soil moisture on GPP and LAI were significant in farmlands, grasslands, and wastelands. Soil moisture in the forest and tundra negatively correlated with GPP and LAI (Supplementary Figure S5). In general, CO2 concentration, precipitation, and soil moisture had positive effects on vegetation growth, while solar radiation and temperature had negative effects on vegetation growth (Supplementary Table S4). The precipitation had strong negative effects on forests and positive effects on other land types. Temperature had positive effects on the tundra, while negative effects were observed on other land cover types.
3.4 Partial correlation analysis GPP and climate factors
The partial correlation analysis showed the significant positive correlation between GPP and precipitation accounted for 65.34% of the area (Figure 7). The area with significant negative correlation between GPP and precipitation accounted for 8.55% of the area. The significant negative correlation between solar radiation and GPP accounted for 59.68% of the area, and 7.56% of the total area showed no significant negative correlation. The area with significant negative correlation between GPP and temperature accounted for 40.28% of the total area. The partial correlation analysis showed that precipitation was largely positively correlated with the LAI, while other factors showed complex relationships with the LAI (Figure 8).
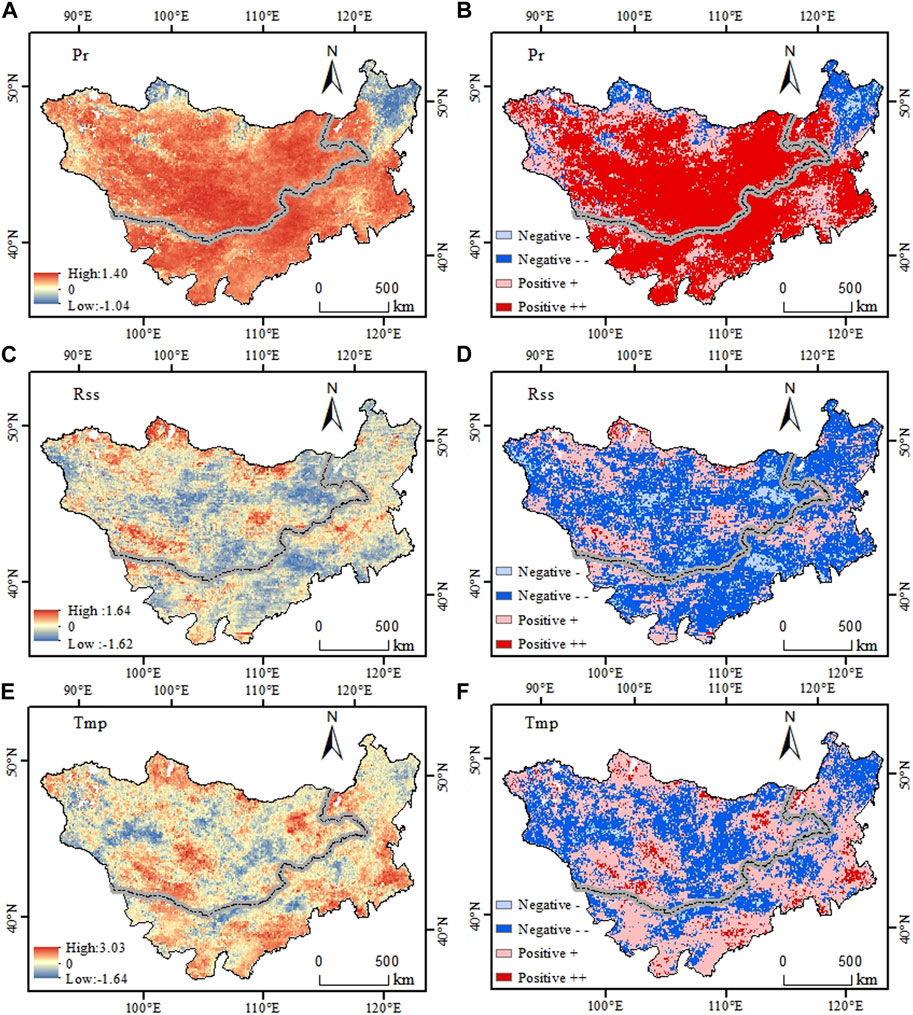
FIGURE 7. Partial correlation analysis and significance of GPP and climate factors, (A,B) precipitation, (C,D) solar radiation, (E,F) temperature. Partial correlation types: Negative− (Non-significant negative correlation), Negative−− (Significant negative correlation), Positive + (Non-significant positive correlation), Positive++ (Significant positive correlation).
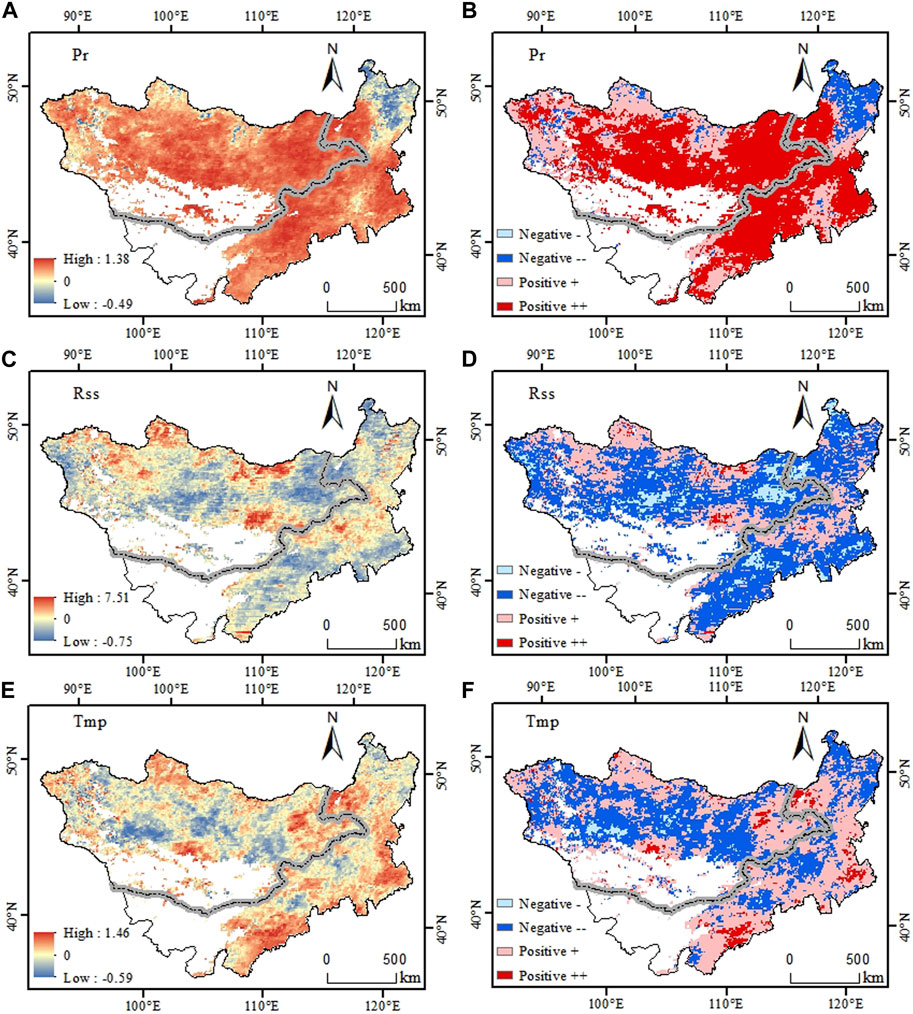
FIGURE 8. Partial correlation analysis and significance of LAI and climate factors, (A,B) precipitation, (C,D) solar radiation, (E,F) temperature. Partial correlation types: Negative− (Non-significant negative correlation), Negative−− (Significant negative correlation), Positive + (Non-significant positive correlation), Positive++ (Significant positive correlation).
3.5 Complex correlation analysis between climate factors and GPP and LAI
The multiple-correlation analyses between temperature, precipitation, and solar radiation with GPP were carried out in the Mongolian Plateau (Figure 9). The range of multiple correlation coefficients was 0.01–2.00, with a mean value of 0.63. The areas with significant positive correlation accounted for 40.53% of the total area, and other areas with non-significant positive correlation accounted for 59.47% of the total area. There was a positive correlation between the LAI and climate variables, in which the area with significant positive correlation accounted for 43.40%, and the area with non-significant positive correlation accounted for 56.57% of the total area.
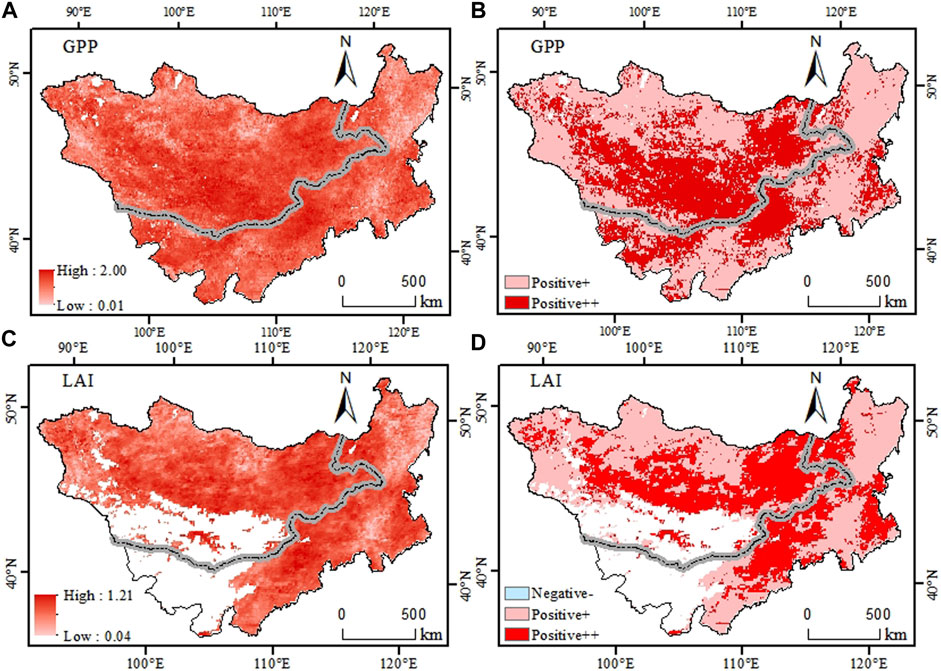
FIGURE 9. Complex correlation coefficients between GPP and LAI and environmental factors; (A,C) complex correlation and (B,D) significance. +, non-significant positive correlation; ++, significant positive correlation; and −, non-significant negative correlation.
3.6 The climate factors driving GPP and LAI changes were divided
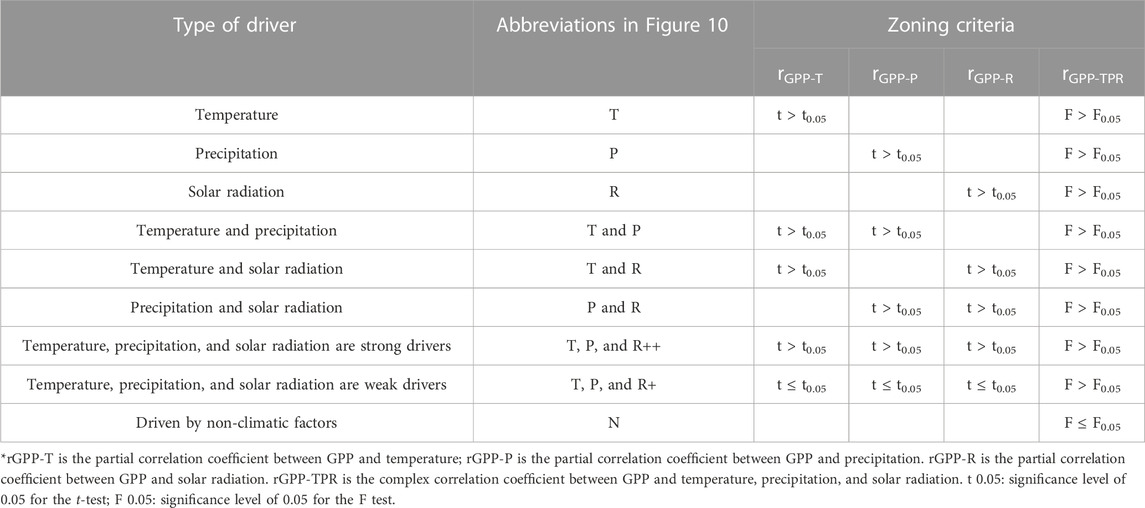
The driving factors of GPP and LAI under different land cover types were analyzed using partitioning analysis (Figure 10). For GPP, most of the areas (53.27%) were driven by climate factors, of which the temperature-driven factor accounts for 3.87%, the precipitation-driven factor accounts for 30.99%, and the solar radiation-driven factor accounts for 5.95% (Table 2). Similarly, the LAI in most areas were also driven by climate factors, of which 3.99% was driven by temperature, 32.66% by precipitation, 6.71% by solar radiation, and about 44.28% of the areas were driven by non-climatic factors (Table 2). For spatial distribution of the driving factors of GPP and LAI, it is clear that precipitation was the most important driving factor. In the areas with lower elevation areas, which are dominated by grasslands and deserts, the vegetation change is mainly driven by precipitation. The GPP and LAI in the foot of the Hangai Mountains, southeast of the Altai Mountains, and other areas were mainly driven by temperature. The areas between the Hangai Mountains and Kent Mountains, the northern part of the plateau, and in the northeastern part of the Yin Mountains were mainly driven by solar radiation. The surrounding areas of the Mongolian Plateau were mainly driven by non-climatic factors, and these areas are largely dominated by the coniferous forest, savanna, and farmland.
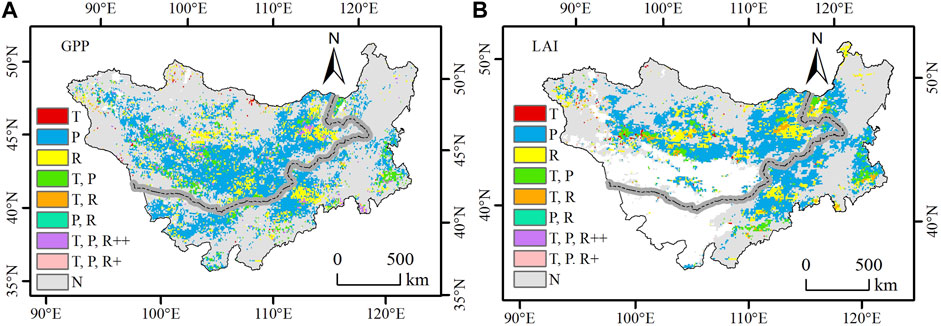
FIGURE 10. Driving factors of GPP (A) and LAI (B) in the Mongolian Plateau. The abbreviations for the climate variables are shown in Table 2.
4 Discussion
During 2001–2018, the GPP and LAI on the Mongolian Plateau showed the similar spatial distribution pattern and with overall increasing trends. The central, northeastern, southern, and northern regions increased significantly, while some areas in the southwest, central, and northwestern regions showed a decreasing trend. This finding is consistent with the changing trends in previous studies (Bai et al., 2022; Chen et al., 2022). The increase of CO2 concentration and average precipitation in the Mongolian Plateau from 2000 to 2018 improved soil water supply capacity, enhanced photosynthesis efficiency, promoted vegetation growth, and increased GPP and LAI (Liu et al., 2022). In some regions of the south plateau (Inner Mongolia, China), climate factors have no significant influence on vegetation GPP and LAI. However, vegetation growth in Inner Mongolia was better than that in other areas, as indicated by the higher increasing rate of GPP and LAI. This pattern could be partly explained by large-scale vegetation restoration in Inner Mongolia (Dong et al., 2020).
The distribution and changing trends of GPP and LAI varied considerably among land cover types. There are several reports on the patterns of GPP in different land cover types in the Mongolian Plateau (John et al., 2009; Zhang et al., 2022a; Yin et al., 2022). The GPP of forests was the highest, with an average value of 923.91 g C m−2 year−1. The LAI of forest types was the highest, with an average value of 1.52, followed by that of cropland with an average of 0.57. This pattern is in agreement with previous findings on these land cover types (Li et al., 2022a). The changing trends of GPP and LAI were similar under different land cover types, indicating that these indices clearly showed the vegetation change. In addition to the wide distribution of forests in the northern plateau, the grasslands in the northern plateau also had higher GPP than that in other areas, and this can partly be attributed to the distribution of permafrost. In Mongolia, permafrost is widely distributed in the northern plateau (Sharkhuu and Sharkhuu, 2012; Li et al., 2022). Permafrost plays an important role in regulating soil water contents. The existence of permafrost can block the vertical filtration of soil water content and thus maintain a higher soil water content (Li et al., 2022c). Therefore, it is reasonable that the vegetation growth of permafrost areas, such as the Altai Mountain range, Hangai Mountain Range, Kent Mountain Range, and Greater Khingan Range are better than that of other permafrost areas in the northern area because the former areas have shallow active layer thickness (Wu et al., 2022). Global warming causes widespread permafrost degradation and fewer frozen days of seasonal frozen ground. When the frozen active layer and/or permafrost thaws in summer, the liquid water can provide water for plant growth (Sugimoto et al., 2003). This process is related to permafrost distribution and active layer thickness. The melting of shallow ground ice can directly increase soil water content, while the deepening active layer may increase the vertical filtration of surface water and in turn lead to drier soils that are unfavorable for plant growth (Liu et al., 2021; Li et al., 2022). However, in permafrost regions with very thick active layer, e.g., the active layer thickness could be greater than 6 m (Adiya et al., 2021), it is unlikely that this depth can affect surface soil water content, and thus permafrost degradation should have little effects on vegetation growth. With the continuous warming of climate and permafrost degradation, the dominant species, population density, and distribution area of vegetation in the permafrost area will undergo significant changes due to changes in temperature and soil water content (Jin et al., 2021; Klinge et al., 2021).
We found that climate factors related to moisture had positive impacts on GPP and LAI, while climate factors related to temperature had negative impacts on GPP and LAI. The CO2 concentration had a positive effect and solar radiation had a negative effect on vegetation growth. The precipitation in the Mongolian Plateau increases from the southwest to the northeast, and the air temperature decreases from the south to the north (John et al., 2013). Due to the differences in vegetation types, precipitation, evapotranspiration, and temperature, different biomes in the Mongolian Plateau have different responses to the climate (John et al., 2013). Climate change largely had positive impacts on vegetation growth (Zhao et al., 2021). In our study, precipitation was the most important factor for the increase of GPP and LAI (Wang et al., 2019). It has also been observed that GPP and LAI had significant relationships with precipitation (Meng et al., 2022). The Mongolian Plateau is an arid and semi-arid ecosystem with great inter-annual variation in precipitation, and thus, the precipitation was considered to be the main limiting factor for vegetation growth (Liu et al., 2021). The increase in precipitation relieves water stress and promotes carbon assimilation. In the context of global warming, the Mongolian Plateau will likely have sufficient heat resources, and rising temperatures may cause temperature-related droughts and restrict vegetation growth (Bao et al., 2014). This idea can also be supported by negative relationships between temperature and vegetation indices in the northern plateau, suggesting that the main factor for vegetation growth in high-latitude forest regions is temperature rather than precipitation (Tong et al., 2018).
The CO2 concentration has the largest positive influence on the GPP of croplands. The solar radiation had the largest positive effect on GPP and LAI in the tundra, while it had a negative effect on other types. Soil moisture had the largest positive impact on GPP and LAI in cropland, grassland, and barren land. The largest effect of CO2 concentration on vegetation growth in farmland can be explained by the fact that maize is one of the main food crops in the Mongolian Plateau (Peng et al., 2021). Maize is a C4 plant and more sensitive to CO2 than other C3 plants, and thus the fertilization effect of increased CO2 is evident in cropland (Adiya et al., 2021). Precipitation also had the largest positive effect on GPP and LAI of croplands, grasslands, and barren lands, affirming the fact that most areas with different land cover types in Mongolia are semi-arid and arid regions (Hu et al., 2018). Soil moisture is the most direct and main water supply method for vegetation and its dynamics can affect the biomass and phenology of vegetation (Luo et al., 2021). The solar radiation promoting vegetation growth in the tundra showed that the tundra productivity is in relation with the incident solar radiation, which usually constrains the photosynthesis of this land cover type. Soil temperature largely negatively correlated with vegetation growth, which can be explained by drought mechanisms because the rise in soil temperature aggravated the drought. The air temperature had a positive effect on the tundra and forest GPP and LAI and a negative effect on other types. In the tundra region, temperature is a typical limiting factor for vegetation growth, and higher temperatures can promote forest growth by prolonging the growing season and enhancing photosynthesis (Natali et al., 2012). In contrast, precipitation is negatively related with forest growth. This can be attributed to the fact that higher precipitation is also associated with lower solar radiation during the growing seasons (Bao et al., 2014). In the Mongolian Plateau, vegetation change is strongly affected by climate change and human activities (Meng et al., 2019). During the past decades, overgrazing and mining are the main drivers for grassland degradation in Mongolia (Zhang et al., 2022b). In China, grassland restoration has been implemented over the past decades (Cai et al., 2020; Wei et al., 2023). Future studies are required to disentangle the relative importance of climate change and human activities in vegetation changes on the Mongolian Plateau.
5 Conclusion
We used GPP and LAI data to analyze the vegetation changing trend and its response to climate factors in the Mongolian Plateau from 2001 to 2018. Our results showed that the Mongolian Plateau, overall, has a greening trend with evident spatial heterogeneities, with the largest increase in the northeastern region. Among them, 90% of the plateau showed an increasing trend in GPP, and 75% of the area showed an increasing trend in the LAI. The GPP and LAI of forests, croplands, and grasslands had the highest increasing values. Climate factors had significant effects on vegetation, and precipitation was the main factor affecting vegetation growth. Soil moisture and CO2 concentration are also significantly positively correlated with vegetation growth in most regions, while the effects of precipitation on the forest were not evident. With the increase of temperature and solar radiation, only the tundra showed an increasing trend in GPP due to the elevation of cold temperature stress. Our study highlights the importance of precipitation and CO2 concentrations in regulating vegetation in cold and arid ecosystems. The results also suggest that the temperature may not be the most important factor affecting vegetation in various cold regions. Our study may also provide a scientific basis for the implementation of ecological conservation projects to achieve the sustainable development goals in the Mongolian Plateau.
Data availability statement
The original contributions presented in the study are included in the article/Supplementary Material; further inquiries can be directed to the corresponding author.
Author contributions
Conceptualization, CL and XW; methodology, CL and LL; software, YW; validation, YL, LP, and JC; formal analysis, XW; investigation, CL; resources, LL; data curation, CL and LL; writing—original draft preparation, CL, KB, and LL; writing—review and editing, XW; and visualization, AT; supervision, XW and AT. All authors have read and agreed to the published version of the manuscript.
Funding
This work was supported by the National Natural Science Foundation of China (32061143032, 42161058), the Special Foundation for National Science and Technology Basic Research Program of China (2017FY101301-5), the China Scholarship Council, and the West Light Foundation of the Chinese Academy of Sciences.
Conflict of interest
The authors declare that the research was conducted in the absence of any commercial or financial relationships that could be construed as a potential conflict of interest.
Publisher’s note
All claims expressed in this article are solely those of the authors and do not necessarily represent those of their affiliated organizations, or those of the publisher, the editors, and the reviewers. Any product that may be evaluated in this article, or claim that may be made by its manufacturer, is not guaranteed or endorsed by the publisher.
Supplementary material
The Supplementary Material for this article can be found online at: https://www.frontiersin.org/articles/10.3389/fenvs.2023.1153601/full#supplementary-material
References
Adiya, S., Dalantai, S., Wu, T., Wu, X., Yamkhin, J., Bao, Y., et al. (2021). Spatial and temporal change patterns of near-surface CO2 and CH4 concentrations in different permafrost regions on the Mongolian Plateau from 2010 to 2017. Sci. Total Environ. 800 (10), 149433. doi:10.1016/j.scitotenv.2021.149433
Bachelet, D., Neilson, R. P., Lenihan, J. M., and Drapek, R. J. (2001). Climate change effects on vegetation distribution and carbon budget in the United States. Ecosystems 4 (3), 164–185. doi:10.1007/s10021-001-0002-7
Bai, Y., Li, S., Liu, M., and Guo, Q. (2022). Assessment of vegetation change on the Mongolian Plateau over three decades using different remote sensing products. J. Environ. Manag. 317, 115509. doi:10.1016/j.jenvman.2022.115509
Ballantyne, A., Smith, W., Anderegg, W., Kauppi, P., Sarmiento, J., Tans, P., et al. (2017). Accelerating net terrestrial carbon uptake during the warming hiatus due to reduced respiration. Nat. Clim. Change 7 (2), 148–152. doi:10.1038/nclimate3204
Bao, G., Qin, Z., Bao, Y., Zhou, Y., Li, W., and Sanjjav, A. (2014). NDVI-based long-term vegetation dynamics and its response to climatic change in the Mongolian Plateau. Remote Sens. 6 (9), 8337–8358. doi:10.3390/rs6098337
Cai, Y., Zhao, M., Shi, Y., and Khan, I. (2020). Assessing restoration benefit of grassland ecosystem incorporating preference heterogeneity empirical data from Inner Mongolia Autonomous Region. Ecol. Indic. 117, 106705. doi:10.1016/j.ecolind.2020.106705
Chen, X., Tao, X., and Yang, Y. (2022). Distribution and attribution of gross primary productivity increase over the Mongolian plateau, 2001-2018. Ieee Access 10, 25125–25134. doi:10.1109/ACCESS.2022.3155722
Dong, G., Zhao, F., Chen, J., Zhang, Y., Qu, L., Jiang, S., et al. (2020). Non-climatic component provoked substantial spatiotemporal changes of carbon and water use efficiency on the Mongolian Plateau. Environ. Res. Lett. 15 (9), 095009. doi:10.1088/1748-9326/ab9692
Ersi, C., Bayaer, T., Bao, Y., Bao, Y., Yong, M., Lai, Q., et al. (2023). Comparison of phenological parameters extracted from SIF, NDVI and NIRv data on the Mongolian plateau. NDVI NIRv Data Mong. Plateau 15 (1), 187. doi:10.3390/rs15010187
Gottfried, M., Pauli, H., Futschik, A., Akhalkatsi, M., Barančok, P., Benito Alonso, J. L., et al. (2012). Continent-wide response of mountain vegetation to climate change. Nat. Clim. Change 2 (2), 111–115. doi:10.1038/nclimate1329
Han, H. Z., Bai, J. J., Ma, G., Yan, J. W., Wang, X. H., Ta, Z. J., et al. (2022). Seasonal responses of net primary productivity of vegetation to phenological dynamics in the loess plateau, China. Chin. Geogr. Sci. 32 (2), 340–357. doi:10.1007/s11769-022-1270-8
He, P., Ma, X., and Sun, Z. (2022). Interannual variability in summer climate change controls GPP long-term changes. Environ. Res. 212, 113409. doi:10.1016/j.envres.2022.113409
Hu, G., Davies, J., Gao, Q., and Liang, C. (2018). Response of ecosystem functions to climate change and implications for sustainable development on the Inner Mongolian Plateau. Rangel. J. 40 (2), 191–203. doi:10.1071/RJ18041
Hu, G., Zhao, L., Wu, T., Wu, X., Park, H., Li, R., et al. (2022). Continued warming of the permafrost regions over the northern Hemisphere under future climate change. Earth's Future 10 (9), e2022EF002835. doi:10.1029/2022ef002835
Huang, J., Ji, M., Xie, Y., Wang, S., He, Y., and Ran, J. (2016). Global semi-arid climate change over last 60 years. Clim. Dyn. 46, 1131–1150. doi:10.1007/s00382-015-2636-8
Jin, X. Y., Jin, H. J., Iwahana, G., Marchenko, S. S., Luo, D. L., Li, X. Y., et al. (2021). Impacts of climate-induced permafrost degradation on vegetation: A review. Adv. Clim. Change Res. 12 (1), 29–47. doi:10.1016/j.accre.2020.07.002
John, R., Chen, J., Lu, N., and Wilske, B. (2009). Land cover/land use change in semi-arid inner Mongolia: 1992–2004. Environ. Res. Lett. 4 (4), 045010. doi:10.1088/1748-9326/4/4/045010
John, R., Chen, J., Ou-Yang, Z. T., Xiao, J., Becker, R., Samanta, A., et al. (2013). Vegetation response to extreme climate events on the Mongolian Plateau from 2000 to 2010. Environ. Res. Lett. 8 (3), 035033. doi:10.1088/1748-9326/8/3/035033
John, R., Chen, J. Q., Kim, Y., Ou-yang, Z. T., Xiao, J. F., Park, H., et al. (2016). Differentiating anthropogenic modification and precipitation-driven change on vegetation productivity on the Mongolian Plateau. Landsc. Ecol. 31 (3), 547–566. doi:10.1007/s10980-015-0261-x
Kapfer, J., Hédl, R., Jurasinski, G., Kopecký, M., Schei, F. H., and Grytnes, J. A. (2017). Resurveying historical vegetation data–opportunities and challenges. Appl. Veg. Sci. 20 (2), 164–171. doi:10.1111/avsc.12269
King, A. D., Karoly, D. J., and Henley, B. J. (2017). Australian climate extremes at 1.5 C and 2 C of global warming. Nat. Clim. Change 7 (6), 412–416. doi:10.1038/nclimate3296
Klinge, M., Schneider, F., Dulamsuren, C., Arndt, K., Bayarsaikhan, U., and Sauer, D. J. E. S. P. (2021). Interrelations between relief, vegetation, disturbances, and permafrost in the forest-steppe of central Mongolia. Earth Surf. Process. Landforms 46 (9), 1766–1782. doi:10.1002/esp.5116
Li, C., Sun, H., Liu, L., Dou, T., Zhou, M., Li, W., et al. (2022c). The importance of permafrost in the steady and fast increase in net primary production of the grassland on the Qinghai–Tibet Plateau. CATENA 211, 105964. doi:10.1016/j.catena.2021.105964
Li, C., Wei, Y., Liu, Y., Li, L., Peng, L., Chen, J., et al. (2022a). Active layer thickness in the northern Hemisphere: Changes from 2000 to 2018 and future simulations. J. Geophys. Res. Atmos. 127 (12), e2022JD036785. doi:10.1029/2022JD036785
Li, G., Yu, L., Liu, T., Jiao, Y., and Yu, J. (2022b). Modeling potential impacts on regional climate due to land surface changes across Mongolia Plateau. Remote Sens. 14 (12), 2947. doi:10.3390/rs14122947
Li, X., and Xiao, J. (2019). Mapping photosynthesis solely from solar-induced chlorophyll fluorescence: A global, fine-resolution dataset of gross primary production derived from OCO-2. Remote Sens. 11 (21), 2563. doi:10.3390/rs11212563
Li, Y., Wu, D., Yang, L., and Zhou, T. (2021). Declining effect of precipitation on the normalized difference vegetation index of grasslands in the inner Mongolian plateau. Appl. Sci. 11 (18), 8766. doi:10.3390/app11188766
Liang, S., Yi, Q., and Liu, J. (2015). Vegetation dynamics and responses to recent climate change in Xinjiang using leaf area index as an indicator. Ecol. Indic. 58, 64–76. doi:10.1016/j.ecolind.2015.05.036
Liu, G., Wu, X., Zhao, L., Wu, T., Hu, G., Li, R., et al. (2021b). Soil water content in permafrost regions exhibited smaller interannual changes than non-permafrost regions during 1986–2016 on the Qinghai-Tibetan Plateau. CATENA 207, 105668. doi:10.1016/j.catena.2021.105668
Liu, H., Gong, P., Wang, J., Clinton, N., Bai, Y., and Liang, S. (2020). Annual dynamics of global land cover and its long-term changes from 1982 to 2015. Earth Syst. Sci. Data 12 (2), 1217–1243. doi:10.5194/essd-12-1217-2020
Liu, X., Lai, Q., Yin, S., Bao, Y., Qing, S., Bayarsaikhan, S., et al. (2022). Exploring grassland ecosystem water use efficiency using indicators of precipitation and soil moisture across the Mongolian Plateau. Ecol. Indic. 142, 109207. doi:10.1016/j.ecolind.2022.109207
Liu, Y., Liu, R., and Chen, J. M. (2012). Retrospective retrieval of long-term consistent global leaf area index (1981–2011) from combined AVHRR and MODIS data. J. Geophys. Res. Biogeosciences 117 (G4), 2084. doi:10.1029/2012JG002084
Liu, Y., Yang, Y., Yue, X., Chen, X., and Liu, Y. (2023). Dynamic habitat indices and climatic characteristics explain species richness patterns on the Mongolian plateau. Remote Sens. 15 (4), 1092. doi:10.3390/rs15041092
Liu, Z., Dong, N., Zhang, H., Zhao, M., Ren, T., Liu, C., et al. (2021a). Divergent long-and short-term responses to environmental gradients in specific leaf area of grassland species. Ecol. Indic. 130, 108058. doi:10.1016/j.ecolind.2021.108058
Luo, M., Meng, F., Sa, C., Duan, Y., Bao, Y., Liu, T., et al. (2021). Response of vegetation phenology to soil moisture dynamics in the Mongolian Plateau. Catena 206, 105505. doi:10.1016/j.catena.2021.105505
Meng, F., Luo, M., Sa, C., Wang, M., and Bao, Y. (2022). Quantitative assessment of the effects of climate, vegetation, soil and groundwater on soil moisture spatiotemporal variability in the Mongolian Plateau. Sci. Total Environ. 809, 152198. doi:10.1016/j.scitotenv.2021.152198
Meng, M., Huang, N., Wu, M., Pei, J., Wang, J., and Niu, Z. (2019). Vegetation change in response to climate factors and human activities on the Mongolian Plateau. PeerJ 7, e7735. doi:10.7717/peerj.7735
Miao, L. J., Muller, D., Cui, X. F., and Ma, M. H. (2017). Changes in vegetation phenology on the Mongolian Plateau and their climatic determinants. Plos One 12 (13), e0190313. doi:10.1371/journal.pone.0190313
Miao, L., Li, S., Zhang, F., Chen, T., Shan, Y., and Zhang, Y. (2020). Future drought in the dry lands of Asia under the 1.5 and 2.0 C warming scenarios. Earth's Future 8 (6), e2019EF001337. doi:10.1029/2019EF001337
Natali, S. M., Schuur, E. A., and Rubin, R. L. (2012). Increased plant productivity in Alaskan tundra as a result of experimental warming of soil and permafrost. J. Ecol. 100 (2), 488–498. doi:10.1111/j.1365-2745.2011.01925.x
Peng, M., Han, W., Li, C., Li, G., Yao, X., and Zhang, M. (2021). Diurnal and seasonal CO2 exchange and yield of maize cropland under different irrigation treatments in semiarid Inner Mongolia. Agric. Water Manag. 255, 107041. doi:10.1016/j.agwat.2021.107041
Piao, S., Wang, X., Park, T., Chen, C., Lian, X., He, Y., et al. (2020). Characteristics, drivers and feedbacks of global greening. Nat. Rev. Earth 1 (1), 14–27. doi:10.1038/s43017-019-0001-x
Richardson, A. D., Keenan, T. F., Migliavacca, M., Ryu, Y., Sonnentag, O., and Toomey, M. (2013). Climate change, phenology, and phenological control of vegetation feedbacks to the climate system. Agric. For. Meteorology 169, 156–173. doi:10.1016/j.agrformet.2012.09.012
Ritchie, J. (1986). Climate change and vegetation response. Vegetatio 67 (2), 65–74. doi:10.1007/BF00037358
Sharkhuu, N., and Sharkhuu, A. (2012). Effects of climate warming and vegetation cover on permafrost of Mongolia. Ecol. problems livelihoods a changing world 6, 445–472. doi:10.1007/978-94-007-3886-7_17
Snyder, K., and Tartowski, S. (2006). Multi-scale temporal variation in water availability: Implications for vegetation dynamics in arid and semi-arid ecosystems. J. Arid Environ. 65 (2), 219–234. doi:10.1016/j.jaridenv.2005.06.023
Sugimoto, A., Naito, D., Yanagisawa, N., Ichiyanagi, K., Kurita, N., Kubota, J., et al. (2003). Characteristics of soil moisture in permafrost observed in East Siberian taiga with stable isotopes of water. Hydrol. Process. 17 (6), 1073–1092. doi:10.1002/hyp.1180
Tang, W. (2019). Dataset of high-resolution (3 hour 10 km) global surface solar radiation (1983-2018). Nat. Tibet. Plateau Data Cent. 11, 1905–1915. doi:10.5194/essd-11-1905-2019
Theurillat, J. P., and Guisan, A. (2001). Potential impact of climate change on vegetation in the European alps: A review. Clim. Change 50 (1), 77–109. doi:10.1023/A:1010632015572
Tong, S., Zhang, J., Bao, Y., Lai, Q., Lian, X., Li, N., et al. (2018). Analyzing vegetation dynamic trend on the Mongolian Plateau based on the Hurst exponent and influencing factors from 1982–2013. J. Geogr. Sci. 28 (5), 595–610. doi:10.1007/s11442-018-1493-x
Wang, G., Wang, P., Wang, T. Y., Zhang, Y. C., Yu, J. J., Ma, N., et al. (2019). Contrasting changes in vegetation growth due to different climate forcings over the last three decades in the selenga-baikal basin. Remote Sens. (Basel). 11 (4), 426. doi:10.3390/rs11040426
Wei, X., Wu, X., Wang, D., Wu, T., Li, R., Hu, G., et al. (2023). Spatiotemporal variations and driving factors for potential wind erosion on the Mongolian Plateau. Sci. Total Environ. 862, 160829. doi:10.1016/j.scitotenv.2022.160829
Wu, D., Zhao, X., Liang, S., Zhou, T., Huang, K., Tang, B., et al. (2015). Time-lag effects of global vegetation responses to climate change. Glob. Change Biol. 21 (9), 3520–3531. doi:10.1111/gcb.12945
Wu, T., Zhu, X., Wang, P., Adiya, S., Avirmed, D., Dorjgotov, B., et al. (2022). Climate warming in the Qinghai-Tibet Plateau and Mongolia as indicated by air freezing and thawing indices. Ecol. Indic. 138, 108836. doi:10.1016/j.ecolind.2022.108836
Yin, C., Luo, M., Meng, F., Sa, C., Yuan, Z., and Bao, Y. (2022). Contributions of climatic and anthropogenic drivers to net primary productivity of vegetation in the Mongolian plateau. Remote Sens. 14 (14), 3383. doi:10.3390/rs14143383
You, N., Meng, J., Zhu, L., Jiang, S., Zhu, L., Li, F., et al. (2020). Isolating the impacts of land use/cover change and climate change on the GPP in the Heihe River Basin of China. J. Geophys. Res. Biogeosciences 125 (10), e2020JG005734. doi:10.1029/2020JG005734
Zhang, Y., Wang, J., Wang, Y., Ochir, A., and Togtokh, C. (2022a). Land cover change analysis to assess sustainability of development in the Mongolian plateau over 30 years. Sustainability 14 (10), 6129. doi:10.3390/su14106129
Zhang, Y., Wang, Z., Wang, Q., Yang, Y., Bo, Y., Xu, W., et al. (2022b). Comparative assessment of grassland dynamic and its response to drought based on multi-index in the Mongolian plateau. Plants 11 (3), 310. doi:10.3390/plants11030310
Zhao, C., Yan, Y., Ma, W., Shang, X., Chen, J., Rong, Y., et al. (2021). RESTREND-based assessment of factors affecting vegetation dynamics on the Mongolian Plateau. Ecol. Model. 440, 109415. doi:10.1016/j.ecolmodel.2020.109415
Zhao, X., Hu, H. F., Shen, H. H., Zhou, D. J., Zhou, L. M., Myneni, R. B., et al. (2015). Satellite-indicated long-term vegetation changes and their drivers on the Mongolian Plateau. Landsc. Ecol. 30 (9), 1599–1611. doi:10.1007/s10980-014-0095-y
Zhou, X., Yamaguchi, Y., and Arjasakusuma, S. (2018). Distinguishing the vegetation dynamics induced by anthropogenic factors using vegetation optical depth and avhrr ndvi: A cross-border study on the Mongolian plateau. Sci. Total Environ. 616, 730–743. doi:10.1016/j.scitotenv.2017.10.253
Keywords: carbon dioxide concentration, climate change, gross primary production, leaf area index, land cover type, arid regions
Citation: Li C, Li L, Wu X, Tsunekawa A, Wei Y, Liu Y, Peng L, Chen J and Bai K (2023) Increasing precipitation promoted vegetation growth in the Mongolian Plateau during 2001–2018. Front. Environ. Sci. 11:1153601. doi: 10.3389/fenvs.2023.1153601
Received: 29 January 2023; Accepted: 18 April 2023;
Published: 09 May 2023.
Edited by:
Jie Wang, China Agricultural University, ChinaReviewed by:
Ping Wang, Chinese Academy of Sciences (CAS), ChinaWeiwei Zhang, Suzhou University of Science and Technology, China
Copyright © 2023 Li, Li, Wu, Tsunekawa, Wei, Liu, Peng, Chen and Bai. This is an open-access article distributed under the terms of the Creative Commons Attribution License (CC BY). The use, distribution or reproduction in other forums is permitted, provided the original author(s) and the copyright owner(s) are credited and that the original publication in this journal is cited, in accordance with accepted academic practice. No use, distribution or reproduction is permitted which does not comply with these terms.
*Correspondence: Xiaodong Wu, d3V4ZEBsemIuYWMuY24=
 Chuanhua Li
 Liangliang Li1,3
 Xiaodong Wu
 Atsushi Tsunekawa