 Jingjing Wang
 Faming Zhou1,3*
- 1Economic College, Hunan Agricultural University, Changsha, China
- 2Business College, Hunan University of Humanity, Science and Technology, Loudi, China
- 3Business College, Hunan First Normal University, Changsha, China
The integrated development of agriculture and tourism is conducive to the realization of agricultural ecological value, which will promote the green development of agriculture and improve the green total factor productivity of agriculture as well. Based on panel data in China from 2008 to 2019, the super-efficiency SBM method and the coupling coordination degree model were used to estimate the agricultural green total factor productivity (AGTFP) and the integration level of agriculture and tourism (ATL). The dynamic spatial Durbin model and threshold effect model were used to demonstrate the effects and characteristics of the agriculture and tourism integration on AGTFP. Results showed that: 1) During the study period, AGTFP and ATL increased steadily, and showed obvious spatial agglomeration characteristics; 2) The integration of agriculture and tourism will directly promote the improvement of AGTFP in the local region, and this impact has a spatial spillover effect. The direct effect in the central region in China is the strongest, and the spillover effect in the eastern region is the largest. 3) The influence of the agriculture and tourism integration on AGTFP was enhanced with the improvement of ATL, showing a threshold characteristic. From the perspective of subregion, the threshold value of ATL in the eastern region is the lowest, while the threshold value in the western region is the highest. The results of this study provide useful enlightenment for promoting the deep integration of agriculture and tourism and improvement of AGTFP so as to promote the green development of agriculture.
1 Introduction
Since the United Nations (UN) promulgated the Declaration on the Human Environment in 1972, most countries in the world have begun to pay general attention to the problem of agricultural pollution (UNEP, 2008). This is because it not only relates to the sustainable development of agriculture but also determines the wellbeing of all humanity. In 2019, the UN Food and Agriculture Organization (FAO) released a report entitled “The State of Land and Water Resources in the World’s Food and Agriculture Systems on the Verge of Collapse”. This indicated that the consumption and pollution of soil, land, and water had increased dramatically in the past ten years, and that it will be difficult to meet the food demands of nearly 10 billion people in the world in 2050 (Zhang et al., 2022). Therefore, the green and sustainable development of agriculture has attracted much attention across the world.
As a traditional agricultural country, China has made remarkable achievements in agriculture since the implementation of the reform and opening policy. Statistics show that China’s total grain production increased from 430.7 million tons in 2003 to 686.53 million tons in 2022—19 consecutive years of growth. However, in the process of China’s rapid agricultural modernization, problems such as excessive use of pesticides, irrational use of agricultural wastes, high consumption of fossil energy, and soil destruction have led to serious agricultural non-point source pollution and carbon emissions. According to the Second National Survey of Pollution Sources in 2021, chemical oxygen demand was 10.676 million tons, accounting for 49.77% of major pollutants discharged from agricultural production, while the amount of ammonia nitrogen was 1.415 million tons, accounting for 46.52% of major pollutants (Sun, 2022). Agricultural production has thus become a major source of pollution in China.
At the same time, as one of the world’s most populous developing countries, China must feed nearly 21% of the world’s population with only 9% of the world’s arable land. Against this background, China’s realization of green and sustainable agricultural development is a necessary choice to ensure food security and economic and social stability (Shen et al., 2019). Therefore, the central government of China has attached great importance to the green transformation of agriculture. In 2015, it first proposed the concept of green development. In 2017, the “No. 1 Document” of the Communist Party’s Central Committee proposed “promoting the green production mode and enhancing sustainable agricultural development ability.” In 2021, the Ministry of Agriculture and Rural Affairs formulated the 14th Five-Year Plan for National Agricultural Green Development, which clearly called for accelerating the establishment of a green, low-carbon, and circular agricultural industry system, the strengthening of the treatment of non-point agricultural source pollution, and the promotion of carbon reduction and sequestration in agriculture and in rural areas. Improving agricultural green total factor productivity (AGTFP) has become an important way of solving the dilemma of “resource–energy–environment–sustainable growth” in agriculture and of realizing agricultural green development. Therefore, the transformation of agriculture from extensive growth-driven factors to green growth driven by green total factor productivity has become a problem that must be solved for green agricultural development. Hence, it is of great significance to explore possible influencing factors for promoting AGTFP.
In recent years, promoting the integrated development of rural industries has been regarded as an important priority in the agricultural modernization of China. In 2015, the General Office of the State Council issued “Guiding Opinions on Promoting the Integrated Development of Primary, Secondary, and Tertiary Industries in Rural Areas”. As an important means of rural industrial integration, the integration of agriculture and tourism has been developing rapidly. According to data released by the Ministry of Agriculture and Rural Affairs, the number of agro-tourism operators, including leisure and sightseeing farms, had reached more than 300,000, and more than 7,300 farmer cooperatives were involved in leisure agriculture or rural tourism by the end of 2019. In addition, the scale of the agro-tourism market has also been expanding. In 2019, agro-tourism received 3.2 billion tourists and generated more than 850 billion yuan in revenue, the total number of agro-tourists accounted for 53.28% of the total number of visitors in the whole domestic tourism industry, and its operating revenue accounted for 14.83% of the total operating revenue of China's domestic tourism1. According to data from 1,000 key rural tourism villages in China in 2022, the average contribution of agro-tourism integration to rural employment was 47.1%, and other indicators of promoting infrastructure construction were also prominent.
Agro-tourism activities are deeply affected by agricultural ecological resources, which are the prerequisite of integration (Van Zyl and Van Der Merwe, 2021). When the potential of agro-ecological resources is realized through the development of agro-tourism products, agricultural producers will then be encouraged to practice green and environmentally friendly production methods and reduce harmful inputs (Koscak, 1998; Lupi et al., 2017). In the process of integration, vertical correlation is formed between the agricultural and tourism industries, which promotes the spillover of knowledge, technology, and management among industrial-related operations (Jiang, 2022). Meanwhile, the extension of the industrial chain and the integration of the value chain also optimize the allocation of agricultural production factors, such as agricultural labor and land resources. Consequently, the efficiency of agricultural output will increase. The integrated development of agriculture and tourism, in turn, has a positive impact on agricultural green development.
Compared with other industries, cross-regional operation is an important feature of the tourism industry because of its strong mobility. China’s vast territory and distinct regional variations in crop growth cycles make it possible to operate cross-regional agro-tourism. At the same time, cross-regional operations are beneficial for expanding market scale and further deepening the vertical division of labor in the whole agricultural system so that it can realize economies of scale (Pitrova et al., 2020). In addition, the seasonal nature of crop production enhances the mobility of agro-tourists, thus promoting the efficiency of information and technology exchange between regions. Therefore, the impact of agro-tourism integration on agricultural green development may have a spillover effect.
In the process of the integration of agriculture and tourism, agriculture’s ecological premium is realized. However, in the early stages of this integration, the agricultural ecological premium is not so high so that agricultural production is mostly carried out in traditional production modes (Hu and Zhong, 2019). At this stage, agricultural production mainly aims at improving agricultural production efficiency and rarely actively reduces the input of harmful environmental factors such as fertilizers and pesticides. Therefore, the promotion effect of low-level integration on AGTFP is not so significant. With more in-depth development of this integration, agriculture’s ecological premium will be more fully realized (Jiang, 2022). This can encourage agricultural producers to reduce harmful inputs and to adopt green production methods. They will thus pay increasing attention to the green and sustainable development of agriculture to obtain a higher agricultural–ecological premium. Therefore, increased agriculture and tourism integration has an enhanced positive effect on AGTFP.
Existing studies have paid little attention to the impact of agriculture–tourism integration on the green development of agriculture. There are few empirical studies on the effect of agriculture and tourism integration on AGTFP, especially on its spillover and non-linear effects. Therefore, the main purposes of this paper are to 1) assess the level of agricultural green total factor productivity (AGTFP) accurately, based on the super efficiency SBM method with provincial data from China; 2) measure the integration level of agriculture and tourism (ATL) with the coupling coordination degree model to better identify the linkage of agriculture and tourism; 3) demonstrate the spillover and non-linear effects of agriculture–tourism integration on AGTFP based on the dynamic spatial model and threshold model respectively; 4) propose specific policy recommendations for improving agriculture–tourism integration to promote AGTFP. The study also makes more marginal contributions. First, it demonstrates the impact of the integration of agriculture and tourism on AGTFP with empirical analysis, providing a new perspective for exploring factors which may affect agricultural green development. Second, it focuses on the environmental effect of agriculture–tourism integration—while most studies concern its economic impacts—and thus expands the scope of research on the effect of this integration. Third, the spatial spillover and non-linear effects of agriculture–tourism integration on AGTFP are demonstrated by using the dynamic spatial Durbin and dynamic threshold models, which can more scientifically reveal the impact of agriculture–tourism integration on AGTFP. Additionally, the dynamic characteristics of AGTFP are considered in the estimation of the impact of agriculture–tourism integration on AGTFP, thus effectively avoiding the endogeneity problem.
The remaining parts of this paper are structured as follows. Section 2 reviews the literature on agro-tourism integration and AGTFP and also constructs a theoretical framework. Section 3 provides model selection, variable measures, and data descriptions. Section 4 presents the empirical results and discusses them in detail. Finally, this paper proposes precise policy implications for promoting AGTFP based on the results of the empirical analysis.
2 Literature review and theoretical framework
2.1 Literature review
2.1.1 The integration of agriculture and tourism
There is a strong linkage between tourism and agriculture (Ammirato et al., 2020). Tourism activities create a demand for tourism products, thus determining the production of agricultural products and food in the process of tourism consumption (Ristić et al., 2019). On the other hand, agricultural production processes and seasonal characteristics affect the content of tourism supply (Sanches-Pereira et al., 2017; SoleimannejadAlibaygi and Salehi, 2021). Given the strong linkage between tourism and agriculture, increasing attention has been given to agriculture–tourism integration (Gilbert and Hudson, 2000; Streifeneder, 2016; Ristić et al., 2019). Based on symbiosis theory, Chen (2014) argued that the integrated development of tourism and agriculture is the internalization of the inter-industry division of labor and the sharing of products, markets, and resources by the two industries, thus realizing their developing symbiosis. Nie and Fan (2019) argued that such integration is a process in which the internalization is the inter-industrial division of labor and the sharing of products, markets, and resources, and that it is driven by market demand, economic growth, and competition.
Increasing attention has been paid to the impact of the integrated development of agriculture and tourism on the rural economy, society, and the environment. In terms of its economic effects, research has found that establishing effective links between agriculture and tourism not only leads to new market space and consumer demand but also promotes high-quality tourism and agricultural products (Tew and Barbieri, 2012; Testa et al., 2019). Although the agricultural products required by tourism are only a small part of total agricultural productivity, they still play a key role in ensuring the quality of these products (Valdivia and Barbieri, 2014). Many scholars have empirically tested the effect of agriculture–tourism integration on rural and regional economic growth (Van Sandt and Thilmany Mcfadden, 2016). In terms of its social effects, they argue that the development of agro-tourism can provide economic incentives and stability for farmers and improve the quality of life of rural populations in mountainous areas, thus meeting challenges of population migration and economic change (Dax et al., 2019). This is also conducive to strengthening urban–rural links and preserving natural and cultural heritage (Streifeneder, 2016). In terms of its environmental effects, scholars hold different views on the ecological effect of agriculture–tourism integration. Some argue that tourism provides agriculture with another source of income, which is conducive to sustainable agricultural development. The development of agro-tourism draws part of the agricultural labor force and provides funds for farmers to adopt innovative technologies such as fertilizers, allowing them to expand production without increasing tillage frequency or clearing new land to indirectly reduce environmental degradation (Guaita Martínez et al., 2019). However, drawing labor from agriculture may also lead to a loss of farmers with land management skills, leading to deterioration in the agricultural ecological environment (SoleimannejadAlibaygi and Salehi, 2021). Overall, above studies have come to opposite conclusions, so whether the integration of agriculture and tourism can promote AGTFP needs to be further verified.
2.1.2 Agricultural green total factor productivity
The sustainable and high-quality development of agriculture depends, on one hand, on the continuous increase of labor, machinery, equipment, land, and other factors of production, and on the improvement of the efficient use of production factors on the other hand. Agricultural total factor productivity is one of the main indicators for measuring the efficiency of production factors. As environmental pollution becomes more and more serious, the addition of environmental and resource factors to the traditional agricultural total factor productivity framework has become an academic research hotspot, begetting the concept of agricultural green total factor productivity (AGTFP). Research on AGTFP is mainly done into the following aspects.
The DEA and SFA methods are widely used for the measurement of AGTFP (Adetutu and Ajayi, 2020; Chen et al., 2021; Wang et al., 2023). Compared with SFA's parametric method, DEA is non-parametric, does not need specific production functions and inefficiency items in advance, and is less subject to subjective influence (Gong, 2020). Emrouznejad and Yang (2018) reviewed the literature from 1978 to 2016 and found that DEA has high applicability in measuring agricultural production efficiency. In the early literature, angular and radial DEA models were used to measure agricultural total factor productivity, which required the selection of input or output angles of the model and required these to change in the same proportion, which was inconsistent with actual production. To avoid this problem, the slacks-based measurement (SBM) model proposed by Tone (2001) was used to evaluate AGTFP. However, when there are more than two effective units in the same period, the SBM standard efficiency model cannot sort them. So Tone (2002) further proposed the super efficiency SBM model. When considering undesirable outputs, the SBM super efficiency model incorporating undesirable output is commonly used to measure AGTFP.
With the improvement of AGTFP measurement methods, scholars began to pay attention to the influencing factors of AGTFP. According to Sheng et al. (2020), agricultural economic development level, agricultural production structure, and agricultural technology levels are important factors affecting AGTFP (Sheng et al., 2020). Regional characteristics also affect the growth of AGTFP. Gao and Niu (2018) observed that different regional economic development factors in China lead to regional differences in AGTFP. Other studies have found that agricultural tax reduction (Liang and Long, 2015), rural financial development (Li, 2021), environmental regulation (Huang et al., 2021), and agricultural informatization (Gao and Niu, 2018) can promote AGTFP, while urbanization and agricultural trade could inhibit it (Liang and Long, 2015). However, few studies have analyzed the factors that influence AGTFP from the perspective of industry integration. Only Wang et al. (2022) have tested the linear influence of agro-tourism industry agglomeration on AGTFP, but without considering the possible spatial spillover and non-linear characteristics of this influence.
2.2 Theoretical framework
The integration of agriculture and tourism refers to the process of developing agricultural tourism resources and managing agricultural tourism products by relevant stakeholders to maximize economic, social, and ecological effects under certain rural economic and social backgrounds. Therefore, the integration of agriculture and tourism not only plays a role in promoting the development of the rural economy but also has an impact on improving AGTFP, which is mainly reflected in the following aspects (Figure 1).
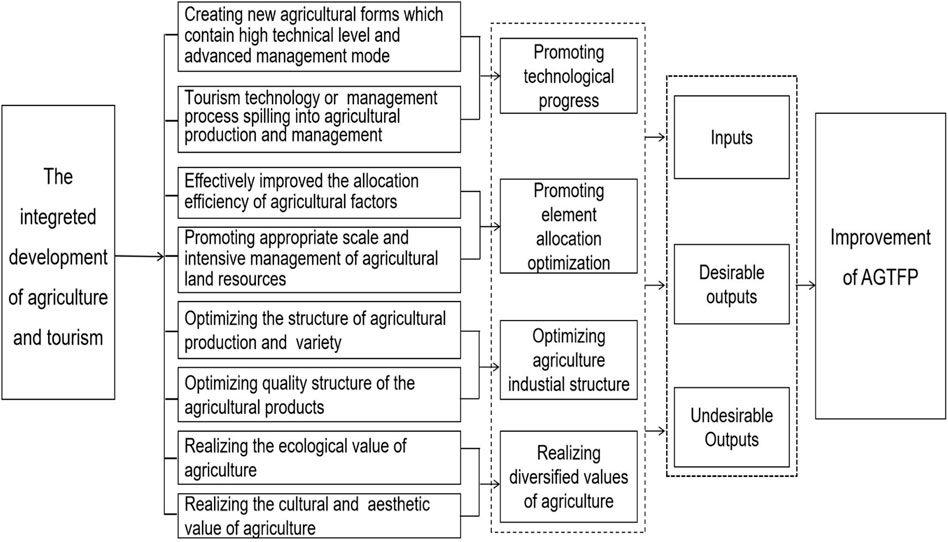
FIGURE 1. Impact mechanism of agriculture–tourism integration on improving AGTFP.
First, this integration promotes progress in agricultural technology. Agriculture–tourism integration promotes the spatial agglomeration of business units and promotes the flow of talent and technological interaction. Advanced technology and management experience in tourism enterprises also share their knowledge, technology, and management skills with related or cooperative agricultural operation subjects so that the technical level of agricultural production and operation can be improved (Ristić et al., 2019).
Second, the integration promotes optimal resource and element allocation. Under traditional agricultural management, the function of agricultural resources and products is relatively simple, and the application scope is relatively narrow. The allocation framework of agricultural factors is mainly reflected in the level of limited capital, abundant land, and primary labor resources, which makes for a relatively inefficient allocation of agricultural production factors. In the process of agriculture–tourism integration, the capital, technology, talents, information, and management elements of the two industries realize a market-oriented flow and full interaction, thus promoting a higher optimal allocation of various production factors and effectively improving the allocation efficiency of agricultural factors (Fleischer and Tchetchik, 2002; Ammirato et al., 2020).
Third, this integration promotes the optimization and upgrading of the agricultural industrial structure. The integral development of agriculture and tourism has enriched the development of rural tourism and created a large number of rural tourism products or service formats with rich content (Hsu et al., 2013). For example, a variety of new business formats have appeared in practice, such as national agricultural parks, leisure farms, rural camps, rural museums, citizen agricultural parks, and rural homestays. Driven by demand, the adjustment of the allocation of agricultural production factors has led to the optimization of the quality and variety of the agricultural production (Amsden and McEntee, 2011).
Fourth, integration contributes to the realization of diversified values of agriculture, resulting in increased agricultural output. It is helpful to expand the tourism function of agricultural resources and promote appreciation of the value of agricultural products, the natural ecology, and human resources as tourism products (Fleischer and Tchetchik, 2002). Therefore, the integration of agriculture and tourism effectively expands income growth in agricultural production and management activities. Moreover, agriculture–tourism integration contributes to the cultivation of agricultural products and regional brands, thus enhancing the popularity and reputation of agricultural products; this plays an important role in enhancing the added value of agricultural product sales (Pillay and Rogerson, 2013).
Accordingly, we propose the following research hypothesis: “The integrated development of agriculture and tourism has a positive effect on the improvement of AGTFP.”
3 Methods and materials
3.1 The Super-SBM method
The super efficiency SBM model (super-SBM) is used in this study to calculate China's AGTFP. Compared with the radial and angular DEA and SBM models, super-SBM can effectively evaluate and rank multiple fully effective decision units (Tone, 2002). Here, 360 decision-making units (DUS) from 30 provinces from 2008 to 2019 were used. If the kth decision unit (j = 1, 2,
where λ is the weight vector, and
3.2 The coupling coordination degree model
In an open industrial system, different industries may lead to industrial coupling due to resource complementarity, which makes the industrial system evolve toward an advanced and orderly state (Nie, 2019). Chen (2014) believes that although the concepts of industrial coupling and industrial convergence are different, industrial coupling reflects the dynamic process of gradual integration between industries, while industrial convergence reflects the internal interaction and correlation between industries. However, the two have the same effect and the deep-level theories are similar. Many scholars use the coupling coordination degree model (CCDM) to evaluate the degree of industrial integration. For example, Su (2020) used it to measure the integration level of producer services and manufacturing in China from 2005 to 2018. Xu and Chen (2020) built an evaluation index system of coupling coordination for the development of the sports and tourism industries based on CCDM and discussed the comprehensive level and coupling coordination degree of these industries in 31 provinces in mainland China. Wang (2018) calculated the integration degree of agriculture and tourism based on this model. In general, CCDM has good applicability and is also used to construct the integration level measurement model of the agriculture and tourism industries in this study. The construction process of the CCDM for the agriculture and tourism industry is as follows:
① Standardize the data of the evaluation index:
② Calculate the information entropy:
Define the weight of the jth indicator as
③ Calculate the development level of the agriculture and tourism industries. The agricultural comprehensive evaluation function was determined and established according to the linear weighting method:
In Formula 6, j is the number of evaluation indexes of agricultural development level, wj is the weight of indexes, and Mij is the standardized value of the jth agricultural index in the ith year. The higher the value of A(x), the higher the level of comprehensive agricultural development will be, and vice versa. Similarly, the comprehensive evaluation function of tourism industry is established
The interpretation of each indicator in Formula 7 is similar to that in Formula 6. The larger the value of T(y), the higher the development level of tourism will be, and vice versa.
④ The CCDM of agriculture and tourism industry is established as follows:
In Formula 10, C is the coupling degree, C ∈ [0,1]. The greater the value of C, the more ideal the degree of the integration of the two industries will be, and vice versa. The coupling degree C only reflects the interaction and cross state of the agriculture and tourism industries and cannot accurately reflect their actual integration and development level. In order to avoid the illusion that the development level of the two subsystems is not high but the coupling degree of them is, the coupling coordination degree U is used to represent the integration level of agriculture and tourism (ATL). The larger the U value, the better the coupling coordination will be. Generally speaking, the greater the value of coupling coordination degree, the higher the degree of integration between industries will be (Su, 2020). In Formula 9, β and γ are undetermined coefficients, and D is the comprehensive coordination index of the agriculture and tourism industries. In view of the interactional relationship between the agriculture and tourism industry system in the process of integration, this paper follows the view of Wang (2018), making β = γ = 0.5.
3.3 Empirical models
3.3.1 The spatial econometric model
3.3.1.1 Global Moran’s I Index
According to the first law of geography, regional economy is an open system. There are various kinds of material and immaterial connections between regions, which lead to mutual influence and interdependence among regions, thus leading to mutual influence and interdependence. The economic growth of a region no longer only depends on its initial conditions but also closely on the economic activities of neighboring regions (Mitchell et al., 2012). Therefore, an analysis of the impact of agriculture–tourism integration on AGTFP without considering spatial factors may lead to biased results and even overestimate the impact. Whether it is necessary to introduce spatial effect into the regression model depends on the existence of spatial correlation of economic variables. Whether there exist spatial effects among economic variables can be examined by the global Moran’s I index, which is defined as
In the aforementioned formula, Yi and Yj represent the observed value of the integration level of agriculture and tourism (ATL) or agricultural green ecological efficiency (AGTFP) in region i and j, respectively. Wij is the spatial weight matrix. The value of Moran’s I index belongs to [−1, 1]. When the index is greater than 0, it indicates that Y has a positive spatial correlation. When the index is less than 0, it has negative spatial correlation. Otherwise, there is no spatial correlation.
3.3.1.2 The Dynamic Spatial Durbin Model
Spatial models mainly include spatial lag models (SLMs) and spatial error models (SEMs) (Anselin, 1998). If both the explained and the explanatory variables are spatially dependent, it is the spatial Durbin model (SDM). In view of the spatial dependence of the explained variable AGTFP and explanatory variable ATL, the spatial Durbin model is constructed in this study. Because AGTFP is also affected by the previous phase state, the term lagging one stage (AGTFPi,t-1) is included in the equation, which can effectively solve the endogenous problem of the model. The dynamic spatial Durbin model is constructed as follows:
In the aforementioned formula, AGTFPit and Xit represent the explained and the explanatory variables (including control variables) respectively. The subscripts i and t denote the province and year, respectively. ρ is the spatial correlation coefficient, and Wij is the spatial weight matrix. τ, β,
3.3.2 The dynamic panel threshold model
With the continuous deepening of agriculture–tourism integration, the ecological premium of agriculture will be fully realized, further strengthening the green production behavior of producers and thus further improving AGTFP. The influence of agricultural and tourism integration on AGTFP may be enhanced with the improved integration. Therefore, the influence of agriculture–tourism integration on AGTFP may have a non-linear relationship, so we take ATL as the threshold variable to test this non-linear relationship. As well as considering that AGTFP has the characteristics of dynamic persistence, this paper included AGTFP with one stage lag as an explanatory variable. Due to the lack of mature methods to combine the spatial econometric model and the threshold regression model, the common dynamic panel threshold regression model is finally established thus:
Among these,
3.4 Variable selection
3.4.1 Explained variable
When the super-SBM model is used to calculate the AGTFP considering undesirable output and expected output, the undesirable output and the input indexes should be determined first.
(1) Input indicators. According to Guo and Liu (2021), a measurement system of agricultural input indicators integrating “resources, energy, environment, and economy” must be constructed (Table 1). As for the importance of variable indicators, the entropy weight method is adopted to assign weights to all indicators to reflect the importance of the indicators. Agricultural input factors include labor, land, capital, water resources, and electrical energy, which are the necessary conditions for agricultural development. Labor input is measured by the number of people employed in agriculture, forestry, husbandry, and fisheries at the end of the year. Land input is measured as the sum of the crop-sown area and aquaculture area. The selection of capital input variables differs from the existing literature, which mainly considers the radial and non-radial relationships between agricultural input and output. Chemical fertilizer, machinery, pesticides, agricultural film, and diesel oil are selected as capital inputs. Compared with the existing literature, draft animals were not included because the sample study period of this study was 2008–2019 after the cancellation of agricultural subsidies by the United Nations. During this period, the agricultural mechanization level was gradually improved, which had a strong substituting effect on draft animals. Water resource input is measured by total agricultural water use. Agricultural electricity consumption represents the input of electrical energy.
(2) Output indicators. The desirable output indicator is represented by the total output value of agriculture, forestry, husbandry, and fisheries and is adjusted to 2008 prices. Agricultural undesirable outputs mainly refer to various environmental pollution emissions, including chemical oxygen demand in water, total nitrogen and total phosphorus loss, carbon dioxide emissions in agricultural production, and ineffective pesticide utilization and agricultural film residues in soil. Among these, water pollution and soil pollutant residues were calculated by unit investigation and evaluation method (Chen et al., 2006). In addition, in order to adapt to the required ratio between the input–output index and the decision-making unit of the DEA model, this paper combined the variables of water and soil pollution into the comprehensive index of agricultural pollution by using the entropy weight method based on Jiang and Wang, (2019). At the same time, in order to further consider the greenhouse gas emissions caused by various production factors in agricultural production, the carbon emissions of four agricultural production activities that lead to agricultural carbon emissions were calculated according to West and Marland (2002). In this paper, the agricultural pollution composite index and agricultural carbon emissions treated by the entropy weight method are included in the super-SBM model as non-expected output to measure AGTFP. All indicators for measuring AGTFP are shown in Table 1.
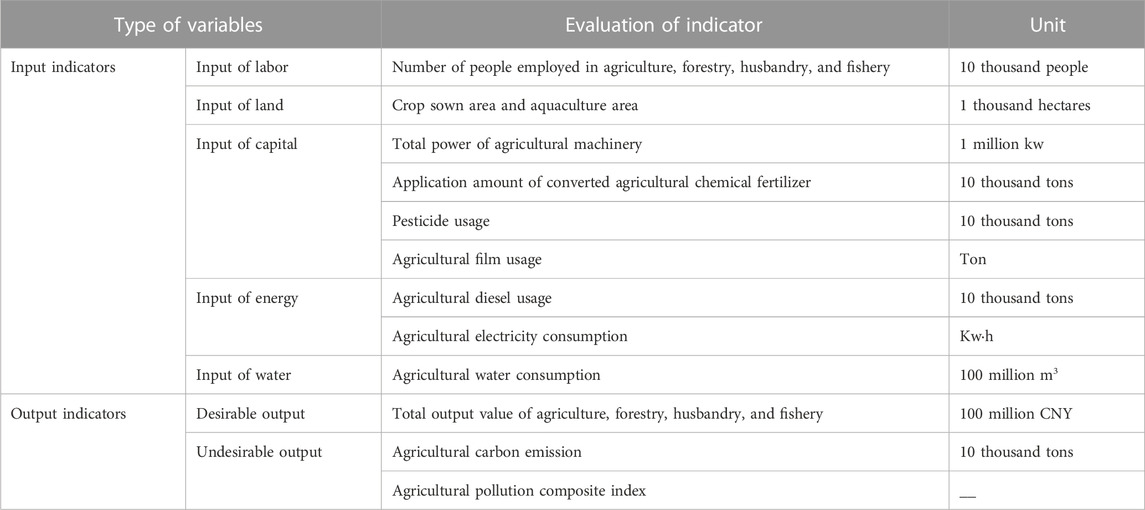
TABLE 1. Measuring indicators of AGTFP.
3.4.2 Explanatory variable
As discussed in the literature review, the integrated development of agriculture and tourism refers to the process of forming a distinctive brand of agriculture and tourism based on a certain theme or regional characteristics of agricultural resources in combination with agricultural resource endowment. Characteristic agricultural tourism brands such as agricultural tourism towns, key tourism villages, leisure agriculture, and rural tourism demonstration counties formed around agricultural geographic indication products can best reflect the characteristics and elements of the integrated development of agriculture and tourism. Therefore, this study used published data that can represent the development level of the agricultural tourism industry to replace the general indicators in the statistical yearbook, such as tourism income and agricultural output value, so as to make the measured integration level of agriculture and tourism more targeted and reasonable. Based on Yang et al. (2022), five indicators were selected to measure the development level of characteristic agriculture and another five to measure the development level of rural tourism. All indicators are shown in Table 2.
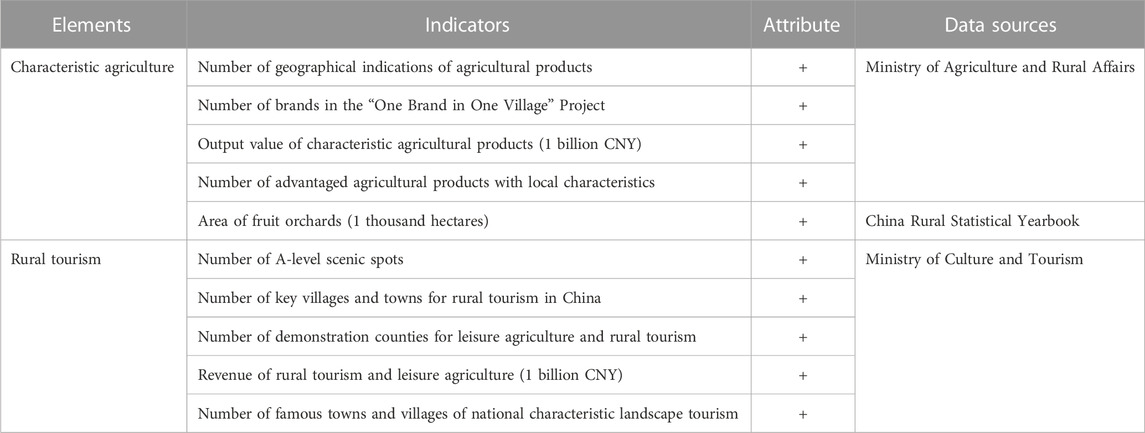
TABLE 2. Indicators for measuring the integration level of agriculture and tourism.
3.4.3 Control variables
Since many other factors affect AGTFP, this paper selected several control variables to alleviate, as much as possible, the endogeneity problem caused by missing variables: 1) Agricultural industrial structure (AIS), expressed as the proportion of the added value of the plantation industry in the added value of agriculture, forestry, animal husbandry, and fishery. Generally speaking, the higher the proportion of the planting industry, the higher the degree of agricultural production agglomeration—AIS is thus expected to have a positive impact on AGTFP. 2) Income distribution (INC), expressed as the ratio of urban per capita disposable income to rural per capita net income. The greater the income gap between urban and rural residents often means that a regional government does not pay enough attention to agricultural development, or that agricultural resource endowment is poor. Moreover, in order to increase income, agricultural producers will choose to ignore the externalities in the process of agricultural production. Therefore, the impact of income distribution on AGTFP may be negative. 3) Trade dependency (TRD), expressed as the ratio of the total amount of regional agricultural imports and exports to the gross agricultural product. The agricultural trade situation will affect the regional AGTFP by affecting the income of agricultural producers and the agricultural production environment; the direction of its influence is unknown. 4) Disaster-affected degree (DIS) is expressed by the proportion of a disaster-affected area in a total sown area of crops. Generally speaking, the higher the degree of disaster, the greater the damage to farmers’ income and the production environment, which is expected to negatively affect AGTFP. 5) The educational level of the labor force (EDU) is represented by the average years of schooling based on the practice. By using the calculation method of Liu and Xu (2010), the average years of schooling for residents with primary, middle, high, secondary, and tertiary education were set as 6, 9, 12, and 16 years, respectively. Thus, EDU = prim × 6 + midd × 9 + high × 12 + univ × 16, where prim, midd, high, and univ represent the proportion of residents with education above primary, middle, high, and university in the population aged 6 and above in the region, respectively. Generally speaking, the higher the educational level of agricultural producers, the more beneficial this will be to mastering production skills and the rational use of chemical factors; thus, EDU will theoretically have a positive effect on AGTFP. All relevant variables and their descriptions are shown in Table 3.
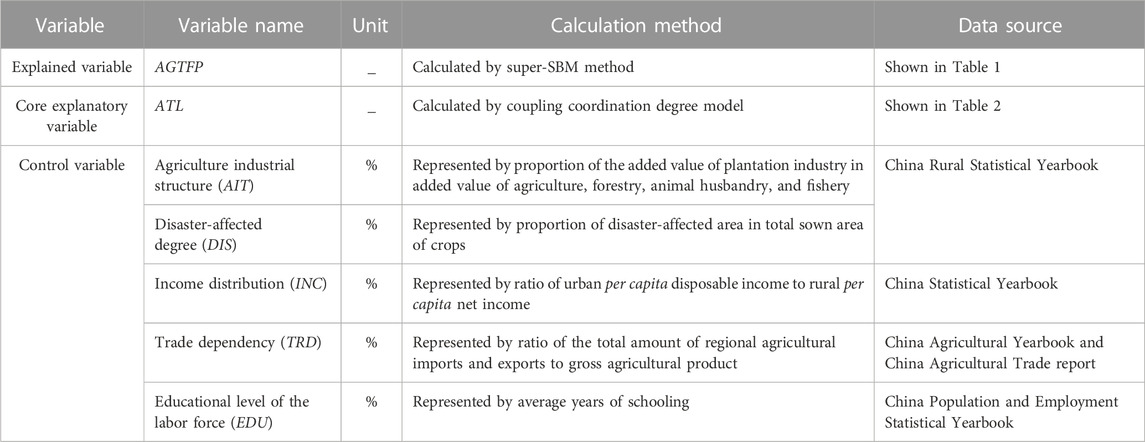
TABLE 3. Relevant variables and descriptions.
3.5 Data sources and descriptive statistics
The empirical analysis is based on panel data from 30 provinces in China from 2008 to 2019. Hong Kong, Macao, Taiwan, and Tibet Autonomous Region are excluded due to missing data. Since the beginning of 2020, the tourism industry has been significantly impacted by the COVID-19 epidemic. Therefore, data from 2020 to 2022 are not considered in the study period. The data sources are mainly drawn from China Rural Yearbooks, the China Statistical Yearbook, and the China Tourism Statistical Yearbook. In addition, the National Bureau of Statistics, the Ministry of Culture and Tourism, the Ministry of Agriculture, and official provincial websites are used as supplementary sources of data. All data measured in monetary units are deflated based on constant price levels of 2008. R and GeoDa software were used for quantitative analysis and model estimation. The results of descriptive statistics for each variable are shown in Table 4.
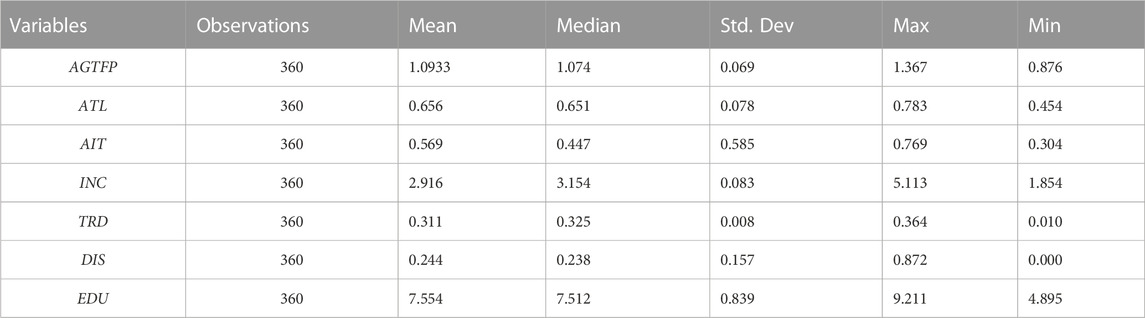
TABLE 4. Description of variables in the specification model.
3.6 Characteristics of AGTFP and ATL in China
According to results of super-SBM to calculate AGTFP, the change trend of annual mean AGTFP in 30 provinces and four regions from 2008 to 2019 is shown in Figure 2. The annual mean of AGTFP in the whole region fluctuated roughly between 0.967 and 1.235 from 2008 to 2019, reaching its maximum in 2019. In recent years, the central government has attached great importance to environmental protection and targeted agricultural pollution. Governments at all levels have thus formulated a series of control measures to effectively promote agricultural clean production technology. Overall, China’s AGTFP showed an upward trend from 2008 to 2019, with an average annual growth rate of 2.26%. For four different regions, AGTFP is greater than 1 in most years. The average annual growth rates of AGTFP in the eastern, central, western, and northeastern regions during the study period were 2.06%, 2.31%, 2.53%, and 2.10%, respectively. The growth rate of AGTFP in the western region is higher than in other regions, which may be due to the long-term undeveloped level of agricultural production there. In recent years, with the introduction of advanced green production technology, AGTFP in this region has rapidly grown.
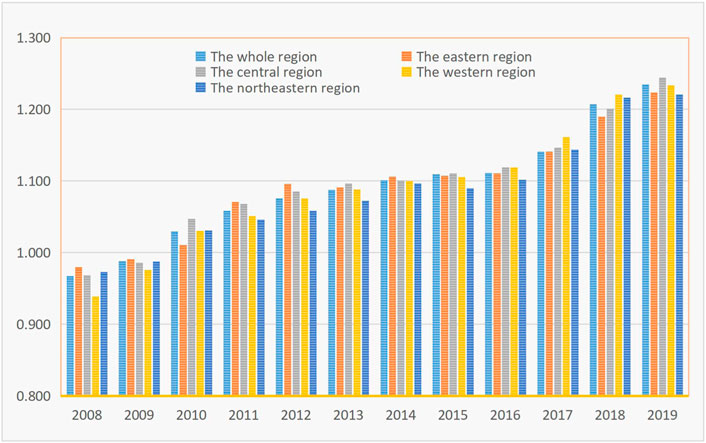
FIGURE 2. Development trend of AGTFP in China from 2008 to 2019.
Meanwhile, ATL was measured with panel data based on the coupling coordination degree model. Results show that the mean value of ATL in eastern China is the highest, while the mean value of ATL in western and northeastern China is relatively lower among the four regions (Table 5). From Table 5, we can see that the average of ATL in the eastern region is the highest among all regions over the study period. The annual average of ATL of the whole research region continuously improved over time, with average annual growth rates of 2.14%. The average annual growth rates of ATL in eastern, central, western, and northeastern regions during the study period were 1.83%, 2.29%, 1.97%, and 2.22%, respectively. The growth rate of ATL in the central region is higher than in other regions. The integration of agriculture and tourism is an important form of rural industry integration that can promote rural economic growth and rural revitalization. Thus, it is also strongly supported by the government. With the strong support of an integrated development policy, the integration level of agriculture and tourism in different regions showed an obvious growth trend.
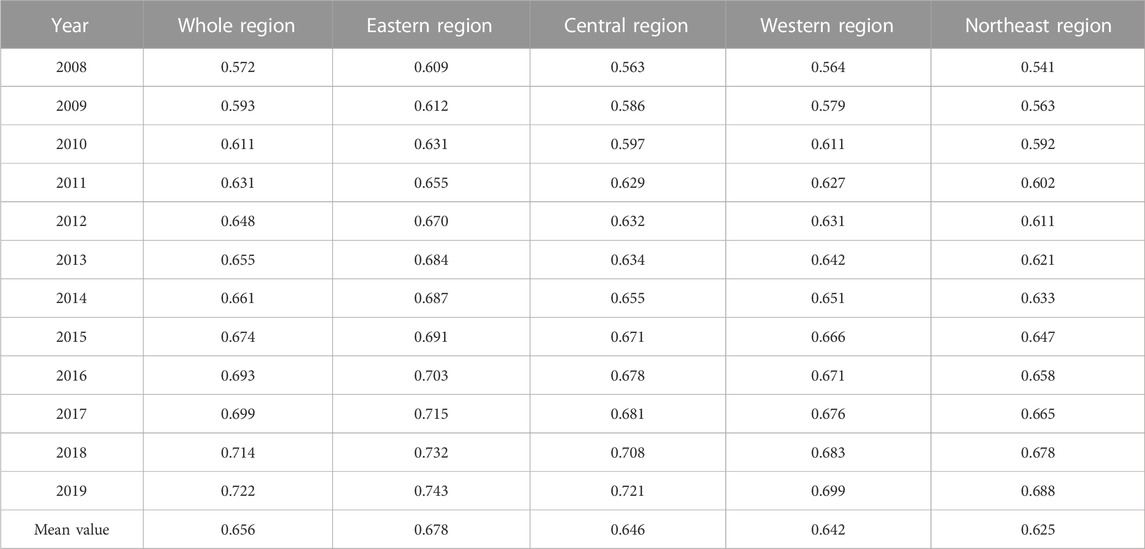
TABLE 5. Change trends of annual average of ATL in different regions.
4 Results and discussion
4.1 Results of spatial Durbin model and analysis
4.1.1 Global spatial autocorrelation analysis
From Table 6, it can be seen that the global Moran’ I values of ATL and AGTFP over the years are positive, and all pass the significance test, indicating that ATL and AGTFP have significant spatial correlation. From the perspective of time, the mean values of the global Moran’ I values of ATL and AGTFP basically increased year by year. It can be concluded that the spatial agglomeration trend of the integrated development of agriculture and tourism and the green development of agriculture are constantly strengthening.
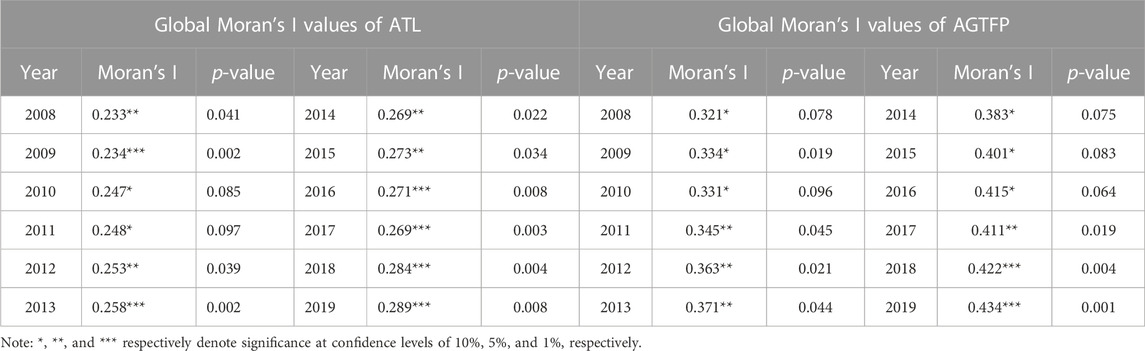
TABLE 6. Global Moran’s I values of ATL and AGTFP 2008–2019.
4.1.2 Identification of spatial models
First, the multi-collinearity and stationarity of variables were tested. Variance inflation factor (VIF) results show that the maximum value of variable VIF is less than 6, with no multi-collinearity. According to Im et al. (2003), LLC, Fisher-ADF, and PP-Fisher are used to test the stationarity of the time series, with the results showing that the null hypothesis was rejected at the significance level of 5%, and that the original series is stationary.
Second, the optimal form of the spatial panel model is identified. The aforementioned spatial auto-correlation test shows that both AGTFP and ATL have strong spatial correlation characteristics, so spatial factors should be considered when studying the relationship between them. We then followed the “two-step method” proposed by Elhorst (2003) to determine the appropriate spatial econometric model. The first step was to judge whether the non-spatial panel model is applicable. LM test results show that the SEM and SAR models are applicable because the test statistics of LM-lag, robust LM-lag, LM-error, and robust LM-error all passed the significance test, indicating that the null hypothesis that SPM or SEM do not exist can be rejected. In the second step, Wald and LR statistics were combined to determine which spatial econometric model to use. The results show that both Wald and LR statistics passed the significance test, indicating that SDM cannot be simplified into SLM and that it is more reasonable to use SDM to fit sample data. The aforementioned test results of the panel econometric model based on the geographical distance spatial weight matrix (W1) are shown in Table 7. The Hausman test rejects the null hypothesis at the 1% level; in order to avoid the influence of unobserved time changes on the estimation results, the spatio-temporal dual-fixed SDM was finally selected for empirical analysis.
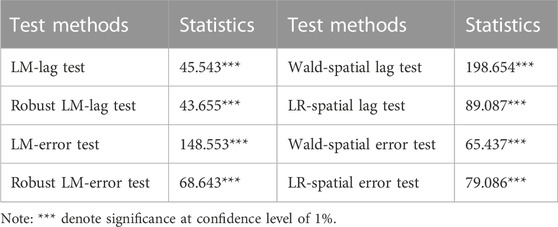
TABLE 7. Test results of spatial models.
4.1.3 Results of spatial models
Based on different spatial matrices, the regression results for the static and dynamic spatial Durbin models are shown in Table 8. In all four models, ATL has a significantly positive effect on AGTFP, indicating that the estimation model is robust and reliable. In terms of the fitting degree R2 of the model, the fitting degree of the dynamic spatial Durbin model is higher than that of the static spatial Durbin model, indicating that the dynamic spatial Durbin model is more ideal. This is mainly because the static spatial Durbin model does not consider the dynamic effect of AGTFP in the process of regression, which will also lead to estimation errors. In the regression results of the dynamic spatial panel model, the coefficients of AGTFPi,t-1 are positive and pass the significance test of 1%, which fully indicates that AGTFP has a significantly dynamic effect. Agricultural production is a continuous and dynamic economic system, and input and accumulation in its early stage will inevitably be reflected in economic development, technical level, human capital quality, and other factors, which will directly affect the agricultural production activities of this and the following periods.
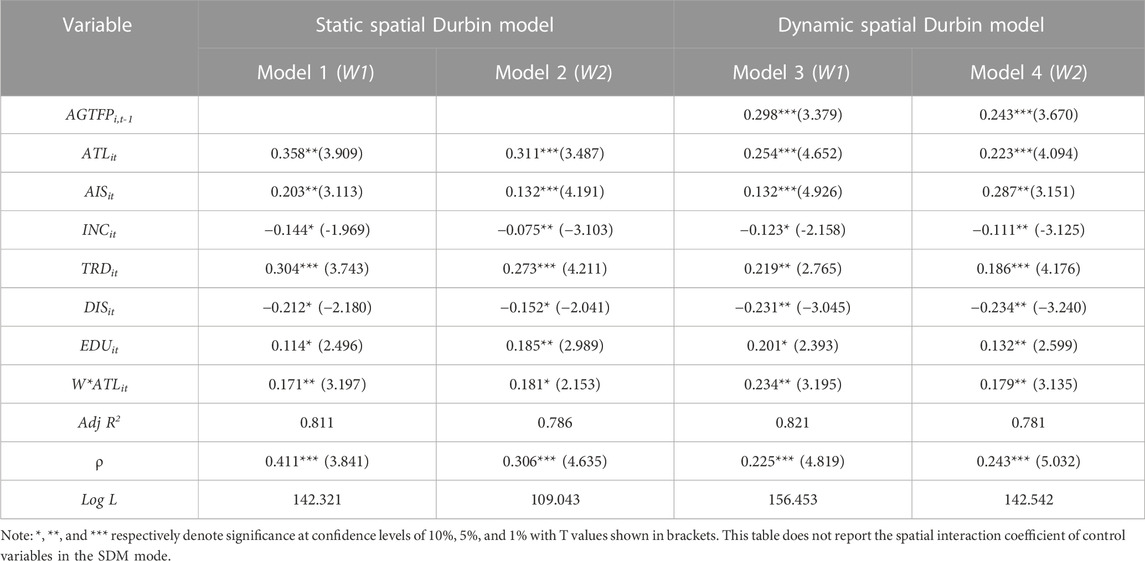
TABLE 8. Estimation results of spatial Durbin model.
The dynamic spatial Durbin model based on the geographic distance matrix has the highest degree of fitting, so we mainly analyze the regression results of Model 3 in Table 8. The coefficient of ATL is 0.254 (significant at the confidence level 1%), indicating that agriculture–tourism integration has a positive impact on AGTFP. The integrated development of agriculture and tourism always adheres to the “agriculture-oriented” principle and the ecological development concept, taking agriculture and rural areas as the basic support. The process of integration promotes the intensification, clean production, and management of agriculture, ultimately promoting AGTFP. The coefficient of ATL is significantly lower than that of the static space Durbin model, indicating that this model overestimates the positive effect of ATL on AGTFP. The coefficient of the spatial lag term of ATL (W*ATL) is significantly positive at the 5% confidence level, indicating that there is an interprovincial interaction of ATL and that local ATL will affect the AGTFP of neighboring provinces. It is thus established that ATL has spatial spillover effect on AGTFP.
As far as control variables are concerned, the agricultural industrial structure has a significantly positive effect on AGTFP according to Table 8. At the same time, agricultural production has ecological and economic benefits. Increasing the proportion of the planting industry not only improves the agricultural ecological environment but also effectively increases agricultural output value, thus improving AGTFP. Income distribution has a significantly negative impact on AGTFP. The greater the income gap between urban and rural residents, the more obvious the priority of industrial and service development is, while agricultural development lags behind. Moreover, the widening income distribution gap will also prompt agricultural producers to focus on increasing income, leading to the excessive use of chemical elements and the increase of pollution emissions. Trade dependence has a significantly positive impact on AGTFP. The higher the trade dependence, the higher the degree of the region’s participation in international economic cooperation will be, which not only helps agricultural producers absorb and apply international advanced production technology—increasing the competitive advantage of agricultural products and agricultural producers’ profits—but also reduces pollution emissions. Disaster-affected degree has a significantly negative impact on AGTFP. The expansion of the disaster area will not only cause the loss of agricultural output and farmers’ income but also damage the agricultural production environment. The educational level of the labor force has a significantly positive impact on AGTFP. The improvement of average education levels not only strengthens the environmental awareness of agricultural producers and improves their production skills but also promotes the optimization of the input factor utilization efficiency of producers, thus improving AGTFP.
Due to the spatial spillover effect, the coefficient of ATL can no longer be interpreted as the marginal effect on AGTFP alone. Therefore, the estimated results need to be decomposed to better reveal the direct (local) and indirect (spatial spillover) effects of ATL on AGTFP. The decomposition results of spatial effects are shown in Table 9. The direct (local) effect of ATL on AGTFP is 0.182 (significant at the 5% confidence level), which indicates that the growth of ATL in a region can cause its AGTFP to increase by 0.182%. The indirect (spillover) effect of ATL on AGTFP is 0.130 (significant at the 10% confidence level), indicating that a 1% increase of ATL in a region can contribute to a 1.30% increase of AGTFP in its neighboring regions. With the further development and improvement of agro-tourism infrastructure, regions that are the first to overcome the difficulties due to the implementation of a differentiated management mode will be favored by consumers, attracting more consumers from their own and neighboring regions in the short term (Zhang and Gu, 2013). On the other hand, under the pressure of competition, neighboring regions will also make use of local tourism resources to create unique business models. Therefore, the integrated development of agriculture and tourism in a region not only directly drives the development of agro-tourism in a region but also drives neighboring regions to catch up and innovate. The integrated development of agriculture and tourism leads to the upgrading of agricultural infrastructure and the transformation of economic development in a region, thus leading to changes in labor distribution, agricultural industry layout, capital element flow, and modes of land transfer in neighboring areas, and improving the quality of ecological environment protection and agricultural development in neighboring areas, which is beneficial for the improvement of their AGTFP. It should be noted that, although indirect effects pass the significance test, their significance level is 5%, which is lower than the 1% significance of direct effects. The possible reason for this is that the fierce homogeneous competition in China’s agro-tourism market is relatively serious, coupled with the interference of consumers’ aesthetic fatigue, difficulty in choosing, and psychological gap, so that the spatial spillover effect of ago-tourism integration is limited.
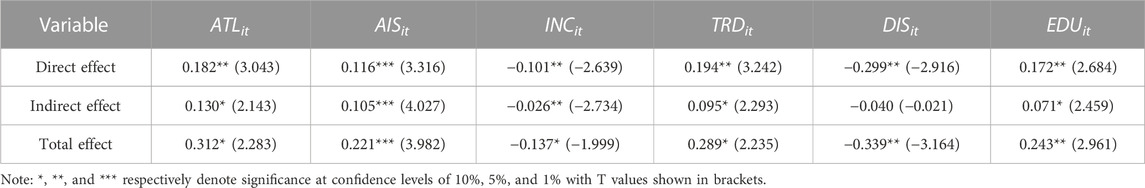
TABLE 9. Decomposition results of spatial effects.
4.1.4 Results of regional heterogeneity analysis
In view of the great differences in tourism and agricultural development among different regions in China, this study divided the whole research region into east, middle, west, and northeast for empirical testing. The model estimation adopted the dual-ways fixed SDM model based on the geographical distance spatial weight matrix, with results in Table 10. As can be seen from the analysis results, the estimation results of the four regions are basically consistent with the whole region’s samples: the direct (local) effect and the spatial spillover effect are both significant. This shows that the aforementioned research results are relatively robust. The coefficients of AGTFPi,t-1 all passed the significance test, indicating that all regional AGTFP was affected by the efficiency of the previous stage. All the four regional spatial autocorrelation coefficients ρ are greater than 0 and pass the significance test, which indicates the existence of the spatial spillover effect of AGTFP. In addition, the coefficients of W*ATLit in the eastern, central, and western regions are significantly positive, indicating that the ATL of a local region can have a positive spatial spillover effect on the AGTFP of its neighboring regions, although this effect is not significant in the northeast region.
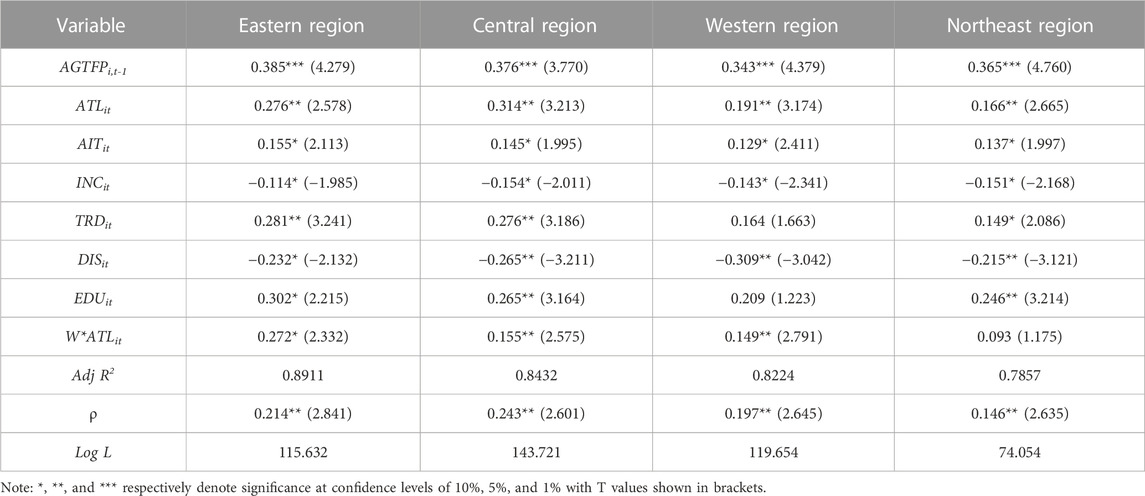
TABLE 10. Estimated results of different regions.
At the same time, the direct (local) effect and spatial spillover effect of ATL on AGTFP are considered the difference of the spillover effect in different regions. The results of spatial effect decomposition are shown in Table 11. In terms of direct (local) effect, the central region has the strongest direct (local) effect (coefficient = 0.312, significant at 5% confidence level). The spillover effect of ATL on improving AGTFP in eastern region (the = 0.131, significant at 5% confidence level) is greater than those of other regions. Comparatively speaking, the eastern region has a good economic foundation and infrastructure, so tourism, information, and factor flows can operate conveniently and efficiently. Therefore, the spillover effect in the eastern region is more prominent.
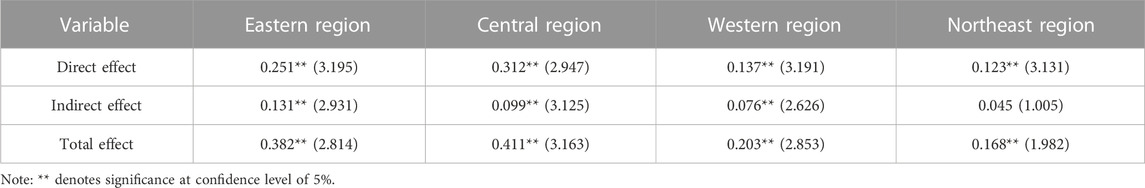
TABLE 11. Decomposition results of spatial effect in different regions.
4.2 Results of dynamic threshold regression model and analysis
First, the threshold value and number of threshold variables should be determined. The threshold value of ATL obtained by 300-times self-sampling using the Bootstrap method is shown in Table 12. The results show that the F statistic of a single threshold of ATL passes the test at a 5% significance level, with a threshold value of 0.603. Because neither double nor triple thresholds pass the significance test, a single threshold panel threshold regression model for empirical testing was thus established.
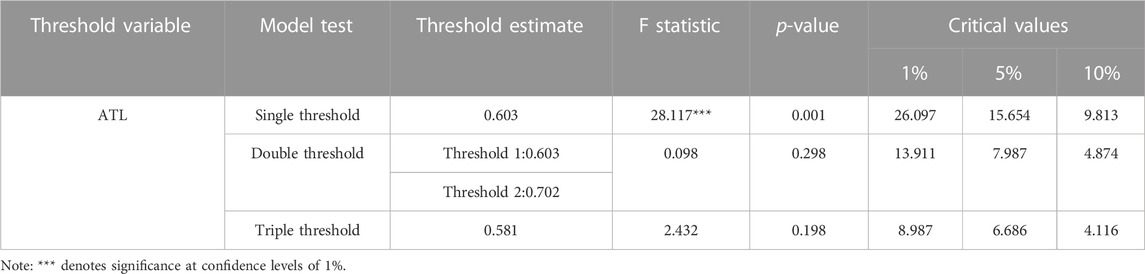
TABLE 12. Threshold effect test.
Biased results will be obtained if the OLS method used to estimate the threshold regression model contains lagged items of explained variables. Therefore, the system generalized method of moments (GMM) method is used here for estimation, with regression results shown in Table 13. When ATL (of the whole research region) is lower than the threshold value of 0.603, its regression coefficient is 0.207 (significant at 5% confidence level), which passes the test at 5% significance level. When ATL exceeds 0.603, the regression coefficient is 0.394 (significant at 5% confidence level). This indicates that, with increased agricultural–tourism integration, its effect on AGTFP is generally enhanced.
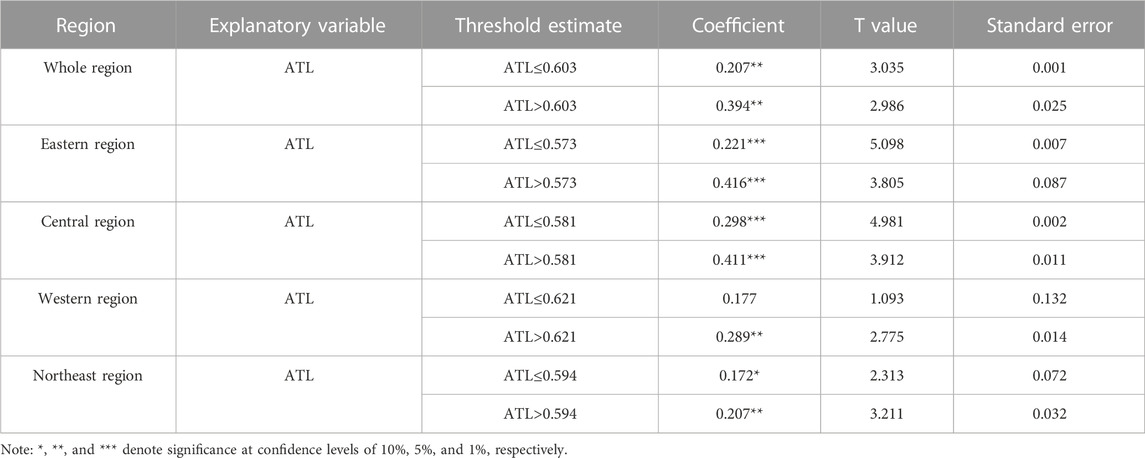
TABLE 13. Threshold effect estimation results.
At the same time, the dynamic panel threshold effects were estimated for four different regions, and the number of threshold values and variables in different regions were determined. It was found that there was just one threshold value in each of the four regions (Table 13). As shown in Table 13, the eastern region has the lowest threshold value (ATL = 0.573) of the four regions. When ATL is less than the threshold value, its regression coefficient is 0.221 (significant at 1% confidence level), and, when ATL crosses the threshold value, its coefficient increases to 0.416 (significant at 1% confidence level). The eastern region has convenient transportation, suitable climate, and a higher urbanization and economic level, so its residents have a higher demand for agro-tourism. With improved integration of agriculture and tourism, the agricultural ecological value is further highlighted, which also enhances of the ecological consciousness of agricultural producers. They will therefore take the initiative to adopt green production methods and strengthen agricultural ecological and environmental behavior to enhance AGTFP. The western region has the highest threshold value (ATL = 0.621). When ATL is less than the threshold value, its influence coefficient is not significant, but when it crosses the threshold value, its coefficient increases to 0.289 (significant at 5% confidence level). This indicates that, when the level of agricultural–tourism integration in western China is relatively low, it cannot significantly promote the growth of AGTFP; only when ATL climbs to a higher level is its impact on improving AFTGP significant. This is mainly because most western provinces are economically underdeveloped, so it is difficult to promote advanced agricultural technology, and the market space of agricultural tourism is relatively limited. In addition, natural resources and climate conditions in this region are poor, so it is more difficult to promote agriculture–tourism integration. Therefore, ATL has no significant influence on AGTFP in the early stage of integration. When ATL exceeds the threshold of 0.621, agro-ecological capital can create more value for agricultural producers, leading them to pay more attention to agricultural green development. They will then consciously reduce the input of harmful environmental elements in the production process, ultimately improving AGTFP and enhancing the effect of ATL on AGTFP.
5 Conclusion and policy recommendation
5.1 Conclusion
Based on the panel data of 30 provinces in China from 2008 to 2019, this study used the dynamic spatial Durbin model and threshold model to verify whether the integration of agriculture and tourism can promote AGTFP. The conclusions of this study are
(1) During the study period, AGTFP in the whole study area showed an upward trend, though there were fluctuations, and the average annual growth rate was 2.26%. The average annual growth rates of AGTFP in the eastern, central, western, and northeastern regions during the study period were 2.06%, 2.31%, 2.53%, and 2.10%, respectively. In recent years, the central government has attached great importance to environmental protection, aimed at agricultural pollution, which has greatly contributed to the growth of AGTFP.
(2) The impact of agriculture–tourism integration on AGTFP has a spatial spillover effect. The improvement of this integration in adjacent areas is conducive to increased AGTFP in the local region. For the whole research region, the direct (local) effect of ATL on AGTFP is 0.181, indicating that the growth of ATL in a region can lead a region's AGTFP to increase by 0.181%. The spillover effect of ATL on AGTFP is 0.130, indicating that a 1% increase of a region's ATL contributes to a 1.30% increase of AGTFP in its neighboring region. As for different regions, the central region has the strongest direct (local) effect, while the spillover effect of ATL on AGTFP in the eastern region is the greatest of the four regions.
(3) There is a threshold effect of agriculture–tourism integration on AGTFP, and there is a single threshold in the whole area and four different subdivisions. When the ATL of the whole research region is lower than the threshold value of 0.603, the regression coefficient of ATL is 0.207; however, when ATL exceeds 0.603, the regression coefficient increases to 0.394. This indicates that, with the increase in ATL, its effect on AGTFP is enhanced. Among the four regions, the eastern region has the lowest threshold value (ATL = 0.573), while the threshold value of ATL in the western region is the highest (ATL = 0.621). When the ATL of the western region is below the threshold value, its effect on AGTFP does not pass the significance test; only when it exceeds the threshold value does it have a significantly positive effect on AGTFP. Therefore, improving ATL is important for promoting AGTFP.
5.2 Policy recommendation
The conclusions of this study provide the following recommendations for promoting agriculture–tourism integration and giving full play to its role in improving AGTFP:
(1) Top-level design of policies and institutions should be optimized and improved. Incorporating the integrated development of agriculture and tourism into the framework of agricultural green development should be taken into consideration. All regions should fully combine the characteristics of resource endowment and systematically plan and jointly develop agricultural and tourism resources and elements. It is very important to promote the effective integration of the industrial and value chains of agriculture and tourism and to promote the deeply integrated development of the two industries. It is also necessary to build an integrated agglomeration area of agriculture and tourism to achieve industrial agglomeration.
(2) Considering the positive spatial spillover effect of the integration of agriculture and tourism, the timely promotion of regional coordination mechanisms by exploring a reasonable development model for dividing economic zones and administrative regions is necessary. Practical regional cooperation should be strengthened by signing strategic cooperation agreements and promoting effective cooperation between administrative regions in many ways, such as platform construction, industrial integration, public services, and personnel exchanges. Difficulties such as the consolidation of interests, homogenization of competition, lagging administrative control, and lagging institutions in trans-regional governance should be resolved effectively.
(3) We should find ways to innovate the development of agriculture–tourism integration, thus promoting the upgrading of the agro-tourism association. Promoting the knowledge, management, and technology of agriculture–tourism integration spills over into relevant agricultural operating subjects. We can thus optimize the allocation of agricultural labor, land, capital, technology, management, and other production factors to improve the overall agricultural technological progress and efficiency, thus also improving AGTFP.
(4) Rural human capital cultivation should be strengthened. Promoting the integrated development of agriculture and tourism requires the support of high-quality skills. Developing agro-tourism requires flexible measures and recruiting talent, basic skilled personnel, middle or senior management, and operations personnel. At the same time, rural vocational and technical education should be strengthened, agricultural technology should be promoted, and the vocational skills of local laborers should be improved to enhance the level of rural human capital, which will better help agricultural–tourism integration promote AGTFP.
Although this study has determined the spatial and non-linear effects of agriculture and tourism integration on AGTFP, it has some limitations. First, we only conducted a theoretical analysis of the influence mechanism of the integration of agriculture and tourism on AGTFP, which should be further empirically tested. Second, the study period in this paper ends in 2019. Considering the huge impact of COVID-19 on tourism since 2020, official statistical data from 2020 and later were not included in the research observation period of this paper. In the future, statistical data should be continuously tracked and updated, especially focusing on the integrated development and evolution of agriculture and tourism after the start of the 14th Five-Year Plan of China. Third, due to data limitations, we conducted the empirical research at the provincial level; in future, more micro-analysis will be carried out by selecting typical cases, such as national demonstration counties of leisure agriculture and rural tourism or key villages of rural tourism, so as to improve the accuracy of the research conclusions.
Data availability statement
The original contributions presented in the study are included in the article/Supplementary Material; further inquiries can be directed to the corresponding author.
Author contributions
JW wrote the manuscript, and FZ contributed to manuscript revision, read, and approved the submitted version. CC revised the format of the manuscript, and ZL polished the language and corrected grammatical errors.
Funding
We appreciate the funds from: Key Project of Hunan Provincial Education Department (Grant No. 22A0611); Construct Program of the Key Discipline in Hunan Province (Grant No. Xiang Jiao Tong [2018]469).
Acknowledgments
We appreciate the editors’ and the two reviewers’ insightful comments of a previous draft of this manuscript.
Conflict of interest
The authors declare that the research was conducted in the absence of any commercial or financial relationships that could be construed as a potential conflict of interest.
Publisher’s note
All claims expressed in this article are solely those of the authors and do not necessarily represent those of their affiliated organizations, or those of the publisher, the editors, and the reviewers. Any product that may be evaluated in this article, or claim that may be made by its manufacturer, is not guaranteed or endorsed by the publisher.
Footnotes
1 Data of 2020–2022 were not taken into account due to impact of COVID-19 pandemic.
References
Adetutu, M. O., and Ajayi, V. (2020). The impact of domestic and foreign R&D on agricultural productivity in sub-Saharan Africa. World Dev. 125, 104690. doi:10.1016/j.worlddev.2019.104690
Ammirato, S., Felicetti, A. M., Raso, C., Pansera, B. A., and Violi, A. (2020). Agritourism and sustainability: What we can learn from a systematic literature review. Sustain. Switz. 12 (22), 1–18. doi:10.3390/su12229575
Amsden, B., and McEntee, J. (2011). Agrileisure: Re-Imagining the relationship between agriculture, leisure and social change. Leisure/Loisir 35 (1), 37–48. doi:10.1080/14927713.2011.549194
Anselin, L. (1998). Spatial econometrics: Methods and models. Dordrecht, Netherland: Kluwer Academic Publishers.
Chen, J. (2014). Research on evaluation of the integration degree of tourism and agriculture in yiyang city. Master dissertation. Xiangtan, China: Xiang Tan University in China.
Chen, M. P., Chen, J. N., and Lai, S. Y. (2006). Inventory analysis and spatial distribution of Chinese agricultural and rural pollution. China Environ. Sci. (6), 751–755.
Chen, Y., Miao, J., and Zhu, Z. (2021). Measuring green total factor productivity of China’s agricultural sector: A three-stage SBM-DEA model with non-point source pollution and CO2 emissions. J. Clean. Prod. 318 (18), 128543. doi:10.1016/j.jclepro.2021.128543
Dax, T., Zhang, D., and Chen, Y. (2019). Agri-tourism initiatives in the context of continuous out-migration: Comparative perspectives for the Alps and Chinese mountain regions. Sustain. Switz. 11 (16), 4418. doi:10.3390/su11164418
Elhorst, J. P. (2003). Specification and estimation of spatial panel data models. Int. Regional Sci. Rev. 26 (3), 244–268. doi:10.1177/0160017603253791
Emrouznejad, A., and Yang, G. L. (2018). A survey and analysis of the first 40 years of scholarly literature in DEA: 1978–2016. Socio-Economic Plan. Sci. 61, 4–8. doi:10.1016/j.seps.2017.01.008
Faostat, (2019). Food and agriculture organization of the united Nations. Available at: https://www.fao.org/faostat/zh/#data/GT.
Fleischer, A., and Tchetchik, A. (2002). Is agriculture an important component of rural tourism? 42nd Congress of the European regional science association (Dortmund: ERSA).
Gao, Y., and Niu, Z. H. (2018). Agricultural informatization, spatial spillover effect and agricultural green total factor productivity:Based on the method of SBM-ML index and spatial Durbin model. Statistics Inf. Forum 33 (10), 66–75.
Gilbert, D., and Hudson, S. (2000). Tourism demand constraints. Ann. Tour. Res. 27 (4), 906–925. doi:10.1016/s0160-7383(99)00110-3
Gong, B. (2020). Agricultural productivity convergence in China. China Econ. Rev. 60, 101423. doi:10.1016/j.chieco.2020.101423
Guaita Martínez, J. M., Martín Martín, J. M., Salinas Fernández, J. A., and Mogorrón-Guerrero, H. (2019). An analysis of the stability of rural tourism as a desired condition for sustainable tourism. J. Bus. Res. 100, 165–174. doi:10.1016/j.jbusres.2019.03.033
Guo, H. H., and Liu, X. M. (2021). Spatial and temporal differentiation and convergence of China's agricultural agreen total factor productivity. Quantitative Tech. Econ. Res. 38 (10), 65–84. doi:10.13653/j.cnki.jqte.2021.10.004
Hsu, S. M., Hsieh, P. H., and Yuan, S. T. (2013). Roles of “small- and medium-sized enterprises” in service industry innovation: A case study on leisure agriculture service in tourism regional innovation. Serv. Industries J. 33 (11), 1068–1088. doi:10.1080/02642069.2011.623773
Hu, P. B., and Zhong, Y. P. (2019). The mechanism of improving agricultural eco-efficiency by the integration of agriculture and tourism supported by the government: Taking the national leisure agriculture and rural tourism demonstration counties as an example. Chin. Rural. Econ. 420 (12), 85–104.
Huang, W. H., Qi, C. J., and Fang, G. Z. (2021). Does the agricultural environment regulation promote the improvement of wheaten GTFP? Resour. Environ. Yangtze Basin 30 (2), 459–471.
Im, K. S., Pesaran, M. H., and Shin, Y. (2003). Testing for unit roots in heterogeneous panels. J. Econ. 115 (1), 53–74. doi:10.1016/S0304-4076(03)00092-7
Jiang, G. (2022). How does agro-tourism integration influence the rebound effect of China’s agricultural eco-efficiency? An economic development perspective. Front. Environ. Sci. 10 (5), 1–13. doi:10.3389/fenvs.2022.921103
Jiang, L., and Wang, X. J. (2019). EKC hypothesis verification between rural EnvironmentalQuality and agricultural economic growth in China-an empirical analysis based on panel data of 31 provinces. Issues Agric. Econ. (12), 43–51. doi:10.13246/j.cnki.iae.2019.12.005
Koscak, M. (1998). Integral development of rural areas, tourism and village renovation, Trebnje, Slovenia. Tour. Manag. 19 (1), 81–85. doi:10.1016/s0261-5177(97)00096-4
Li, J. X. (2021). Rural financial development and the improvement of agricultural green total factor productivity. Manag. Rev. 33 (3), 84–95.
Liang, J., and Long, S. H. (2015). China's agricultural green total factor productivity growth and its affecting factor. J. South China Agric. Univ. Soc. Sci. Ed. 14 (3), 1–12.
Liu, J., and Xu, K. N. (2010). Industrial agglomeration, economic growth and regional disparity: An empirical study based on China's provincial panel data. China Soft Sci. (7), 91–102.
Lupi, C., Giaccio, V., Mastronardi, L., Giannelli, A., and Scardera, A. (2017). Exploring the features of agritourism and its contribution to rural development in Italy. Land Use Policy 64, 383–390. doi:10.1016/j.landusepol.2017.03.002
Mitchell, R., Charters, S., and Albrecht, J. N. (2012). Cultural systems and the wine tourism product. Ann. Tour. Res. 39 (1), 311–335. doi:10.1016/j.annals.2011.05.002
Nie, L., and Fan, F. Y. (2019). A Co-integration analysis of integrated performance of tourism and agriculture industries in hainan province under the background of free trade zone. Humanit. Soc. Sci. J. Hainan Univ. 37 (2), 63–69.
Nie, L. (2019). “Study on integrated development of agriculture and tourism in hainan province,”. Doctoral dissertation (Wuhan, China: Zhongnan University of Economics and Law in China).
Pillay, M., and Rogerson, C. M. (2013). Agriculture-tourism linkages and pro-poor impacts: The accommodation sector of urban coastal KwaZulu-Natal, South Africa. Appl. Geogr. 36, 49–58. doi:10.1016/j.apgeog.2012.06.005
Pitrova, J., Krejíi, I., Pilar, L., Moulis, P., Rydval, J., Hlavatý, R., et al. (2020). The economic impact of diversification into agritourism. Int. Food Agribus. Manag. Rev. 23 (5), 713–734. doi:10.22434/IFAMR2020.0076
Ristić, L., Bošković, N., and Despotović, D. (2019). Sustainable integral development of agriculture and tourism in the Republic of Serbia. Ekon. Horizonti 21 (1), 57–74. doi:10.5937/ekonhor1901057r
Sanches-Pereira, A., Onguglo, B., Pacini, H., Gómez, M. F., Coelho, S. T., and Muwanga, M. K. (2017). Fostering local sustainable development in Tanzania by enhancing linkages between tourism and small-scale agriculture. J. Clean. Prod. 162, 1567–1581. doi:10.1016/j.jclepro.2017.06.164
Shen, Z., Baležentis, T., and Ferrier, G. D. (2019). Agricultural productivity evolution in China: A generalized decomposition of the luenberger-hicks-moorsteen productivity indicator. China Econ. Rev. 57, 101315. doi:10.1016/j.chieco.2019.101315
Sheng, Y., Tian, X., Qiao, W., and Peng, C. (2020). Measuring agricultural total factor productivity in China: Pattern and drivers over the period of 1978-2016. Aust. J. Agric. Resour. Econ. 64 (1), 82–103. doi:10.1111/1467-8489.12327
Situmorang, R., Trilaksono, T., and Japutra, A. (2019). Friend or foe? The complex relationship between indigenous people and policymakers regarding rural tourism in Indonesia. J. Hosp. Tour. Manag. 39 (2), 20–29. doi:10.1016/j.jhtm.2019.02.001
SoleimannejadAlibaygi, R., and Salehi, A. (2021). Barriers and facilitators of agri-tourism sustainable development in west of mazandaran province. Geogr. Environ. Plan. 33 (2), 1–4.
Streifeneder, T. (2016). Agriculture first: Assessing European policies and scientific typologies to define authentic agritourism and differentiate it from countryside tourism. Tour. Manag. Perspect. 20, 251–264. doi:10.1016/j.tmp.2016.10.003
Su, Y. W. (2020). Measurement of the integration level of Producer services and manufacturing: Based on the provincial panel data from 2005 to 2018. Macroecon. Res. 12, 98–108.
Sun, Y. (2022). Environmental regulation, agricultural green technology innovation, and agricultural green total factor productivity. Front. Environ. Sci. 10 (10), 1–13. doi:10.3389/fenvs.2022.955954
Testa, R., Galati, A., Schifani, G., Di Trapani, A. M., and Migliore, G. (2019). Culinary tourism experiences in agri-tourism destinations and sustainable consumption-Understanding Italian tourists’ motivations. Sustain. Switz. 11 (17), 1–17. doi:10.3390/su11174588
Tew, C., and Barbieri, C. (2012). The perceived benefits of agritourism: The provider’s perspective. Tour. Manag. 33 (1), 215–224. doi:10.1016/j.tourman.2011.02.005
Tone, K. (2002). A slacks-based measure of super-efficiency in data envelopment analysis. Eur. J. Operational Res. 143 (1), 32–41. doi:10.1016/S0377-2217(01)00324-1
Tone, K. A. (2001). A slacks-based measure of efficiency in data envelopment analysis. Eur. J. Operational Res. 130 (3), 498–509. doi:10.1016/s0377-2217(99)00407-5
UNEP (2008). Kick the habit: A un guide to climate neutrality. Available at: https://xueshu.baidu.com/usercenter/paper/show?paperid=ae425f1e828c18b1207f6e165a585ac1andsite=xueshu_se (accessed on June 1, 2022).
Valdivia, C., and Barbieri, C. (2014). Agritourism as a sustainable adaptation strategy to climate change in the Andean Altiplano. Tour. Manag. Perspect. 11, 18–25. doi:10.1016/j.tmp.2014.02.004
Van Sandt, A., and Thilmany Mcfadden, D. (2016). Diversification through agritourism in a changing U.S. Farmscape. West. Econ. Forum 15, 52–58.
Van Zyl, C. C., and Van Der Merwe, P. (2021). The motives of South African farmers for offering agri-tourism. Open Agric. 6 (1), 537–548. doi:10.1515/opag-2021-0036
Wang, F., Du, L., and Tian, M. (2023). Does agricultural credit input promote agricultural green total factor productivity? Evidence from spatial panel data of 30 provinces in China. Int. J. Environ. Res. Public Health 20 (1), 529. doi:10.3390/ijerph20010529
Wang, L. F. (2018). The dynamic mechanism and development path for integration of agriculture and tourism in shanxi province. J. Agro-technical Econ. 4, 136–144.
Wang, Y. F., Xu, M., and Zhang, J. Q. (2022). The impact of collaborative agglomeration of agricultural tourism industry on the growth of agricultural green total factor productivity: Mechanism of action and empirical evidence. J. Anhui Normal Univ. (Hum.and Soc.Sci.). 50 (4), 143–157.
West, T. O., and Marland, G. (2002). A synthesis of carbon sequestration, carbon emissions, and net carbon flux in agriculture: Comparing tillage practices in the United States. Agric. Ecosyst. Environ. 91 (1–3), 217–232. doi:10.1016/S0167-8809(01)00233-X
Xu, J. F., and Chen, H. C. (2020). Coupling measurement and spatial correlation on sports industry and tourism industry. J. Shandong Sport Univ. 36 (1), 9–16.
Yang, Y. H., He, J. X., Zhang, Y. H., Zhang, X. H., and Rui, Y. (2022). Spatial differentiation characteristics and influencing texture of the coupling coordinated development of agro-culture-tourism in China. Arid. Land Geogr. 11, 1–12. doi:10.12118/j.issn.1000-6060.2022.295
Zhang, H., Zhang, J., and Song, J. (2022). Analysis of the threshold effect of agricultural industrial agglomeration and industrial structure upgrading on sustainable agricultural development in China. J. Clean. Prod. 341, 130818. doi:10.1016/j.jclepro.2022.130818
Keywords: integration of agriculture and tourism, agricultural green total factor productivity, impact, dynamic spatial Durbin model, dynamic threshold model
Citation: Wang J, Zhou F, Chen C and Luo Z (2023) Does the integration of agriculture and tourism promote agricultural green total factor productivity?—Province-level evidence from China. Front. Environ. Sci. 11:1164781. doi: 10.3389/fenvs.2023.1164781
Received: 13 February 2023; Accepted: 16 March 2023;
Published: 31 March 2023.
Edited by:
Robert Larkin, Agricultural Research Service (USDA), United StatesCopyright © 2023 Wang, Zhou, Chen and Luo. This is an open-access article distributed under the terms of the Creative Commons Attribution License (CC BY). The use, distribution or reproduction in other forums is permitted, provided the original author(s) and the copyright owner(s) are credited and that the original publication in this journal is cited, in accordance with accepted academic practice. No use, distribution or reproduction is permitted which does not comply with these terms.
*Correspondence: Faming Zhou, NTY4NjY3MzIzQHFxLmNvbQ==