 Emeka A. Ugboma
 Iwona S. Stachlewska
 Philipp Schneider
 Kerstin Stebel
- 1Faculty of Physics, University of Warsaw (UW), Warsaw, Poland
- 2NILU—Norwegian Institute for Air Research, Kjeller, Norway
The tropospheric NO2 column from Sentinel-5P/TROPOMI (2018–2020) and Aura/OMI (2010–2020) over Poland, notably for 7 major Polish cities, was used to assess the annual variability and the COVID-19 lockdown effect. On a national scale, during lockdown (March–June 2020), strong sources of pollution were found in Katowice and Warszawa, as well as at the power plant in Bełchatów. A gradual drop in OMI NO2 values between March and June was found for all cities and the entire domain of Poland, this being a part of the annual NO2 cycle derived for every year from 2010 to 2020. In fact, the gradual drop of NO2 in the lockdown year was within the typical monthly and annual variability. In March 2020, Kraków showed the highest NO2 reduction rate. A reduction of NO2 was observed in Gdańsk, Wrocław, and Warszawa during every month of the lock-down period. Several factors, including wind speed and direction, temperature, and increased emission sources, can limit the dispersion and removal of NO2. Although meteorological conditions have a significant impact on the annual cycle of NO2 in Poland, it is important to note that anthropogenic emissions remain the primary driver of NO2 concentrations. Therefore, the study concludes that the effect of COVID-19 restrictions on NO2 pollution was negligible and clarifies the current understanding of the COVID-19 effect over Poland, with an emphasis on hotspots in the major Polish cities and their vicinity. This is consistent with our understanding that the reduction of NO2 pollution is seen in cities due to reduced traffic (domestic, municipal, and airborne).
1 Introduction
The combined effect of ambient and household air pollution results in nearly 3 million fatalities each year, as a result of increased mortality due to stroke, cardiovascular diseases, chronic obstructive pulmonary disease, and cancer, among others (Dockery et al., 1993; Lim et al., 2012; Geddes et al., 2016). It is also a severe hazard to the environment. In recent years, increased public and global interest in addressing air quality issues has resulted from the COVID-19 restrictions on social interaction and the global economy, which have temporarily reduced pollution levels in many locations. One of the major air pollutants that has a negative effect on human health (Chen et al., 2007; Manisalidis et al., 2020) and at the same time absorbs visible sunlight (Vandaele et al., 1998; Solomon et al., 1999), thus making it observable by satellite instruments, is nitrogen dioxide (NO2). NO2 is mostly a secondary pollutant that results from chemical reactions between other pollutants, and it is a main component of photochemical smog. Its presence in urban areas is connected to the burning of fossil fuels as well as other types of combustion. NO2, along with nitric oxide (NO), is a major regulator of the free tropospheric oxidising capacity, influencing the build-up and result of radical species such as hydroxyl radicals (WHO, 2010). The amount of NO2 in our atmosphere is mainly related to the magnitude of NOx (= NO + NO2) emissions, and weather factors such as the solar zenith angle, wind speed, and temperature (Goldberg et al., 2020). There are several chemical forms of nitrogen oxides (NOx), however, NO2 is the air pollutant of greatest concern to human health. It is an important trace gas in the atmosphere, not only because of its health consequences, but also because it contributes to poor atmospheric visibility, and if its concentration gets above a certain threshold, it can have local radiative effects (Solomon et al., 1999). It has been established that the magnitude and hazard of air pollution are determined by location and site type (Ugboma & Nwobi, 2017), the magnitude of the emissions (Park et al., 2018), meteorological conditions (Li et al., 2019), and land surface features (WHO, 2010; Filonchyk et al., 2018; Wang et al., 2020). Hence, measures need to be taken to reduce air pollution.
Satellite remote sensing, e.g., using instrumentation on-board the Copernicus Sentinel missions launched by the European Space Agency (ESA), is an important technique for measuring air pollution. It has the advantage of delivering full and synoptic views of broad areas in a single image on a systematic basis, which is essential for assessing and mapping air pollution (Stebel et al., 2021). Satellite observations can also be useful to demonstrate, among others, events with human health implications, such as pandemic lockdowns. However, it is not used for air pollution regulatory purposes.
In December 2019, China reported an unexplained pneumonia outbreak. On 23 January 2020, Wuhan was quarantined, and other cities began enforcing disease restrictions. The disease spread from Asia to Europe and beyond. The World Health Organization declared this COVID-19 pandemic in March 2020 (WHO, 2010). Between February and March 2020, European governments imposed social isolation and lockdowns to prevent the spread of COVID-19. This lockdown was enforced in Poland on 20 March 2020. The lockdowns considerably impacted most industries, reduced traffic and other human activities. Restrictions include a ban on large crowd gatherings, home office work, and restrictions for both foreign and domestic travel. In many countries, these measures caused a historic temporary decline in atmospheric emissions, which demonstrated that improvements in air quality are attainable for some pollutant types.
Several researchers used observations from space, in situ measurements, and models to analyse the impact of COVID-19 on NO2 pollution. During the COVID-19 lockdown, there was a 6% decrease in NO2 in Tehran, Iran (Sharifi and Felegari, 2022), 30%–39.79% drop in NO2 in East China (Filonchyk et al., 2020; Fei et al., 2022), a 40%–50% drop in Arabian Pennisula (Karumuri et al., 2022), a 20%–40% reduction was recorded in India (Biswal et al., 2021), 9%–43% in the United States (Goldberg et al., 2020), 39% decrease in Greece (Koukouli et al., 2021), 23% drop was observed in Germany (Balamurugan et al., 2021), 50% reduction in Spain (Petetin et al., 2020), 67.7% drop in Rome, Italy (Bassani et al., 2021), and many more, especially those comparing the COVID-19 effect on NO2 across more than one European country (e.g. Barré et al., 2021; Solberg et al., 2021). However, there are very few studies on NO2 pollution in Poland. Szymankiewicz et al., 2021 showed the usefulness of NO2 from the Ozone Monitoring Instrument (OMI) and the SCanning Imaging Absorption spectroMeter for Atmospheric CHartographY (SCIAMACHY) for improvement of NOx surface emission prediction. Kawka et al., 2021 examined the annual variation of TROPOspheric Monitoring Instrument (TROPOMI) NO2 and pointed out the importance of proper selection of satellite scenes for monthly averages. In relation to COVID-19 lockdown effect assessment, Grzybowski et al., 2021 reported ∼10% reduction of TROPOMI NO2 in early spring 2020 and Filonchyk et al., 2021 reported the 10%–19% reduction of OMI NO2 from 15 March to 25 April 2020. However, none of these studies attempted to assess the impact of the COVID-19 lockdown on air quality in Poland in terms of long-term variability of NO2, for which longer datasets need to be used, such as OMI NO2 for at least a decade.
The aim of this study is to use observations from space to quantify the impact of the COVID-19 lockdown on NO2 pollution over Poland with respect to decadal variability. Our initial hypothesis based on reported effects in the literature was that the reduction of NO2 during the COVID-19 lockdown over Poland should not be a typical one but still the lockdown effect should be significant (Barré et al., 2021; Solberg et al., 2021). To confirm or reject this hypothesis, we quantified NO2 changes during the COVID-19 lockdown period obtained from TROPOMI and OMI and assessed their significance in terms of the long-term OMI NO2 pollution levels over Poland domain and for selected Polish cities. As a result of the analyses, we found that the lockdown effect was negligible, being under the level of typical year-to-year decadal variability. Therefore, the key knowledge gap we sought to address was the absence of long-term analysis of OMI NO2 data in literature, specifically in terms of assessing the COVID-19 effect in the climatology context.
The paper is structured as follows: Section 2 is devoted to introducing the study area, instruments, datasets, and the methodology for satellite data retrieval; Section 3 presents the results; Section 4 is dedicated to discussion. Finally, the work is summarised and concluded in Section 5.
2 Materials and methods
2.1 Study area
The study area encompasses the country of Poland, in a rectangular domain with boundaries of 49–55°N, 14–25°E, as well as several selected biggest and most polluted cities (see Table 1; Figure 1). With a population of 38,169 million inhabitants, Poland has an area of 312,685 square kilometres. In the south, snow-capped peaks of the Carpathian and Sudeten mountain ranges, while in the north, undulating central lowlands and Baltic Sea can be found (Central Statistical Office/Basic Data, 2021; https://stat.gov.pl/podstawowe-dane/ last access 12 January 2022). The southern mountain ridge acts as an obstacle to air circulation, causing air masses to rise and cool as they approach higher elevations. This may allow clouds and precipitation to form, which can help to remove pollutants from the atmosphere. However, if the atmosphere is already polluted, these processes might result in the formation of acid rain, which may affect air quality even further. The lowlands of northern and central Poland are characterised by flat topography and a lack of substantial height variations. This implies that air masses can move more freely across the landscape, potentially spreading pollutants far. Furthermore, the mountain is more vulnerable to temperature inversions, which occur when a layer of warm air traps cooler, more polluting air close to the ground. This might result in the accumulation of pollutants and hence, poor air quality. The Baltic Sea can help to moderate air quality in the northern Poland. Pollutants can be dispersed by sea breezes, and the presence of water can help to absorb and filter out some pollutants. But if pollution levels are high, the sea may also act as a polluter, with industrial and agricultural runoff polluting the water and contributing to unhealthy air quality.
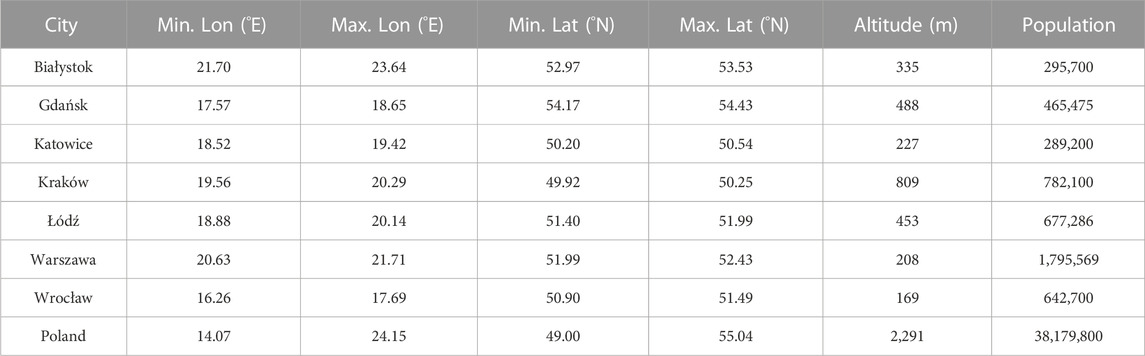
TABLE 1. Demographic and geographic information about the seven study cities in Poland as well as the entire domain of Poland. [Population data are based on Central Statistical Office/Basic Data (2021) for all sites and https://Wrocław.stat.gov.pl/en for Wrocław].
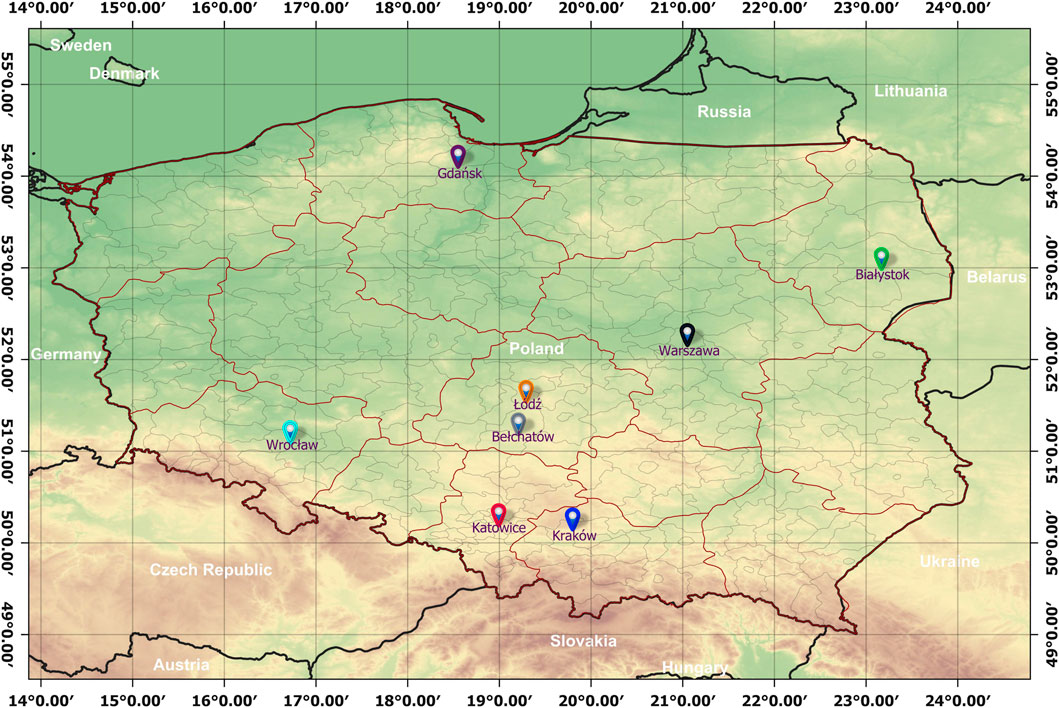
FIGURE 1. Map of Poland with locations of cities analysed in the study. Gdańsk (darkpurple), Białystok (green), Warszawa (black), Łódź (orange), Wroclaw (lightblue), Katowice (red), Kraków (blue), and Bełchatów power plant (gray).
The Bełchatów power plant (51.27 °N, 19.32 °E), is Poland’s largest contributor to NOx emissions, with a capacity of 25 kilotonnes in 2019 (SITE, 2023, last access: 31 January 2023). Meanwhile, the transportation sector is the nation’s second-largest contributor, accounting for 22%–25% of NOx emissions (Bartnicki et al., 2018). Noticeable NOx emission peaks can be seen in both the central and southern regions of Poland, where heavy road traffic combines with major combustion sources.
2.2 Instruments and datasets
The tropospheric column NO2 observations from TROPOMI and OMI are the main sources of data for this study. The instruments are described below.
The objective of the Sentinel-5 precursor (S5P) mission launched in October 2017 is to provide global information on a multitude of atmospheric trace gases, aerosol and cloud distributions affecting air quality and climate. The S5P is to fill the data gap and provide data continuity between the ESA’s Environmental Satellite (EnviSat) mission and the upcoming Sentinel-5. The satellite carries the state-of-the-art TROPOMI (TROPOspheric Monitoring Instrument) to map trace gases that can affect human health (Verhoelst et al., 2021). The hyperspectral spectrometer measures radiation in the UV (270–320 nm), VIS (310–500 nm), and IR (675–775 nm and 2,305–2,385 nm) spectral ranges (Veefkind et al., 2012). The 2-dim CCD detectors measure in 450 viewing directions across the 2,600 km swath with an integration time of ∼1 s, resulting in a high spatial resolution of 3.5 km × 7 km at nadir. In August 2019 the pixel size was decreased to 3.5 km × 5.5 km by reducing along-track averaging. A single satellite orbit around the Earth takes ∼100 min, resulting in daily global coverage due to the large sweep (Lange et al., 2021). Among other gases, S5P measures NO2, which is utilized for this work. The TROPOMI NO2 retrieval procedure is divided into three steps. The initial stage in NO2 processing is to retrieve the slant column density (SCD), Ns, the total amount of NO2 along the effective light path from the Sun through the atmosphere to the satellite using differential optical absorption spectroscopy (DOAS). The stratospheric vertical column density (VCD),
We used Level-2 TROPOMI tropospheric column NO2 data from June 2018 to May 2020, i.e., the most recent, consistent, reprocessed NO2 product from the Sentinel-5P Product Algorithm Laboratory (S5P-PAL) Data Portal (https://data-portal.s5p-pal.com, last access 28 March 2022). The S5P-PAL system provides the most refined and reliable reprocessed S5P TROPOMI NO2 product, allowing for consistent data analysis, such as studying trends in the impact of COVID-19 on air pollution. The data were re-gridded to 0.01° × 0.01° using the Atmospheric Toolbox’s HARP package (https://atmospherictoolbox.org/harp, last access 8 December 2021). In accordance with recommendation guidelines (Eskes et al., 2020), measurements with a qa_value lower than 0.75 were not used. Cloud-radiance fractions of more than 50% are excluded using a qa_value of 0.75. This qa_value essentially removes cloud-covered scenes, fragments of the scenes covered by snow/ice, error and problematic retrievals. All level-2 TROPOMI NO2 products were converted from mol/m2 to Pmolec/cm2.
The National Aeronautics and Space Administration’s (NASA) Earth Observing System Aura satellite, launched in July 2004, carries OMI (Ozone Monitoring Instrument). OMI is an ultraviolet/visible (UV/VIS) nadir solar backscatter spectrometer with a spatial resolution of 13 km × 24 km that delivers almost worldwide coverage every 24 h. A variety of trace gases are measured along with aerosol properties, cloud top heights, and UV irradiance at the surface. Its unique capacity to retrieve essential trace gases contributed significantly to our understanding of stratospheric and tropospheric chemistry and climate change (Levelt et al., 2006). The retrieval algorithm for OMI NO2 involves three steps: 1) obtaining NO2 slant columns from OMI reflectance spectra using Differential Optical Absorption Spectroscopy (DOAS), 2) distinguishing between stratospheric and tropospheric contributions to the slant column, 3) using the tropospheric air mass factor (AMF), convert the tropospheric slant column to a vertical column (Bucsela et al., 2006; Boersma et al., 2011; Dirksen et al., 2011). The OMI NO2 data product used in this study was retrieved from Goddard Earth Sciences Data and Information Services Center (GES DISC, https://disc.gsfc.nasa.gov/datasets/OMNO2d_003/summary?keywords=NO2, last access 21 January 2023). We used a daily global gridded (0.25° × 0.25°) OMNO2d tropospheric column NO2, from January 2010 to December 2020 which is provided for all atmospheric and sky conditions with a cloud fraction of less than 30% (Krotkov et al., 2019). All OMI NO2 products were converted from mol/m2 to Pmolec/cm2.
We investigated the effect of weather on the reduction of tropospheric NO2 using the ERA5 reanalysis monthly mean meteorological data (100 m wind speed and direction, boundary layer height, and temperature at 2 m above ground level) with a resolution of 0.25° × 0.25° for the months of March, April, May, and June 2019–2020. Details can be found at https://www.ecmwf.int/en/forecasts/datasets/reanalysis-datasets/era5 (last access: 24 March 2023).
2.3 Methodology
NO2 concentrations vary from day to day due to changes in emissions and meteorology, and thus, conclusions on the lockdown effect cannot be drawn based solely on the daily data products. We averaged out the day-to-day meteorological variability in the TROPOMI NO2 products by computing the 14-day simple moving average (SMA, as in Eq. 1) during the COVID-19 lockdown period (mid-March to end of June), in order to properly assess the impact of changes caused by human activities in seven Polish major cities.
where a1, … an represent daily data points. The unweighted mean of the previous k data points is given by a SMA. The higher the value of k, the smoother the curve; nevertheless, increasing k reduces accuracy. The SMA is a frequently used statistical tool for smoothing time series data by calculating the unweighted mean of the previous k data points. In this instance, k was set to 14, which indicates that the we calculated the SMA for each day of the lockdown period using the previous 14 daily data points. In doing so, we were able to reduce the impact of day-to-day meteorological variation and more accurately capture the changes in NO2 caused by human activities. This method provides a more precise evaluation of the influence of human activities on NO2 concentrations during the lockdown period.
The percentage relative change (RC, as in Eq. 2) was used to assess how much the amount of NO2 in the troposphere changed with respect to the reference period.
where
Furthermore, we computed the annual average of NO2 and analysed how it changed from year to year (2010–2020) to analyse differences in Poland’s largest cities (Białystok, Gdańsk, Katowice, Kraków, Łódź, Warszawa, and Wrocław). A manual method was used to draw bounding boxes on the Sentinel-5P pre-operations data hub. The latitude/longitude values were then obtained. The resolution of satellite imagery can have a significant impact on data accuracy. The box area over the smallest city was chosen to be sufficiently large to consider the different satellite resolutions over the different cities as negligible. It is worth noting that when comparing the 2020 observations to the OMI NO2 mean from 2010 to 2019 (Figure 4), we assumed that NO2 levels had remained stable from 2010 to 2019. This was accomplished by removing the long-term trend from all of the data before analysing it.
Please note that all data used in this study were provided using Ugboma and Stachlewska (2022) data publication.
The advantages of our methods are:
a) applying a 14-day simple moving average (SMA) of TROPOMI NO2 products during the COVID-19 lockdown period in order to properly assess the impact of changes caused by human activities in seven Polish major cities. This is crucial in order to average out day-to-day meteorological variability in the TROPOMI NO2 products.
b) using percentage relative change (RC) method to assess how much the amount of OMI NO2 in the troposphere changed with respect to the reference period. This is important to allow for a more accurate comparison of NO2 concentrations over time by accounting for seasonal and other NO2 concentration variations. Furthermore, to reduce the impact of outliers and missing data points by filtering OMI missing data points and outliers.
c) using annual average of NO2 to analyze how it changed from year to year (2010–2020) to obtain differences in Poland’s largest cities.
3 Results
3.1 NO2 decrease as observed by TROPOMI
The monthly mean tropospheric column NO2 maps over Poland retrieved from TROPOMI were compared between the periods of March-June 2019 and 2020, as shown in Figures 2A–L, to depict changes during the COVID-19 lockdown period. In general, NO2 levels decreased in 2020 compared to 2019, especially in the west, central, and southern regions, except for the Bełchatów power plant in May and June. The hotspots marking the cities chosen for this study are well visible (refer to Figure 1).
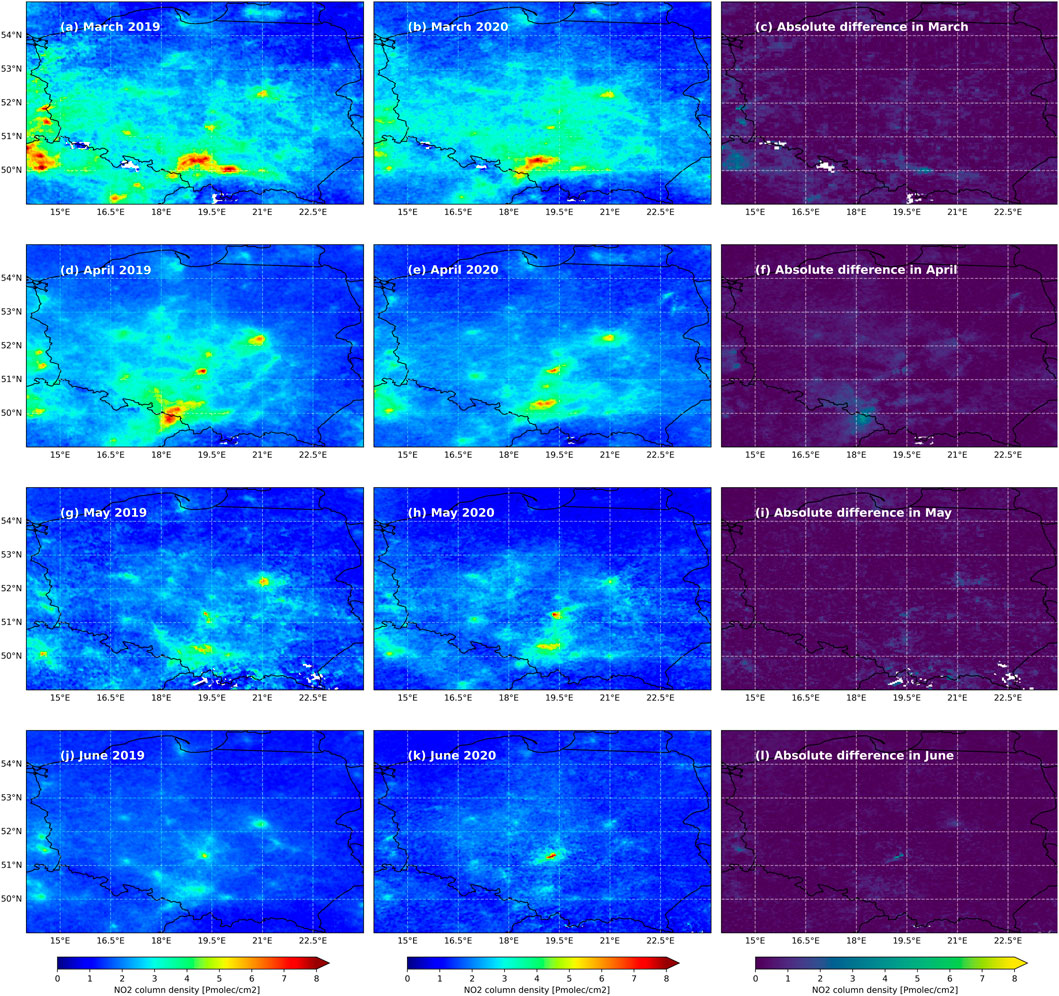
FIGURE 2. Monthly mean of TROPOMI NO2 over Poland in the reference period of 2019 (March(A), April(D), May(G), June(J)), the COVID-19 year 2020 (March(B), April(E), May(H), June(K)), and the absolute differences (March(C), April(F), May(I), June(L)).
The TROPOMI NO2 percentage change in the country’s largest cities during COVID-19 lockdown is shown in Table 2. We do not observe a consistent reduction in each city within March to June 2020 (values vary from −48.34% to 30.30% in different months), whereby sometimes we even observe a strong increase (e.g., in March: 30.30% in Katowice, and 27.51% in Łódź). The strongest reduction in March was for Kraków (−48.34%), in April and May for Gdańsk (−35.83%, −30.61%), and in June for Katowice (−26.56%). Note that in all months the reduction was observed only in Gdańsk, Wrocław, and Warszawa but at very different rates. Thus, when we look at the individual cities, it is very difficult to argue that the observed reduction was directly caused by COVID-19 lockdown.
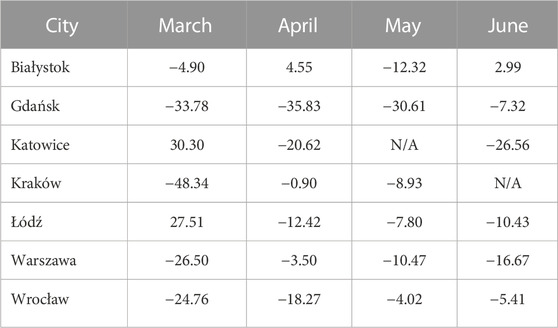
TABLE 2. Relative percentage change in TROPOMI NO2 for March–June in 2019 and 2020.
A daily NO2 pollution across all the cities during period corresponding to COVID-19 lockdown in 2020 and for comparison in 2019 is shown in Figure 3. Daily mean variations (in Figure 3, blue) depicts day-to-day changes. For both years, Białystok and Gdańsk had low daily NO2 concentrations (between 0.21 and 5.26 Pmolec/cm2). Slightly higher values where for Wrocław, Łódź, and Warszawa (between 0.39 and 5.72 Pmolec/cm2). The highest variability was observed in Katowice and Kraków, reaching from 0 even up to 11.89 Pmolec/cm2, except for Kraków in 2020. So as to average out the effect of day-to-day variability, we also show the 14-day simple moving average (in Figure 3, orange line) of NO2 daily concentration. For some cities, NO2 14-day moving average of 2019 was similar to 2020 (e.g., Białystok, Gdańsk, Katowice, and Wrocław). For the other cities, there are more differences but not exceptional. Only for Warszawa, Wrocław, and Łódź, we see a small drop of NO2 directly after the imposition of the lockdown measures (20–24 March 2020). This confirms that we cannot unambiguously state that the COVID-19 effect was clearly evident in any of the cities.
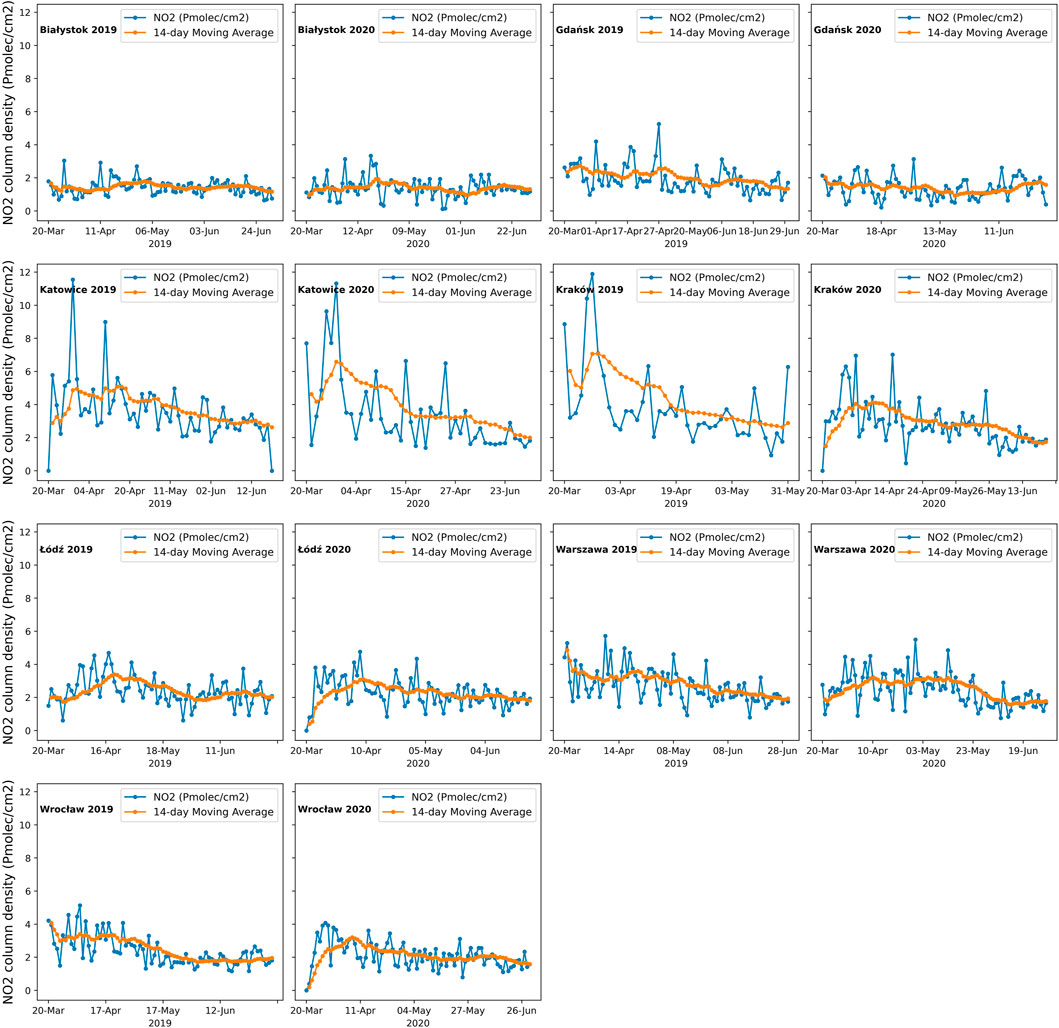
FIGURE 3. TROPOMI NO2 daily variations (blue) and a 14-day moving average (orange) in selected Polish cities (locations in Figure 1) between 20 March and 30 June of 2019 and 2020.
3.2 OMI NO2 in COVID-19 year (2020) and the reference period (2010–2019)
Because the consistent dataset of the TROPOMI is limited to the 2020 versus 2019 comparative study, one needs to look at the expected decrease of NO2 levels for longer time series of OMI. The relative change (as in Eq. 2) of the monthly mean OMI NO2 concentration in 2020 versus the reference (2010–2019 average) for selected Polish cities and over the entire country is shown in Figure 4. In January, in all cities and over Poland, there was a positive relative change that indicated higher pollution than expected on average. For Białystok, it was the same for February. Positive changes are also seen in Gdańsk (March, April, June, August, and September). We see negative relative changes (indicating a decrease in NO2) for the majority of months in the entire domain of Poland (in gray) and most of the cities, except Gdańsk. The strongest negative relative change in several cities appeared not as expected in March/April but in June (81% in Warszawa, 80% in Białystok, 58% in Łódź, 40% in Katowice, 35% in Wrocław, 22% in Kraków). The nature of the negative relative changes over Poland is what one should expect in relation to the COVID-19 lockdown, but this is not the case for individual cities. It is important to note here that when comparing the 2020 observations to the OMI NO2 mean from 2010 to 2019 (Figure 4), we considered that NO2 levels had remained consistent from 2010 to 2019. This was performed by removing the long-term trend from all of the data prior to analysis. Note that the yearly values were not derived from just 10 data points but rather from the complete set of data spanning the years 2010–2019. It is important to emphasise that the trend we presented pertains specifically to columnar NO2 retrievals.
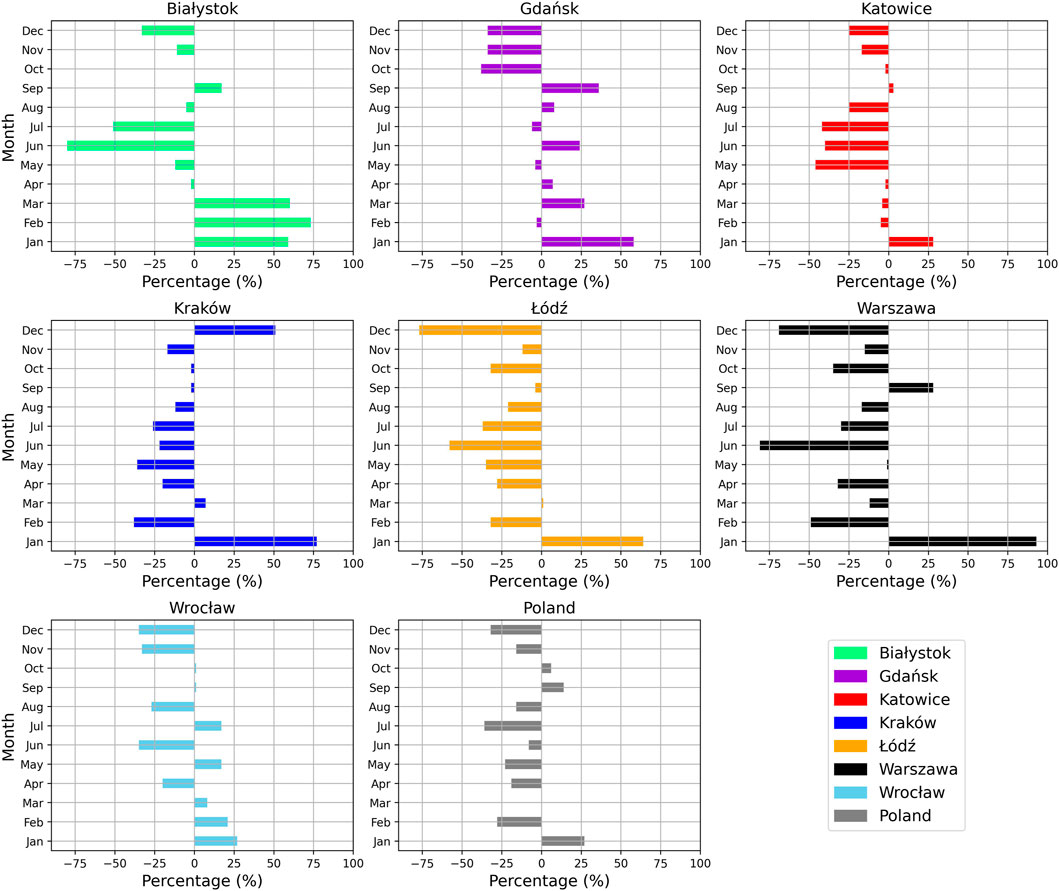
FIGURE 4. Relative change of the monthly mean OMI NO2 concentration (2020 versus the 2010–2019 average) for selected Polish cities (in colors) and over the entire Poland (gray).
The monthly mean NO2 with standard deviation for the reference years 2010–2019 compared to the monthly mean for the year 2020 for each city is depicted in Figure 5. The standard deviation bars demonstrate how NO2 levels varied within the month and city-to-city. The smaller the bar, the smaller the spread, implying that the data is clustered around the mean which can be seen in general in the summer months (JJA). Moreover, the greater standard deviation spread indicates that NO2 levels are more variable than the mean, as generally in the winter months. Data for Białystok and Gdańsk in the year 2020 are overlaying the long-term mean data. For Wrocław, Kraków, and Warszawa the overlay is less obvious, but values for 2020 are only slightly below the reference average. In Katowice and Łódź, the 2020 NO2 levels were below the long-term mean average. However, for all the cities, the levels are within the standard deviation bars of the reference.
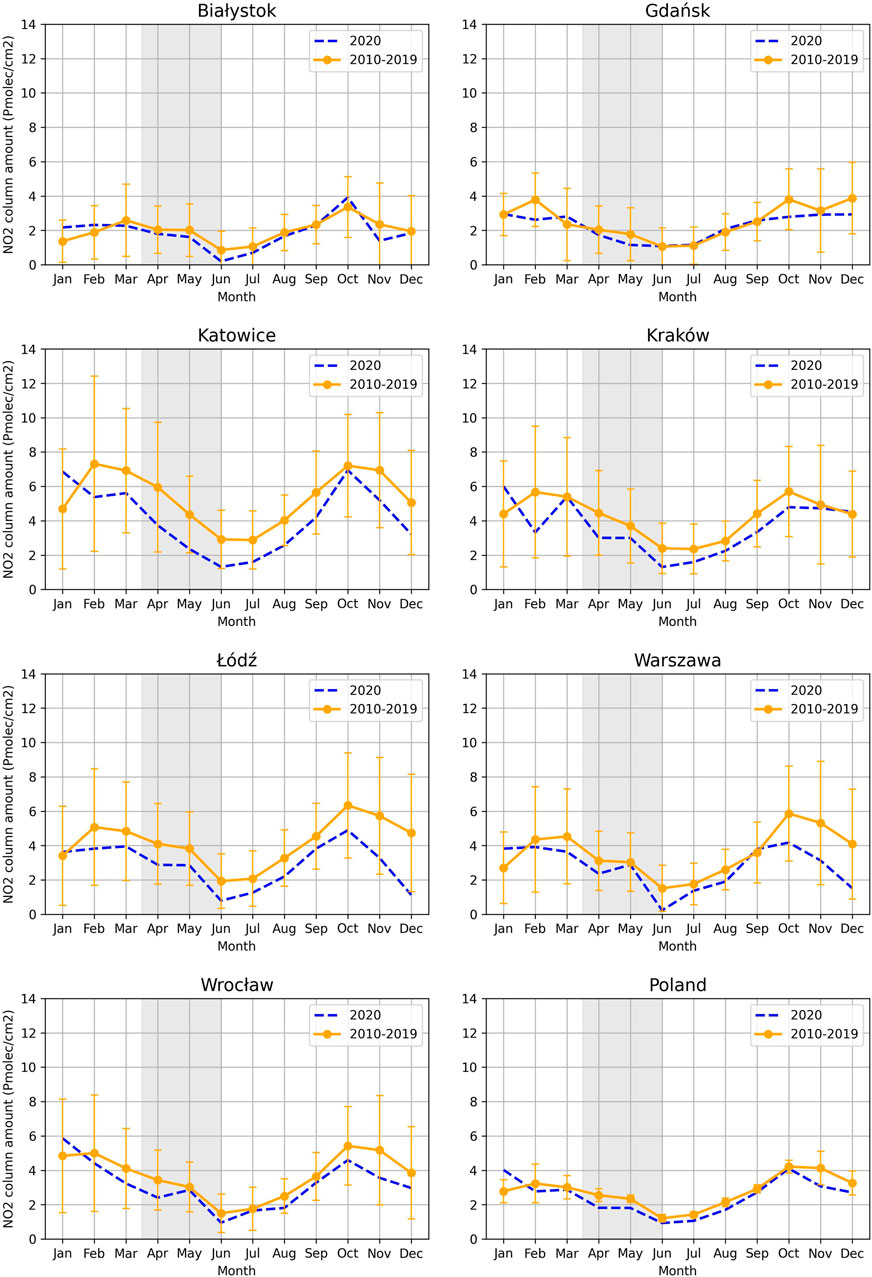
FIGURE 5. Monthly mean NO2 with standard deviation derived from OMI for Poland and the selected Polish cities in the COVID-19 year 2020 (blue dashed line) and in the reference period of 2010–2019 (orange line with error bar denoting the standard deviation). The gray shade represents the COVID-19 lockdown period.
3.3 Meteorological data
According to the methodology of Barre et al., 2021 and Goldberg et al., 2020, we reviewed our data to determine if weather effects could be accounted for, taking into consideration that our study domain size and its locality significantly differ from those in their studies. Several parameters were assessed:
1. Solar zenith angle:
From March to June, the difference in solar zenith angle for Poland (latitude 49.00–55.04°N, longitude 14.07–24.15°E) is of only about 5°–10°, and as such, changes in solar zenith angle can be considered negligible for weather normalization over this domain, while for other studies they has to be considered, e.g., Balamurugan et al., 2021, Goldberg et al., 2020.
2. Day of week:
In Poland, the difference in city pollution levels between weekdays and weekends are not as pronounced as according to Goldberg et al., 2020 (15%–30%). In our recent study Minderyte et al. (2023), we found that, e.g., in Warsaw, the pollution levels were of about 7%–15% lower on weekends compared to weekdays, and as such they are not relevant in our case.
3. Wind speed and direction:
The normalization is required for wind speeds falling between 0–2 m/s and 20 m/s or above. However, in our case, the dominant wind speed observed was between 3–8 m/s considered a moderate wind (see Supplementary Figure S9), and thus falls outside the normalization range. Upon examining the separating factor of 5 m/s utilized by Goldberg et al., 2020, we have determined that it aligns with our current data. As a result, there is only very seldom a need for weather normalization in relation to the wind speed. As for the wind direction, it shows some variability in different months (see Supplementary Figure S9). NW, W, and SW winds are prone to transport more polluted air masses, while SE, E, and NE winds transport more clean air. The prevailing winds in March and May 2019, and April and May 2020 are from NW. Most of the winds in April 2019 are from E. The winds were mixed in June 2019 (balanced between NE and SW) and in June 2020 (balanced between NW and SE). This kind of wind direction variability in connection to moderate winds shows that air mass advection of polluted and cleaner air may be brought over the domain but it is not highly significant. As a result, weather normalization can be done only for a very few specific cases.
4. Temperature changes
The temperature changes over different months shown in Figure 6, demonstrate that for both 2019 and 2020, the dominant temperature ranges were between 14°C–15°C and there was no extreme anomaly temperatures recorded. The temperature range is cooler in March (13°C–14°C) than April, May and June (15°C–17°C). This can result in NO2 build up, particularly in urban areas with high traffic and/or industrial activity. The temperature range of remaining months is warmer (15°C–20°C) and is typically associated with the late-spring/early-summer months in Poland. Warmer temperatures can cause an increase in activity in the atmosphere, including more mixing between layers and increased turbulence. This can help in the dispersal of NO2 and the improvement of air quality.
5. Boundary layer height
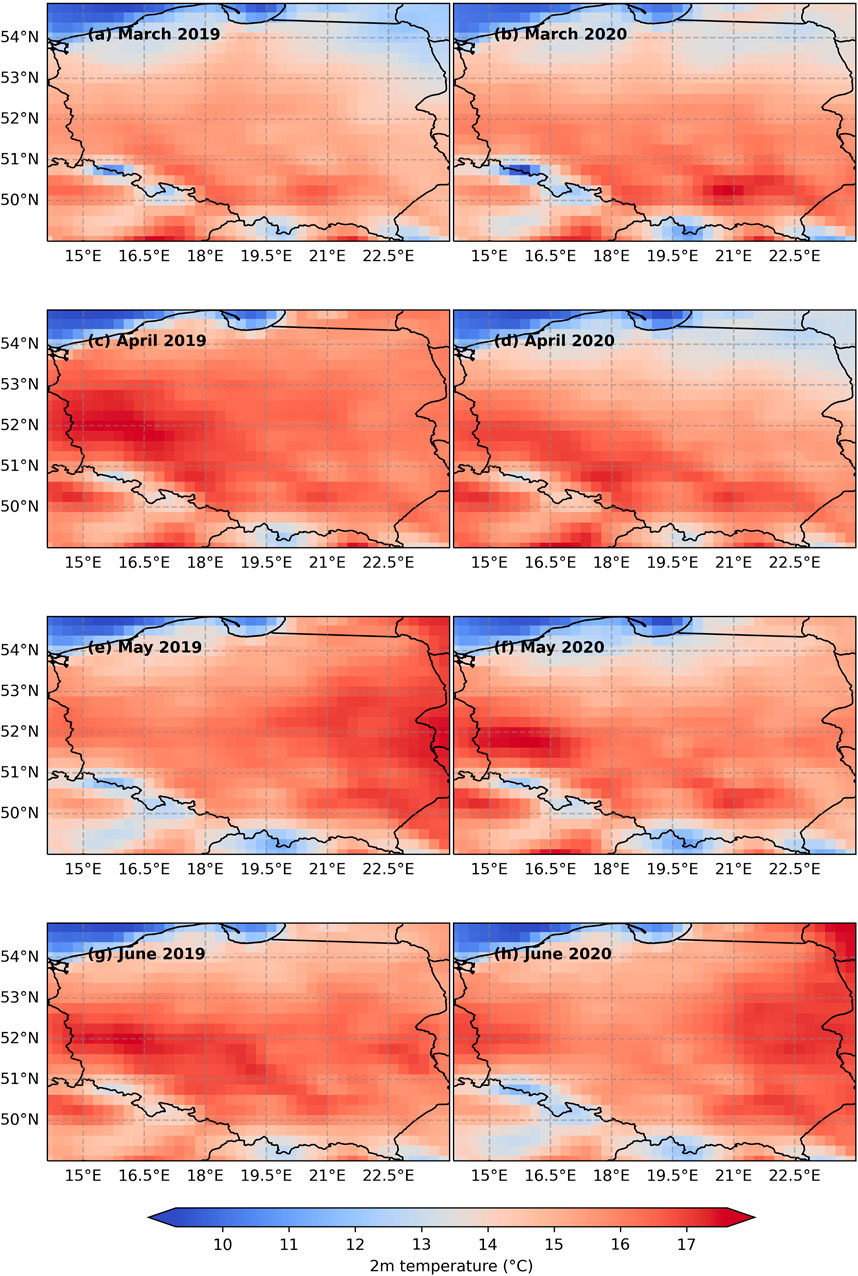
FIGURE 6. Monthly mean of 2 m temperature from ERA5 over Poland in the reference period of 2019 (March(A), April(C), May(E), June(G)) and the COVID-19 year 2020 (March(B), April(D), May(F), June(H)).
According to Goldberg et al., 2020, the normalization is required if the boundary layer height is above 2,000 m or below 500 m, which was not observed over our domain. The air tends to be more stable in March (winter/pre-spring in Poland), with less mixing between different layers of the atmosphere. The higher boundary layer can facilitate NO2 dispersion and can promote its transport over long distances, whereas the lower boundary layer can result in NO2 accumulation near the ground surface. Supplementary Figure S8 shows that the boundary layer heights in May and June of both 2019 and 2020 were similar. There was more differences in March and April (more similar to May). The correction for the low boundary layer heights was not necessary (due to their occurrence only over the Baltic Sea). Therefore, the correction for the boundary layer height effect was only sporadically.
3.4 Validation of OMI NO2 data
Any validation study of in situ or surface data with satellite columnar data is challenging as these are not directly comparable quantities. Additionally, using the available in situ NO2 data from the European Environment Agency—EEA, (https://discomap.eea.europa.eu/map/fme/AirQualityExport.htm, last access: 12 June 2023) is limited due to low data coverage for Poland, which is available only from 2013 onwards. This prevents us from incorporating EEA data for the entire duration of our study period and the selected cities. However, on the basis of the existing (very limited) dataset, we obtained hourly NO2 data (for OMI overpass time 13:45) from the EEA. The computed R-squared values for EEA and OMI are as follows:
Białystok: −0.6466, Gdańsk: 0.5461, Łódź: 0.4109, Kraków: 0.3094, Warszawa: 0.5124, and Wrocław: −0.1124. These were based on annual averages from 2013 to 2020.
Still, one needs to understand that it is not possible to attempt a properly designed OMI NO2 validation study.
3.5 Limitations and uncertainty of satellite NO2 observations over Poland
There are several key points to consider when discussing the limitations and uncertainties of satellite NO2 observations over Poland:
1. Spatial resolution: Satellite observations typically provide measurements over a relatively large area, ranging from several square kilometres to tens of kilometres. This coarse spatial resolution may not capture local variations in NO2 pollution levels, particularly in densely populated urban areas with high spatial heterogeneity.
2. Vertical sensitivity: Satellites can measure the total amount of NO2 along the entire vertical column of the atmosphere. However, they cannot distinguish the specific concentration levels at different altitudes within the column. This means that satellite data alone do not provide information on the near-surface concentrations of NO2, which are often of particular interest for assessing air quality and human exposure.
3. Interference from aerosols and other Species: Aerosols can scatter or absorb the solar radiation on which the satellite signals rely. This interference can cause errors in the retrieved NO2 concentrations. Other atmospheric species, such as ozone (O3) and formaldehyde (HCHO), can also contribute to the measured signals, complicating the interpretation of NO2 observations even further.
4. Calibration and retrieval algorithms: Satellite instruments require calibration in order to convert measured NO2 concentrations into meaningful NO2 concentrations. Instrument calibration uncertainties, as well as the algorithms used to extract NO2 concentrations from raw data, can introduce biases and uncertainties into the final measurements.
5. Cloud Cover and weather conditions: Cloud cover and bad weather can obstruct satellite observations, limiting data availability and accuracy. Overcast skies and persistent cloud cover can have a significant impact on the number of valid observations, especially in cloudy regions.
6. Temporal coverage and sampling frequency: Satellite observations may have temporal coverage and sampling frequency limitations. Observations may not adequately capture diurnal or short-term variations in NO2 pollution, depending on the satellite’s orbit and revisit time. In addition, the lifespan of NO2 in the atmosphere is only a few hours.
7. Ground-based measurements and validation: Ground-based measurements and validation are essential for verifying satellite observations, but they can also introduce uncertainties of their own. The challenges arise from the availability, the specificity of their location, and the representativeness of ground-based NO2 measurements in the same spatiotemporal domain as the satellite observations, thereby posing difficulties and contributing to the overall uncertainty in the satellite data.
Therefore, when interpreting satellite NO2 observations over Poland, it is essential to keep these limitations and uncertainties in mind. To obtain a more detailed vertical profile of NO2 concentrations, additional measurements from ground-based instruments, such as surface monitors and/or vertical profiling instruments, models, and other complementary approaches can help mitigate these limitations and provide a better understanding of the distribution of NO2 at different altitudes.
4 Discussion
The effect of the lockdown on NO2 levels in the atmosphere is expected to be highly dependent on the sources of NOx. In Poland, the majority of power plants runs on coal (e.g., Bełchatów) emitting a substantial amount of NOx (see SITE, 2023). The second major source of NOx is due to transportation. Local city NO2 levels are expected to lower during the COVID-19 because of reduced traffic (Koukouli et al., 2021; Solberg et al., 2021).
Our study shows that TROPOMI’s tropospheric column NO2 between March 16 and 30 June 2020 across Poland is similar to what was observed by Grzybowski et al. (2021), Solberg et al. (2021), Filonchyk et al. (2021), and Barré et al. (2021) for the same period. However, in the case of the Polish domain, these decreases are within the typical year-to-year variability (2010–2020). Low NO2 concentrations were clearly observed throughout the summer months, while high NO2 values were observed mainly during the winter months when energy is in high demand. This can also be attributed to reduced solar radiation due to substantial cloud cover and high solar zenith angles (Schneider et al., 2021) throughout the winter, resulting in the delayed removal of NO2 pollution from the atmosphere. Additionally, the low-level cloud cover (<2 km) over Poland during wintertime is significant (Wang et al., 2020). On the other hand, this could be due to the fact that NO2 stays in the atmosphere longer and emissions changes with the season, as a result traffic and residential heating.
As we already highlighted in the introduction, our approach to the COVID effect assessment differed from the existing literature in that, for the interpretation of the NO2 changes in 2020, we used not only TROPOMI but also OMI data. This allows us to look at the NO2 levels from a long-term perspective. The winter months (December, January, and February) show the highest variations (Figure 4), which is expected due to high energy demand during this period. Additionally, factors such as reduced solar radiation, increased cloud cover, and a high solar zenith angle contribute significantly to the slower removal of NO2 from the atmosphere. Moving into the spring months (March, April, and May), we did not observe a consistent reduction pattern. However, we noticed a steady decrease in NO2 levels, particularly in April and May, in cities like Białystok, Katowice, Kraków, Łódź, and Warszawa. This decline in these cities can be attributed to reduced traffic, industrial activities, and the implementation of air quality measures by local authorities.
The monthly NO2 levels in each city were compared in Figure 5 for the reference years 2010–2019 to 2020. Smaller bars, as seen in Poland, indicate less NO2 spread, implying that data from April to October is clustered around the mean NO2. Larger spreads indicate greater NO2 variability, which is common in the winter. Overall, the 2020 NO2 levels for all cities are within the standard deviation bars of the reference data. This suggests that during the months of April to October, the NO2 levels in Poland tend to remain relatively consistent and close to the average. In contrast, the winter months reveal more variation in NO2 levels, with a wider range of values observed. This evidence provides insights into the seasonal patterns of NO2 concentration in Poland, highlighting the periods of greater stability and variability in air pollution levels.
Our findings agree with existing studies—there was a decrease in NO2 levels in Poland during the COVID-19 lockdown period (Barré et al., 2021; Filonchyk et al., 2021; Grzybowski et al., 2021; Solberg et al., 2021). But we showed that it cannot be entirely attributed to COVID-19 and that it was within the typical variability of NO2 levels in Poland.
Here we used a consistent version of the TROPOMI NO2 dataset, which was not the case for earlier published papers based on the operational OFFL TROPOMI product. Our approach is novel because it is based on a decadal OMI dataset in addition to TROPOMI dataset. Although one could opine that in the early years of operation, we could have used the OMI dataset (from 2005 to 2020). But, data availability in Poland was low, and introducing 5 years of data would have no effect on the main finding.
We see negative relative changes for the majority of months in the entire domain of Poland and most of the cities (except Gdańsk). These are partly related to policy-induced emission reductions through the study period. The nature of the negative relative changes over Poland is what one should expect as to be in relation to COVID-19 lockdown; a decrease in April/May and steadily negative relative changes until September, back to the normal variability in September/October and a second strong decrease in November/December. The negative relative changes for the cities are however not following that nature. It is important to state here that satellites do not measure NO2 directly, but rather they measure the amount of sunlight that is absorbed or scattered by the Earth’s atmosphere. This data is then used to infer the concentration of various gases, including NO2, in the atmosphere. Therefore, the effect is not strong to be observed by TROPOMI, which agrees with the findings of Barré et al. (2021), Filonchyk et al. (2021), Grzybowski et al. (2021), and Solberg et al. (2021). The negligible effect of COVID-19 lockdown in Poland is not unique. We see also a very low effect, e.g., in Tehran, Iran (Sharifi & Felegari, 2022).
We assessed the need for weather normalisation of NO2 pollution by evaluating various meteorological parameters. Goldberg et al. (2020) suggested that solar zenith angle should be considered as a factor for weather normalisation. However, for our study domain, the difference in solar zenith angle between March and June was minimal. This means that the angle of the Sun was not a significant factor in weather normalization for this region. According to Minderyte et al. (2023), in Poland, the disparity in pollution levels between weekdays and weekends was not as pronounced as reported in previous research. Pollution levels in Warsaw, for example, were only 7%–15% lower on weekends compared to weekdays. At specific ranges, a normalization is required for wind speeds in the range (0–2 m/s, and 20 m/s or above), however, the prevailing wind speed in our case was considered moderate (between 3 and 8 m/s), which did not require weather normalization. Regarding wind direction, there was some variability across different months. Certain wind directions (NW, W, and SW) were found to transport more polluted air masses, while others (SE, E, and NE) transported cleaner air. Although there was variability in wind direction, the impact on air quality was not highly significant. The dominant temperature ranges were between 14°C–15°C during both 2019 and 2020, except for cooler temperatures in March (13°C–14°C) and slightly warmer temperatures in April, May, and June (15°C–17°C). Furthermore, warmer temperatures promote increased atmospheric activity and mixing between layers (Stull, 1988), which can lead to better dispersion of pollutants like NO2. Thus, temperature changes play a role in pollutant dispersion, with warmer temperatures (15°C–20°C) promoting better air quality. Moreover, the observed boundary layer heights in our study domain did not exceed the thresholds mentioned in previous research (Goldberg et al., 2020), as requiring weather normalization. The boundary layer heights in May and June of both 2019 and 2020 were similar, indicating a relatively stable atmosphere during that period. Correction for low boundary layer heights was only necessary sporadically, and such occurrences were mainly observed over the Baltic Sea.
Although one would expect the NO2 decrease to be explained by the nationwide lockdown and significant decline in economic activities (air, ship, and road transport, city public traffic), as well as many industrial activities, compensated by telecommuting work. Yet, we see that the columnar NO2 pollution decrease in Poland during COVID-19 was not significantly stronger than the long-term year-to-year variability (2010–2020). And therefore, in this context, we assess a negligible effect resulting from COVID-19 restrictions in Poland.
We emphasize that numerous studies have been conducted using TROPOMI, however disregarding the valuable contributions of OMI, which in our case shows advantage of using them together. Our findings align with previous research conducted by Bauwens et al. (2020) and Huang and Sun (2020). Our study specifically focuses on Poland and its major cities, known as one of the most polluted countries in Europe. We acknowledge that columnar NO2 retrievals have limitations and may not perfectly align with surface observations. However, this columnar to surface conversion is not in the scope of this paper. Moreover, the validation of OMI NO2 data has been extensively addressed in numerous studies (Compernolle et al., 2020; Ionov et al., 2008; Ma et al., 2013; Y. Wang et al., 2017; Wenig et al., 2008), and their findings are well-documented. Hence, our intention is not to replicate those studies.
The limitation of our study is related to the fact that we are not using the entire available TROPOMI dataset (2018–2022). We limited our dataset to only 2019–2020, as we wanted to use the same version of data. While we acknowledge that released in the future datasets might contain differences/improvements, we do not anticipate them to be significant enough to change the general founding of our study. The other limitation is that we used not all of the available OMI datasets (2005–2022). One might see it beneficial to include additional 5 years of data (before 2010) to make the trend of NO2 reduction even more visible. However, from climatological point of view, a decade of data provides adequate clarity in highlighting the long-term trend in the selected study area.
5 Conclusion
This study focused on the use of space observations to quantify the impact of the COVID-19 lockdown on NO2 pollution over Poland in relation to decadal variability. It contributes to a better understanding of COVID-19’s impact in Poland. We show that the decrease of NO2 levels in Poland during the lockdown was negligible, and it should be seen rather as a long-term effect of the government and local authorities’ successful measures undertaken to improve the air quality in Poland, which can be seen as well captured by OMI long-term trend of decrease of NO2 over Poland and Polish major cities. Furthermore, we found that wind speed can result in lower NO2 levels in Polish cities with relatively flat topography, but not in cities with more varied and hilly topography, which have more difficulty dispersing polluted air masses.
On the basis of 2010–2020 OMI and 2019–2020 TROPOMI NO2 data products we deeply assessed the reported in literature low effect on COVID-19 lockdown in Poland. Our research highlights the following most important findings:
• From 2010 to 2020, the long-term annual variability estimated from OMI tropospheric column NO2 indicates a declining trend for main major polluting cities in Central and South-Western Poland (e.g., Katowice, Łódź), while none for cities in Northern and North-Eastern Poland (e.g., Białystok), where pollution levels were in general lower for the past decade.
• Although the relative change in 2020 to the average 2010–2019 for the entire Poland domain and for the major Polish cities (Białystok, Gdańsk, Katowice, Kraków, Łódź, Wrocław, and Warszawa) shows a drop in OMI NO2 levels during the lockdown (mid-March to end of June), this change is not exceptional and lies within the year-to-year typical NO2 variability.
• The TROPOMI NO2 confirms that for the majority of the cities the NO2 drop during the COVID-19 lockdown was not clearly visible and did not follow the expected gradual change nor a step-wise drop.
Our research focuses on the effects of COVID-19 in Poland’s major cities, providing valuable insights into the current state of affairs, as the NO2 COVID-19 related reduction is mainly expected to be seen in cities due to reduced traffic (domestic, municipality, airborne).In the next step, we will focus on what was happening in the areas over other types of hotspots, specifically coal-driven power plants. Moreover, our long-term approach study is encouraging to be extended in the future for other Eastern European countries (e.g., Hungary, Slovakia, and Baltic countries), as those also reported in literature as “a very low COVID effect” countries.
Data availability statement
The datasets presented in this study can be found in online repositories. The names of the repository/repositories and accession number(s) can be found below: ICM of University of Warsaw (https://repod.icm.edu.pl) cited as: Ugboma and Stachlewska (2022) “NO2 dataset over Poland and main Polish cities based on OMI observations (2010–2020), TROPOMI observations (2018–2021) and CAMS service (2018–2021),” https://doi.org/10.18150/ZTD7FB, RepOD, V1.
Author contributions
Conceptualization, EAU and ISS; methodology, EAU, PS, and KS; software, EAU; formal analysis, EAU; investigation, EAU and ISS; resources, ISS; data curation, EAU; writing—original draft preparation, EAU and ISS; writing—review and editing, ISS, PS, and KS; visualization, EAU and ISS; supervision, ISS; project administration, ISS; funding acquisition, ISS and KS. All authors contributed to the article and approved the submitted version.
Funding
ISS and EAU acknowledge financial support from the European Space Agency ESA-ESTEC (POLIMOS grant No. 4000119961/16/NL/FF/mg). EAU acknowledges partial funding from the National Science Centre, Poland, in accordance with the Weave-UNISONO call of the Weave programme (Project No. 2021/03/Y/ST10/00206). The work of KS and PS was funded through the SIS-EO “Increasing relevance of EO for society by exploiting multi-sensor synergies” project (NILU #B121004). PS acknowledges partial funding from the European Space Agency within the framework of the CitySatAir project (4000131513/20/I-DT).
Acknowledgments
The free use of Sentinel-5P/TROPOMI and Aura/OMI data is acknowledged.
Conflict of interest
The authors declare that the research was conducted in the absence of any commercial or financial relationships that could be construed as a potential conflict of interest.
Publisher’s note
All claims expressed in this article are solely those of the authors and do not necessarily represent those of their affiliated organizations, or those of the publisher, the editors and the reviewers. Any product that may be evaluated in this article, or claim that may be made by its manufacturer, is not guaranteed or endorsed by the publisher.
Supplementary material
The Supplementary Material for this article can be found online at: https://www.frontiersin.org/articles/10.3389/fenvs.2023.1172753/full#supplementary-material
References
Balamurugan, V., Chen, J., Qu, Z., Bi, X., Gensheimer, J., Shekhar, A., et al. (2021). Tropospheric NO2 and O3 response to COVID-19 lockdown restrictions at the national and urban scales in Germany. J. Geophys. Res. Atmos. 126 (19), e2021JD035440–15. doi:10.1029/2021JD035440
Barré, J., Petetin, H., Colette, A., Guevara, M., Peuch, V. H., Rouil, L., et al. (2021). Estimating lockdown-induced European NO2 changes using satellite and surface observations and air quality models. Atmos. Chem. Phys. 21 (9), 7373–7394. doi:10.5194/acp-21-7373-2021
Bartnicki, J., Semeena, V. S., Mazur, A., and Zwoździak, J. (2018). Contribution of Poland to atmospheric nitrogen deposition to the Baltic Sea. Water, Air, Soil Pollut. 229 (11), 353. doi:10.1007/s11270-018-4009-5
Bassani, C., Vichi, F., Esposito, G., Montagnoli, M., Giusto, M., and Ianniello, A. (2021). Nitrogen dioxide reductions from satellite and surface observations during COVID-19 mitigation in Rome (Italy). Environ. Sci. Pollut. Res. 28 (18), 22981–23004. doi:10.1007/s11356-020-12141-9
Bauwens, M., Compernolle, S., Stavrakou, T., Müller, J. F., van Gent, J., Eskes, H., et al. (2020). Impact of coronavirus outbreak on NO2 pollution assessed using TROPOMI and OMI observations. Geophys. Res. Lett. 47 (11), e2020GL087978–9. doi:10.1029/2020GL087978
Biswal, A., Singh, V., Singh, S., Kesarkar, A. P., Ravindra, K., Sokhi, R. S., et al. (2021). COVID-19 lockdown-induced changes in NO2 levels across India observed by multi-satellite and surface observations. Atmos. Chem. Phys. 21 (6), 5235–5251. doi:10.5194/acp-21-5235-2021
Boersma, K. F., Eskes, H. J., Dirksen, R. J., Van Der A, R. J., Veefkind, J. P., Stammes, P., et al. (2011). An improved tropospheric NO2 column retrieval algorithm for the Ozone Monitoring Instrument. Atmos. Meas. Tech. 4 (9), 1905–1928. doi:10.5194/amt-4-1905-2011
Bucsela, E. J., Celarier, E. A., Wenig, M. O., Gleason, J. F., Veefkind, J. P., Boersma, K. F., et al. (2006). Algorithm for NO/sub 2/vertical column retrieval from the ozone monitoring instrument. IEEE Trans. Geoscience Remote Sens. 44 (5), 1245–1258. doi:10.1109/TGRS.2005.863715
Chen, T. M., Gokhale, J., Shofer, S., and Kuschner, W. G. (2007). Outdoor air pollution: Nitrogen dioxide, sulfur dioxide, and carbon monoxide health effects. Am. J. Med. Sci. 333 (4), 249–256. doi:10.1097/MAJ.0b013e31803b900f
Compernolle, S., Verhoelst, T., Pinardi, G., Granville, J., Hubert, D., Keppens, A., et al. (2020). Validation of Aura-OMI QA4ECV NO2 climate data records with ground-based DOAS networks: the role of measurement and comparison uncertainties. Atmos. Chem. Phys. 20 (13), 8017–8045. doi:10.5194/acp-20-8017-2020
Dirksen, R. J., Boersma, K. F., Eskes, H. J., Ionov, D. V., Bucsela, E. J., Levelt, P. F., et al. (2011). Evaluation of stratospheric NO2 retrieved from the Ozone Monitoring Instrument: Intercomparison, diurnal cycle, and trending. J. Geophys. Res. Atmos. 116 (8), D08305–D08322. doi:10.1029/2010JD014943
Dockery, D. W., Pope, C. A., Xu, X., Spengler, J. D., Ware, J. H., Fay, M. E., et al. (1993). An association between air pollution and mortality in six US cities. N. Engl. J. Med. 329 (1), 1753–1759.
Eskes, H., Geffen, J. V., Boersma, F., Eichmann, K.-U., Apituley, A., Pedergnana, M., et al. (2020). “Sentinel-5 precursor/TROPOMI level 2 product user manual nitrogendioxide,”. S5P-KNMI-L2-0021-MA.
Fei, S., Wagan, R. A., Hasnain, A., Hussain, A., Bhatti, U. A., and Elahi, E. (2022). Spatiotemporal impact of the COVID-19 pandemic lockdown on air quality pattern in Nanjing, China. Front. Environ. Sci. 10, 1–6. doi:10.16250/j.32.1374.2021297
Filonchyk, M., Hurynovich, V., Yan, H., Gusev, A., and Shpilevskaya, N. (2020). Impact assessment of COVID-19 on variations of SO2, NO2, CO and AOD over East China. Aerosol Air Qual. Res. 20 (7), 1530–1540. doi:10.4209/aaqr.2020.05.0226
Filonchyk, M., Hurynovich, V., and Yan, H. (2021). Impact of covid-19 lockdown on air quality in the Poland, eastern europe. Environ. Res. 198, 110454. doi:10.1016/j.envres.2020.110454
Filonchyk, M., Yan, H., and Li, X. (2018). Temporal and spatial variation of particulate matter and its correlation with other criteria of air pollutants in Lanzhou, China, in spring-summer periods. Atmos. Pollut. Res. 9 (6), 1100–1110. doi:10.1016/j.apr.2018.04.011
Geddes, J. A., Martin, R. V., Boys, B. L., and van Donkelaar, A. (2016). Long-term trends worldwide in ambient NO2 concentrations inferred from satellite observations. Environ. Health Perspect. 124 (3), 281–289. doi:10.1289/ehp.1409567
Goldberg, D. L., Anenberg, S. C., Griffin, D., McLinden, C. A., Lu, Z., and Streets, D. G. (2020). Disentangling the impact of the COVID-19 lockdowns on urban NO2 from natural variability. Geophys. Res. Lett. 47 (17), e2020GL089269. doi:10.1029/2020GL089269
Grzybowski, P. T., Markowicz, K. M., and Musiał, J. P. (2021). Reduction of air pollution in Poland in spring 2020 during the lockdown caused by the Covid-19 pandemic. Remote Sens. 13 (18), 1–23. doi:10.3390/rs13183784
Huang, G., and Sun, K. (2020). Non-negligible impacts of clean air regulations on the reduction of tropospheric NO2 over East China during the COVID-19 pandemic observed by OMI and TROPOMI. Sci. Total Environ. 745, 141023. doi:10.1016/j.scitotenv.2020.141023
Ionov, D. V., Timofeyev, Y. M., Sinyakov, V. P., Semenov, V. K., Goutail, F., Pommereau, J. P., et al. (2008). Ground-based validation of EOS-Aura OMI NO2 vertical column data in the midlatitude mountain ranges of Tien Shan (Kyrgyzstan) and Alps (France). J. Geophys. Res. Atmos. 113 (15), D15S08–14. doi:10.1029/2007JD008659
Karumuri, R. K., Dasari, H. P., Gandham, H., Viswanadhapalli, Y., Madineni, V. R., and Hoteit, I. (2022). Impact of COVID-19 lockdown on the ambient air-pollutants over the Arabian Peninsula. Front. Environ. Sci. 10, 1–13. doi:10.3389/fenvs.2022.963145
Kawka, M., Struzewska, J., and Kaminski, J. W. (2021). Spatial and temporal variation of NO2 Vertical Column Densities (VCDs) over Poland: Comparison of the Sentinel-5P TROPOMI observations and the GEM-AQ model simulations. Atmosphere 12 (7). doi:10.3390/atmos12070896
Koukouli, M. E., Skoulidou, I., Karavias, A., Parcharidis, I., Balis, D., Manders, A., et al. (2021). Sudden changes in nitrogen dioxide emissions over Greece due to lockdown after the outbreak of COVID-19. Atmos. Chem. Phys. 21 (3), 1759–1774. doi:10.5194/acp-21-1759-2021
Krotkov, N., Lamsal, L., Marchenko, S., Celarier, E., Bucsela, E., Swartz, W., et al. (2019). NASA goddard space flight center and the OMI/Aura NO2 cloud-screened total and tropospheric column L3 global gridded 0.25 degree x 0.25 degree V3. Maryland: Goddard Earth Sciences Data and Information Services Center. doi:10.5067/aura/omi/data3007
Lange, K., Richter, A., and Burrows, J. (2021). Variability of nitrogen oxide emission fluxes and lifetimes estimated from Sentinel-5P TROPOMI observations. Atmos. Chem. Phys. Discuss. 2 (2), 1–32. doi:10.5194/acp-2021-273
Levelt, P., Van Den Oord, G. H. J., Dobber, M., Mälkki, A., Visser, H., Johan, D., et al. (2006). The ozone monitoring instrument. IEEE Trans. Geoscience Remote Sens. 44 (5), 1093–1101. doi:10.1109/TGRS.2006.872333
Li, H., Tan, X., Guo, J., Zhu, K., and Huang, C. (2019). Study on an implementation scheme of synergistic emission reduction of CO 2 and air pollutants in China’s steel industry. Sustain. Switz. 11 (2), 352. doi:10.3390/su11020352
Lim, S. S., Vos, T., Flaxman, A. D., Danaei, G., Shibuya, K., Adair-Rohani, H., et al. (2012). A comparative risk assessment of burden of disease and injury attributable to 67 risk factors and risk factor clusters in 21 regions, 1990-2010: A systematic analysis for the global burden of disease study 2010. Lancet 380 (9859), 2224–2260. doi:10.1016/S0140-6736(12)61766-8
Ma, J. Z., Beirle, S., Jin, J. L., Shaiganfar, R., Yan, P., and Wagner, T. (2013). Tropospheric NO&lt;sub&gt;2&lt;/sub&gt; vertical column densities over beijing: Results of the first three years of ground-based MAX-DOAS measurements (2008–2011) and satellite validation. Atmos. Chem. Phys. 13 (3), 1547–1567. doi:10.5194/acp-13-1547-2013
Manisalidis, I., Stavropoulou, E., Stavropoulos, A., and Bezirtzoglou, E. (2020). Environmental and health impacts of air pollution: A review. Front. Public Health 8, 14–13. doi:10.3389/fpubh.2020.00014
Minderytė, A., Ugboma, E. A., Mirza-Montoro, F., Stachlewska, I. S., and Byčenkienė, S. (2023). “Contrasting physical properties and source apportionment of black carbon in two urban environments,” in Heliyon (Cambridge: Cell press).
Park, J. H., Lee, S. H., Yun, S. J., Ryu, S., Choi, S. W., Kim, H. J., et al. (2018). Air pollutants and atmospheric pressure increased risk of ED visit for spontaneous pneumothorax. Am. J. Emerg. Med. 36 (12), 2249–2253. doi:10.1016/j.ajem.2018.04.020
Petetin, H., Bowdalo, D., Soret, A., Guevara, M., Jorba, O., Serradell, K., et al. (2020). Meteorology-normalized impact of the COVID-19 lockdown upon NO&lt;sub&gt;2&lt;/sub&gt; pollution in Spain. Atmos. Chem. Phys. 20 (18), 11119–11141. doi:10.5194/acp-20-11119-2020
Schneider, P., Hamer, P. D., Kylling, A., Shetty, S., and Stebel, K. (2021). Spatiotemporal patterns in data availability of the sentinel-5p no2 product over urban areas in Norway. Remote Sens. 13 (11), 2095. doi:10.3390/rs13112095
Sharifi, A., and Felegari, S. (2022). Nitrogen dioxide (NO2) pollution monitoring with sentinel-5P satellite imagery over during the coronavirus pandemic (case study: Tehran). Remote Sens. Lett. 13 (10), 1029–1039. doi:10.1080/2150704X.2022.2120780
SITE (2023). E-PRTR/LCP registry. Retrieved February 3, 2023, from https://industry.eea.europa.eu/industrial-site/environmental-information?facilityInspireId=PL.MŚ/000000349.FACILITY&siteInspireId=PL.MŚ/000000337.
Solberg, S., Walker, S. E., Schneider, P., and Guerreiro, C. (2021). Quantifying the impact of the Covid-19 lockdown measures on nitrogen dioxide levels throughout Europe. Atmosphere 12 (2), 1–20. doi:10.3390/atmos12020131
Solomon, S., Portmann, R. W., Sanders, R. W., Daniel, J. S., Madsen, W., Bartram, B., et al. (1999). On the role of nitrogen dioxide in the absorption of solar radiation. J. Geophys. Res. Atmos. 104, 12047–12058. doi:10.1029/1999JD900035
Stebel, K., Stachlewska, I. S., Nemuc, A., Horálek, J., Schneider, P., Ajtai, N., et al. (2021). SAMIRA-SAtellite based Monitoring Initiative for Regional Air quality. Remote Sens. 13 (11), 1–23. doi:10.3390/rs13112219
Stull, R. B. (1988). An introduction to boundary layer meteorology. 1st ed. Netherlands: Kluwer Academic Publishers. doi:10.1007/978-94-009-3027-8
Szymankiewicz, K., Kaminski, J. W., and Struzewska, J. (2021). Application of satellite observations and air quality modelling to validation of NOx anthropogenic emep emissions inventory over central Europe. Atmosphere 12 (11), 1465. doi:10.3390/atmos12111465
Ugboma, E. A., and Nwobi, F. N. (2017). Spatial distribution of NO2 concentration in southeastern region of Nigeria. Acad. J. Appl. Math. Sci. 3 (1), 1–7.
Ugboma, E., and Stachlewska, I. (2022). NO2 dataset over Poland and main Polish cities based on OMI observations (2010-2020), TROPOMI observations (2018-2021) and CAMS service (2018-2021). doi:10.18150/ZTD7FB
van Geffen, J., Eskes, H., Compernolle, S., Pinardi, G., Verhoelst, T., Lambert, J. C., et al. (2022). Sentinel-5P TROPOMI NO&lt;sub&gt;2&lt;/sub&gt; retrieval: Impact of version v2.2 improvements and comparisons with OMI and ground-based data. Atmos. Meas. Tech. 15 (7), 2037–2060. doi:10.5194/amt-15-2037-2022
van Geffen, J., Folkert Boersma, K., Eskes, H., Sneep, M., Ter Linden, M., Zara, M., et al. (2020). S5P TROPOMI NO&lt;sub&gt;2&lt;/sub&gt; slant column retrieval: Method, stability, uncertainties and comparisons with OMI. Atmos. Meas. Tech. 13 (3), 1315–1335. doi:10.5194/amt-13-1315-2020
Vandaele, A. C., Hermans, C., Simon, P. C., Carleer, M., Colin, R., Fally, S., et al. (1998). Measurements of the NO2 absorption cross-section from 42 000 cm-1 to 10 000 cm-1 (238-1000 nm) at 220 K and 294 K. J. Quantitative Spectrosc. Radiat. Transf. 59 (3–5), 171–184. doi:10.1016/S0022-4073(97)00168-4
Veefkind, J. P., Aben, I., McMullan, K., Förster, H., de Vries, J., Otter, G., et al. (2012). TROPOMI on the ESA sentinel-5 precursor: A gmes mission for global observations of the atmospheric composition for climate, air quality and ozone layer applications. Remote Sens. Environ. 120, 70–83. doi:10.1016/j.rse.2011.09.027
Verhoelst, T., Compernolle, S., Pinardi, G., Lambert, J. C., Eskes, H. J., Eichmann, K. U., et al. (2021). Ground-based validation of the Copernicus Sentinel-5P TROPOMI NO&lt;sub&gt;2&lt;/sub&gt; measurements with the NDACC ZSL-DOAS, MAX-DOAS and Pandonia global networks. Atmos. Meas. Tech. 14 (1), 481–510. doi:10.5194/amt-14-481-2021
Wang, D., Stachlewska, I. S., Song, X., Heese, B., and Nemuc, A. (2020). Variability of the boundary layer over an urban continental site based on 10 years of active remote sensing observations in Warsaw. Remote Sens. 12 (2), 1–33. doi:10.3390/rs12020340
Wang, Y., Beirle, S., Lampel, J., Koukouli, M., De Smedt, I., Theys, N., et al. (2017). Validation of OMI, GOME-2A and GOME-2B tropospheric NO&lt;sub&gt;2&lt;/sub&gt;, SO&lt;sub&gt;2&lt;/sub&gt; and HCHO products using MAX-DOAS observations from 2011 to 2014 in wuxi, China: Investigation of the effects of priori profiles and aerosols on the satellite products. Atmos. Chem. Phys. 17 (8), 5007–5033. doi:10.5194/acp-17-5007-2017
Wenig, M. O., Cede, A. M., Bucsela, E. J., Celarier, E. A., Boersma, K. F., Veefkind, J. P., et al. (2008). Validation of OMI tropospheric NO2 column densities using direct-Sun mode Brewer measurements at NASA Goddard Space Flight Center. J. Geophys. Res. Atmos. 113 (16), D16S45–10. doi:10.1029/2007JD008988
Keywords: air pollution, COVID-19, NO2, TROPOMI, OMI, Poland
Citation: Ugboma EA, Stachlewska IS, Schneider P and Stebel K (2023) Satellite observations showed a negligible reduction in NO2 pollution due to COVID-19 lockdown over Poland. Front. Environ. Sci. 11:1172753. doi: 10.3389/fenvs.2023.1172753
Received: 23 February 2023; Accepted: 19 June 2023;
Published: 28 June 2023.
Edited by:
Tirthankar Banerjee, Banaras Hindu University, IndiaReviewed by:
Alireza Sharifi, Shahid Rajaee Teacher Training University, IranHarshita Baranwal, Banaras Hindu University, India
Yogesh Tiwari, Indian Institute of Tropical Meteorology (IITM), India
Copyright © 2023 Ugboma, Stachlewska, Schneider and Stebel. This is an open-access article distributed under the terms of the Creative Commons Attribution License (CC BY). The use, distribution or reproduction in other forums is permitted, provided the original author(s) and the copyright owner(s) are credited and that the original publication in this journal is cited, in accordance with accepted academic practice. No use, distribution or reproduction is permitted which does not comply with these terms.
*Correspondence: Iwona S. Stachlewska, aXdvbmEuc3RhY2hsZXdza2FAZnV3LmVkdS5wbA==