- 1Engineering Science Program, Louisiana State University, Baton Rouge, LA, United States
- 2LaHouse Resource Center, Department of Biological and Agricultural Engineering, Louisiana State University Agricultural Center, Baton Rouge, LA, United States
- 3Department of Oceanography & Coastal Sciences, Louisiana State University, Baton Rouge, LA, United States
- 4Coastal Studies Institute, Louisiana State University, Baton Rouge, LA, United States
- 5Department of Geoscience, University of North Alabama, Florence, AL, United States
An accurate economic loss assessment for natural hazards is vital for planning, mitigation, and actuarial purposes. The widespread and costly nature of flood hazards, with the economically disadvantaged disproportionately victimized population, makes flood risk assessment particularly important. Here, flood risk is assessed as incurred by the homeowner vs. the flood insurer for insured U.S. properties through the derivation of average annual loss (AAL). AAL is estimated and partitioned using Monte Carlo simulation at the individual home scale, considering insurance coverage and deductible, and the first-floor height (i.e., height of the first floor above the ground), to determine the AAL proportion of homeowners (i.e., apportionment factor) for building and contents, distinguished from that borne by the insurer. In general, AAL estimates suggest that a large portion of the U.S. property flood risk is borne by the flood insurer. The flood insurance policy deductible directly influences the apportionment factor, whereby higher deductibles leave homeowners with a higher annual risk; however, the apportionment factor remains relatively insensitive to coverage values, especially for higher coverage amounts. The homeowner’s flood risk is further reduced by freeboard, with AAL, following an exponential decay trend as freeboard increases. These results reveal new perspectives about how flood insurance protects homeowners from flood risk. In general, the results enhance the proactive decision-making process that allows homeowners to self-assess their degree of preparation and vulnerability to the devastating economic impacts of flood.
1 Introduction
Flooding is among the costliest natural hazards in the U.S. and globally, in terms of loss of life and property, with impacts felt disproportionately by the economically disadvantaged (United Nations, 2004). Flooding affected 99% of U.S. counties between 1996 and 2019 (FEMA, 2021). The 36 flood events in the U.S. from 1980 to 2021 that each caused over $1 billion (consumer price index- (CPI-) adjusted to 2020$) in damage generated a total of more than $173.7 billion (CPI-adjusted) (National Oceanic and Atmospheric Administration (NOAA) 2022) on impact. Even worse, flood vulnerability in the U.S. is likely much greater than that currently realized as Wing et al. (2018) found that FEMA flood maps may undercount populations who live in the 100-year floodplain by as much as 300%, with 41 million being a likely number.
The quantification of flood losses is important for monitoring and mitigating flood hazards across space and time (Mostafiz et al., 2022a). Flood losses have recently been quantified using socioeconomic factors for individual households (Mohor et al., 2021) and communities (Nofal and van de Lindt, 2020; 2021). In light of the ever-increasing value of property at risk, policymakers are increasingly adopting the approach of integrated flood risk management, which includes the engagement of households in flood insurance and structural flood protection measures at the micro-level (Merz et al., 2010; Bubeck et al., 2012; Ward et al., 2013). The availability of high-resolution spatio-temporal data and computational advancement in recent years has also provided an opportunity to enhance flood hazard modeling (Sampson et al., 2015; Winsemius et al., 2016; Wing et al., 2017; Backes et al., 2019). However, these efforts are challenged by continually increasing flood impacts as the population in flood-vulnerable areas increases (Hallegatte et al., 2013; Neumann et al., 2015). Climate change effects are also considered agents of the changing flood risk (Aerts and Botzen, 2011; Pryce and Chen, 2011; Hirabayashi et al., 2013; Crick et al., 2018; Hudson et al., 2019; Nofal and van de Lindt, 2021) that make quantification difficult. Consecutively, the changing flood risk may demand that flood insurance coverage be augmented, particularly as warming is expected to exacerbate the severity and frequency of hydrometeorological events (Intergovernmental Panel on Climate Change (IPCC), 2012; Hirabayashi et al., 2013; Hattermann et al., 2014; Kundzewicz et al., 2014; Hattermann et al., 2016; Arnell and Gosling, 2016; Löschner et al., 2017). The extent to which insurance and homeowners pay for the impacts of flood losses has not been well-established (Rahim et al., 2021).
Existing research tends to emphasize the quantification of total flood loss rather than the direct economic impact on homeowners. Most research studies on flood loss that include the economic impact of flood insurance focus on the premium setting. Hsu et al. (2011) applied an integrated flood risk assessment model, where the average annual loss (AAL) and risk tolerance are considered when setting the premium. In the first macro-scale quantification of risk-based premiums for residences prone to either storm surge or inland flooding, Michel-Kerjan et al. (2015) used commercially developed probabilistic catastrophe models to conclude that the National Flood Insurance Program (NFIP) may overcharge or undercharge homeowners relative to the expected loss that a representative private insurer could offer. Zhao et al. (2016) examined the affordability of flood insurance under the Biggert-Waters Flood Insurance Reform Act. Ermolieva et al. (2016) modeled residential insurance premiums using a well-integrated catastrophe risk management model that considers a range of offerings from the insurer, involvement of individuals, and the complex interplay between multivariate spatially and temporally explicit probability distributions of flood losses and risk exposures of the stakeholders. Ermolieva et al. (2016) found this technique to be advantageous over the traditional AAL-based approach because of the integration of spatially explicit financial arrangements for sharing flood losses, which guarantees the program’s solvency under all relevant flood scenarios rather than one average event. However, Ermolieva et al. (2016) did not apportion the flood risk between the homeowner and insurer. Similarly, research that focuses on the cost-benefit analysis of flood mitigation techniques through the reduction of flood AAL either does not specifically consider the homeowner's benefit (de Moel et al., 2014; Ward et al., 2017; de Ruig et al., 2020) or considers that the entire AAL is borne by the homeowner (Foster, 1976; Xian et al., 2017; Zarekarizi et al., 2020). Agent-based modeling approaches have also been used to enhance the understanding of flood insurance decision-making, particularly the role of public–private partnerships in the United Kingdom (Dubbelboer et al., 2017) and the interactive relationships between costs, premiums, and housing prices in the U.S. (de Koning et al., 2019). However, little attention has been given to the role of insurance coverage and deductible choices and their effects on the homeowner flood risk.
The literature that focuses on the effects of coverage on the owner economic experience of flooding typically does so qualitatively or in a limited fashion. Dávila et al. (2014) noted the effectiveness of withholding of coverage as a means of restricting development in flood-vulnerable areas in Europe. Sandink et al. (2016) called for increased awareness at the household level in Canada, regarding the specifics of flood insurance coverage and an increased share of the expense through risk-based insurance pricing and conditions. Thistlethwaite et al. (2020) agreed that Canadians have limited knowledge of flood insurance coverage that they tend to view insurance and individual-level protection measures as mutually exclusive and that they depend on governments for fund flood recovery. Davies (2016) also lamented the prevailing tendency for Canadians to rely on governmental disaster assistance and recommended wider private insurance coverage and increased premiums for public flood insurance. Although Song and Wang (2020) and Zhao et al. (2020) developed a framework for relating catastrophe insurance to the community recovery process qualitatively, the model was not developed specifically for flooding. Kousky (2019) summarized the role of insurance coverage in the existing literature by noting its enhancement of recovery outcomes (also supported by Mitsova et al. (2019) for hurricane outcomes) and its lesser impacts on risk reduction. Miškić et al. (2017) seemed to somewhat disagree, arguing that the policy can stimulate insurance coverage, which can, in turn, reduce the risk. A key point is that these conclusions were reached for natural hazards in general; there remains a dearth of research that links flood insurance coverage in the U.S. quantitatively to flood recovery outcomes.
This research study generates single-family home flood risk estimates to derive apportionment factors (i.e., homeowners’ proportion of AAL). Flood loss events are modeled at the individual building level using Monte Carlo simulation (Rahman et al., 2002; Brodie, 2013; Qi et al., 2013; Yu et al., 2013; Hennequin et al., 2018; Kind et al., 2020; Gnan et al., 2022a; 2022b; Rahim et al., 2022), in which the flood hazard is characterized by the Gumbel extreme value distribution function (Singh et al., 2018; Bhat et al., 2019; Prasanchum et al., 2020; Kim and Lee, 2021; Manfreda et al., 2021; Al Assi et al., 2022a; 2022b; 2023; Mostafiz et al., 2022b; Gnan et al., 2022c; Mostafiz et al., 2022c; Mostafiz et al., 2022d; Friedland et al., 2023). A depth-damage function (DDF) from the United States Army Corps of Engineers (USACE, 2000) is used to estimate the loss of each flood event. The losses are apportioned to the homeowner or the insurer based on the insurance parameters (i.e., coverage and deductible). The homeowner or insurer AAL portion and the apportionment factor are calculated by averaging the homeowner or insurer loss for all flood events and dividing the homeowner AAL portion by the total AAL, respectively. Two case studies are presented here to demonstrate the methodology. The first case study is conducted with a hypothetical one-story home located in Metairie, Louisiana. The second case study includes the spatial heterogeneity in building analysis where the buildings located in the special flood hazard area (SFHA) are considered. For both cases, the apportionment factors are estimated using different coverage, deductible, and freeboard (i.e., elevation of the first floor above the base flood elevation) scenarios. The effect of coverage and deductible on the apportionment factor is examined. Furthermore, the effect of freeboard on the estimated AAL is also evaluated.
The contribution of this paper is the novel characterization of apportionment factors for homeowner-borne annual flood risk based on flood insurance deductible and coverage values. Researchers will find utility from this method to better estimate the impacts of floods experienced by homeowners. The results from this work will greatly enhance webtools and education/outreach materials for the general public, realtors, homebuilders, and community leaders. Educational information derived from this research will assist individual homeowners in making more informed decisions regarding the purchase of flood insurance, and the selection of insurance coverage and the associated deductible.
2 Method
The method consists of characterizing the flood hazard at a defined location using the Gumbel extreme value distribution and estimating flood AAL using Monte Carlo simulation. The simulation generates random flood event probabilities, and the corresponding losses are calculated using an appropriate DDF, with the damage apportioned to either the homeowner or the flood insurer for each flood event based on insurance coverage and deductible scenarios. The apportioned losses are averaged over all flood events to estimate AAL for the homeowner and flood insurer.
2.1 Flood hazard parameters
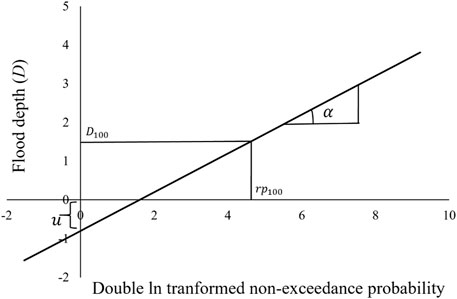
To estimate the annual flood hazard occurrence probability at the individual building level, the Gumbel extreme value distribution function is used, with special attention given to the location (
Solving the CDF yields the quantile of the distribution as follows:
where
The method used for the Gumbel parameter (
For most residential buildings, the
2.2 Depth-damage function
Flood depths are converted to loss values using DDF. DDFs have been developed based on insurance claim data, post-flood surveys, and expert solicitation (USACE, 2015). The USACE (2000) DDF is considered one of the empirical sources of DDF in the U.S. (Mostafiz et al., 2021a; 2021b; Gnan et al., 2022a). A DDF shows the relationship between flood depth (
The USACE (2000) DDF is used in this study to convert
where
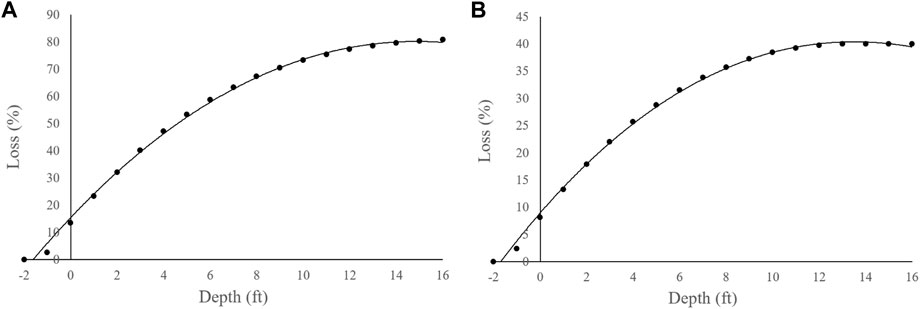
FIGURE 2. USACE (2000) DDF for a one-story home without basement: (A) building and (B) contents.
2.3 Flood risk estimation
AAL is estimated as the mean of the loss vs. annual exceedance probability distribution (Gnan et al., 2022a; 2022b) and forms the basis for flood risk quantification and evaluation of risk mitigation measures (Dalezios, 2017). It is generally calculated for loss type
where
This study approximates the integral solution using Monte Carlo simulation of
Using the simulated probability from Eq. 7, the flood depth for each event (
The
2.4 Homeowner AAL apportionment
To evaluate the effect of coverage and deductible on loss apportionment factors, an array of coverage and deductible values and their combinations are considered for multiple scenarios. The values for insurance coverage and deductible in the scenario under consideration are input so that
1) If the loss does not exceed the deductible, then the homeowner bears the entire loss and the flood insurer’s share is zero;
2) If the loss exceeds the deductible but not the insurance coverage, the homeowner’s portion of the loss is considered to be the deductible and the flood insurer’s portion is the difference between the loss and the deductible; and
3) If the loss exceeds the insurance coverage, the homeowner’s portion of the loss is equal to the deductible plus the difference between the loss and the coverage, and the flood insurer portion of the loss is the difference between the coverage and the deductible.
The values from
2.5 Freeboard effects
The effect of freeboard is considered by increasing
3 Case study
3.1 Single building analysis
A one-story, single-family home with 2,500 square feet of living area in Metairie, Louisiana, a suburb of New Orleans, is selected for analysis. The ground elevation is -7.0 feet NAVD88 and the base flood elevation (BFE; i.e., the 100-year flood elevation) is -4 feet NAVD88, giving a minimum FFH of 3 feet. Freeboards of 0, +1, +2, +3, and +4 feet above the BFE were considered to evaluate the effect of freeboard on apportionment factors. The unit replacement cost of a single-family residence in the New Orleans area is $110 per square foot (Doheny, 2021), which yields an estimated
Flood depth grids for this site are developed by FEMA through its Risk MAP (FEMA, 2022) program. Flood depths for 10-, 50-, 100-, and 500-year return periods, with 0.1, 0.02, 0.01, and 0.002 AEPs, are 2.3, 2.8, 3.1, and 3.6 feet above the local ground, respectively. As the building is located in a levee-protected area, the flood depths are relatively large.
Monte Carlo simulation is run for 50,000 flood events. Random AEPs are generated for each flood event. The AEP is converted to flood depth using
For single-family homes, $60,000 is the basic building coverage and $25,000 is the basic contents coverage, with maximum limits of $250,000 for the building and $100,000 for contents (NFIP, 2021). NFIP (2021) requires a minimum and maximum deductible of $1,000 and $10,000, respectively, for the building and contents. For these reasons, building coverage of $60,000, $75,000, $100,000, $125,000, $150,000, $175,000, $200,000, $225,000, and $250,000; content coverage of $25,000, $50,000, $75,000, and $100,000; and building and content deductibles of $1,000, $1,500, $2,000, $3,000, $5,000, $7,000, and $10,000 were selected for Monte Carlo simulation. Thus, for the building and contents, 315 and 140 scenarios, respectively, of coverage, deductible, and freeboard were considered. For each scenario, Monte Carlo simulation is run and the partitioned AALs and the homeowner apportionment factors are estimated using Eqs 11–13.
3.2 Analysis with spatial heterogeneity
As the buildings are located in the SFHA, base flood depth (BFD) will exceed zero. Substituting p for the 100-year return period, for which base flood depth (BFD) is assumed to exceed zero in the SFHA (Eq. 14), into Eq. 2 yields Eq. 15:
The
4 Results
4.1 Flood risk estimation
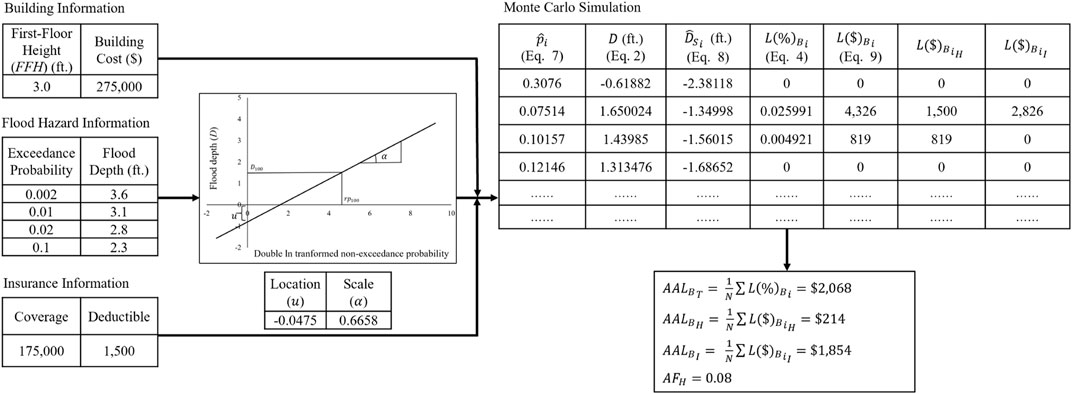
For each combination of coverage, deductible, and freeboard, homeowner building and content AAL and associated apportionment factors are estimated through Monte Carlo simulation. Figure 3 shows an excerpt of the building AAL estimation process for the “no freeboard” scenario with building coverage and deductible values of $175,000 and $1,500, respectively.
4.2 Single building analysis
4.2.1 Flood hazard parameters
Given the high magnitude of flood depths, the Gumbel parameter estimation requires several iterations to achieve a negative value for
4.2.2 Homeowner AAL apportionment
By definition, the apportionment factor is 1.0 for uninsured homes, meaning the homeowner is accountable for the total flood risk. The effect of deductible and coverage on the apportionment factor is shown in Figure 4 for the no freeboard scenario. When the building and content coverage exceed $100,000 and $50,000, respectively, the homeowner apportionment factor appears relatively insensitive to the coverage amount for a given deductible (Figures 4A, B). The results show that for a deductible value of $1,500,
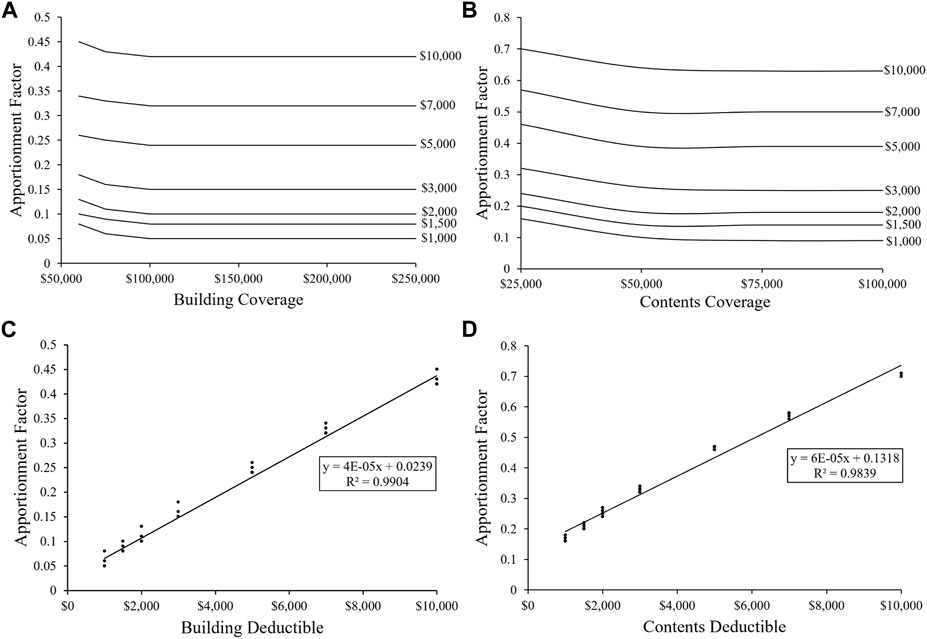
FIGURE 4. Effect of coverage and deductible on the homeowner apportionment factor: (A) change in the apportionment factor with building coverage for each deductible, (B) change in the apportionment factor with content coverage for each deductible, (C) change in the apportionment factor with the building deductible where each point represents a coverage, and (D) change in the apportionment factor with content deductible where each point represents a coverage.
Figures 4C, D show the effect of deductibles on the apportionment factor for the building and contents, respectively. The deductible value is a statistically significant (
4.2.3 Freeboard effects
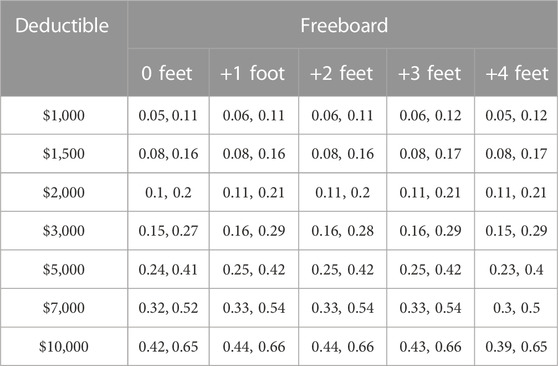
Figures 5A, B show the effect of a freeboard on the homeowner apportionment factor with the increasing freeboard for the building and contents, respectively, where the apportionment factors are averaged over coverage values for each deductible. The homeowner apportionment factor appears to be relatively insensitive to freeboard. For example, the results show that for a $1,500 deductible,
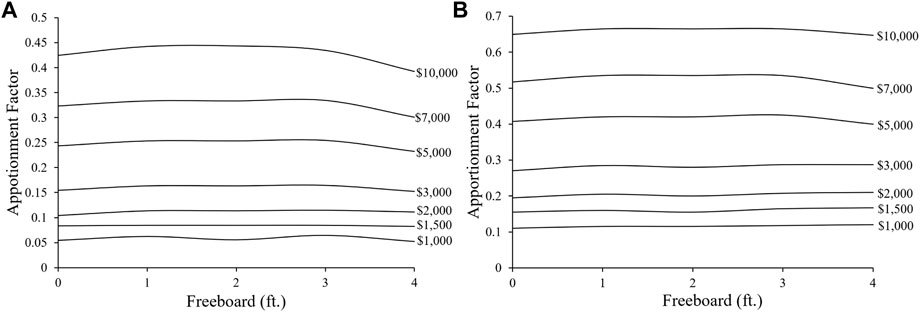
FIGURE 5. Effect of freeboard on the homeowner AAL apportionment factor: (A) change in the apportionment factor with a freeboard for each building deductible and (B) change in the apportionment factor with a freeboard for each content deductible.
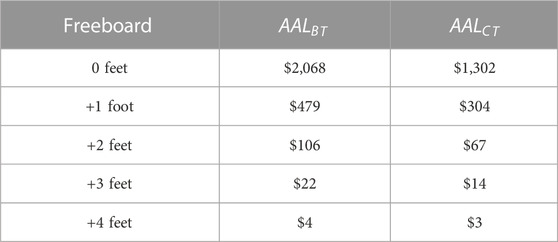
Table 2 provides the total AAL values for the building (
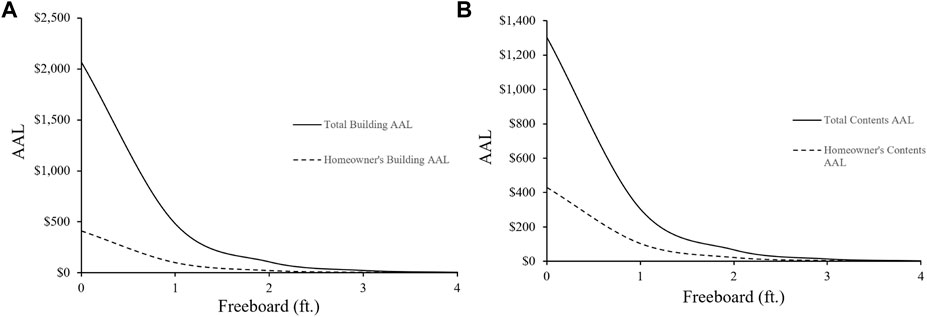
FIGURE 6. Effect of freeboard on the AAL: (A) exponential decay trend of the total and homeowner’s building AAL and (B) exponential decay trend of the total and homeowner’s content AAL.
Figure 6 also shows the trend of the homeowner portion of AAL for the building (
4.3 Spatial heterogeneity analysis
4.3.1 Exploratory data analysis
Before fitting any models, exploratory data analysis (EDA) is conducted to gain visual insights and understand the relationships within the data. One of the steps is to prepare scatterplots, which provide visual representations of the data, allowing for the examination of the effects of hazard parameters, insurance parameters, and the building’s unit replacement cost.
Figure 7 shows scatterplots depicting the relationship between three variables, total AAL ($), homeowner AAL ($), and the apportionment factor (AF), with respect to the α-parameter. The plots with respect to the
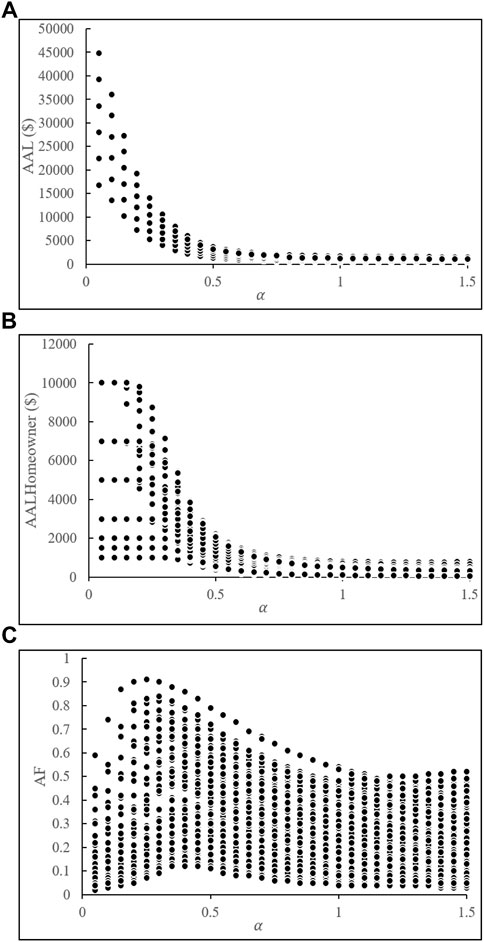
FIGURE 7. Scatterplots of (A) total AAL ($), (B) homeowner AAL ($), and (C) apportionment factor (AF) with the
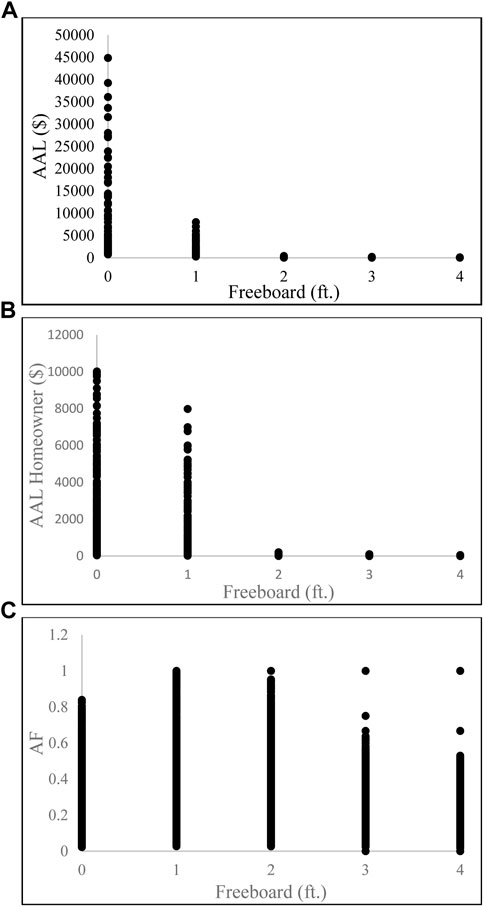
FIGURE 8. Scatterplots of (A) total AAL ($), (B) homeowner AAL ($), and (C) apportionment factor (AF) with a freeboard.
Figure 9 focuses on the effect of the coverage parameter. The scatterplots suggest that the coverage value does not appear to have any significant impact on the total AAL ($), homeowner AAL ($), or AF. Regardless of the coverage amount, these variables remain relatively stable. Figure 10 shows the effect of the deductible parameter. The scatterplots clearly illustrate that the deductible has a considerable influence on the estimation of the homeowner AAL ($) and subsequently the AF. As the deductible value increases, homeowner AAL ($) also increases, indicating that a higher deductible results in a greater portion of the loss, and subsequently, the risk is borne by the homeowner. So, the AF value also increases.
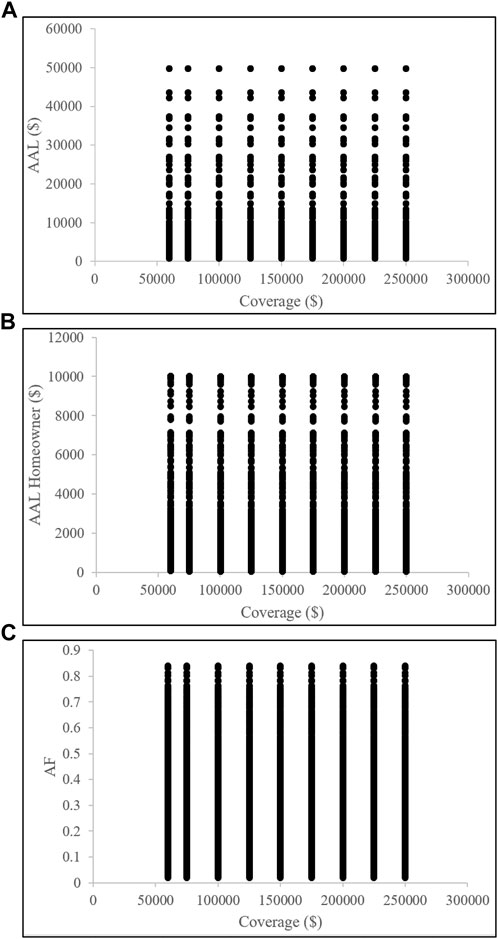
FIGURE 9. Scatterplots of (A) total AAL ($), (B) homeowner AAL ($), and (C) apportionment factor (AF) with coverage values.
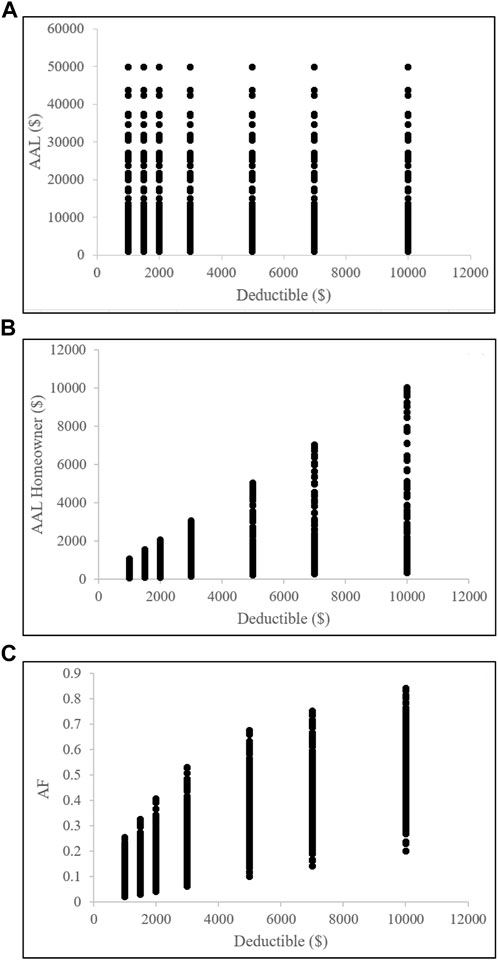
FIGURE 10. Scatterplots of (A) total AAL ($), (B) homeowner AAL ($), and (C) apportionment factor (AF) with deductible values. This figure explores the influence of the deductible parameter on homeowner AAL ($) and AF.
Finally, Figure 11 shows the impact of the unit replacement cost (UC). The scatterplots demonstrate that UC has a notable effect on the estimation of the total AAL ($) and, consequently, the AF. As UC increases, the total AAL ($) also increases. However, it is worth noting that the homeowner AAL ($) remains unchanged despite the variations in UC. As the total AAL ($) increases but the homeowner AAL ($) does not change, the AF value decreases with increasing UC.
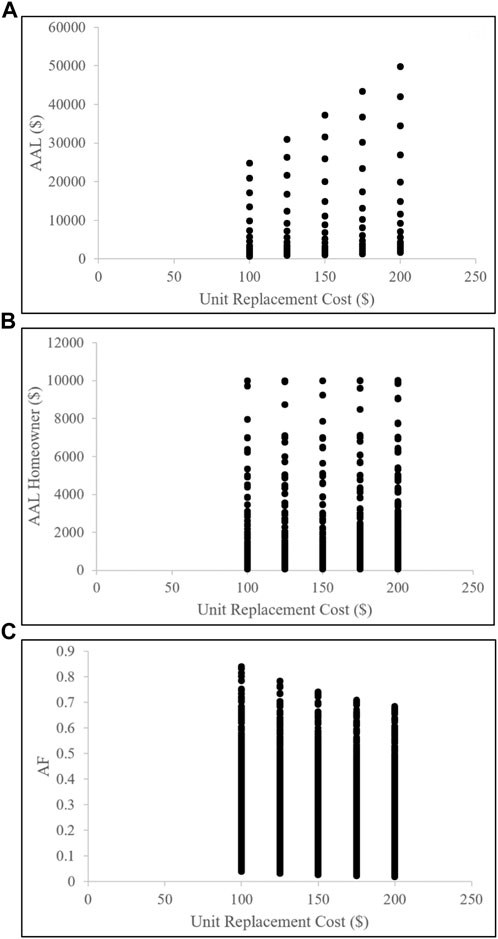
FIGURE 11. Scatterplots of (A) total AAL ($), (B) homeowner AAL ($), and (C) apportionment factor (AF) with the unit replacement cost (UC) parameter. This figure explores the effect of UC on total AAL ($) and AF.
4.3.2 Model analysis
When running regression models, it is generally recommended to start with simpler models before progressing to more complex models. This approach helps save computational time and storage space if a simple model provides a satisfactory fit. The analysis initially used a simpler model of multiple linear regression (MLR), using the α-parameter, coverage, deductible, and UC parameter as the independent variable and AF as the response variable. To assess the model’s performance, the dataset is divided into training and testing datasets, allocating a test size of 0.25. An analysis of variance (ANOVA) is conducted, revealing that the MLR model is statistically significant with a p-value of the F-test less than 0.0001. Furthermore, all the variables exhibit statistical significance, with p-values less than 0.0001. The root-mean-square error (RMSE) value is 0.103. On the training data, the coefficient of determination (R2) is 0.654, and on the testing data, R2 is 0.673. Although this simpler MLR model performed well, the R2 value is still relatively low for practical applications.
Given the limitations to the MLR model in capturing the non-linear behavior of the data, more advanced Machine Learning (ML) models are considered next. Considering the unsatisfactory fit of the MLR model, an ML model is applied, starting with a less complex model, the Classification and Regression Tree (CART) model. The CART model is a decision tree-based model commonly used in ML. Before fitting any ML model, MinMaxScaler from the sklearn package is used to scale the data. Using the scaled training data, the CART model is trained and used subsequently to make predictions using the scaled testing data. The CART model yields promising results with an RMSE value of 0.0056 and an R2 value of 0.999. This considerable improvement in performance is noteworthy, especially considering that the CART model has fewer complexes in the realm of ML. With the performance value achieved with the CART model, no additional models are fit. The feature importance values are shown in Supplementary Figure S2, where it shows that the deductible is the most important feature.
5 Discussion
5.1 Single building
The case study revealed that AF, the proportion of AAL that homeowners incur, increases with the increasing deductible. This means that with a higher deductible, the homeowner assumes a greater proportion of the flood risk, although higher deductibles will reduce the insurance premium. For smaller deductibles, the insurance premium will be greater but the homeowner assumes less flood risk, and a larger portion of AAL will be borne by the flood insurer. The AFs initially decrease with the coverage increase ($60,000– $100,000 for building and $25,000–$500,000 for contents), but above $100,000 for the building and $50,000 for contents, they become relatively insensitive to changes in coverage.
Total AAL scales with the building replacement value. Therefore, as the construction costs rise, the total AAL proportionately increases as a function of cost. However, since coverage and deductible values are expressed in fixed values of absolute currency, the apportioned homeowner and insurer shares will change with the rising building replacement value. To understand the effect of greater construction costs, the case study analysis was again completed using a UC of $220 per square foot, which doubles the
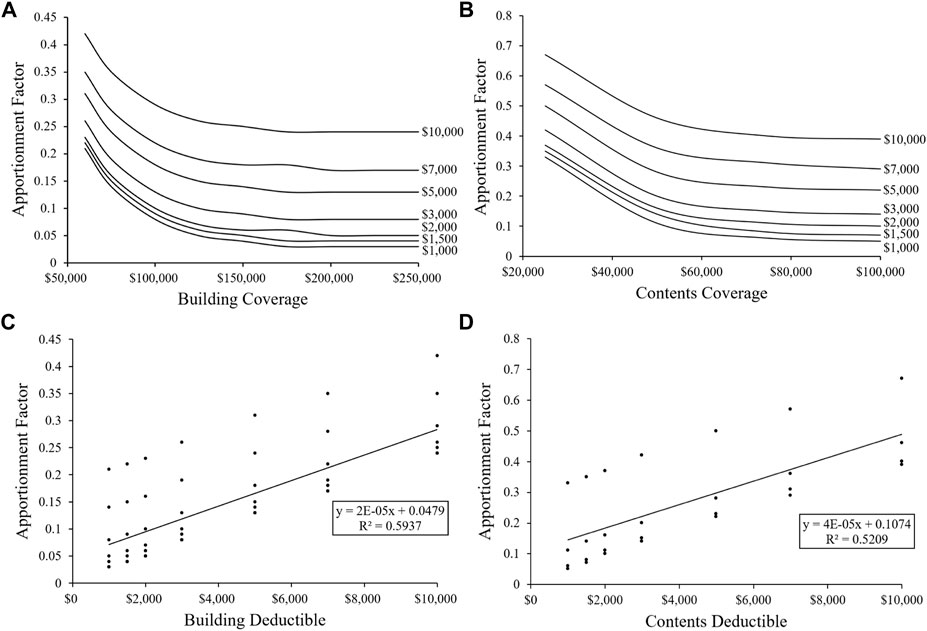
FIGURE 12. Effect of greater unit replacement cost (220 $/square foot) with coverage (A,B) and deductible (C,D) on the homeowner apportionment factor for the building and contents, respectively.
5.2 Spatial heterogeneity
The scatterplot provides valuable insights into the relationships between various parameters and outcome variables. It reveals that the α-parameter has a substantial impact on the total AAL ($), homeowner AAL ($), and AF. As α increases, the total AAL ($) decreases, while the homeowner AAL ($) remains constant for extremely lower α-values before decreasing. This suggests that the deductible value plays a crucial role in determining the homeowner’s portion of the risk. AF initially increases with α but eventually decreases, indicating changes in the distribution of risks between the homeowner and the insurer.
The effects of coverage, deductible, and UC are also examined. The coverage parameter has no significant impact on the total AAL ($), homeowner AAL ($), or AF. In contrast, the deductible has a substantial influence on the homeowner AAL ($) and AF. Higher deductibles result in higher homeowner AAL ($), leading to an increased proportion of the risk borne by the homeowner. The UC has a notable effect on the total AAL ($), affecting AF as well. As UC increases, the total AAL ($) increases, while the homeowner AAL ($) remains unchanged, resulting in a decrease in AF.
The findings from the EDA enhance the subsequent model analysis. Initially, a MLR model is applied, which provides reasonable results. However, considering the limitations to the MLR model in capturing the non-linear behavior of the data, a more advanced ML model, specifically the CART model, is used. The CART model shows remarkable improvement in performance, achieving a substantially lower RMSE and a high R2 value.
In both cases, freeboard decreases AAL and homeowner AAL exponentially. This exponential decrease in total and homeowner building AAL with the increasing freeboard attests to the importance of a freeboard in reducing the flood risk for buildings and homeowners. The AAL approaches minimal values at or above 2 feet of freeboard in the case study, where 2 feet of freeboard reduces the total and homeowners AAL by 95% for both building and content cases. The combination of flood insurance and a freeboard diminishes a building’s flood risk for homeowners to a great extent.
The present research takes an initial step toward understanding the allocation of homeowner and flood insurer shares of the residential flood risk. Thus, these results will be of interest to homeowners, insurance companies, and lending institutions as all seek to minimize the risk and optimize the cost-benefit ratio in the pursuit of economic sustainability, vis-à-vis the most important investment that most will ever make.
6 Conclusion
The aim of this research is to assess the flood risk for the individual homeowner and examine the effect of insurance coverage, deductible, and home freeboard. Flood risk for an individual building is modeled using the Monte Carlo approach, with the annual flood hazard occurrence probability represented by the Gumbel extreme value distribution function. Based on the insurance coverage, deductible, and freeboard, the homeowner and flood insurer shares of the AAL are determined. The case study shows the substantial impacts of flood insurance and freeboard in reducing the flood risk borne by the homeowner.
The specific findings of the single building case study are as follows:
• The homeowner is accountable to bear the overall building and content AAL for uninsured homes, but for insured homes, a large portion of AAL is borne by the flood insurer, particularly for building loss, which translates into a lower flood risk associated with homeowners.
• For all combinations of coverage and deductible, the homeowner building AF is less than 50%, while at low values of flood deductible (e.g., $1,000), the homeowner building AF is approximately 5% for all coverage levels.
• For all combinations of coverage and deductible, the homeowner content AF is less than 70%, while at low values of flood deductible (e.g., $1,000), the homeowner content AF is approximately 10% for all coverage levels.
• The AFs are relatively insensitive to coverage, especially for higher coverage values. The AF for each deductible decreases when the coverage value increases from the basic coverage amount and remains essentially constant for coverage values exceeding $100,000 and $50,000 for the building and contents, respectively.
• The deductible is a statistically significant (
• The AF is relatively insensitive to a freeboard. However, freeboard decreases the total (building and contents) and homeowner AAL exponentially. Both the total and homeowner portions of AAL approach minimal values with a freeboard of 2 feet and above.
The specific findings of the spatial heterogeneity case study are as follows:
• The flood hazard parameter (α) has a significant impact on the total AAL ($), homeowner AAL ($), and AF. Extremely lower α-values align with deductible values, influencing the homeowner’s portion of the risk.
• The results show a limited impact of coverage on AAL and AF values, a significant influence of deductibles on the homeowner AAL and AF, and the effect of UC on the total AAL and AF.
• The MLR model provides reasonable results but struggles to capture non-linear behavior.
• The CART model provides significant improvement in performance.
The results from this research support further evaluation of how floods directly impact homeowners, including freeboard mitigation, and how the homeowner flood risk varies with the changes in insurance coverage and deductible levels. It should be noted that in this analysis, only the direct losses to the structure (e.g., removal and replacement of flooring and drywall) and losses to building contents (e.g., furniture, vehicles, and clothing) are considered. Items of sentimental value and indirect losses (e.g., time unemployed and hotel expenses incurred during renovation) are not considered.
In future work, the methodology can be expanded to include some or all of these indirect losses if the relevant loss functions are known. Additionally, life-cycle cost analysis should be undertaken to evaluate the cost of flood insurance premiums with the changing coverage and deductible to identify the choices that may be most economically advantageous to homeowners based on their risk tolerance. Although AF was insensitive to change for higher coverage values for this specific case study, future research should focus on locations with different flood hazard characteristics to determine how flood characteristics might change this finding.
The findings of this research are very promising as a subsequent study might reveal that the homeowner AAL proportion can be reasonably pre-calculated and applied to the total AAL value, which is relatively straightforward to calculate. This capability would facilitate the estimation of flood losses experienced by homeowners, particularly if the uncertainty can be incorporated (Zarekarizi et al., 2020), supporting research that attempts to understand adaptive strategies in flood risk management (Davids and Thaler, 2021) and factors affecting flood loss recovery and mitigation decisions in their proper context (Rufat et al., 2020).
Data availability statement
The raw data supporting the conclusion of this article will be made available by the authors, without undue reservation.
Author contributions
MR, CF, and RM contributed to the design of the research and the interpretation of the results. MR wrote the code. MR, CF, and RM analyzed the results. MR, RM, RR, and NB wrote the paper. MR, CF, RM, and RR discussed the results and commented on the manuscript. MR, RM, RR, and NB worked on the literature review. All authors contributed to the article and approved the submitted version.
Funding
This research was funded by the Department of Defense/Department of the Army under Contract No. W912HZ2220005, the National Institute of Flood and Agriculture (Hatch project LAB 94873, accession number 7008346), the Louisiana Sea Grant College Program (Omnibus cycle 2022–2024; Award Number: NA22OAR4710105; Project Number: R/CH-05), the Gulf Research Program of the National Academies of Sciences, Engineering, and Medicine (Grant Agreement number: 200010880, “The New First Line of Defense: Building Community Resilience through Residential Risk Disclosure”), and the U.S. Department of Housing and Urban Development (HUD; 2019–2022; Award No. H21679CA and Subaward No. S01227-1). The publication of this article is subsidized by the LSU Libraries Open Access Author Fund.
Conflict of interest
The authors declare that the research was conducted in the absence of any commercial or financial relationships that could be construed as a potential conflict of interest.
Publisher’s note
All claims expressed in this article are solely those of the authors and do not necessarily represent those of their affiliated organizations, or those of the publisher, the editors, and the reviewers. Any product that may be evaluated in this article, or claim that may be made by its manufacturer, is not guaranteed or endorsed by the publisher.
Supplementary material
The Supplementary Material for this article can be found online at: https://www.frontiersin.org/articles/10.3389/fenvs.2023.1180942/full#supplementary-material
References
Aerts, J. C., and Botzen, W. W. (2011). Climate change impacts on pricing long-term flood insurance: A comprehensive study for The Netherlands. Glob. Environ. Change, 21(3), 1045–1060. doi:10.1016/j.gloenvcha.2011.04.005
Al Assi, A., Mostafiz, R. B., Friedland, C. J., Rahim, M. A., and Rohli, R. V. (2022b). Flood risk assessment for residences at the neighborhood scale by owner/occupant type and first-floor height. Front. Big Data 5, 997447. doi:10.3389/fdata.2022.997447
Al Assi, A., Mostafiz, R. B., Friedland, C. J., Rohli, R. V., and Rahim, M. A. (2023). Homeowner flood risk and risk reduction from home elevation between the limits of the 100- and 500-year floodplains. Front. Earth Sci. 11, 1051546. doi:10.3389/feart.2023.1051546
Al Assi, A., Mostafiz, R. B., Friedland, C. J., Rohli, R. V., Taghinezhad, A., and Rahim, M. A. (2022a). Cost-effectiveness of federal CDBG-DR road home program mitigation assistance in jefferson parish, Louisiana. Nat. Hazards 117, 1291–1319. doi:10.1007/s11069-023-05904-3
Arnell, N. W., and Gosling, S. N. (2016). The impacts of climate change on river flood risk at the global scale. Clim. Change, 134(3), 387–401. doi:10.1007/s10584-014-1084-5
Backes, D., Schumann, G., Teferele, F. N., and Boehm, J. (2019). Towards a high-resolution drone-based 3D mapping dataset to optimise flood hazard modeling. Int. Archives Photogrammetry, Remote Sens. Spatial Inf. Sci. 42 (W13), 181–187. doi:10.5194/isprs-archives-XLII-2-W13-181-2019
Bhat, M. S., Alam, A., Ahmad, B., Kotlia, B. S., Farooq, H., Taloor, A. K., et al. (2019). Flood frequency analysis of river Jhelum in Kashmir basin. Quat. Int. 507, 288–294. doi:10.1016/j.quaint.2018.09.039
Brodie, I. M. (2013). Rational Monte Carlo method for flood frequency analysis in urban catchments. J. Hydrology 486, 306–314. doi:10.1016/j.jhydrol.2013.01.039
Bubeck, P., Botzen, W. J. W., and Aerts, J. C. J. H. (2012). A review of risk perceptions and other factors that influence flood mitigation behavior. Risk Anal. 32 (9), 1481–1495. doi:10.1111/j.1539-6924.2011.01783.x
Crick, F., Jenkins, K., and Surminski, S. (2018). Strengthening insurance partnerships in the face of climate change–insights from an agent-based model of flood insurance in the UK. Sci. Total Environ., 636, 192–204. doi:10.1016/j.scitotenv.2018.04.239
Dalezios, N. R. (2017). Environmental hazards methodologies for risk assessment and management. London: IWA Publishing.
Davids, P. R., and Thaler, T. (2021). Flood-resilient communities: How we can encourage adaptive behaviour through smart tools in public-private interaction. Urban Plan. 6 (3), 272–282. doi:10.17645/up.v6i3.4246
Davies, J. B. (2016). Economic analysis of the costs of flooding. Can. Water Resour. Journal/Revue Can. Des. Ressources Hydriques 41 (1–2), 204–219. doi:10.1080/07011784.2015.1055804
Dávila, O. G., Stithou, M., Pescaroli, G., Pietrantoni, L., Koundouri, P., Díaz-Simal, P., et al. (2014). Promoting resilient economies by exploring insurance potential for facing coastal flooding and erosion: Evidence from Italy, Spain, France and United Kingdom. Coast. Eng. 87 (SI), 183–192. doi:10.1016/j.coastaleng.2013.12.007
de Koning, K., Filatova, T., and Bin, O. (2019). Capitalization of flood insurance and risk perceptions in housing prices: An empirical agent-based model approach. South. Econ. J. 85 (4), 1159–1179. doi:10.1002/soej.12328
de Moel, H., van Vliet, M., and Aerts, J. C. (2014). Evaluating the effect of flood damage-reducing measures: A case study of the unembanked area of rotterdam, The Netherlands. Reg. Environ. Change 14 (3), 895–908. doi:10.1007/s10113-013-0420-z
de Ruig, L. T., Haer, T., de Moel, H., Botzen, W. W., and Aerts, J. C. (2020). A micro-scale cost-benefit analysis of building-level flood risk adaptation measures in Los Angeles. Water Resour. Econ. 32 (2020), 100147. doi:10.1016/j.wre.2019.100147
Doheny, M. (2021). Square foot costs with RSMeans cost data - 42nd annual edition. Rockland, MA, USA: Gordian.
Dubbelboer, J., Nikolic, I., Jenkins, K., and Hall, J. (2017). An agent-based model of flood risk and insurance. J. Artif. Soc. Soc. Simul. 20 (1). doi:10.18564/jasss.3135
Ermolieva, T., Filatova, T., Ermoliev, Y., Obersteiner, M., de Bruijn, K. M., and Jeuken, A. (2016). Flood catastrophe model for designing optimal flood insurance program: Estimating location-specific premiums in The Netherlands. Risk Anal. 37 (1), 82–98. doi:10.1111/risa.12589
FEMA, (2021). Historical flood risk and costs. Available at: https://www.fema.gov/data-visualization/historical-flood-risk-and-costs (Accessed July 18, 2022).
FEMA, (2022). Risk mapping, assessment and planning (Risk MAP). Avaiable at: https://www.fema.gov/flood-maps/tools-resources/risk-map (Accessed August 8, 2022).
Foster, J. H. (1976). Flood management: Who benefits and who pays. J. Am. Water Resour. Assoc. 12 (5), 1029–1040. doi:10.1111/j.1752-1688.1976.tb00219.x
Friedland, C. J., Lee, Y. C., Mostafiz, R. B., Lee, J., Mithila, S., Rohli, R. V., et al. (2023). FloodSafeHome: Evaluating financial benefits and savings of freeboard for improved decision-making in flood risk mitigation. Front. Commun. 8, 1060901. doi:10.3389/fcomm.2023.1060901
Gnan, E., Friedland, C. J., Mostafiz, R. B., Rahim, M. A., Gentimis, T., Taghinezhad, A., et al. (2022a). Economically optimizing elevation of new, single-family residences for flood mitigation via life-cycle benefit-cost analysis. Front. Environ. Sci. 10, 889239. doi:10.3389/fenvs.2022.889239
Gnan, E., Friedland, C. J., Rahim, M. A., Mostafiz, R. B., Rohli, R. V., Orooji, F., et al. (2022c). Improved building-specific flood risk assessment and implications of depth-damage function selection. Front. Water 4, 919726. doi:10.3389/frwa.2022.919726
Gnan, E., Mostafiz, R. B., Rahim, M. A., Friedland, C. J., Rohli, R. V., Taghinezhad, A., et al. (2022b). Freeboard life-cycle benefit-cost analysis of a rental single-family residence for landlord, tenant, and insurer. Nat. Hazards Earth Syst. Sci. Discuss. Prepr. doi:10.5194/nhess-2022-222
Hallegatte, S., Green, C., Nicholls, R. J., and Corfee-Morlot, J. (2013). Future flood losses in major coastal cities. Nat. Clim. Change, 3(9), 802–806. doi:10.1038/NCLIMATE1979
Hattermann, F. F., Huang, S., Burghoff, O., Hoffmann, P., and Kundzewicz, Z. W. (2016). Brief communication: An update of the article "Modelling flood damages under climate change conditions – A case study for Germany". Nat. Hazards Earth Syst. Sci. 16 (7), 1617–1622. doi:10.5194/nhess-16-1617-2016
Hattermann, F. F., Huang, S., Burghoff, O., Willems, W., Österle, H., Büchner, M., et al. (2014). Modelling flood damages under climate change conditions – A case study for Germany. Nat. Hazards Earth Syst. Sci. 14 (12), 3151–3168. doi:10.5194/nhess-14-3151-2014
Hennequin, T., Sørup, H. J. D., Dong, Y., and Arnbjerg-Nielsen, K. (2018). A framework for performing comparative LCA between repairing flooded houses and construction of dikes in non-stationary climate with changing risk of flooding. Sci. Total Environ. 642, 473–484. doi:10.1016/j.scitotenv.2018.05.404
Hirabayashi, Y., Mahendran, R., Koirala, S., Konoshima, L., Yamazaki, D., Watanabe, S., et al. (2013). Global flood risk under climate change. Nat. Clim. Change 3 (9), 816–821. doi:10.1038/NCLIMATE1911
Hsu, W. K., Huang, P. C., Chang, C. C., Chen, C. W., Hung, D. M., and Chiang, W. L. (2011). An integrated flood risk assessment model for property insurance industry in Taiwan. Nat. Hazards 58 (3), 1295–1309. doi:10.1007/s11069-011-9732-9
Hudson, P., Botzen, W. W., and Aerts, J. C. (2019). Flood insurance arrangements in the European Union for future flood risk under climate and socioeconomic change. Glob. Environ. Change 58, 101966. doi:10.1016/j.gloenvcha.2019.101966
Intergovernmental Panel on Climate Change (IPCC) (2012). Managing the risks of extreme events and disasters to advance climate change adaptation. A special report of working Groups I and II of the Intergovernmental Panel on Climate Change. Cambridge, MA, USA: Cambridge University Press.
Kim, S. U., and Lee, C. E. (2021). Incorporation of cost-benefit analysis considering epistemic uncertainty for calculating the optimal design flood. Water Resour. Manag. 35 (2), 757–774. doi:10.1007/s11269-021-02764-z
Kind, J., Botzen, W. W., and Aerts, J. C. (2020). Social vulnerability in cost-benefit analysis for flood risk management. Environ. Dev. Econ. 25 (2), 115–134. doi:10.1017/s1355770x19000275
Kousky, C. (2019). The role of natural disaster insurance in recovery and risk reduction. Annu. Rev. Resour. Econ. 11, 399–418. doi:10.1146/annurev-resource-100518-094028
Kundzewicz, Z. W., Kanae, S., Seneviratne, S. I., Handmer, J., Nicholls, N., Peduzzi, P., et al. (2014). Flood risk and climate change: Global and regional perspectives. Hydrological Sci. J. 59 (1), 1–28. doi:10.1080/02626667.2013.857411
Löschner, L., Herrnegger, M., Apperl, B., Senoner, T., Seher, W., and Nachtnebel, H. P. (2017). Flood risk, climate change and settlement development: A micro-scale assessment of Austrian municipalities. Reg. Environ. Change 17 (2), 311–322. doi:10.1007/s10113-016-1009-0
Manfreda, S., Miglino, D., and Albertini, C. (2021). Impact of detention dams on the probability distribution of floods. Hydrology Earth Syst. Sci. 25 (7), 4231–4242. doi:10.5194/hess-25-4231-2021
Merz, B., Hall, J., Disse, M., and Schumann, A. (2010). Fluvial flood risk management in a changing world. Nat. Hazards Earth Syst. Sci. 10 (3), 509–527. doi:10.5194/nhess-10-509-2010
Michel-Kerjan, E., Czajkowski, J., and Kunreuther, H. (2015). Could flood insurance be privatised in the United States? A primer. Geneva Pap. Risk Insurance-Issues Pract. 40 (2), 179–208. doi:10.1057/gpp.2014.27
Miškić, M., Ćorić, G., and Vukosavljević, D. (2017). Building financial and insurance resilience in the context of climate change. Еconomics Agric. 64 (3), 1019–1033. doi:10.5937/ekopolj1703019m
Mitsova, D., Escaleras, M., Sapat, A., Esnard, A. M., and Lamadrid, A. J. (2019). The effects of infrastructure service disruptions and socio-economic vulnerability on hurricane recovery. Sustainability 11 (2), 516. doi:10.3390/su11020516
Mohor, G. S., Thieken, A. H., and Korup, O. (2021). Residential flood loss estimated from Bayesian multilevel models. Nat. Hazards Earth Syst. Sci. 21 (5), 1599–1614. doi:10.5194/nhess-21-1599-2021
Mostafiz, R. B., Friedland, C. J., Rahman, M. A., Rohli, R. V., Tate, E., Bushra, N., et al. (2021a). Comparison of neighborhood-scale, residential property flood-loss assessment methodologies. Front. Environ. Sci. 9, 734294. doi:10.3389/fenvs.2021.734294
Mostafiz, R. B., Assi, A. A., Friedland, C., Rohli, R., and Rahim, M. A. (May 2022b). A numerically-integrated approach for residential flood loss estimation at the community level. In Proceedings of the EGU general assembly 2022. Vienna, Austria, 23–27. doi:10.5194/egusphere-egu22-10827
Mostafiz, R. B., Bushra, N., Rohli, R. V., Friedland, C. J., and Rahim, M. A. (2021b). Present vs. future property losses from a 100-year coastal flood: A case study of Grand Isle, Louisiana. Front. Water 3, 763358. doi:10.3389/frwa.2021.763358
Mostafiz, R. B. (2022c). Estimation of economic risk from coastal natural hazards in Louisiana. Baton Rouge, Louisiana, United States: LSU Doctoral Dissertations. https://digitalcommons.lsu.edu/gradschool_dissertations/5880.
Mostafiz, R. B., Rahim, M. A., Friedland, C. J., Rohli, R. V., Bushra, N., and Orooji, F. (2022d). A data-driven spatial approach to characterize the flood hazard. Front. Big Data 5, 1022900. doi:10.3389/fdata.2022.1022900
Mostafiz, R. B., Rohli, R. V., Friedland, C. J., and Lee, Y-C. (2022a). Actionable information in flood risk communications and the potential for new web-based tools for long-term planning for individuals and community. Front. Earth Sci. 10, 840250. doi:10.3389/feart.2022.840250
National Oceanic and Atmospheric Administration (NOAA), (2022). National Centers for Environmental Information (NCEI) U. S. billion-dollar weather and climate disasters. Available at: https://www.ncei.noaa.gov/access/billions/summary-stats/US/1980-2021 (Accessed August 8, 2022). doi:10.25921/stkw-7w73
NFIP (2021). NFIP Flood Insurance Manual. Appendix J: Rate Tables. Washington, DC. Available at: https://www.fema.gov/sites/default/files/documents/fema_nfip-all-flood-insurance-manual-apr-2021.pdf.
Neumann, B., Vafeidis, A. T., Zimmermann, J., and Nicholls, R. J. (2015). Future coastal population growth and exposure to sea-level rise and coastal flooding-a global assessment. PloS One 10 (3), e0118571. doi:10.1371/journal.pone.0118571
Nofal, O. M., and van de Lindt, J. W. (2021). High-resolution flood risk approach to quantify the impact of policy change on flood losses at community-level. Int. J. Disaster Risk Reduct. 62, 102429. doi:10.1016/j.ijdrr.2021.102429
Nofal, O. M., and van de Lindt, J. W. (2020). Understanding flood risk in the context of community resilience modeling for the built environment: Research needs and trends. Sustain. Resilient Infrastructure 7 (3), 171–187. doi:10.1080/23789689.2020.1722546
Prasanchum, H., Sirisook, P., and Lohpaisankrit, W. (2020). Flood risk areas simulation using SWAT and Gumbel distribution method in Yang catchment, northeast Thailand. Geogr. Tech. 15 (2), 29–39. doi:10.21163/GT_2020.152.04
Pryce, G., and Chen, Y. (2011). Flood risk and the consequences for housing of a changing climate: An international perspective. Risk Manag. 13 (4), 228–246. doi:10.1057/rm.2011.13
Qi, H., Qi, P., and Altinakar, M. S. (2013). GIS-based spatial Monte Carlo analysis for integrated flood management with two dimensional flood simulation. Water Resour. Manag. 27 (10), 3631–3645. doi:10.1007/s11269-013-0370-8
Rahim, M. A., Friedland, C., Rohli, R., Bushra, N., and Mostafiz, R. B. (December 2021). A data-intensive approach to allocating owner vs. NFIP portion of average annual flood losses. In Proceedings of the AGU fall meeting 2021. New Orleans, Louisiana, United States
Rahim, M. A., Gnan, E. S., Friedland, C. J., Mostafiz, R. B., and Rohli, R. V. (May 2022). An improved micro scale average annual flood loss implementation approach. In Proceedings of the EGU general assembly 2022. Vienna, Austria, 23–27. doi:10.5194/egusphere-egu22-10940
Rahman, A., Weinmann, P. E., Hoang, T. M. T., and Laurenson, E. M. (2002). Monte Carlo simulation of flood frequency curves from rainfall. J. Hydrology 256 (3–4), 196–210. doi:10.1016/S0022-1694(01)00533-9
Rufat, S., Fekete, A., Armaş, I., Hartmann, T., Kuhlicke, C., Prior, T., et al. (2020). Swimming alone? Why linking flood risk perception and behavior requires more than it's the individual, stupid. Wiley Interdiscip. Rev. Water 7 (5). doi:10.1002/wat2.1462
Sampson, C. C., Smith, A. M., Bates, P. D., Neal, J. C., Alfieri, L., and Freer, J. E. (2015). A high-resolution global flood hazard model. Water Resour. Res. 51 (9), 7358–7381. doi:10.1002/2015WR016954
Sandink, D., Kovacs, P., Oulahen, G., and Shrubsole, D. (2016). Public relief and insurance for residential flood losses in Canada: Current status and commentary. Can. Water Resour. J. 41 (1–2), 220–237. doi:10.1080/07011784.2015.1040458
Singh, P., Sinha, V. S. P., Vijhani, A., and Pahuja, N. (2018). Vulnerability assessment of urban road network from urban flood. Int. J. Disaster Risk Reduct. 28, 237–250. doi:10.1016/j.ijdrr.2018.03.017
Song, S., and Wang, C. (2020). Incentivizing catastrophe risk sharing. Inst. Industrial Syst. Eng. (IISE) Trans. 52 (12), 1358–1385. doi:10.1080/24725854.2020.1757792
Thistlethwaite, J., Henstra, D., Brown, C., and Scott, D. (2020). Barriers to insurance as a flood risk management tool: Evidence from a survey of property owners. Int. J. Disaster Risk Sci. 11 (3), 263–273. doi:10.1007/s13753-020-00272-z
United Nations, (2004). Guidelines for reducing flood losses. Available at: https://sdgs.un.org/publications/guidelines-reducing-flood-losses-16964 (Accessed July 18, 2022).
United States Army Corps of Engineers (USACE), (2000). “Economic guidance memorandum (EGM) 01-03, generic depth damage relationships. 1–3,” in Memorandum from USACE (United States Army Corps of Engineers) (Washington, DC, USA: United States Army Corps of Engineers).
United States Army Corps of Engineers (USACE), (2015). North atlantic coast comprehensive study: Resilient adaptation to increasing risk. Available at: https://usace.contentdm.oclc.org/digital/collection/p266001coll1/id/2788 (Accessed July 20, 2022).
Ward, P. J., Jongman, B., Aerts, J. C., Bates, P. D., Botzen, W. J., Diaz Loaiza, A., et al. (2017). A global framework for future costs and benefits of river-flood protection in urban areas. Nat. Clim. Change 7 (9), 642–646. doi:10.1038/NCLIMATE3350
Ward, P. J., Pauw, W. P., van Buuren, M. W., and Marfai, M. A. (2013). Governance of flood risk management in a time of climate change: The cases of Jakarta and Rotterdam. Environ. Polit. 22 (3), 518–536. doi:10.1080/09644016.2012.683155
Wing, O. E., Bates, P. D., Smith, A. M., Sampson, C. C., Johnson, K. A., Fargione, J., et al. (2018). Estimates of present and future flood risk in the conterminous United States. Environ. Res. Lett. 13 (3), 034023. doi:10.1088/1748-9326/aaac65
Wing, O. E. J., Bates, P. D., Sampson, C. C., Smith, A. M., Johnson, K. A., and Erickson, T. A. (2017). Validation of a 30 m resolution flood hazard model of the conterminous United States. Water Resour. Res. 53 (9), 7968–7986. doi:10.1002/2017WR020917
Winsemius, H. C., Aerts, J. C., van Beek, L. P., Bierkens, M. F., Bouwman, A., Jongman, B., et al. (2016). Global drivers of future river flood risk. Nat. Clim. Change 6 (4), 381–385. doi:10.1038/nclimate2893
Xian, S., Lin, N., and Kunreuther, H. (2017). Optimal house elevation for reducing flood-related losses. J. Hydrology 548, 63–74. doi:10.1016/j.jhydrol.2017.02.057
Yu, J. J., Qin, X. S., and Larsen, O. (2013). Joint Monte Carlo and possibilistic simulation for flood damage assessment. Stoch. Environ. Res. Risk Assess. 27 (3), 725–735. doi:10.1007/s00477-012-0635-4
Zarekarizi, M., Srikrishnan, V., and Keller, K. (2020). Neglecting uncertainties biases house-elevation decisions to manage riverine flood risks. Nat. Commun. 11 (1), 5361. doi:10.1038/s41467-020-19188-9
Zhao, J., Lee, J. Y., Li, Y., and Yin, Y. J. (2020). Effect of catastrophe insurance on disaster-impacted community: Quantitative framework and case studies. Int. J. Disaster Risk Reduct. 43, 101387. doi:10.1016/j.ijdrr.2019.101387
Keywords: homeowner flood risk, Gumbel extreme value distribution, Monte Carlo simulation, average annual loss, insurance coverage and deductible, freeboard
Citation: Rahim MA, Mostafiz RB, Friedland CJ, Rohli RV and Bushra N (2023) Analytical advances in homeowner flood risk quantification considering insurance, building replacement value, and freeboard. Front. Environ. Sci. 11:1180942. doi: 10.3389/fenvs.2023.1180942
Received: 06 March 2023; Accepted: 18 September 2023;
Published: 06 October 2023.
Edited by:
Xiong Zhou, Beijing Normal University, ChinaReviewed by:
Ashraf Dewan, Curtin University, AustraliaAlfredo Pérez-Morales, University of Murcia, Spain
Copyright © 2023 Rahim, Mostafiz, Friedland, Rohli and Bushra. This is an open-access article distributed under the terms of the Creative Commons Attribution License (CC BY). The use, distribution or reproduction in other forums is permitted, provided the original author(s) and the copyright owner(s) are credited and that the original publication in this journal is cited, in accordance with accepted academic practice. No use, distribution or reproduction is permitted which does not comply with these terms.
*Correspondence: Md Adilur Rahim, bXJhaGltNkBsc3UuZWR1
 Md Adilur Rahim
 Rubayet Bin Mostafiz
 Carol J. Friedland
 Robert V. Rohli
 Nazla Bushra