 Rongda Li1
 Jing He2*
- 1International College Beijing, China Agricultural University, Beijing, China
- 2College of Economics and Management, China Agricultural University, Beijing, China
Studies mainly focuses on measuring the economic policy uncertainty in different countries. However, few studies have focused on the construction of the environmental policy uncertainty index (EPUI). This paper selects 460 newspapers from the China National Knowledge Infrastructure (CNKI) newspaper database from 2001 to 2016, and uses the text analysis method to directly construct the national, provincial, and prefecture-level EPUI of China. We have analyzed the distribution and fluctuation trend of the EPUI, and use two-way fixed effect model with panel data to investigate the impact of environmental policy uncertainty on environmental pollutant emissions at the city level. An important discovery has been made through our research, indicating that the rise in environmental policy uncertainty is likely to result in a reduction of pollutant emissions such as urban industrial sulfur dioxide and carbon dioxide. However, this reduction comes at a cost to the promotion of the development of urban secondary industry. The Chinese EPUI constructed for the first time in this article provides significant basic data for research in the environment and energy fields, and also provides important empirical evidence for achieving China’s carbon peak and carbon neutrality goals.
Highlights
• EPUI is constructed on national, provincial, and prefecture-level in China.
• An increase in EPUI can reduce sulfur dioxide and carbon dioxide emissions.
• EPUI can reduce pollutant emissions through the channel of the scale of the secondary industry.
• The EPUI in China’s northern provinces is higher than that in southern provinces.
1 Introduction
For a long time, China’s rapid economic growth has always been inseparable from the huge consumption of resources and energy, which has caused serious environmental pollutions (e.g., water pollution, air pollution, and land pollution). Environmental policies (such as pollution emission policies, carbon trading policies (Wang et al., 2023), carbon tax policies, etc.) are an important way to solve environmental pollution problems. Since China considered environmental protection as a basic state policy in its Party Congress work report in 1992, the party and state leaders have always attached great importance to the promulgation and implementation of environmental policies. In 2003, the “Scientific Outlook on Development” clearly stated that we should adhere to sustainable development and build a resource-saving and ecological protection-oriented society (Liu et al., 2021b). In 2012, the Chinese government incorporated the construction of ecological civilization into the “five in one” overall layout of the cause of socialism with Chinese characteristics. In 2018, the Chinese government wrote ecological civilization into the Constitution. This series of measures show that China’s environmental protection work is constantly being strengthened, and environmental policies have moved from a single policy to comprehensive regulation. As of 4 August 2021, a total of 6,1221environmental protection laws, regulations, and departmental rules have been promulgated and implemented by departments at all levels. Numerous environmental policies cover a wide range of fields, and there are obvious differences in the time, frequency, and intensity of their promulgation, as well as the impact of the policies, which has a non-negligible impact on China’s environmental governance and high-quality economic development (Huang and Luk, 2020).
Since the outbreak of the global financial crisis in 2008, the world economy has moved from an era of “great easing” to an era full of high uncertainty (Handley and Limão, 2017). How to construct various uncertainty indexes has become a hot topic in academic circles at home and abroad, among which the most influential is the economic policy uncertainty index. The index can be traced back to Baker et al. (2016), who use the text analysis method to construct the economic policy uncertainty index of global and major economies based on the evaluation of mainstream news media. The index provides a new analytical tool for understanding how information is delivered to the market and arouses public reaction. Since its publication, the economic policy uncertainty index has been widely concerned and cited by scholars from all over the world (Pirgaip and Dinçergök, 2020; Xia et al., 2020).
As the world’s second-largest economy, China has been more and more studied on its policy uncertainty. During the past 40 years of reform and opening-up, China has implemented many policy trials and reforms in the process of economic development, which has inevitably caused the negative impact of various policy uncertainties on the Chinese economy. In this case, how to accurately characterize policy uncertainty and examine its negative impact on China’s economic growth is of great practical significance for achieving high-quality growth of China’s economy. Therefore, many scholars have carried out systematic and in-depth research. For example, Huang and Luk (2020) construct a monthly index of China’s economic policy uncertainty based on the text data of newspapers from 2000 to 2018. At the same time, they use the same method to construct the uncertainty index of China’s fiscal policy, monetary policy, trade policy, and exchange rate policy. Yu et al. (2021) construct an annual index of economic policy uncertainty for 30 provinces in China based on the China National Knowledge Infrastructure (CNKI) newspaper database from 2008 to 2011. It is a bit regrettable that most of the existing research focuses on policy uncertainty at the economic level while ignoring policy uncertainty at other levels, especially the environmental level, which provides a new exploration space for this study.
In 2020, General Secretary Xi Jinping proposed at the 75th session of the United Nations General Assembly the green development goal of “striving to reach carbon peak by 2030 and carbon neutrality by 2060”. The proposal of this goal means that China’s economy and society will usher in unprecedented low-carbon reform. Carbon neutrality is both an opportunity and a challenge. At present, China’s energy consumption level is much higher than the world average, and the task of reducing overcapacity and adjusting the economic structure remains arduous. Under the carbon neutrality goal, Policy uncertainty has a great impact on investment decisions of enterprises and individuals. Relevant studies mainly focus on the impact of economic policy uncertainty. From the perspective of enterprise and individual investment, some scholars believe that the uncertainty of economic policy will inhibit enterprise and individual investment. Baker et al. (2016) believe that the existence of economic policy uncertainty enables enterprises and individuals to delay spending and investment due to the risk of market uncertainty. Based on the data from 2006 to 2011, it finds that the increase of policy uncertainty will lead to a sharp and sustained decline in the economy, and GDP, private investment and total employment will all decline. Gulen and Ion (2015) finds that since investment is irreversible, policy uncertainty will cause enterprises to take strategic prevention, thus inhibiting enterprise investment. For companies with a high degree of investment irreversibility and companies that are more dependent on government expenditure, this relationship is more prominent. At the same time, from a broader perspective, some scholars also find the negative impact between uncertainty and enterprise investment. According to the real option theory, uncertainty increases the waiting value and leads firms to make investment decisions cautiously. For firms facing a high degree of uncertainty, it may be best to limit investments and increase cash holdings in preparation for postponing investments to the next period (Bernanke, 1983; McDonald and Siegel, 1984; Abel and Eberly, 1996). In addition, some scholars also study the impact of environmental policies on investment. Greenstone (2002) uses a natural experiment to study investment differences between plants in counties with no binding environmental regulations and plants in the same industry in counties with environmental regulations. The study finds that employment, investment and output fell in counties with binding rules compared with those without; Garofalo and Malhotra (1995) provide evidence that stricter environmental regulations increase the capital used to deal with pollution, but reduce the manufacturing capacity of an industry, which also shows that environmental policies moderately crowd out productive investment of firms by increasing investment in pollution reduction. Based on the above analysis, we can know that the uncertainty of environmental policy caused by multiple politics will not only directly change the consumption and investment decisions of residents and enterprises, but also affect their confidence and expectations to a large extent, thus indirectly affecting the production scale of enterprises and the adjustment of industry structure. Therefore, selecting an appropriate method to truly reflect China’s overall and regional environmental policy uncertainty is crucial for the early realization of the dual carbon goals (i.e., carbon peak and carbon neutrality).
Because of the above considerations, this article attempts to construct China’s national, provincial, and prefecture-level environmental policy uncertainty index (EPUI) by adopting the text analysis method and combining the construction method of the economic policy uncertainty index proposed by Baker et al. (2016). In terms of data processing, this paper selects 460 newspapers in the CNKI newspaper database from 2001 to 2016 as the data source for text analysis. These 460 newspapers are widely distributed in 31 provinces, municipalities, and autonomous regions in China, with broad representativeness.
Compared with the existing literature, the marginal contribution of this article mainly covers the following two points: first, the existing literature usually adopts indexes such as the environmental officials’ turnover in the local government and the intensity of environmental regulations to indirectly measure the environmental policy uncertainty. This way of depiction has certain limitations and cannot well reflect the true level of environmental policy uncertainty. Given this, this paper selects 460 newspapers distributed in 31 provinces, municipalities, and autonomous regions in China as the data source, and adopts the construction method of Baker et al. (2016) on economic policy uncertainty index to construct China’s national, provincial, and prefecture-level EPUI from 2001 to 2016 for the first time, which provides very important basic data for the empirical research of environment. At the same time, the EPUI constructed in this paper also has great application value in the fields of economy, energy, and corporate decision-making. Second, under the dual carbon goals, the first-constructed EPUI is applied to the pollutant emission reduction at the city level in China, and an important discovery is obtained: environmental policy uncertainty will achieve the goal of pollutant emission reduction at the cost of reducing the output value of urban secondary industry. The research conclusions of this paper provide an important experience for policymaking to achieve the dual carbon goals.
The structure of the paper is organized as follows: Section 2 is the literature review; Section 3 is the construction and distribution of China’s EPUI at different levels; Section 4 is the application of China’s EPUI; Section 5 is the main conclusions and policy recommendations.
2 Literature review
Judging from the existing literature, at present, the measurement methods of policy uncertainty index are roughly divided into two categories. The first type is to measure policy uncertainty by constructing a synthetic index, such as Baker et al. (2016), Huang and Luk (2020), and Yu et al. (2021). Baker et al. (2016) pioneer the construction of an index based on newspaper text to measure economic policy uncertainty, and apply this construction method to different countries and regions. After calculating the preliminary economic policy uncertainty index, Baker et al. (2016) use manual reading and review to select articles containing keywords, and combine the manually calculated index with the index obtained by the text analysis method. The obtained indexes are compared to test the effectiveness of the computer-constructed economic policy uncertainty index. The results show that the economic policy uncertainty indexes calculated by the two methods are highly positively correlated. Huang and Luk (2020) improve the index construction method proposed by Baker et al. (2016) from the aspects of standardized processing and keyword selection. They divide the target article by all articles containing the keyword “economy” in the current month for standardized processing, which effectively avoids the systematic estimation bias caused by the different layouts and content of comprehensive newspapers. Yu et al. (2021) improve the Chinese economic policy uncertainty index constructed by Baker et al. (2016) based on the contextual difference between Chinese and English expressions, and expand the Chinese economic policy uncertainty index from national level to provincial level for the first time. Similarly, Li et al. (2021b) adopt the index construction method of Baker et al. (2016), replacing “economy” with “trade” to construct the uncertainty index of China’s trade policy. Meanwhile, the construction method of the composite index can be widely used to measure other economic indicators besides the uncertainty of policy. For example, Guo et al. (2023) develop a city-level power shortage index in China using the text analysis method and analyze the relationship between power shortage and firm productivity.
The second category is to measure policy uncertainty based on relevant economic variables or policy variables, such as Fernández-Villaverde et al. (2011), Julio and Yook (2012), Shah et al. (2021), and Tran and Houston (2021). This type of literature mainly uses the time series model to measure policy uncertainty. For example, Fernández-Villaverde et al. (2011) use particle filter and Bayesian method to extract the time-varying volatility of government expenditure and taxation, and use such time-varying volatility to characterize fiscal policy uncertainty. Using the simultaneous equation state-space model and Kalman filtering method, Anzuini et al. (2020) calculate the time-varying volatility of taxation and use it to express the uncertainty of fiscal policy. Fu and Luo (2021) adopt the method proposed by Fernández-Villaverde et al. (2011) to construct China’s monetary policy uncertainty. Mumtaz and Surico (2018) point out that the central bank mainly achieves the ultimate goal by anchoring the intermediary target through policy tools, which are difficult to directly observe and quantify, and the monetary policy uncertainty can be measured by calculating the random volatility of the intermediary target of monetary policy. In addition, some researchers use the turnover of government officials to measure policy uncertainty (Julio and Yook, 2012; Li et al., 2021a). For example, Julio and Yook (2012) use election time in countries around the world as a proxy variable for policy uncertainty, because existing policies may be changed due to the change of leaders with different policy preferences. Cheng et al. (2021) use the turnover of municipal party secretary or mayor as the proxy variable for political uncertainty. Liu et al. (2021a) use the political connection of corporate leaders to measure political uncertainty. Francis et al. (2021) select Google political election news, tax expiration index, CPI forecast difference, federal procurement forecast difference, and other factors to construct a political uncertainty index by the weighted method.
Based on the above literature, it can be found that the current research on policy uncertainty mainly focuses on economic policy, fiscal policy, monetary policy, trade policy, and political elections, while few literature investigates environmental policy uncertainty. In particular, no literature has investigated the uncertainty of China’s environmental policy, and a few existing literature only uses changes in the intensity of environmental regulation or climate to describe the uncertainty of environmental policies (Liu et al., 2018; DeLuque and Shittu, 2019; Schubert and Smulders, 2019). In view of this, the article adopts the uncertainty index construction method proposed by Baker et al. (2016), and selects 460 newspapers in the CNKI newspaper database from 2001 to 2016 as the data source for text analysis, and constructs China’s EPUI at the national, provincial and prefecture level for the first time. This would provide very important basic data for empirical research of the environment, and provide significant empirical support for guiding how to achieve China’s dual carbon goals.
3 Construction and distribution of China's EPUI
3.1 Index construction
The method of constructing China’s EPUI in this paper is consistent with Baker et al. (2016). We have selected 460 newspapers from the CNKI newspaper database from 2001 to 2016 as the source of this article. These 460 newspapers are widely representative, covering China’s 31 provinces, municipalities, and autonomous regions. Table 1 reports the basic statistics on the sources and distribution of 460 newspapers.
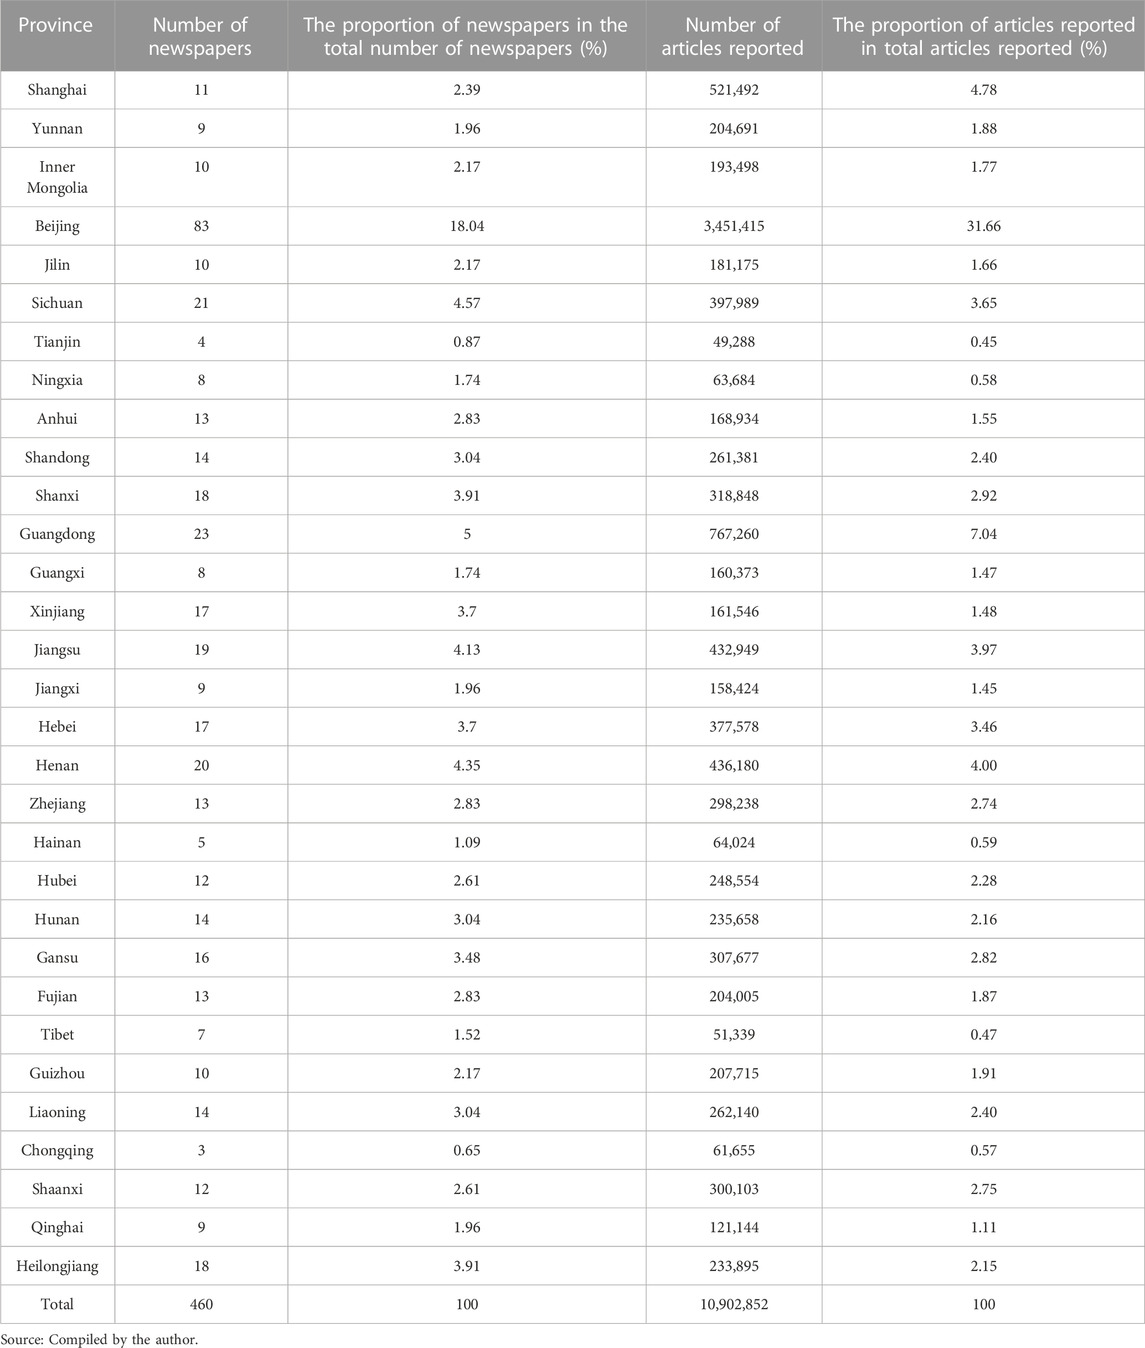
TABLE 1. Provincial distribution statistics of 460 newspapers.
Table 2 reports the identification criteria for keywords related to environmental policy uncertainty. If a news report contains at least one keyword of “environment”, “policy” and “uncertainty” at the same time, then it is considered as the target article. In the process of keyword screening, this paper firstly conducts text processing and word frequency analysis on texts used in the study, and selects words that appear more frequently as alternative word sets. Then, through manual reading and borrowing the words used in existing research as keywords to be considered in index construction (Baker et al., 2016). The specific construction method of EPUI is shown as follows:
(1) According to the definition of the target article, the number of target articles in each month of each newspaper is sorted out and recorded as
(2) Normalize X, namely,
(3) The EPUI of different monthly frequencies in China is obtained,
(4) The EPUI of China from 2001 to 2016 constructed in this paper includes national, provincial, and prefecture levels. In the specific construction process, this paper selects national, provincial, and prefecture-level newspapers as the data source. Among them, at the national level, 460 newspapers are used as the data source; at the provincial level, 460 newspapers are classified into 31 provinces, cities, and autonomous regions according to the place of publication; at the prefecture level, 460 newspapers are classified into prefecture-level cities according to the publication location. Then, calculate according to the above steps in turn, and finally get China’s EPUI at the national, provincial, and prefecture levels.
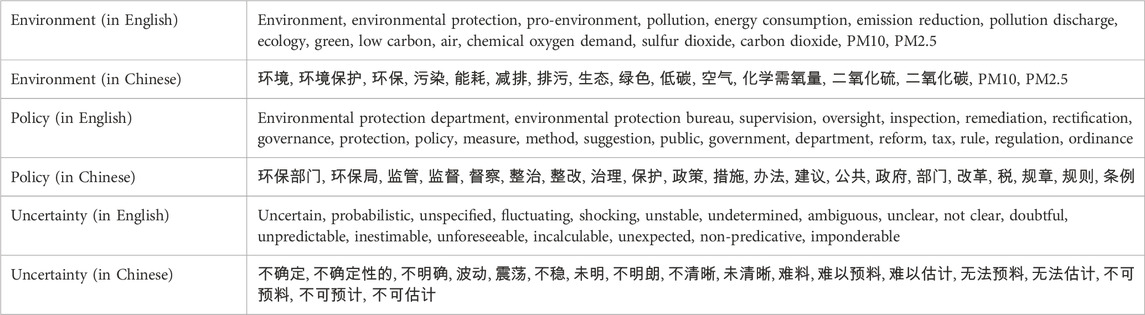
TABLE 2. Keyword criteria used to identify the EPUI.
3.2 Fluctuation characteristics of China’s EPUI
Figure 1 shows the fluctuation trend of China’s EPUI at the national level. As can be seen from Figure 1, China’s EPUI from 2001 to 2011basically fluctuates within the range of 50–110. During this period, the Chinese government’s environmental protection policy was relatively stable. In addition to revising and promulgating environmental protection laws and regulations, environmental economic policies have entered a stage of centralized design and promotion. For example, in 2005, the fifth plenary session of the 16th Party Central Committee put forward the policy of building a resource-saving and environment-friendly society. In October 2007, the “Energy Conservation Law of the People’s Republic of China” was revised. In February 2008, the “Water Pollution Prevention and Control Law of the People’s Republic of China” was revised.
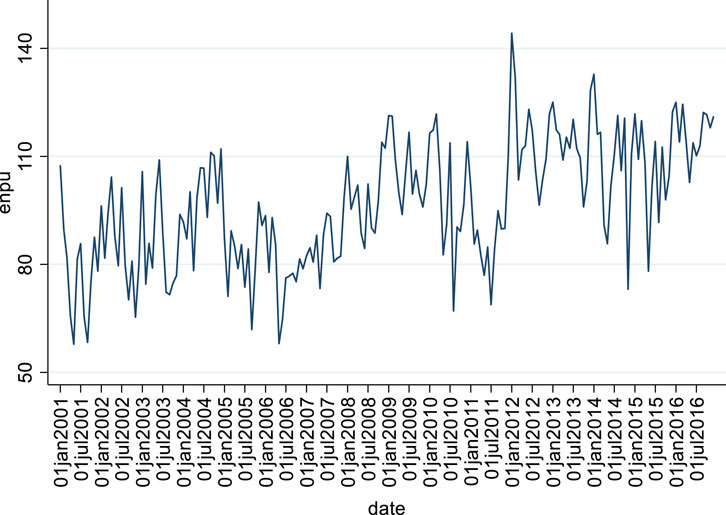
FIGURE 1. The fluctuation trend of China’s EPUI from 2001 to 2016.
Compared with the period from 2001 to 2011, China’s EPUI showed a volatile increase from 2012 to 2016. In 2012, the 18th National Congress of the Communist Party of China (CPC) was held, and the new central leadership was elected. At the same time, the work focus of “vigorously promoting the construction of ecological civilization and reversing the deterioration of the ecological environment” was put forward. The report of the 18th National Congress of the CPC incorporated “ecological civilization” into the “five-in-one” overall layout of socialism with Chinese characteristics, and for the first time proposed “promoting green, circular, and low-carbon development” and “building a beautiful China”. Improving environmental quality has gradually become the core goal and the main task of environmental protection, and environmental policy reform has entered a stage of deepening and sublimation, which have opened the prelude to the volatile rise of China’s EPUI. At the third plenary session of the 18th CPC Central Committee in 2013, the Party Central Committee pointed out that “protecting the ecological environment with systems”. From September to October 2013, the “National Ten Articles” on air pollution prevention and control played an important role in promoting the control of air pollution and environmental protection, greatly increasing the uncertainty in the implementation and formulation of environmental policies. During this period, China’s EPUI showed a rapid rise.
Figure 2 is the distribution map of EPUI at provincial level in China in 2001. China’s provincial EPUI is only available in 26 provinces in 2001, missing 5 provinces2, cities, and autonomous regions, with an average value of 89. And the maximum value is in Qinghai Province, with an index of 170. The minimum value is Tibet, which has a value of 0. Overall, the EPUI in western China is higher than that in central China, and that in central China is higher than that in eastern China.
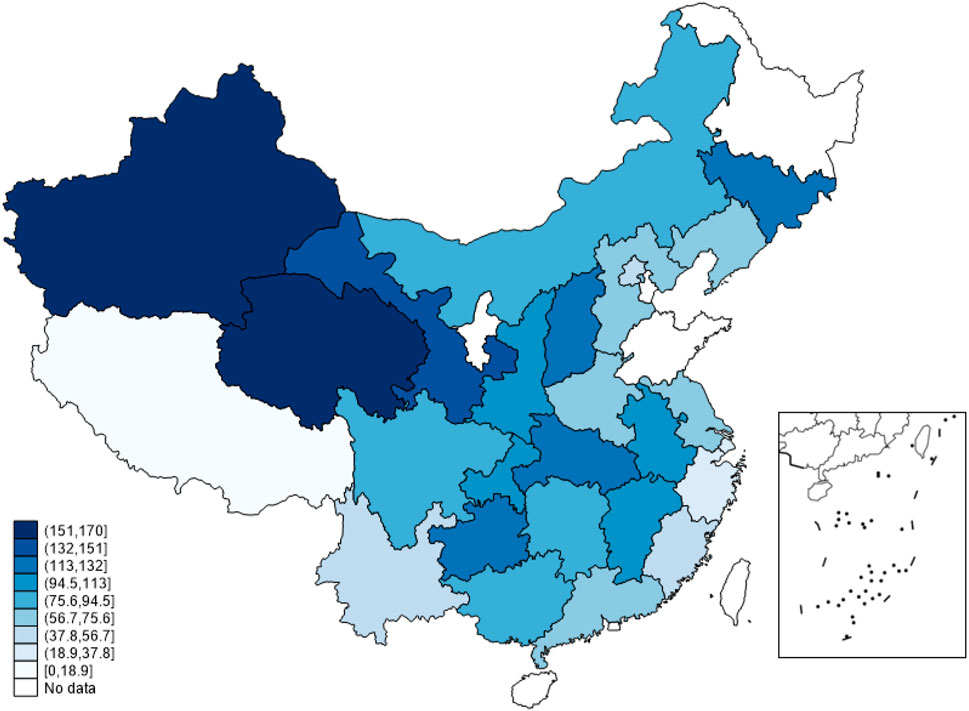
FIGURE 2. The distribution of EPUI at provincial level in China in 2001.
Figure 3 shows the distribution of EPUI at provincial level in China in 2016. In 2016, China’s provincial EPUI is available in 31 provinces and cities. Among them, the average value of EPUI is 111, the maximum value is 161 in Shanghai. The minimum value is in Jilin, with a value of only 79. Overall, China’s central inland provinces and eastern coastal provinces have significantly higher EPUI than other regions.
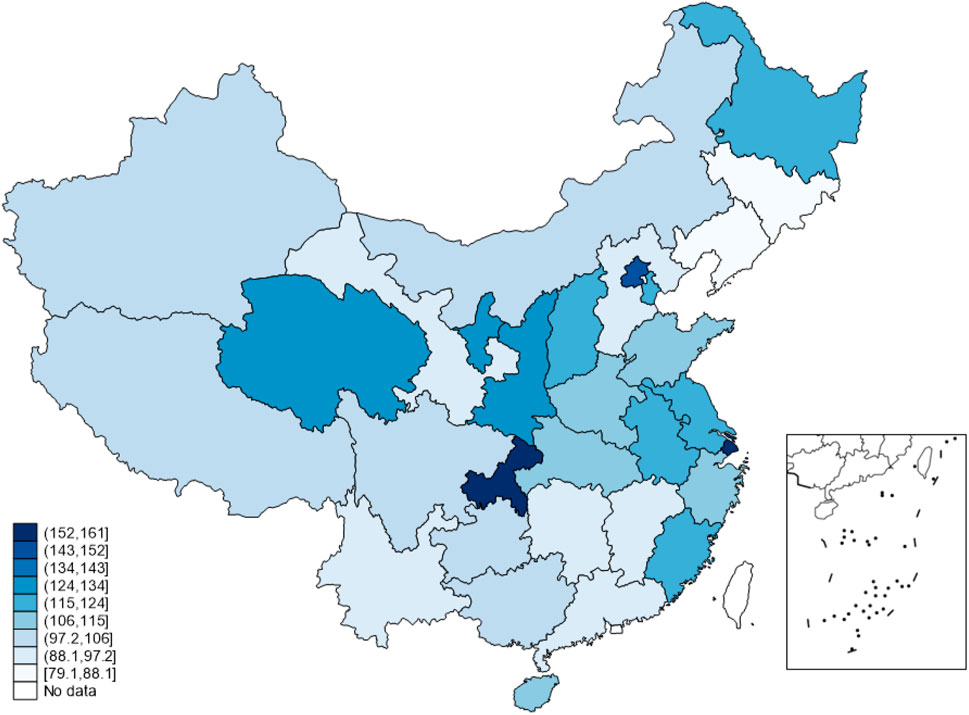
FIGURE 3. The distribution of EPUI at provincial level in China in 2016.
Figure 4 reports the mean distribution of EPUI at provincial level in China from 2001 to 2016. During this period, the average value of EPUI is 99, the maximum value is 114 in Jilin. The minimum value is in Chongqing, which is only 88. As can be seen from Figure 2 to Figure 4, the EPUI of northern provinces of China is significantly higher than that of southern provinces, which reflects that compared with northern provinces of China, southern provinces have better continuity and consistency in the formulation of environmental policies, thus showing relatively lower environmental policy uncertainty.
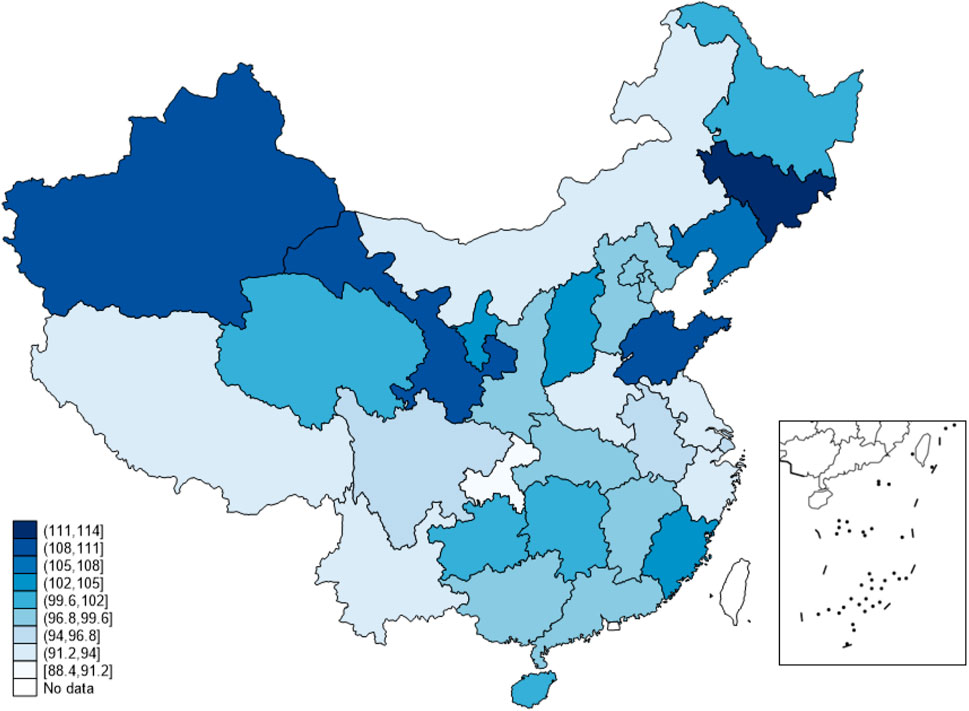
FIGURE 4. The mean distribution of EPUI at provincial level in China from 2001 to 2016.
Figure 5 shows the distribution of EPUI at prefecture level in China in 2001. There are only 28 prefecture-level cities available with EPUI data in 2001. The average value of EPUI is 77, the maximum value is 215 in Xining; the minimum value is 0 in Lhasa. As can be seen that the distribution of EPUI at prefecture level in China is roughly consistent with that in corresponding provinces. Meanwhile, the EPUI of prefecture-level cities in western China is higher than that of central China, and the EPUI of prefecture-level cities in central China is higher than that of eastern China. Compared with EPUI at provincial level, EPUI at prefecture level can reflect the fluctuation trend of China’s EPUI from a more microscopic perspective.
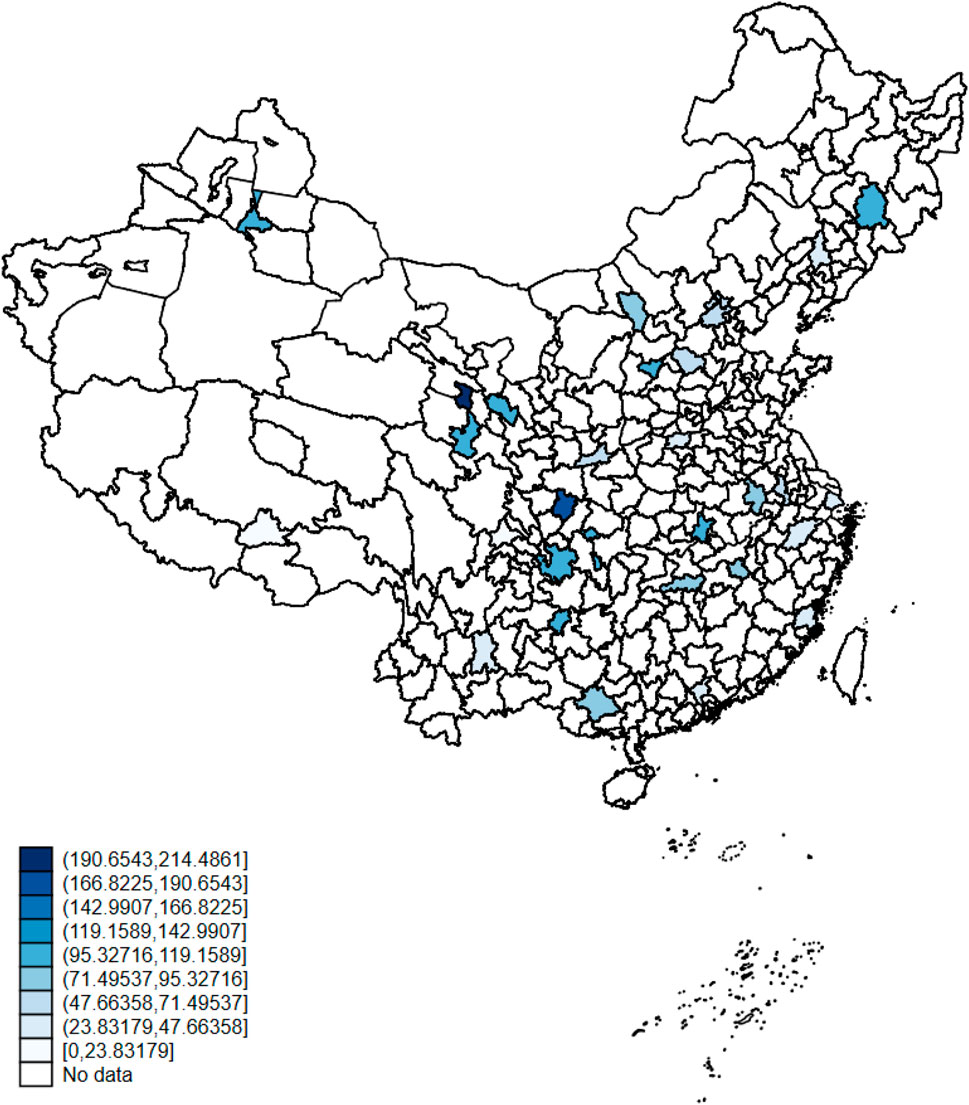
FIGURE 5. The distribution of EPUI at prefecture level in China in 2001.
As shown in Figure 6, the EPUI at prefecture level in China in 2016 is distributed in 240 prefecture-level cities with an average value of 103.9, and the maximum value is Xigaze City with an index of 214.5. This is closely related to China’s continuous increase in the formulation and implementation of policies on ecological and environmental protection in Tibet. The minimum value is Jinzhou City, Shiyan City, Hami City, Hetian City, Honghe Hani, and Yi Autonomous Prefecture, Kizilsu Kirgiz Autonomous Prefecture, Nyingchi City, Shannan City, Chaozhou City, Kashgar City, Cangzhou City. The EPUI of all these prefecture-level cities is 0. As can be seen that the EPUI of central and eastern coastal cities in China is significantly higher than that of other cities.
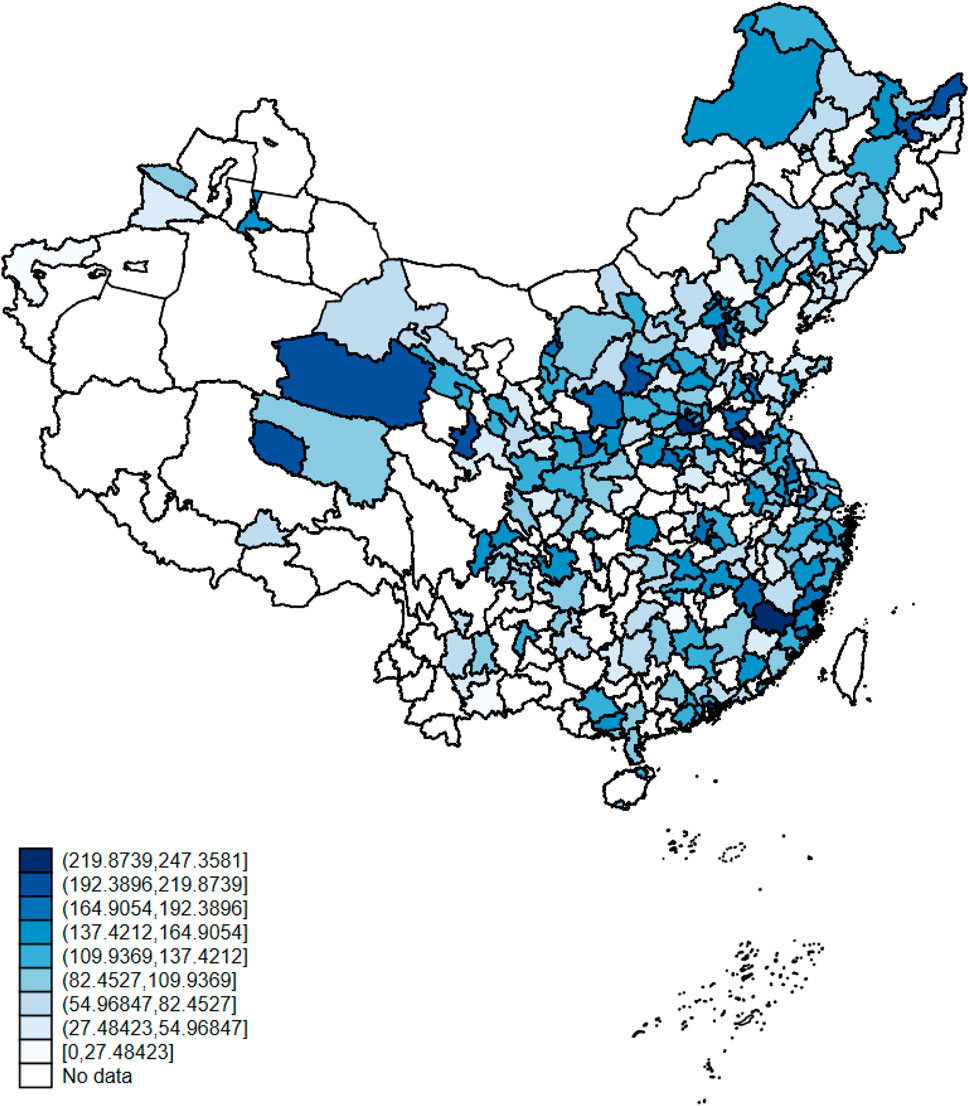
FIGURE 6. The distribution of EPUI at prefecture level in China in 2016.
Figure 7 shows the mean distribution of the EPUI at prefecture level in China from 2001 to 2016. We find that the environmental policy uncertainty in eastern and northeastern China is relatively high. Among them, Hulunbuir in Inner Mongolia and Chengde in Hebei Province have the highest EPUI, which is related to the geographical location of the two cities. Hulunbuir locates in the Songhua River basin and Chengde is in the Haihe River and Huaihe River basins. Their geographic location determines that water resource protection and regulatory policies are issued and adjusted more frequently, thus showing a high degree of uncertainty. In contrast, the EPUI of Nagqu City in Tibet is the lowest, with a value of only 75. By comparing Figures 5–7, it can be found that the EPUI of northern cities in China is significantly higher than that of southern cities, which is consistent with the distribution of Figures 2–4. Further analysis shows that over time, the EPUI distribution at provincial and prefecture level in China shows obvious regional transfer characteristics, that is, high EPUI gradually shifts from western China to central, eastern, and northeastern China. One possible explanation is that the economic development in western China is relatively lagging behind other regions, which made relevant departments in western China pay more attention to economic development than environmental protection, making local governments lag behind other regions in the introduction and revision of environmental protection policies. As a result, the EPUI in western China is lower than that in other regions.
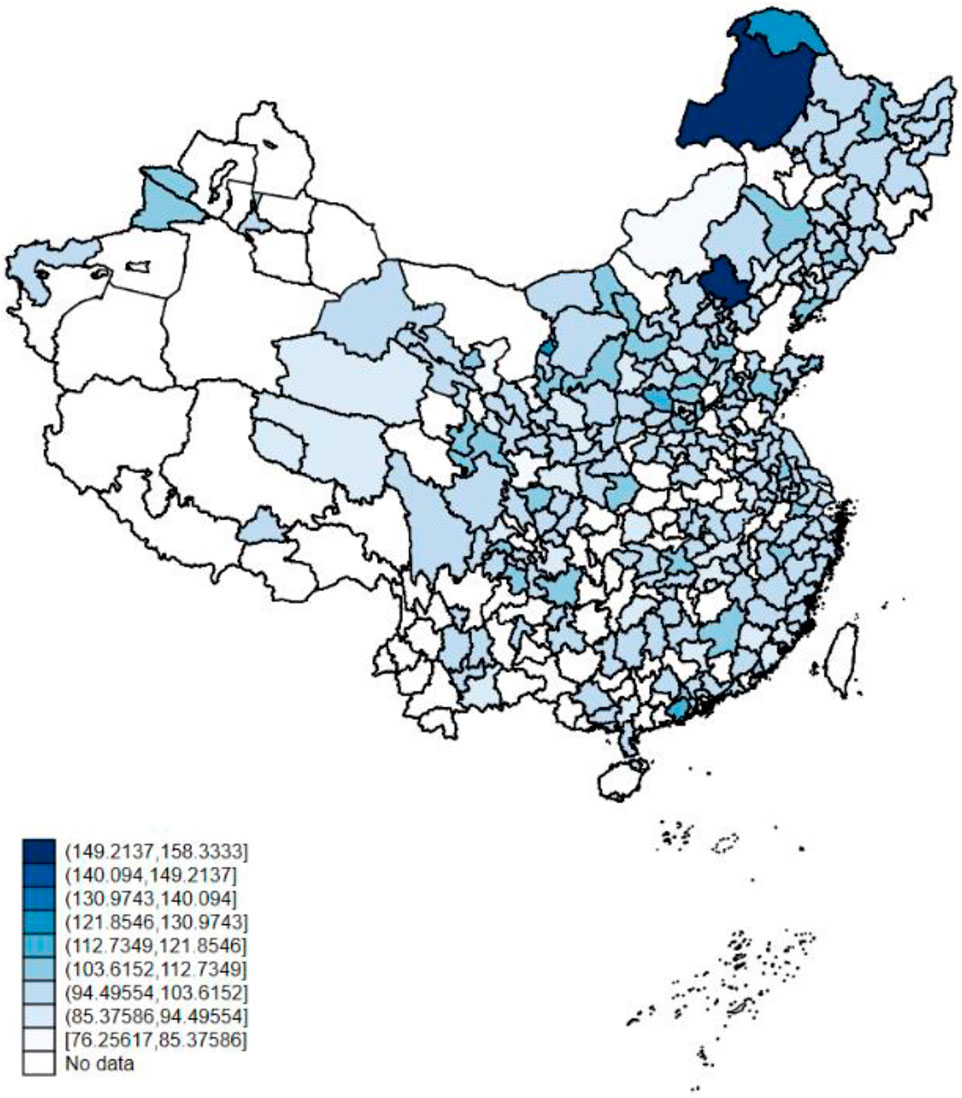
FIGURE 7. The mean distribution of EPUI at prefecture level in China from 2001 to 2016.
3.3 The robustness test and accuracy test of China’s EPUI
In this part, we will test the robustness and accuracy of China’s EPUI, focusing on two aspects: one is the construction of large-scale
First, the construction of large-scale
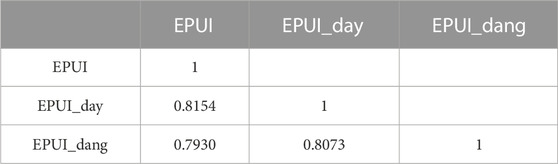
TABLE 3. Construction of the correlation coefficient matrix of EPUI with different characteristics.
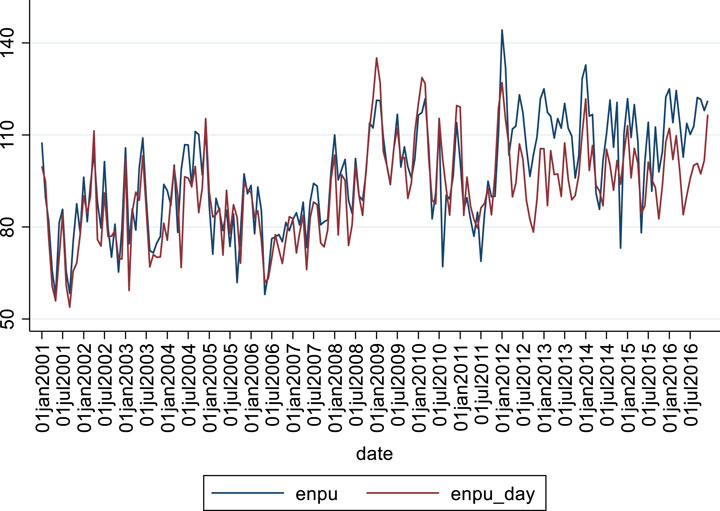
FIGURE 8. The fluctuation trends of EPUI and EPUI_day from 2001 to 2016.
Second, the selection of newspaper samples. In the process of constructing China’s EPUI, we select the data of 460 newspapers distributed in 31 provinces, municipalities, and autonomous regions in China as the newspaper data source, covering the period from 2001 to 2016. In order to test whether the constructed EPUI depends on the selection of newspaper samples, we replace the newspaper samples used in constructing the index, so as to test the correlation between the indexes constructed by different newspaper samples to conduct the robustness test. If the correlation is high, it demonstrates that the EPUI does not depend on the selection of newspaper samples and has high robustness. Otherwise, it means that the EPUI depends on the selection of newspaper samples, and the robustness is low.
The specific processing method is as follows: classify the newspapers in the CNKI newspaper database, and extract the party newspapers of prefecture-level city organs as the article source for constructing EPUI (denoted as EPUI_dang). Because the influence of Party newspapers is different from that of ordinary newspapers. Qin, Strömberg, and Wu (2018) provide some evidence that Party papers focus on political goals, whereas commercial papers focus on economic goals. It shows that the party newspaper has more expression and greater influence in terms of policy uncertainty. Compared with other types of newspapers, Party newspapers in different regions have a wider and more important influence on corporate decision-making.
As can be seen from Table 3; Figure 9, EPUI constructed from 303 prefecture-level party newspapers is highly positively correlated with the EPUI constructed from 460 newspapers, with a correlation coefficient of 0.7930. Obviously, the fluctuation trends of the two indexes are the same, manifesting that the Chinese EPUI constructed in this article is robust.
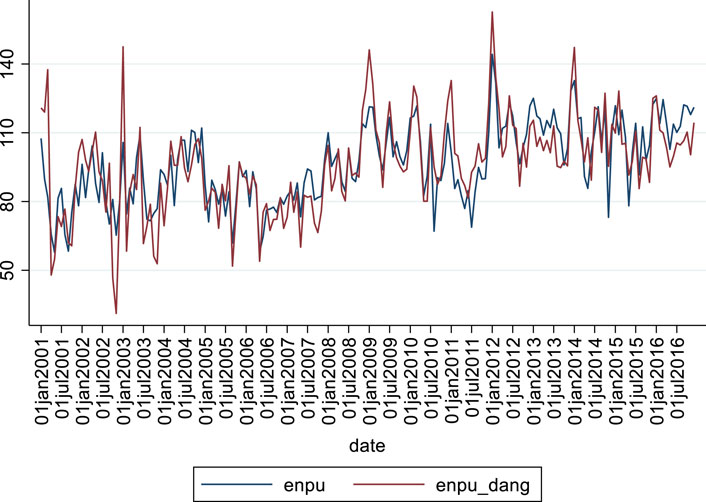
FIGURE 9. The fluctuation trends of EPUI and EPUI_dang from 2001 to 2016.
4 The application of China’s EPUI
4.1 Data description and variable selection
In this paper, the application scenario of China’s EPUI is set at the city level. Data in this article is from the “China City Statistical Yearbook” from 2001 to 2016. The explained variable is the emission of environmental pollutants at the prefecture-level cities, which is recorded as Pollution. Regarding the research settings in existing literature (Huang et al., 2020), this paper selects urban industrial sulfur dioxide emission (denoted as SO2) and carbon dioxide emission (denoted as CO2) as proxy indicators of environmental pollutant emissions. The larger the value, the more pollutants are emitted. In the econometric regression analysis, all pollutant emissions are taken as natural logarithms, which are recorded as ln SO2 and ln CO2, respectively.
The core explanatory variable is China’s prefecture-level EPUI constructed for the first time in this paper. Take the natural logarithm and record it as lnEPUI. In view of the possible endogenous problems between the EPUI and urban pollution emissions, we adopt the logarithm of the EPUI lagging one period as the core explanatory variable. At the same time, a series of city-level control variables are also controlled. First, urban population density, that is, the number of people per unit of land. In this article, it is obtained by dividing the total population of a city by the city’s land area in that year, denoted as DP, and the unit is person per square kilometer. Second, the city’s gross domestic product per capita, that is, the urban GDP per capita, is calculated in this paper by dividing the annual GDP of a city by the total population, denoted as PGDP, and the unit is yuan per person. In the econometric regression analysis, the urban GDP per capita is logarithmized and recorded as ln PGDP. Third, the scale of urban industrial enterprises is mainly represented by the number of industrial enterprises above the designated size in the municipal area, which is recorded as ES. Forth, urban public finance expenditure is expressed by the logarithm of the city’s total public finance expenditure in the current year and recorded as ln PFE. Fifth, the development status of urban tertiary industry is measured by the proportion of urban tertiary industry’s GDP and denoted as TI. Sixth, the level of urban greening is measured by the completed green coverage rate in the city, denoted as GL. Seventh, the logarithm of the output value of urban secondary industry is recorded as ln SGDP. In addition, we also control the city fixed effect and year fixed effect in the econometric regression analysis, which are recorded as City FE and Year FE, respectively.
Table 4 reports the descriptive statistics of relevant variables. As can be seen from Table 4 that the average value and standard deviation of urban industrial sulfur dioxide emission are significantly higher than those of carbon dioxide, indicating that city managers should pay more attention to sulfur dioxide emission reduction in the environmental pollution control. At the same time, it should be noted that industrial sulfur dioxide emissions vary greatly among different cities. The minimum value of China’s city-level EPUI is 0 and the maximum value is 6.913, manifesting that different cities have great differences in issuing and revising local environmental protection laws and regulations. Through the descriptive statistics of the average value, standard deviation, minimum and maximum of each variable, it can be found that there are big differences in the level of economic development, population distribution, and economic structure of different cities in China.
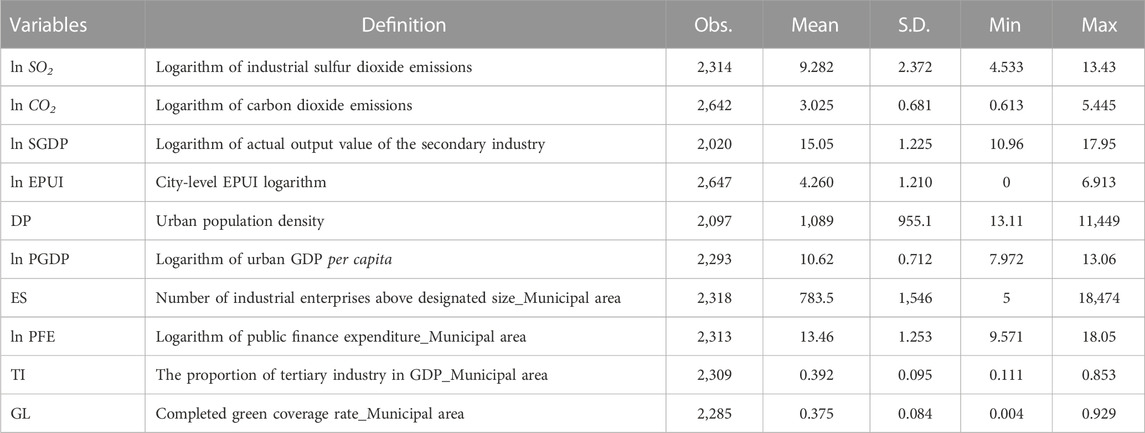
TABLE 4. The descriptive statistics of relevant variables at city level in China.
4.2 Econometric regression model setting
This article uses a two-way fixed effect model with panel data to study the impact of city-level environmental policy uncertainty on urban environmental pollutant emissions. The measurement model is set as follows:
Wherein,
4.3 Econometric regression results and analysis
Table 5 reports the benchmark regression results. Columns 1 and 3 report the direct impact of environmental policy uncertainty on urban industrial sulfur dioxide and carbon dioxide emissions without adding any control variables. The results show that the coefficient of
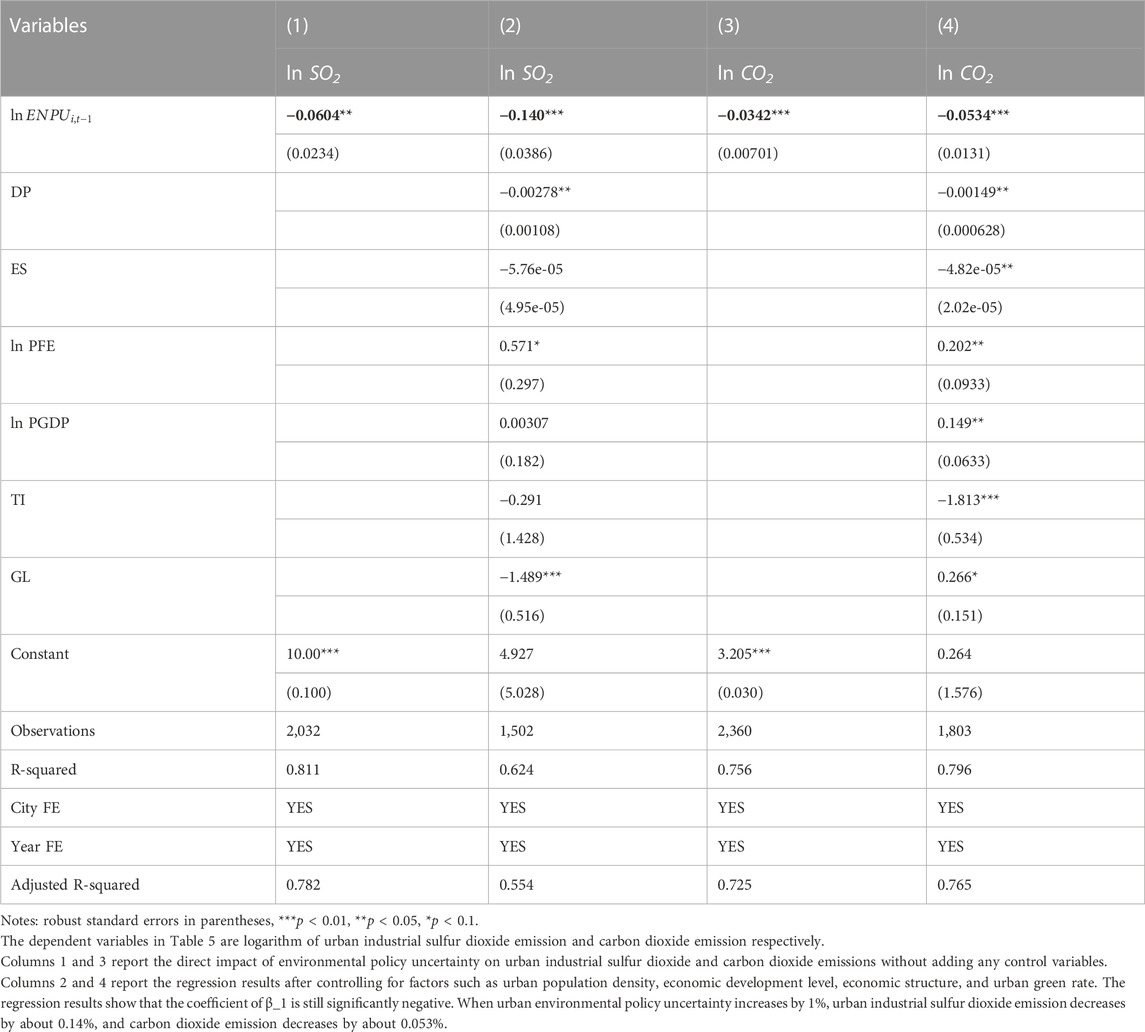
TABLE 5. Benchmark regression results at city level.
In this paper, two methods are used to verify the secondary production scale channel through which environmental policy uncertainty affects urban pollutant emissions. The first is to directly analyze the impact of urban environmental policy uncertainty on the output value of secondary industry, that is, to replace the explained variable in the benchmark regression with the logarithm of the output value of urban secondary industry. The measurement model is set as:
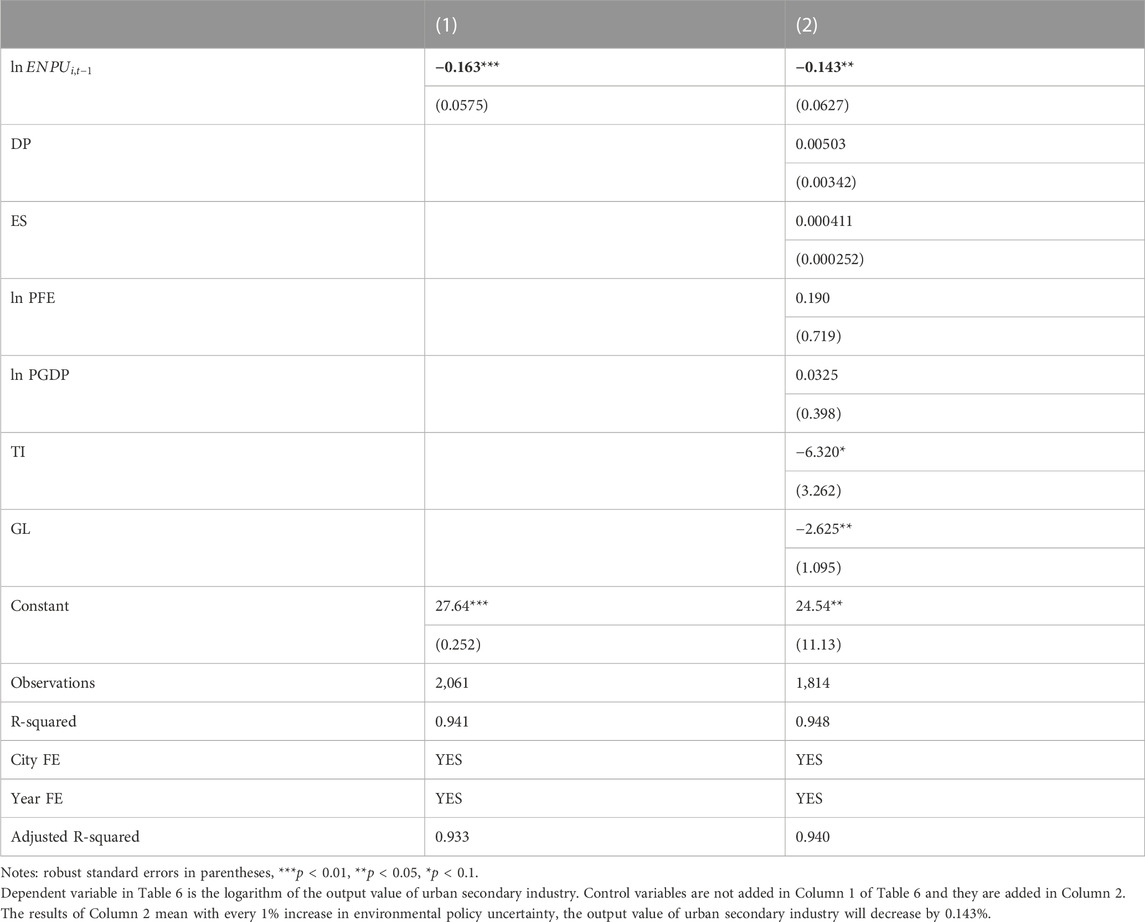
TABLE 6. The regression results of the impact of environmental policy uncertainty on the output value of secondary industry.
The second is to add the interaction term between the output value of urban secondary industry and environmental policy uncertainty in the benchmark regression equation. The measurement model is set as follows:
The regression results are shown in Table 7. The estimated results in Table 7 show that the estimated coefficient of
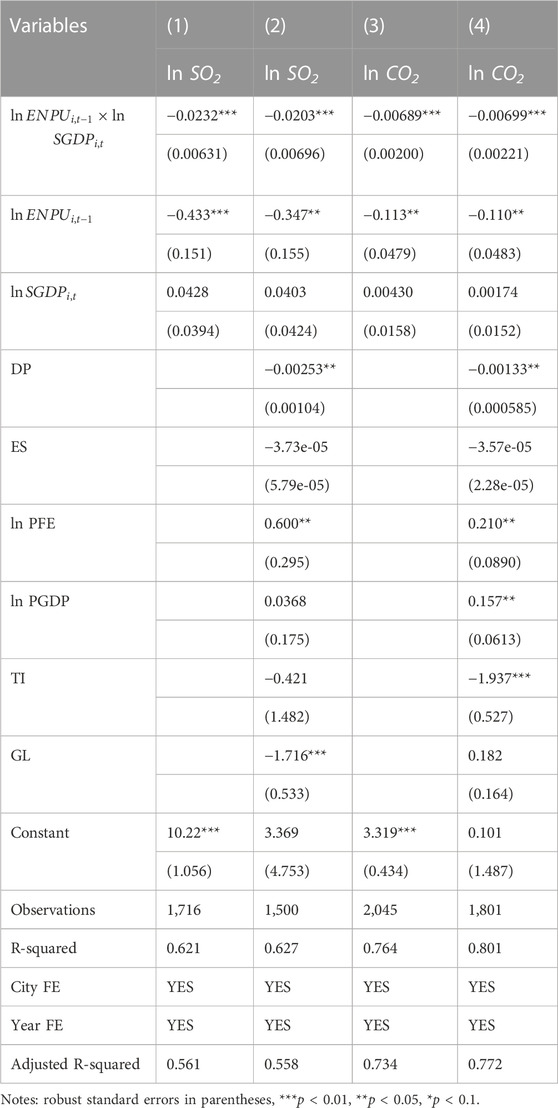
TABLE 7. The regression results of adding the interaction term of environmental policy uncertainty and the output value of secondary industry.
In summary, combined with the regression results in Tables 5–7, it can be concluded that the increase of environmental policy uncertainty will reduce pollutant emissions such as urban industrial sulfur dioxide and carbon dioxide, at the expense of downsizing the output value scale of urban secondary industry. It should be noted that the channel through which environmental policy uncertainty affects urban pollutant emissions is not limited to the scale of secondary industry. There are other transmission channels, such as green investment and technology upgrading. In the future, we would conduct more in-depth and detailed research if we obtain data on green investment and technological upgrading at city level in China.
4.4 Robustness check
We conducted a battery of robustness checks for our baseline analysis to solve the missing variables and endogenous problems that could exist in the estimation.First, we used the GMM regression by using ENPU with one lag as instrumental variable.On the one hand, we used the difference between the ENPU at the prefecture-level city level and the average ENPU at the provincial level as instrumental variable (IV) of the current year’s EPU. The regression results are shown in Table 8. The estimated results in Table 8 show that the estimated coefficient of
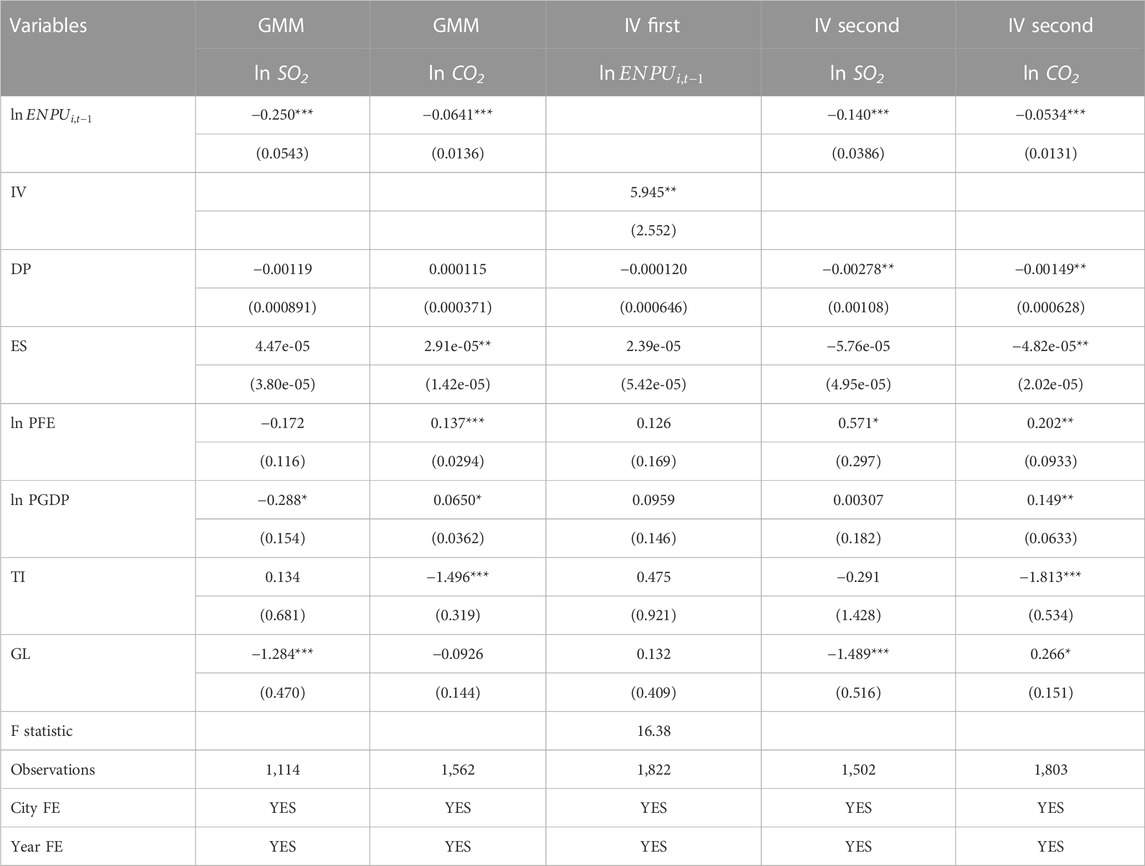
TABLE 8. The regression results of using GMM and Instrument varible as robustness checks.
5 Conclusions and policy implications
This paper selects 460 newspapers from the CNKI newspaper database from 2001 to 2016 as the data source and uses the text analysis method and the construction method of economic policy uncertainty index proposed by Baker et al. (2016) to construct China’s national, provincial and prefecture-level EPUI for the first time. The results show that China’s EPUI has obvious stage characteristics and regional characteristics. Among them, the EPUI of China from 2012 to 2016 is higher than that from 2001 to 2011, and the EPUI of northern provinces is significantly higher than that of southern provinces. From 2001 to 2016, the distribution of EPUI at provincial and prefecture level in China shows obvious regional transfer characteristics, that is, high EPUI gradually shifts from western China to central, eastern, and northeastern China. By applying the Chinese city-level EPUI to the field of urban pollution reduction, we have obtained an important finding that the increase of environmental policy uncertainty will reduce pollutant emissions such as urban industrial sulfur dioxide and carbon dioxide, but at the expense of the development of urban secondary industry.
Based on the conclusions obtained in this article, we propose the following policy recommendations: firstly, when policymakers of government at all levels introduce environmental protection policies, they should have a thorough understanding of local natural resource endowment, geographic location and climate, economic development level and other factors. They need to pay attention to maintaining the consistency and continuity of environmental protection policies in the time dimension, instead of making frequent changes when the environmental protection policies are introduced. At the same time, it is necessary to eliminate the environmental policy confusions caused by divided policies from various sources, and control the uncertainty of environmental policy within a reasonable range. Secondly, although the continuous promulgation and revision of environmental protection policies can effectively reduce urban industrial sulfur dioxide and carbon dioxide emissions, it should be noted that such emission reduction comes at the expense of economic development. How to strike a balance between environmental protection and economic development is a key consideration for policymakers. In the meantime, while continuously improving environmental protection standards in the economically backward central and western inland areas, it is recommended that the central government carry out a certain scale of transfer payments between eastern and western provinces and cities in order to help those inland cities to eliminate the worries of continually improving standards. Finally, the national, provincial, and prefecture-level EPUI constructed in this paper has important application prospects in energy structure transformation and cultivating a low-carbon economy. It also has positive policy guidance for the early realization of the dual carbon goals. Therefore, governments at all levels need to increase funding for various types of basic data research and continuously increase policy support for basic research.
The deficiency of this study is that the application of EPUI only stays at the city level. And the transmission channel through which environmental policy uncertainty affects urban pollutant emissions is only concentrated on the scale of secondary industry, without considering other transmission channels (such as technological innovation) or policy dividends or spillover effects brought to neighboring cities by the introduction or revision of environmental policies. In the future, we would apply the EPUI to more scenarios (such as at enterprise level or household level), or use the spatial econometric regression method to study the spillover effect of environmental policy changes in different regions.
Data availability statement
The original contributions presented in the study are included in the article/Supplementary Materials, further inquiries can be directed to the corresponding author.
Author contributions
RL and JH designed the research. RL helped organize the manuscript. JH performed the analysis. RL and JH revised the manuscript.
Conflict of interest
The authors declare that the research was conducted in the absence of any commercial or financial relationships that could be construed as a potential conflict of interest.
Publisher’s note
All claims expressed in this article are solely those of the authors and do not necessarily represent those of their affiliated organizations, or those of the publisher, the editors and the reviewers. Any product that may be evaluated in this article, or claim that may be made by its manufacturer, is not guaranteed or endorsed by the publisher.
Supplementary material
The Supplementary Material for this article can be found online at: https://www.frontiersin.org/articles/10.3389/fenvs.2023.1203318/full#supplementary-material
Footnotes
1The data comes from the Pkulaw Law Database and its official website is http://www.pkulaw.cn/.
2In 2001, data were missing for five provinces and cities: Tianjin, Heilongjiang, Shandong, Hainan and Ningxia Hui Autonomous Region.
References
Abel, A. B., and Eberly, J. C. (1996). Optimal investment with costly reversibility. Rev. Econ. Stud. 63 (4), 581–593. doi:10.2307/2297794
Anzuini, A., Rossi, L., and Tommasino, P. (2020). Fiscal policy uncertainty and the business cycle: Time series evidence from Italy. J. Macroecon. 65, 103238. doi:10.1016/j.jmacro.2020.103238
Baker, S. R., Bloom, N., and Davis, S. J. (2016). Measuring economic policy uncertainty. Q. J. Econ. 131, 1593–1636. doi:10.1093/qje/qjw024
Bernanke, B. S. (1983). Irreversibility, uncertainty, and cyclical investment. Q. J. Econ. 98 (1), 85–106. doi:10.2307/1885568
Cheng, M., Guo, P., Jin, J. Y., and Geng, H. (2021). Political uncertainty and city bank lending in China: Evidence from city government official changes. Emerg. Mark. Rev. 49, 100802. doi:10.1016/j.ememar.2021.100802
DeLuque, I., and Shittu, E. (2019). Generation capacity expansion under demand, capacity factor and environmental policy uncertainties. Comput. Industrial Eng. 127, 601–613. doi:10.1016/j.cie.2018.10.051
Fernández-Villaverde, J., Guerrón-Quintana, P., Rubio-Ramírez, J. F., and Uribe, M. (2011). Risk matters: The real effects of volatility shocks. Am. Econ. Rev. 101, 2530–2561. doi:10.1257/aer.101.6.2530
Francis, B. B., Hasan, I., and Zhu, Y. (2021). The impact of political uncertainty on institutional ownership. J. Financial Stab. 57, 100921. doi:10.1016/j.jfs.2021.100921
Fu, B., and Luo, D. (2021). Monetary policy uncertainty and bank leverage: Evidence from China. Econ. Lett. 203, 109866. doi:10.1016/j.econlet.2021.109866
Garofalo, G. A., and Malhotra, D. M. (1995). Effect of environmental regulations on state-level manufacturing Capital Formation. J] J. Regional Sci. 35, 201–216. doi:10.1111/j.1467-9787.1995.tb01254.x
Greenstone, M. (2002). The impacts of environmental regulations on industrial activity: Evidence from the 1970 and 1977 clean air Act Amendments and the Census of Manufactures. J. Political Econ. 110, 1175–1219. doi:10.1086/342808
Gulen, H., and Ion, M. (2015). Policy uncertainty and corporate investment[J]. Rev. Financial Stud. 29 (7), 523–564. doi:10.1093/rfs/hhv050
Guo, D., Li, Q., Liu, P., Shi, X., and Yu, J. (2023). Power shortage and firm performance: Evidence from a Chinese city power shortage index. Energy Econ. 119, 106593. doi:10.1016/j.eneco.2023.106593
Handley, K., and Limão, N. (2017). Policy uncertainty, trade, and welfare: Theory and evidence for China and the United States. Am. Econ. Rev. 107, 2731–2783. doi:10.1257/aer.20141419
Huang, G., Zhang, J., Yu, J., and Shi, X. (2020). Impact of transportation infrastructure on industrial pollution in Chinese cities: A spatial econometric analysis. Energy Econ. 92, 104973. doi:10.1016/j.eneco.2020.104973
Huang, Y., and Luk, P. (2020). Measuring economic policy uncertainty in China. China Econ. Rev. 59, 101367. doi:10.1016/j.chieco.2019.101367
Julio, B., and Yook, Y. (2012). Political uncertainty and corporate investment cycles. J. Finance 67, 45–83. doi:10.1111/j.1540-6261.2011.01707.x
Li, M., Cao, Y., Lu, M., and Wang, H. (2021a). Political uncertainty and allocation of decision rights among business groups: Evidence from the replacement of municipal officials. Pac. Basin Finance J. 67, 101541. doi:10.1016/j.pacfin.2021.101541
Li, X. L., Li, J., Wang, J., and Si, D. K. (2021b). Trade policy uncertainty, political connection and government subsidy: Evidence from Chinese energy firms. Energy Econ. 99, 105272. doi:10.1016/j.eneco.2021.105272
Liu, G., Hu, M., and Cheng, C. (2021a). The information transfer effects of political connections on mitigating policy uncertainty: Evidence from China. J. Corp. Finance 67, 101916. doi:10.1016/j.jcorpfin.2021.101916
Liu, N., Tang, S. Y., Zhan, X., and Lo, C. W. H. (2018). Policy uncertainty and corporate performance in government-sponsored voluntary environmental programs. J. Environ. Manag. 219, 350–360. doi:10.1016/j.jenvman.2018.04.110
Liu, X., Ji, Q., and Yu, J. (2021b). Sustainable development goals and firm carbon emissions: Evidence from a quasi-natural experiment in China. Energy Econ. 103, 105627. doi:10.1016/j.eneco.2021.105627
Mcdonald, R., and Siegel, D. (1984). Option pricing when the underlying Asset Earns a below-equilibrium rate of Return: A note. J. Finance 39 (1), 261–265. doi:10.1111/j.1540-6261.1984.tb03874.x
Mumtaz, H., and Surico, P. (2018). Policy uncertainty and aggregate fluctuations. J. Appl. Econ. 33, 319–331. doi:10.1002/jae.2613
Pirgaip, B., and Dinçergök, B. (2020). Economic policy uncertainty, energy consumption and carbon emissions in G7 countries: Evidence from a panel granger causality analysis. Environ. Sci. Pollut. Res. 27, 30050–30066. doi:10.1007/s11356-020-08642-2
Qin, B., Strömberg, D., and Wu, Y. (2018). Media bias in China. Am. Econ. Rev. 108 (9), 2442–2476. doi:10.1257/aer.20170947
Schubert, K., and Smulders, S. (2019). How important are uncertainty and dynamics for environmental and climate policy? Some analytics. J. Environ. Econ. Manag. 97, 1–22. doi:10.1016/j.jeem.2019.102249
Shah, A. A., Dar, A. B., and Bhanumurthy, N. R. (2021). Are precious metals and equities immune to monetary and fiscal policy uncertainties? Resour. Policy 74, 102260. doi:10.1016/j.resourpol.2021.102260
Tran, D. V., and Houston, R. (2021). The effects of policy uncertainty on bank loan loss provisions. Econ. Model. 102, 105575. doi:10.1016/j.econmod.2021.105575
Wang, K., Wang, Z., Xian, Y., Shi, X., Yu, J., Feng, K., et al. (2023). Optimizing the rolling out plan of China’s carbon market. Iscience 26 (1), 105823. doi:10.1016/j.isci.2022.105823
Xia, T., Yao, C. X., and Geng, J. B. (2020). Dynamic and frequency-domain spillover among economic policy uncertainty, stock and housing markets in China. Int. Rev. Financial Analysis 67, 101427. doi:10.1016/j.irfa.2019.101427
Keywords: post-COVID-19 era, energy transition, energy structures, pollutant emissions, environmental policy uncertainty, advanced analytical techniques
Citation: Li R and He J (2023) Impacts of environmental policy uncertainty on urban environmental pollutant emissions in China: a study based on textual analysis. Front. Environ. Sci. 11:1203318. doi: 10.3389/fenvs.2023.1203318
Received: 10 April 2023; Accepted: 05 May 2023;
Published: 16 May 2023.
Edited by:
Tsun Se Cheong, Hang Seng University of Hong Kong, ChinaReviewed by:
Shuo Zhou, Beijing Information Science and Technology University, ChinaYu He, China University of Geosciences, China
Copyright © 2023 Li and He. This is an open-access article distributed under the terms of the Creative Commons Attribution License (CC BY). The use, distribution or reproduction in other forums is permitted, provided the original author(s) and the copyright owner(s) are credited and that the original publication in this journal is cited, in accordance with accepted academic practice. No use, distribution or reproduction is permitted which does not comply with these terms.
*Correspondence: Jing He, amluZ2hlQGNhdS5lZHUuY24=