Abstract
Landslide susceptibility mapping (LSM) is essential for land-use planning, as it helps to identify areas at risk of landslides and enables effective prevention measures to be taken. Various statistical and machine learning (ML) models are used in LSM, including SVM and ANFIS, which have shown promising results. However, determining which model performs better remains a key challenge. To address this issue, this paper aims to compare six hybrid models constructed with two well-known and powerful ML models, namely SVM and ANFIS, and three meta-heuristic algorithms, namely Genetic Algorithm (GA), Differential Evolution (DE), and Cultural Algorithm (CA), for LSM in a case study in western Serbia. In the process of building the models, 359 landslide sites and 14 determinants were used. The accuracy of the models was evaluated using several indexes, including Root Mean-Squared Error (RMSE), coefficient of determination (R2), and Area under the Receiver Operating Characteristic Curve (AUROC). The modeling results showed that the SVM-GA model has the highest accuracy (AUROC = 0.78) in predicting landslide incidence, followed by the ANFIS-GA (AUROC = 0.775), SVM-CA (AUROC = 0.773), ANFIS-DE (AUROC = 0.771), SVM-DE (AUROC = 0.76), and ANFIS-CA (AUROC = 0.65) models in validation phase. Therefore, the study suggested that SVM-based hybrid models are more accurate than ANFIS-based models for LSM, and thus, modelers may use SVM-based hybrid models for such applications. This study provides valuable insights into identifying the most appropriate and effective models for LSM, which can help to mitigate the risks associated with landslides and ensure sustainable land-use practices.
1 Introduction
Landslides are a type of natural hazard that can have significant impacts on human lives and the environment. These disasters are often more manageable than other natural disasters, so studying this phenomenon is of great importance in order to minimize losses caused by it (Magliulo et al., 2008; Sestras et al., 2018). This phenomenon accounts for more than 9.0% of disasters worldwide (Sestras et al., 2018; Magliulo et al., 2008). It is referred to as the mass movement of the slope materials such as rocks, soil, and artificial embankments (or a combination thereof) under the influence of gravity. Landslides are prevalent in hilly and mountainous areas (Sestras et al., 2021), occurring along a certain surface of rupture (Bobrowsky and Highland, 2013). They may occur with heavy rainfall or due to droughts, earthquakes, or volcanic eruptions, which are common in areas with long, steep hillsides (mountains), cliffs, escarpments, or rough hilly terrain (Zêzere et al., 1999). Mountainous areas are most commonly affected by this phenomenon, but it can occur in low-altitude areas due to human activities. These activities include excavation or backfilling during drilling operations for road and building construction, rupture of riverbanks, sideways development of landslides, collapse of deposited masses from mines (especially coal) and various slope ruptures related to rock mines and open-pit mines (Zêzere et al., 1999; Wang et al., 2014; Yan et al., 2019). The most common cause of landslide is when the downslope forces on hillsides become greater than the strength of the materials composing the slope. This can occur due to intense rain or snowfall (Yilmaz and Keskin, 2009). Researchers working on landslide susceptibility mapping (LSM) investigate the causative factors contributing to landslides. This information can help decision-makers develop strategies for mitigating landslide damages. The goal of this study is to create maps for areas prone to landslides, through zonation of landslide-susceptible areas, as a key steps to effectively manage damages caused by landslides (Hearn and Hart, 2019).
Zoning of landslide-prone areas is a standard tool that supports land use planning and decision-making (Guzzetti et al., 1999). To achieve this, Geographic Information System (GIS) and remote sensing (RS) have incorporated knowledge-based models such as Analytic Hierarchy Process (AHP) and data-driven models like various neural networks for zoning of landslide-prone areas (Guzzetti et al., 1999; Althuwaynee et al., 2014; Zhu et al., 2018; Zheng et al., 2022). Each of these approaches has certain advantages and disadvantages (Arabameri et al., 2018; Zhu et al., 2018; Meng et al., 2022). Artificial Intelligence (AI) plays a vital role in numerous fields including healthcare, finance, and transportation, revolutionizing processes, enhancing decision-making capabilities, and facilitating advancements to propel us into a more efficient and innovative future (Choudhuri et al., 2022; Hu et al., 2022; Shakeel and Shakeel, 2022). Data-driven models are an integral part of AI systems, as AI algorithms require large amounts of data to learn and make intelligent decisions (Ahmad, 2022; Ma et al., 2022; Wu et al., 2022). In data-driven methods, there may be some uncertainty associated with the random selection of locations that have no landslide potential (Pal and Chowdhuri, 2019; Pal et al., 2022a; Saha et al., 2022). Conversely, while landslide occurrence data are not required in knowledge-based approaches, human bias can affect modeling results (Abdul-Hamid et al., 1999; Li and Li, 2009), thereby also contributing to some degree of uncertainty (Pal et al., 2022b). Beside these pros and cons of the two approaches, if accurate data on landslide locations are available, data-driven models produce better results than knowledge-based models (Ashournejad et al., 2019). Furthermore, for developing models in data sparse areas, using knowledge-based approaches can be a suitable alternative (Daly et al., 2002; Li and Li, 2009; Ashournejad et al., 2019; Sarkar et al., 2022). Among data-driven models, two commonly used techniques are the support vector machine (SVM) and adaptive neuro-fuzzy inference system (ANFIS) (Pradhan, 2013; Chen et al., 2017; Panahi et al., 2020). Numerous studies have compared SVM and ANFIS and have shown that one may perform better than the other (Salahshoor et al., 2010; Tabari et al., 2012; Pradhan, 2013; Chen et al., 2017; Mokhtarzad et al., 2017; Seifi et al., 2020). Therefore, the question of which technique performs better in LSM will be investigated in this study.
The ANFIS model, which combine the fuzzy inference system (FIS) and artificial neural network (ANN), has proven to be a powerful and flexible tool for modeling and forecasting natural disasters such as landslides (Oh and Pradhan, 2011; Polykretis et al., 2019; Paryani et al., 2020; Chen et al., 2021). Numerous studies have shown that the combination of FIS and ANN significantly improves the performance of the ANN (Çaydaş et al., 2009; Moghaddamnia et al., 2009). However, meta-heuristic algorithms like genetic algorithm (GA) and cultural algorithm (CA) must be employed to tube the hyper-parameters of the ANFIS model (Kaur and Chahal, 2020; Fattahi and Hasanipanah, 2022). Also, researchers have used the SVM model–a data-driven model combining statistical methods and machine learning–for hazard mapping (Ballabio and Sterlacchini, 2012; Lee et al., 2017). The hyper-parameters of the SVM model and its kernels have been chosen using various methods including grid search (GS) and GA (Li and Kong, 2014; Shafizadeh-Moghadam et al., 2017). Moreover, radial basis function (RBF) of SVM model is the most frequently used kernel due to its accurate results compared to other kernels like linear, sigmoid, and polynomial [36]. Also, various studies have shown that SVM is an accurate model in hazard mapping (Tehrany et al., 2015; Huang and Zhao, 2018). However, recent studies have paid little attention to the impact of optimal parameter selection for the SVM model and its kernels, while the effectiveness of SVM is highly dependent on the accurate determination of model parameters and kernels, and this should be taken into account in future research. Furthermore, there have been few studies comparing the performance of SVM-based hybrid models to that of ANFIS-based hybrid models.
In this study, we propose the use of six hybrid models that combine SVM and ANFIS, incorporating GA, Differential Evolution (DE), and CA meta-heuristic algorithms, to address LSM in a specific case area located in Serbia. Our primary objective is to compare the performance and accuracy of the six aforementioned hybrid models and assess their goodness of fit in LSM applications. To optimize the performance of the ANFIS and SVM models, we employ a combination of GA, DE, and CA algorithms to select the most appropriate set of parameters. It is worth mentioning that very few studies have explored this particular comparison of modeling techniques in the context of LSM. Therefore, this study aims to fill this research gap and contribute to the existing body of knowledge in the field of LSM by conducting an in-depth analysis of these hybrid models.
2 Study area
The area under study covers approximately 625.5 km2 between longitudes 19°06.3′E to 19°41.9′E, and latitudes 44°12.5′N to 44°29.6′N. It is located on the west of the Republic of Serbia (Figure 1). Most of the study area belongs to Krupanj and Osečina municipalities comprising of 63 villages. This study area includes 65 settlements with about 28,000 residents: 11512 in Osecina (0.16% of the total population of Serbia) and 16,038 in Krupanj (0.23% of the total population of Serbia).
FIGURE 1

Study area location.
In morphological terms, the region is characterized as mountainous, with altitudes ranging from 150 m above sea level (a.s.l.) to 990 m a.s.l. The study area is predominantly hilly and mountainous, replete with pastures and forests, through which clear, rapid streams flow.
The valleys and hills are directed mainly towards the northwest-southeast, parallel to geological races. The area is surrounded by the Boranje (856 m a.s.l.), Jagodnje (939 m a.s.l.) and Sokolska Planina (973 m a.s.l) mountains and experiences moderately continental weather, with sub-mountain weather elements evident at higher elevations. The average annual precipitation amounts range from 850 to 1,000 mm. The study area is distinguished with complex geological structure with sedimentary deposits being the most prevalent.
Frequent landslides are typically characterized by sharp topography, active seismicity, geology, climatic phenomena, as well as anthropogenic activities on unstable slopes. The study area is one of the regions most affected by natural disasters, particularly in the middle of May 2014 when heavy rain caused significant flooding and landslides, impacting Serbia. As a result, a large number of landslides, demolitions, and damages were activated, affecting over 700 objects and endangering human lives (Đokanović, 2016). The property damage was estimated to be about US$100 million. To this day, a considerable number of landslides remains active in the area. The landslide cadaster contains 359 recorded landslide locations in the study area. In 2019 alone, approximately 6,050 individuals in the study area were threatened by landslides. Critical factors related to landslides.
2.1 Critical factors related to landslides
The first step in hazard zonation is to collect data and information on previous landslides and explanatory factors that contribute to landslide incidence (Van Westen et al., 2008). Various factors such as elevation, slope, aspect, geological structure, mineral composition of the land, groundwater level, earthquakes, distance from the fault, land use, vibrations induced by traffic and construction machinery, waterways, rainfall/snowfall, weathering cycle (moistened/dried, dissolution), subsidence, trenching, and digging holes can lead to slopes instability (Domínguez-Cuesta et al., 2007; Kavzoglu et al., 2015). In this study fourteen factors including slope, elevation, aspect, land use land cover (LULC), distance to rivers, rainfall, distance to faults, the normalized difference vegetation index (NDVI), distance to roads, sediment transport index (STI), topographic wetness index (TWI), stream power index (SPI), lithology, and distance to urban areas were considered significant factors in landslide hazard zonation. These factors were prepared using spatial analyses in the GIS environment. The Advanced space-borne thermal emission and reflection radiometer digital elevation model (ASTEMR DEM) with a resolution of 30 m was used to extract significant topographic factors such as slope and aspect, which are essential in controlling the occurrence of landslides and are used in almost all landslide zonation studies.
Landslides are more likely to occur at high altitudes since soil organic matters such as carbon and nitrogen in those areas are responsible for dehydrogenase activity and have a positive effect on landslide occurrence. There are different opinions among scholars about the effect of aspect on landslides occurrence. Some consider it an influential factor (Yalcin and Bulut, 2007; Galli et al., 2008), while others showed that aspect is not involved in the occurrence of this phenomenon (Cevik and Topal, 2003; Ayalew and Yamagishi, 2005). In the current study, this factor was considered one of the predisposing factors for landslide occurrence. The slope factor is also an important factor in landslide incidence. Average annual rainfall is a significant climatic factor in landslide incidence (Martelloni et al., 2012). Landslides induced by rainfall are generally more frequent than those induced by earthquakes (Bai et al., 2020). In this study, this factor was classified into five categories (Figure 2).
FIGURE 2
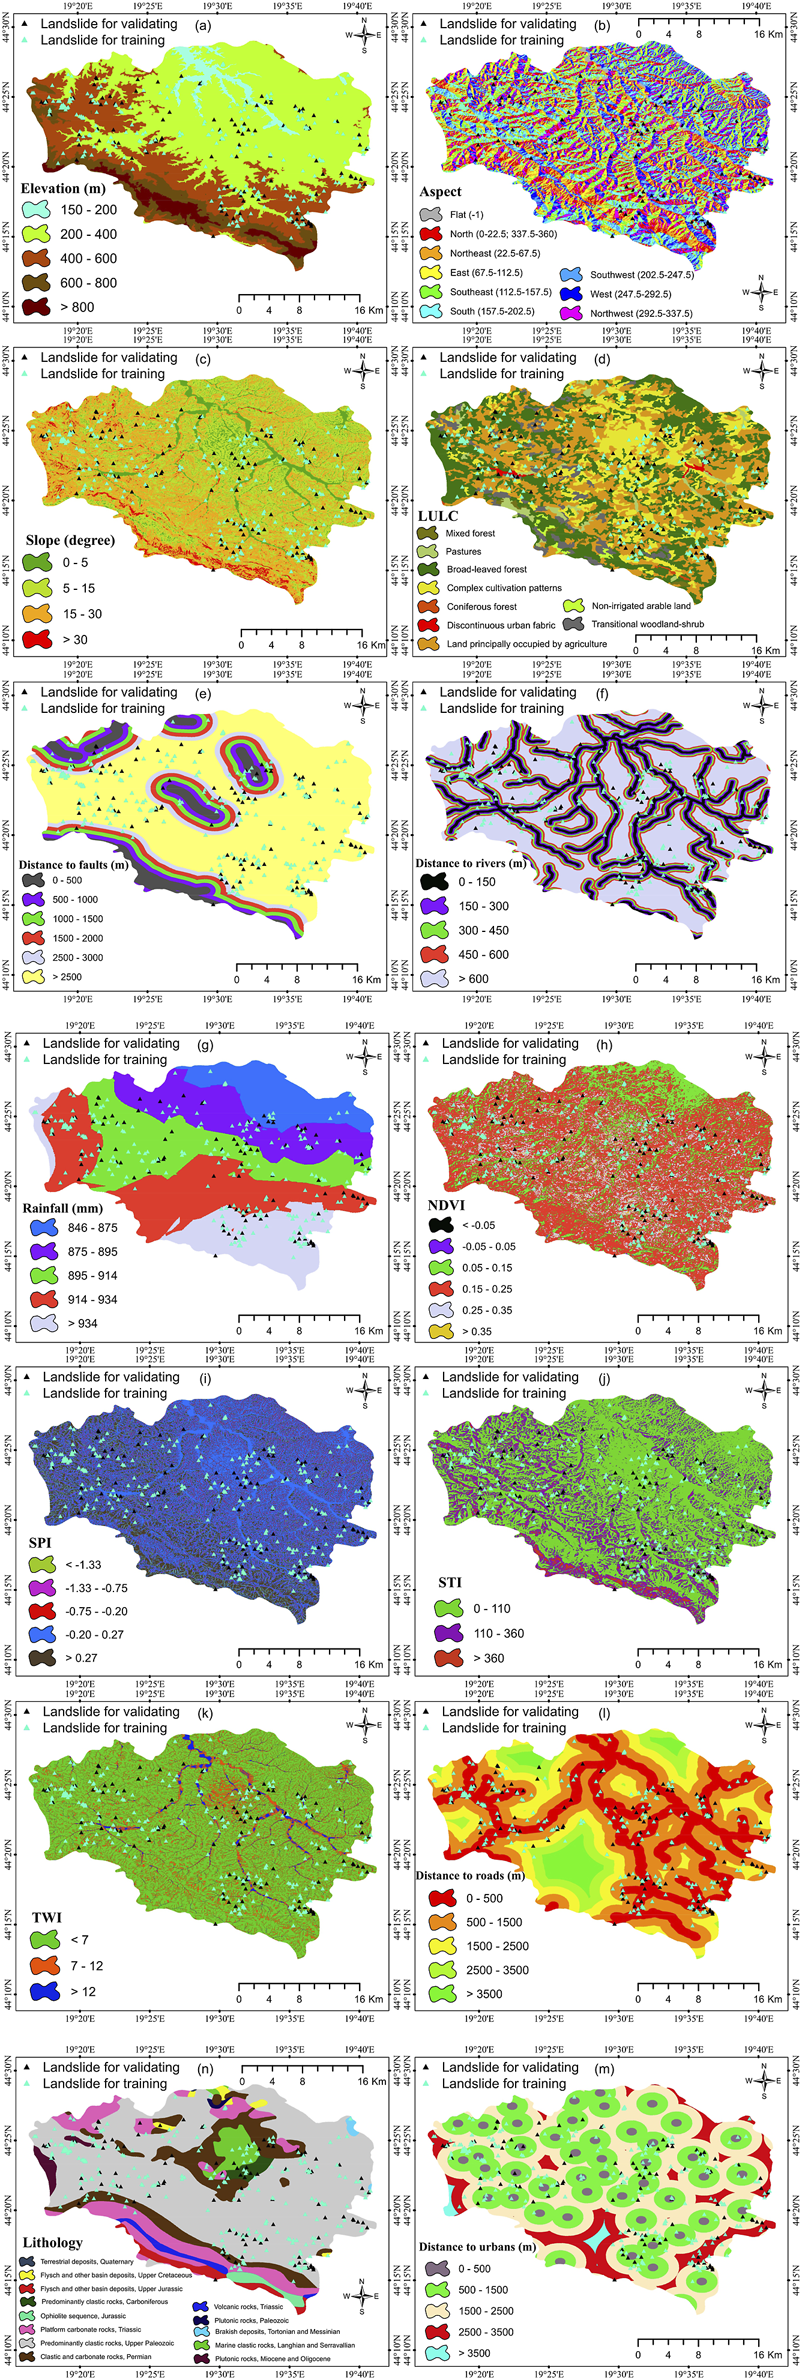
Conditioning factors for landslide susceptibility mapping.
NDVI is one of the factors derived from LANDSAT TM/ETM images and was classified into six classes (Figure 2). STI, SPI, and TWI present the hydrological conditions and are among the most common landslide conditioning factors in most studies. SPI indicates the erosive energy of the stream and was classified into five classes. TWI reflects the effect of local topography on the hydrological conditions. Three significant human-made landslide factors including distance from urban areas, LULC, and distances from roads were taken into consideration in this study. LULC, as an important landslide factor, was classified into nine classes. Changes in LULC can increase the number of landslides and accelerate the trend of a landslide (Meneses et al., 2019). Roads change the natural landscape and the natural slope of the land surface. They also apply an excessive load on the lower parts of the land, which results in increased landslide hazard in the proximity to roads. This important factor was classified into five classes. Distance from river is a slope instability factor that was classified into five classes. Faults are tectonic fractures that usually reduce the stress applied to the rocks. However, displacement and activity of faults can be effective in landslide occurrence. Therefore, distance from faults as an important factor was used and classified into six classes. Lithology is another significant factor in the study of landslides, and rock structures show different reactions to this phenomenon. Depending on the rock types observed in the study area, this factor was classified into thirteen classes.
3 Methodology
Fourteen factors and 359 landslide locations were used to train the models. Of the 359 landslide locations, 70.0% were used during the training runs and the remaining 30.0% were used in the validation runs. The correlation between the classes corresponding to each factor and the occurrence of landslides was calculated using the frequency ratio (FR) method. After weighing every class of the factors, the hyper-parameters of the SVM model and the parameters of ANFIS model were calculated and tuned using three meta-heuristic algorithms, namely GA, DE, and CA. Once these hyper-parameters were calculated, hybrid models were developed by using the three models and the accuracy of each model was assessed using the Root Mean-Squared Error (RMSE) and the Area under the Receiver Operating Characteristic Curve [AUROC; (Ruidas et al., 2022b; Ruidas et al., 2023)] criteria. Subsequently, landslide susceptibility maps were generated. Figure 3 presents the methodological flow chart of the modeling framework for LSM in this paper. The details of all models are explained in the following sections.
FIGURE 3

Methodological flow chart of modeling framework for landslide susceptibility mapping.
3.1 Support vector machine (SVM)
SVM has been directly derived from Vapnik’s statistical learning theory and is primarily used for classification problems (Vapnik et al., 1995). Later, this algorithm was developed to solve regression problems or data estimation as well (Benkedjouh et al., 2015; Ruidas et al., 2021; Ruidas et al., 2022a). Let assume that we have a set of data in the form of . This implies that each sample (X) has n dimensions (an n-dimensional vector of predictor variables), and binary values of 0 or 1 correspond to each of these samples for the Y variable (e.g. landslide occurrence). Eq. 1 shows the final equation of the SVM model:
In Eq. 1, ≥0 and ≥0 are the Lagrange coefficients; is a kernel function and b is calculated by Eqs 2, 3:
Where w is the weight vector; C is constant and ε is deviation from hyper-plane.
SVM includes four types of functions, each of which consists of three parameters: the regularization parameter (C) that avoids over-fitting and controls the trade-off between SVM errors on the training data and the margins; a margin of tolerance (ε) that approximates the SVM model; and kernel parameters, such as the Gamma (γ) parameter that controls the degree of non-linearity for the RBF kernel (Chapelle et al., 2002). To achieve better performance, these parameters should be tuned. Eq. 4 shows RBF kernel function with its related parameters. This study used the LIBSVM package, a library for SVM implementation in MATLAB to run the models (Chang and Lin, 2011). Additionally, hyper-parameters of the SVM model will be tuned using GA, DE, and CA.
3.2 Adaptive neuro-fuzzy inference system (ANFIS)
ANFIS, first proposed by Jang (1993), is a type of Neuro-Fuzzy System intended to solve nonlinear and complex problems by implementing the principles of fuzzy logic and ANN in one framework (Jang, 1993). The ANFIS structure has two main parts: premise and consequence parameters, which need to be determined and optimized. The determination of these parameters is part of the training process of ANFIS (Karaboga and Kaya, 2019). The ANFIS model consists of 5 layers (Ahmadlou et al., 2019). To train ANFIS, it is necessary to determine the values of premise and consequence parameters using an optimization algorithm. In this study, three meta-heuristic algorithms (GA, DE, and CA) were used to tune the values of these parameters.
3.3 Genetic algorithm (GA)
The GA is a principal meta-heuristic algorithm inspired by Darwin’s evolutionary theory (Holland, 1992). In the GA, a random set of solutions to the problems is initially generated (Holland, 1992). An evaluation function is then used to select the solutions with the best goodness-of-fit index. Special operators like mutation and crossover are then used to produce the next solution set. In this algorithm, each solution is represented by a chromosome, and each solution parameter is a gene. The total set of all solutions is also known as a generation. The primary genetic operators are selection, crossover, and mutation. The selection operator plays a crucial role in the GA by identifying promising solutions that will form the basis of the next-generation. The fitness function is used to evaluate each candidate solution’s suitability for solving the problem at hand, and this information is then used to determine their probability of being selected for the next-generation. By using techniques like the roulette wheel or other methods, the selection operator can effectively balance exploration (i.e., sampling widely across the solution space) with exploitation (i.e., focusing on promising solutions). This helps ensure that the algorithm converges towards high-quality solutions over time. Using the crossover operator, the selected solutions are then combined to generate new solutions. The crossover can be of one-point, two-point, multi-point, or uniform types. The mutation operator randomly selects some solutions and randomly changes some of their genes. In this algorithm, solutions can be coded via different ways like permutation encoding, binary encoding, tree encoding, and value encoding. In other words, in the GA, instead of directly working on problem parameters and variables, their encoded form is utilized.
3.4 Differential Evolution (DE)
DE is one of the evolutionary algorithms, and its main difference with GA lies in order of mutation and crossover operators, and how the selection operator works (Storn, 1999; Price et al., 2006). DE uses a differential operator to produce new solutions, allowing for an exchange of information among population members. An advantage of DE is that it can retain the information from good solutions in memory. This algorithm begins by setting three parameters: scaling factor (F), crossover rate (), and population size (N), and includes four main steps, initiation, mutation, crossover, and selection.
Initiation: In this step, the initial population size (Np) is randomly generated. Next, four members are randomly select from the population. One of these four members is randomly chosen as the target vector, and the others are considered vectors 1, 2, and 3 (Tien Bui et al., 2017).
Mutation: In this step, to produce the mutated or differential (donor) vectors, the difference between vector 2 and vector 3 is first multiplied by the F factor and then added to vector 1. The mutated vector is calculated according to Eq. 5:
In this equation, r1, r2, and r3 are indices that are randomly selected such that [r1 ≠ r2 ≠ r3 ≠ i]. , , and are vectors that are randomly chosen from the populations.
Crossover: In this step, a crossover is performed between the mutated and target vector, and the trial vector is generated using Eq. 6 (Hong et al., 2018);where is a uniform random number and q is the index used to confirm the selection of at least one parameter in the mutant vector.
Selection: The selection operation is employed to select the optimum solutions for the forthcoming generation using Eq. 7. In this step, the fitness value of the trial and target vectors is compared. If the trial vector has a greater value than the target vector, it will be one of the members of the new generation.
Where, is the parent vector, and f (*) is the fitness function.
3.5 Cultural algorithm (CA)
Reynolds introduced CA as an evolutionary algorithm in 1994 (Reynolds, 1994). With the concept of collective intelligence developed in the 19th century, CA offers an ideal framework for numerous theories of social evolution. It is a computer-based model of cultural evolution used to solve optimization issues that require a large amount of domain knowledge to guide the collective actions of a population of individuals. CA has been used to solve problems with a bundle of data, with various parameters and a lot of agents in a big distributed social network. CA combines evolutionary systems and agents employing different knowledge sources for the evolution process, as determined by social structures (Tien Bui et al., 2018).
3.6 SVM and ANFIS-based meta-heuristic hybrid models for LSM
Tuning SVM hyper-parameters is essential for achieving a model with good performance. GS method, which involves changing the hyper-parameters with the fixed step size, is one of the traditional methods used to determine these parameters. However, this approach has high computational complexity and may not be suitable when dealing with numerous parameters. To address this limitation, evolutionary algorithms have been employed for hyper-parameter selection in various models such as ANNs, ANFIS, among others. In these study, we applied three meta-heuristic algorithms namely GA, DE, and CA to tune the RBF kernel hyper-parameters (γ, C, ε) of SVM. For the GA algorithm, we followed the procedure outlined below:
Firstly, the population size and chromosome length were set at 20 and 3, respectively, to tune the three parameters. Subsequently, the values of these three parameters in each chromosome were inserted into the SVM model, and modeling was performed using training data. Afterward, the output of the models was compared with the real values and the RMSE values were calculated using Eq. 8 (Pal et al., 2022b):
Where N, , and represent the number of samples, actual landslide observations, and model outputs, respectively. Chromosomes with low RMSE values indicate good fitness. Tournament selection was used to select chromosomes for the next generations due to its efficiency and ease of implementation. In the designed GA, the elitism ration, crossover rate, crossover method, mutation ratio, number of generations, and elite count were set to 0.7, 1, 0.05, two points, 400, and 1 respectively. A similar procedure was chosen for the other two algorithms. ANFIS is one of the most widely used and well-known LSM algorithms which require tuning of two sets of hyper-parameters–consequence and premise. GA, DE, and CA were used to tune these parameters and obtain an accurate prediction model. All models were coded in MATLAB software.
4 Results
The weight of each class of variables that influence landslide incidence was determined using FR (Table 1). In the altitude factor, although the highest number of the landslides was found in the 200–400 m class, the class 400–600 m had the highest weight in the FR model. Areas with a height above 800 m did not affect the incidence of landslide in this factor. For the aspect factor, all classes had almost similar impacts on the incidence of landslides and the ‘flat’ class only had the lowest importance. Concerning the slope factor, slopes below 5% and above 30% had the least participation in the occurrence of landslides, whereas slopes between 5% to 15% and 15%–30% had a significant effect on the incidence of landslides. Landslides were more prevalent in precipitation classes 895–914 m and 914–934 m. Moreover, the highest weights for the remaining factors were associated with SPI<−1.33, TWI between 7 and 12, STI between 110 and 360, distance from the river within 0–150 m, distance to fault greater than 2,500 m, NDVI between −0.05 and 0.05, Brakish deposits, Tortonian and Messinian classes from the geology class, and discontinuous urban fabric from the land use factor. Tables 2, 3 show various types of classes for LULC and lithology factors, respectively.
TABLE 1
| Factor | Class | No. of pixels | No. of landslides | FR weights |
|---|---|---|---|---|
| Altitude (meter) | 150–200 | 60802 | 8 | 0.82 |
| 200–400 | 880036 | 132 | 0.94 | |
| 400–600 | 422154 | 102 | 1.51 | |
| 600–800 | 140390 | 8 | 0.36 | |
| > 800 | 60956 | 0 | 0 | |
| Aspect | Flat | 23970 | 2 | 0.52 |
| North | 213365 | 31 | 0.91 | |
| North east | 211820 | 36 | 1.06 | |
| East | 196371 | 40 | 1.27 | |
| Southeast | 192268 | 37 | 1.20 | |
| South | 178309 | 29 | 1.01 | |
| Southeast | 175108 | 21 | 0.75 | |
| West | 175180 | 28 | 1.00 | |
| Northwest | 197947 | 26 | 0.82 | |
| Slope (degree) | 0–5 | 165575 | 12 | 0.45 |
| 5–15 | 695326 | 125 | 1.12 | |
| 15–30 | 655957 | 113 | 1.08 | |
| > 30 | 47480 | 0 | 0 | |
| Rainfall (millimeters) | 846–875 | 201662 | 15 | 0.46 |
| 875–895 | 285811 | 40 | 0.87 | |
| 895–914 | 366078 | 68 | 1.16 | |
| 914–934 | 441744 | 75 | 1.06 | |
| > 934 | 267230 | 52 | 1.22 | |
| NDVI | <-0.05 | 2 | 0 | 0 |
| −0.05–0.05 | 1105 | 1 | 5.66 | |
| 0.05–0.15 | 323969 | 26 | 0.50 | |
| 0.15–0.25 | 1055144 | 175 | 1.04 | |
| 0.25–0.35 | 169894 | 47 | 1.73 | |
| > 0.35 | 12902 | 1 | 0.48 | |
| SPI | <-1.33 | 39695 | 9 | 1.42 |
| −1.33–0.75 | 113843 | 20 | 1.10 | |
| −0.75–0.20 | 125929 | 10 | 0.50 | |
| −0.20–0.27 | 887284 | 126 | 0.89 | |
| >0.27 | 397587 | 85 | 1.34 | |
| STI | 0–110 | 1117887 | 168 | 0.94 |
| 110–360 | 407464 | 80 | 1.23 | |
| > 360 | 38987 | 2 | 0.32 | |
| TWI | <7 | 1173945 | 188 | 1.00 |
| 7–12 | 346425 | 58 | 1.05 | |
| >12 | 43968 | 4 | 0.57 | |
| Distance to rivers (meter) | 0–150 | 227298 | 50 | 1.38 |
| 150–300 | 219276 | 44 | 1.26 | |
| 300–450 | 206833 | 28 | 0.85 | |
| 450–600 | 197311 | 42 | 1.33 | |
| > 600 | 713620 | 86 | 0.75 | |
| Distance to faults (meter) | 0–500 | 100547 | 5 | 0.31 |
| 500–1000 | 103668 | 8 | 0.48 | |
| 1000–1500 | 113521 | 17 | 0.94 | |
| 1500–2000 | 116770 | 17 | 0.91 | |
| 2000–2500 | 124104 | 21 | 1.06 | |
| > 2500 | 1005728 | 182 | 1.13 | |
| Distance to roads (meter) | 0–500 | 443883 | 129 | 1.82 |
| 500–1500 | 617437 | 102 | 1.03 | |
| 1500–2500 | 287488 | 14 | 0.30 | |
| 2500–3500 | 136850 | 5 | 0.23 | |
| > 3500 | 78680 | 0 | 0 | |
| Distance to urban areas (meter) | 0–500 | 89766 | 22 | 1.53 |
| 500–1500 | 654747 | 114 | 1.09 | |
| 1500–2500 | 625933 | 90 | 90 | |
| 2500–3500 | 179025 | 24 | 0.84 | |
| > 3500 | 14867 | 0 | 0 | |
| LULC | 1 | 7777 | 3 | 2.41 |
| 2 | 40178 | 3 | 0.47 | |
| 3 | 304381 | 60 | 1.23 | |
| 4 | 572411 | 125 | 1.37 | |
| 5 | 548562 | 53 | 0.60 | |
| 6 | 9552 | 0 | 0 | |
| 7 | 72200 | 6 | 0.52 | |
| 8 | 2353 | 0 | 0 | |
| 9 | 6911 | 0 | 0 | |
| Lithology | Group1 | 241 | 0 | 0 |
| Group2 | 12724 | 2 | 0.98 | |
| Group3 | 32890 | 0 | 0 | |
| Group4 | 19987 | 0 | 0 | |
| Group5 | 18888 | 0 | 0 | |
| Group6 | 182165 | 19 | 0.65 | |
| Group7 | 986807 | 180 | 1.14 | |
| Group8 | 215564 | 29 | 0.84 | |
| Group9 | 18693 | 4 | 1.34 | |
| Group10 | 3299 | 0 | 0 | |
| Group11 | 5256 | 2 | 2.38 | |
| Group12 | 49554 | 14 | 1.77 | |
| Group13 | 18270 | 0 | 0 |
Spatial relationships of landslides with variables according to FR.
TABLE 2
| Class no. | LULC type |
|---|---|
| 1 | Discontinuous urban fabric |
| 2 | Pastures |
| 3 | Complex cultivation patterns |
| 4 | Agricultural lands |
| 5 | Broad leaved forest |
| 6 | Mixed forest |
| 7 | Woodland shrub |
| 8 | Coniferous forest |
| 9 | Non irrigated arable land |
The classes of LULC factors presented in Table 1.
TABLE 3
| Class no. | Lithology type |
|---|---|
| 1 | Terrestrial deposits, Quaternary |
| 2 | Flysch and other basin deposits, Upper Cretaceous |
| 3 | Flysch and other basin deposits, Upper Jurassic |
| 4 | Volcanic rocks, Triassic |
| 5 | Ophiolite sequence, Jurassic |
| 6 | Platform carbonate rocks, Triassic |
| 7 | Predominantly clastic rocks, Upper Paleozoic |
| 8 | Clastic and carbonate rocks, Permian |
| 9 | Predominantly clastic rocks, Carboniferous |
| 10 | Plutonic rocks, Paleozoic |
| 11 | Brakish deposits, Tortonian and Messinian |
| 12 | Marine clastic rocks, Langhian and Serravallian |
| 13 | Plutonic rocks, Miocene and Oligocene |
The classes of lithology factor presented in Table 2.
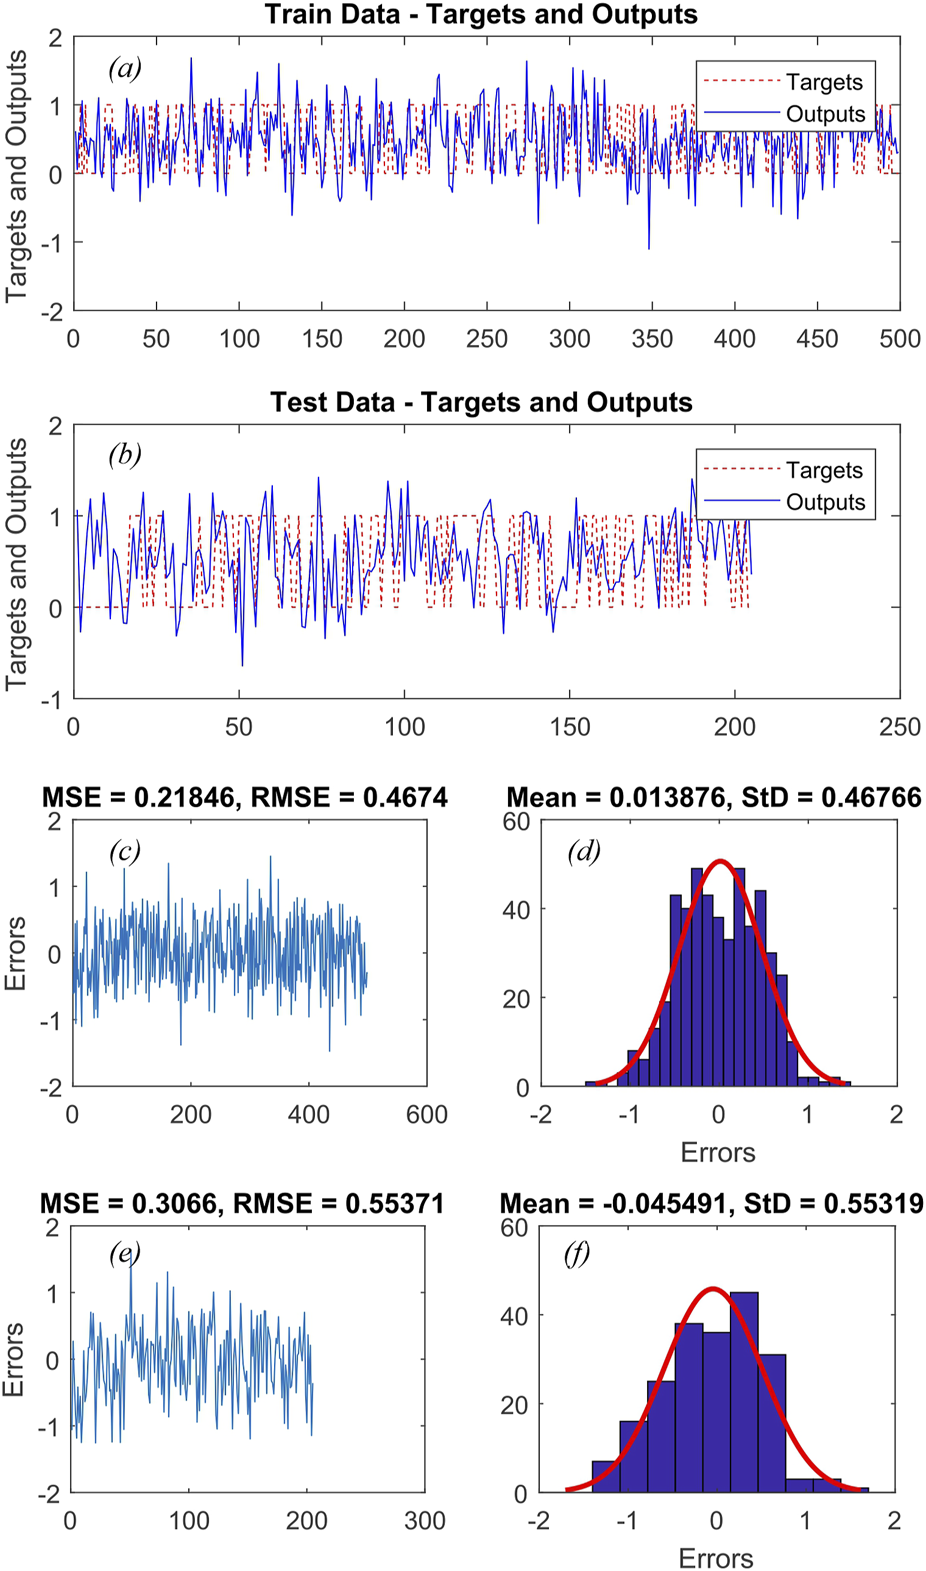
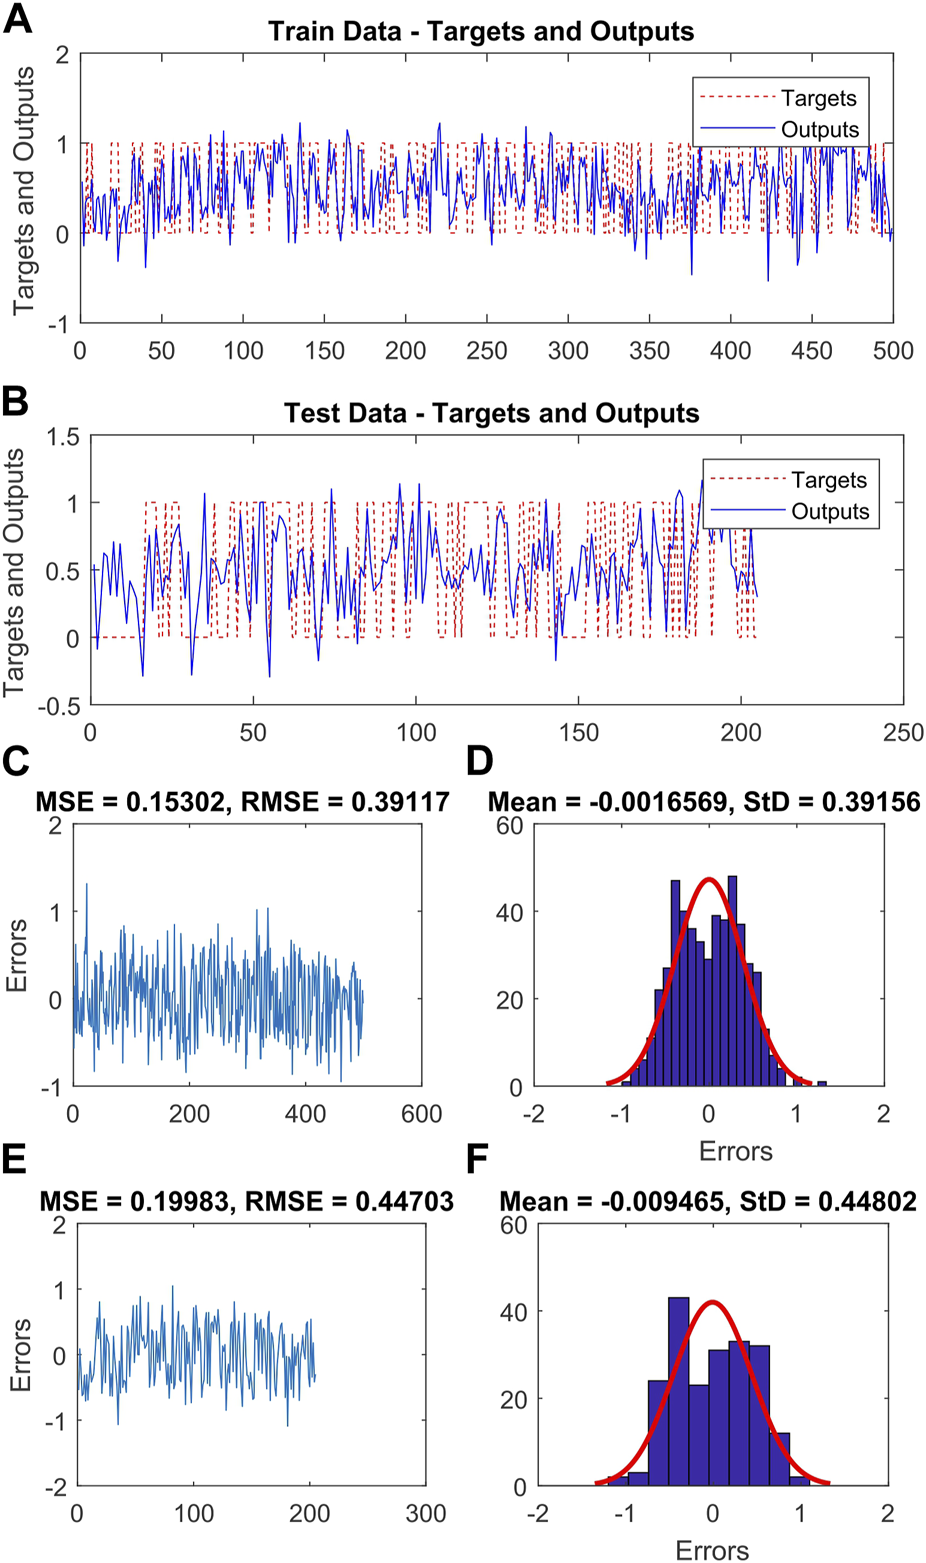
After assigning weights to the various classes of variables that influence landslide occurrence, the hyper-parameters of the SVM and its RBF kernel were calculated using GA, DE, and CA (as shown in Table 4). Additionally, Figures 4–6 depict the actual and predicted values for both the training and testing data, along with the MSE and RMSE for the ANFIS-GA, ANFIS-DE, and ANFIS-CA models, respectively. Among the six hybrid models, the ANFIS-GA model exhibited a lower RMSE (0.386) during training than other models. Furthermore, during validation, this model showed slightly lower RMSE (0.441) compared to the other models.
TABLE 4
| SVR-RBF | Epsilon (ε) | Gamma (γ) | Cost (C) | R 2 (Train) | RMSE (Train) | R 2 (Test) | RMSE (Test) |
|---|---|---|---|---|---|---|---|
| GA | 0.0010386 | 3.2202 | 7.696 | 0.83 | 0.380 | 0.82 | 0.391 |
| DE | 0.2500 | 0.125 | 0.03125 | 0.88 | 0.368 | 0.80 | 0.404 |
| CA | 0.0010386 | 3.2202 | 7.696 | 0.84 | 0.361 | 0.81 | 0.398 |
The SVR kernel tuned parameter values that have been produced by the GA, DE, and CA me-taheuristic algorithms.
FIGURE 4
(A and B) the ANFIS-GA output and real output for training and test data, respectively, (C and E) the RMSE and MSE values of the training and validation sets, respectively, (D and F) the frequency errors of the training and test sets, respectively.
FIGURE 5
(A,B) the ANFIS-DE output and real output for training and test data, respectively, (C,E) the RMSE and MSE values of the training and validation sets, respectively, (D,F) the frequency errors of the training and test sets, respectively.
FIGURE 6
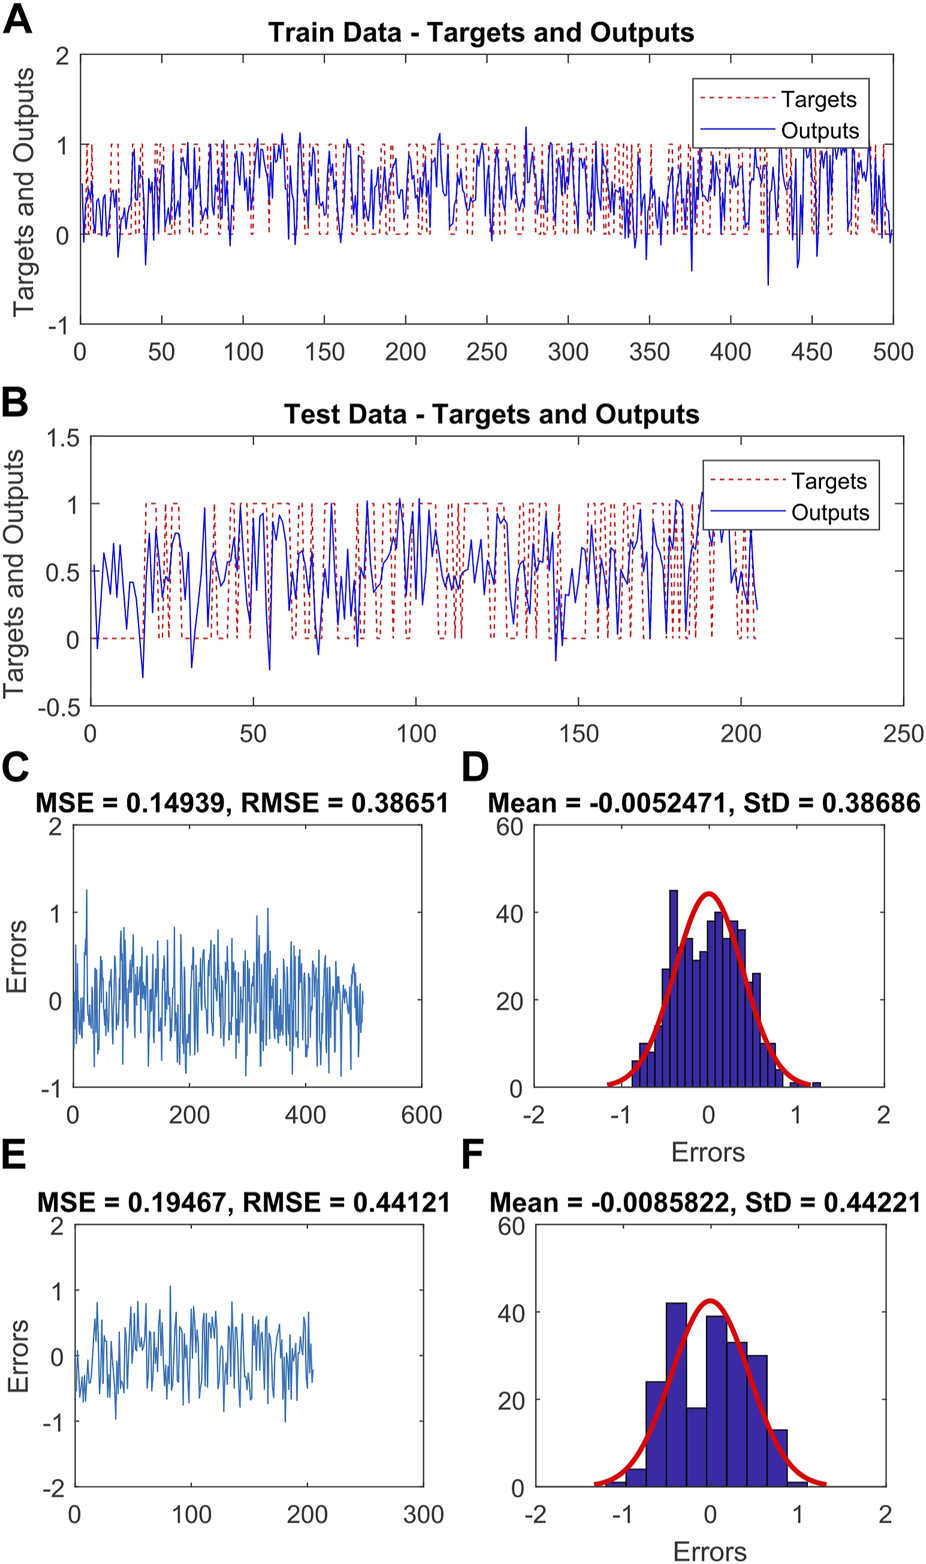
(A,B) the ANFIS-CA output and real output for training and test data, respectively, (C,E) the RMSE and MSE values of the training and validation sets, respectively, (D,F) the frequency errors of the training and test sets, respectively.
After analyzing the AUROC values (Figure 7), it was observed that the SVM-DE model achieved the highest accuracy during the training phase (0.923), followed by SVM-CA (0.879), ANFIS-GA & ANFIS-DE (0.877), SVM-GA (0.844), and ANFIS-CA (0.798). On the other hand, during validation phase, SVM-GA (AUROC = 0.780) outperformed the other models, followed by ANFIS-GA (AUROC = 0.775), SVM-CA (AUROC = 0.773), ANFIS-DE (AUROC = 0.771), SVM-DE (AUROC = 0.760), and ANFIS-CA (AUROC = 0.657). These results indicate that SVM-based hybrid models performed better than AFNIS-based hybrid models in both the training and testing phases. Figure 8 displays the LSMs generated from the six models.
FIGURE 7
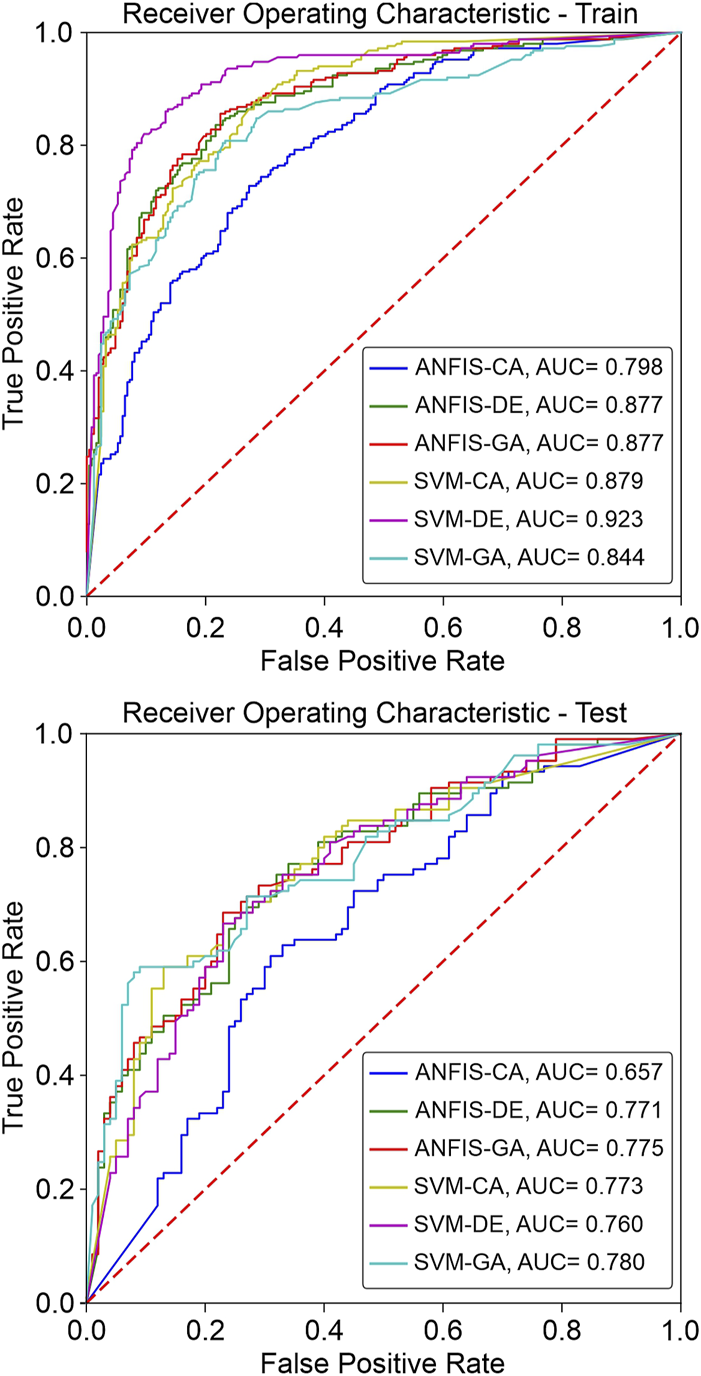
The AUROC curves for the six hybrid models in the training and the testing phases.
FIGURE 8
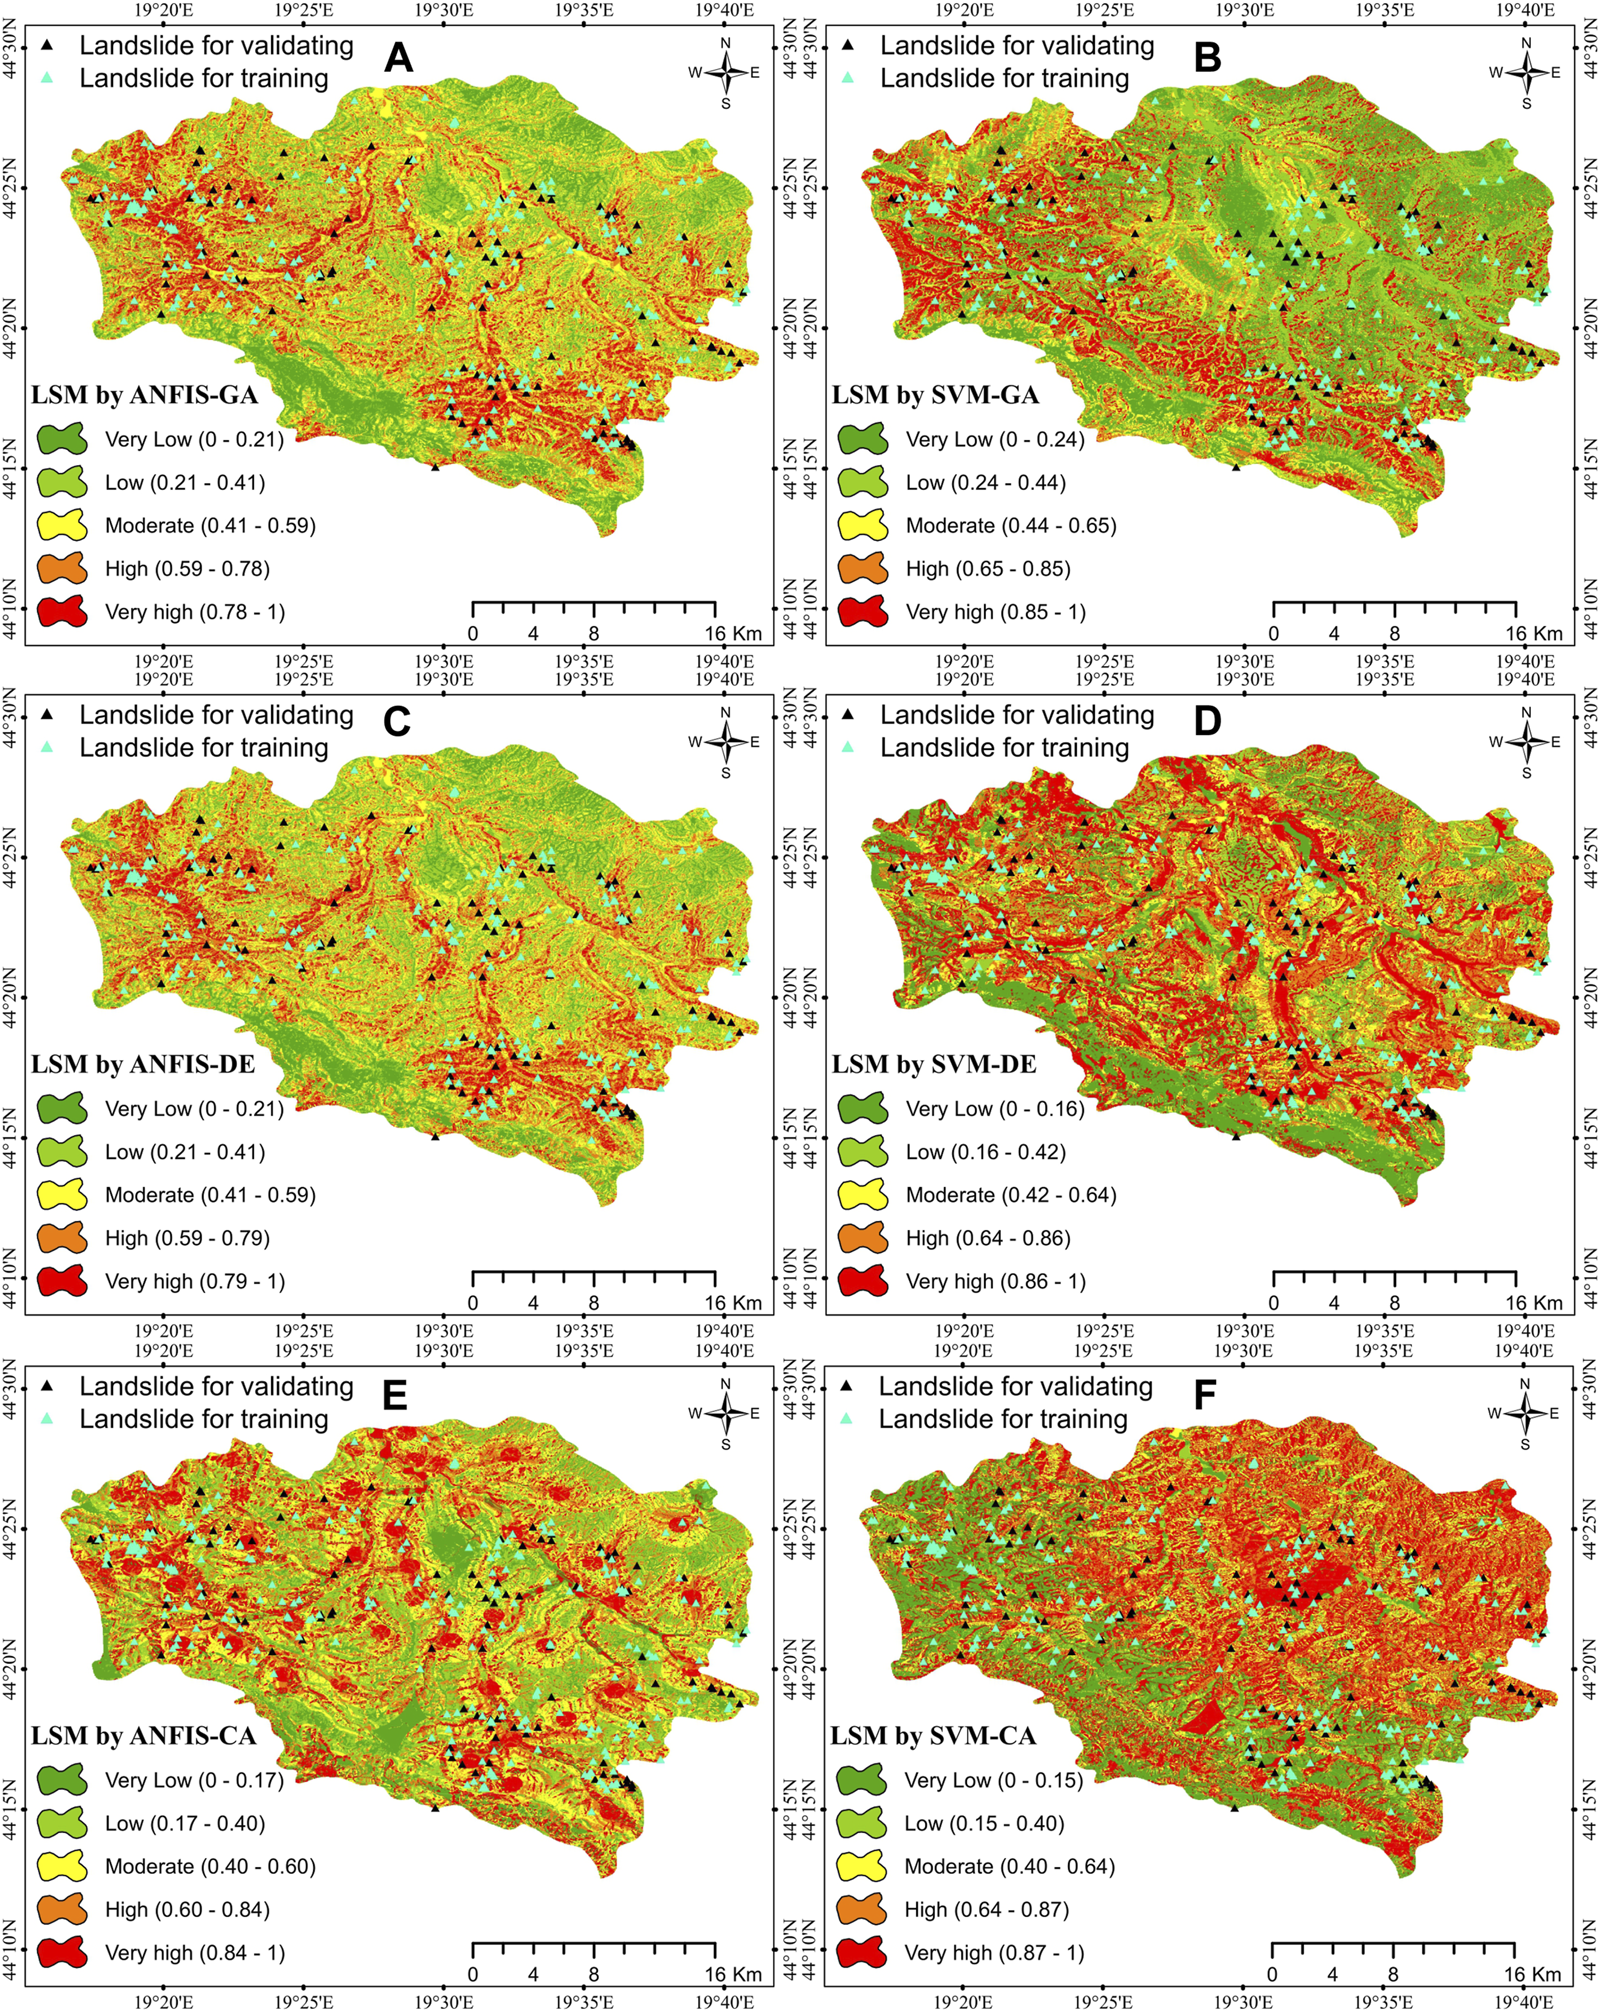
The LSMs generated by (A) ANFIS-GA, (B) SVM-GA, (C) ANFIS-DE, (D) SVM-DE, (E) ANFIS-CA, and (F) SVM-CA hybrid models.
5 Discussion
In this study, six hybrid models were developed for LSM namely ANFIS-CA, ANFIS-DE, ANFIS-GA, SVM-CA, SVM -DE, and SVM-GA. The ANFIS model uses the fuzzy Sugeno setup for integration and optimizes the final fuzzy inference system through neural network training for classification. On the other hand, The SVM model splits classes of input data on a hyperplane (Devadas et al., 2012). The proposed hybrid models use three evolutionary algorithms which are advantageous as they do not require statistical assumptions about the distribution of data. After conducting further studies using different hybrid models to enhance accuracy and robustness in LSM (Chen et al., 2019; Moayedi et al., 2019; Pham et al., 2019), this present study used three models, CA, DE, and GA, to improve the accuracy of both ANFIS & SVM models for LSM.
Analysis showed that SVM-based models, specifically SVM-DE (AUROC = 0.923) and SVM-GA (AUROC = 0.780) outperformed the other models in training and testing, respectively. Results also revealed that the ANFIS-CA with AUROC 0.789 in the training phase and 0.657 in the testing phase had the lowest accuracy. Furthermore, the SVM-CA model performed moderately better than ANFIS-CA in both training and testing phases. This indicates that SVM-CA is a better hybrid model than ANFIS-CA for LSM, although this conclusion may not be applicable in other study areas and different scenario, given important aspects such as quality of input data, selection of conditioning factors, distribution of training and testing samples, variances in optimization of models, and limitation of computing facilities. It can be concluded that the CA-based hybrid model with SVM performed better than ANFIS in this present study. Similarly, SVM-DE performed better than SVM-GA during training [SVM-DE (AUROC = 0.923), SVM-GA (AUROC = 0.844)] but less so during testing [SVM-DE (AUROC = 0.760), SVM-GA (AUROC = 0.780)], identifying another scenario found in similar studies where the model performance was better during training for a model but not during testing (Al-Fugara et al., 2022).
Spatial accuracy is an important aspect in hazard mapping and modeling. The LSMs produced by all six models are presented in Figure 8, categorized into five categories: Very High, High, Moderate, Low, and Very Low. Maps were normalized between 0 and 1 for easy monitoring and comparison purposes. The figures reveal that about two-thirds of the area under study are highly susceptible to landslides in the SVM-CA model (Figure 8F), which is absurd for this type of study. Hence, the performance check for this model was also found to have low performance compared to any other SVM-based models (SVM-DE & SVM-GA) during AUROC assessment. However, the SVM-DE model-based map (Figure 8D) provides a better layout covering the maximum number of training and testing datasets of occurred landslides.
6 Conclusion
In recent years, landslides have become a major concern in many regions of the world, especially in areas with high population density and rapid urbanization. The occurrence of landslides has been attributed to several factors such as geological and geotechnical properties, hydrological conditions, anthropogenic activities, and climate change. In Serbia, landslides have caused significant economic losses and human casualties over the past decades. Therefore, accurate forecasting of landslides can help reduce the risk of damage and loss in affected areas. To achieve this goal, this study compared three SVM-based hybrid models with three ANFIS-based hybrid models for LSM in Serbia. By comparing the results of SVM-based hybrid models with ANFIS-based hybrid models, the study aimed to provide insights into the most effective approach for LSM modeling in Serbia. Fourteen drivers that play effective roles in landslide occurrence were considered, including slope, elevation, aspect, LULC, distance to rivers, rainfall, distance to faults, NDVI, distance to roads, STI, TWI, SPI, lithology, and distance to urban areas. Classes corresponding to each factor were weighed using the FR method and then entered into the models, which were verified by AUROC. The results showed that the SVM-based hybrid models can provide accurate and reliable predictions of landslide susceptibility in Serbia. Among the six hybrid models tested, the SVM-GA model demonstrated the best performance, while the ANFIS-CA model performed the worst in forecasting landslides. These findings have important implications for decision-makers and stakeholders in developing effective landslide risk management strategies in Serbia. By accurately forecasting landslides, the risk of damage and loss in affected areas can be significantly reduced. Moreover, this research contributes to the global interest in landslide research by providing insights into the most effective approach for LSM. The use of SVM-based hybrid models in this study can be applicable to other regions with similar geological and environmental conditions worldwide. Overall, this study makes a valuable contribution to scientific research by conducting a comparative study for LSM. The superior model in this study holds great potential for global implementation in landslide risk management.
Statements
Data availability statement
The raw data supporting the conclusion of this article will be made available by the authors, without undue reservation.
Author contributions
For Conceptualization, IE, BD, and VS; methodology, IE; software, IE; validation, IE, BD, and RR; investigation, IE; visualization, RR; resources, RR and VS; data curation, AN; writing—original draft preparation, IE, PN, and AN; supervision, IE, BD, and AN; project administration, IE. All authors contributed to the article and approved the submitted version.
Acknowledgments
Authors would like to acknowledge the support of the Deputy for Research and Innovation- Ministry of Education, Kingdom of Saudi Arabia for this research through a grant (NU/IFC/2/SERC/-/12) under the Institutional Funding Committee at Najran University, Kingdom of Saudi Arabia.
Conflict of interest
The authors declare that the research was conducted in the absence of any commercial or financial relationships that could be construed as a potential conflict of interest.
Publisher’s note
All claims expressed in this article are solely those of the authors and do not necessarily represent those of their affiliated organizations, or those of the publisher, the editors and the reviewers. Any product that may be evaluated in this article, or claim that may be made by its manufacturer, is not guaranteed or endorsed by the publisher.
References
1
Abdul-Hamid Y. Kochhar A. Khan M. (1999). An analytic hierarchy process approach to the choice of manufacturing plant layout. Proc. Institution Mech. Eng. Part B J. Eng. Manuf.213, 397–406. 10.1243/0954405991516868
2
Ahmad F. (2022). Deep image retrieval using artificial neural network interpolation and indexing based on similarity measurement. CAAI Trans. Intell. Technol.7, 200–218. 10.1049/cit2.12083
3
Ahmadlou M. Karimi M. Alizadeh S. Shirzadi A. Parvinnejhad D. Shahabi H. et al (2019). Flood susceptibility assessment using integration of adaptive network-based fuzzy inference system (ANFIS) and biogeography-based optimization (BBO) and BAT algorithms (BA). Geocarto Int.34, 1252–1272. 10.1080/10106049.2018.1474276
4
Al-Fugara A. K. Ahmadlou M. Shatnawi R. Alayyash S. Al-Adamat R. Al-Shabeeb A. A.-R. et al (2022). Novel hybrid models combining meta-heuristic algorithms with support vector regression (SVR) for groundwater potential mapping. Geocarto Int.37, 2627–2646. 10.1080/10106049.2020.1831622
5
Althuwaynee O. F. Pradhan B. Park H.-J. Lee J. H. (2014). A novel ensemble bivariate statistical evidential belief function with knowledge-based analytical hierarchy process and multivariate statistical logistic regression for landslide susceptibility mapping. Catena114, 21–36. 10.1016/j.catena.2013.10.011
6
Arabameri A. Rezaei K. Pourghasemi H. R. Lee S. Yamani M. (2018). GIS-Based gully erosion susceptibility mapping: A comparison among three data-driven models and AHP knowledge-based technique. Environ. earth Sci.77, 628–722. 10.1007/s12665-018-7808-5
7
Ashournejad Q. Hosseini A. Pradhan B. Hosseini S. J. (2019). Hazard zoning for spatial planning using GIS-based landslide susceptibility assessment: A new hybrid integrated data-driven and knowledge-based model. Arabian J. Geosciences12, 126–218. 10.1007/s12517-019-4236-0
8
Ayalew L. Yamagishi H. (2005). The application of GIS-based logistic regression for landslide susceptibility mapping in the Kakuda-Yahiko Mountains, Central Japan. Geomorphology65, 15–31. 10.1016/j.geomorph.2004.06.010
9
Bai S. Lu P. Thiebes B. (2020). Comparing characteristics of rainfall-and earthquake-triggered landslides in the Upper Minjiang catchment, China. Eng. Geol.268, 105518. 10.1016/j.enggeo.2020.105518
10
Ballabio C. Sterlacchini S. (2012). Support vector machines for landslide susceptibility mapping: The staffora river basin case study, Italy. Math. Geosci.44, 47–70. 10.1007/s11004-011-9379-9
11
Benkedjouh T. Medjaher K. Zerhouni N. Rechak S. (2015). Health assessment and life prediction of cutting tools based on support vector regression. J. intelligent Manuf.26, 213–223. 10.1007/s10845-013-0774-6
12
Bobrowsky P. Highland L. (2013). The landslide handbook-A guide to understanding landslides: A landmark publication for landslide education and preparedness. Geramny: Springer.
13
Çaydaş U. HasçalıK A. Ekici S. (2009). An adaptive neuro-fuzzy inference system (ANFIS) model for wire-EDM. Expert Syst. Appl.36, 6135–6139. 10.1016/j.eswa.2008.07.019
14
Cevik E. Topal T. (2003). GIS-based landslide susceptibility mapping for a problematic segment of the natural gas pipeline, Hendek (Turkey). Environ. Geol.44, 949–962. 10.1007/s00254-003-0838-6
15
Chang C.-C. Lin C.-J. (2011). Libsvm: A library for support vector machines. ACM Trans. intelligent Syst. Technol. (TIST)2, 1–27. 10.1145/1961189.1961199
16
Chapelle O. Vapnik V. Bousquet O. Mukherjee S. (2002). Choosing multiple parameters for support vector machines. Mach. Learn.46, 131–159. 10.1023/a:1012450327387
17
Chen W. Chen X. Peng J. Panahi M. Lee S. (2021). Landslide susceptibility modeling based on ANFIS with teaching-learning-based optimization and Satin bowerbird optimizer. Geosci. Front.12, 93–107. 10.1016/j.gsf.2020.07.012
18
Chen W. Hong H. Panahi M. Shahabi H. Wang Y. Shirzadi A. et al (2019). Spatial prediction of landslide susceptibility using gis-based data mining techniques of anfis with whale optimization algorithm (woa) and grey wolf optimizer (gwo). Appl. Sci.9, 3755. 10.3390/app9183755
19
Chen W. Pourghasemi H. R. Panahi M. Kornejady A. Wang J. Xie X. et al (2017). Spatial prediction of landslide susceptibility using an adaptive neuro-fuzzy inference system combined with frequency ratio, generalized additive model, and support vector machine techniques. Geomorphology297, 69–85. 10.1016/j.geomorph.2017.09.007
20
Choudhuri S. Venkateswara H. Sen A. (2022). Coupling adversarial learning with selective voting strategy for distribution alignment in partial domain adaptation. Washington DC: ACM. arXiv preprint arXiv:2207.08145.
21
Daly C. Gibson W. P. Taylor G. H. Johnson G. L. Pasteris P. (2002). A knowledge-based approach to the statistical mapping of climate. Clim. Res.22, 99–113. 10.3354/cr022099
22
Devadas R. Denham R. Pringle M. (2012). Support vector machine classification of object-based data for crop mapping, using multi-temporal Landsat imagery. Int. Arch. Photogramm. Remote Sens. Spat. Inf. Sci.39, 185–190. 10.5194/isprsarchives-xxxix-b7-185-2012
23
Đokanović S. M. (2016). Landslides and damage to buildings as a result of intense rainfall in Krupanj. Tehnika71, 48–53. 10.5937/tehnika1601048d
24
Domínguez-Cuesta M. J. Jiménez-Sánchez M. Berrezueta E. (2007). Landslides in the Central Coalfield (Cantabrian Mountains, NW Spain): Geomorphological features, conditioning factors and methodological implications in susceptibility assessment. Geomorphology89, 358–369. 10.1016/j.geomorph.2007.01.004
25
Fattahi H. Hasanipanah M. (2022). An integrated approach of ANFIS-grasshopper optimization algorithm to approximate flyrock distance in mine blasting. Eng. Comput.38, 2619–2631. 10.1007/s00366-020-01231-4
26
Galli M. Ardizzone F. Cardinali M. Guzzetti F. Reichenbach P. (2008). Comparing landslide inventory maps. Geomorphology94, 268–289. 10.1016/j.geomorph.2006.09.023
27
Guzzetti F. Carrara A. Cardinali M. Reichenbach P. (1999). Landslide hazard evaluation: A review of current techniques and their application in a multi-scale study, Central Italy. Geomorphology31, 181–216. 10.1016/s0169-555x(99)00078-1
28
Hearn G. Hart A. (2019). Landslide susceptibility mapping: A practitioner’s view. Bull. Eng. Geol. Environ.78, 5811–5826. 10.1007/s10064-019-01506-1
29
Holland J. H. (1992). Adaptation in natural and artificial systems: An introductory analysis with applications to biology, control, and artificial intelligence. China: MIT press.
30
Hong H. Panahi M. Shirzadi A. Ma T. Liu J. Zhu A.-X. et al (2018). Flood susceptibility assessment in Hengfeng area coupling adaptive neuro-fuzzy inference system with genetic algorithm and differential evolution. Sci. total Environ.621, 1124–1141. 10.1016/j.scitotenv.2017.10.114
31
Hu X. Kuang Q. Cai Q. Xue Y. Zhou W. Li Y. (2022). A coherent pattern mining algorithm based on all contiguous column bicluster. J. Artif. Intell. Technol.2, 80–92. 10.37965/jait.2022.0105
32
Huang Y. Zhao L. (2018). Review on landslide susceptibility mapping using support vector machines. Catena165, 520–529. 10.1016/j.catena.2018.03.003
33
Jang J.-S. (1993). Anfis: Adaptive-network-based fuzzy inference system. IEEE Trans. Syst. man, Cybern.23, 665–685. 10.1109/21.256541
34
Karaboga D. Kaya E. (2019). Adaptive network based fuzzy inference system (ANFIS) training approaches: A comprehensive survey. Artif. Intell. Rev.52, 2263–2293. 10.1007/s10462-017-9610-2
35
Kaur S. Chahal K. K. (2020). Hybrid ANFIS-genetic algorithm based forecasting model for predicting Cholera-waterborne disease. Int. J. Intelligent Eng. Inf.8, 374–393. 10.1504/ijiei.2020.10034284
36
Kavzoglu T. Sahin E. K. Colkesen I. (2015). Selecting optimal conditioning factors in shallow translational landslide susceptibility mapping using genetic algorithm. Eng. Geol.192, 101–112. 10.1016/j.enggeo.2015.04.004
37
Lee S. Hong S.-M. Jung H.-S. (2017). A support vector machine for landslide susceptibility mapping in Gangwon Province, Korea. Sustainability9, 48. 10.3390/su9010048
38
Li S. Li J. Z. (2009). Hybridising human judgment, AHP, simulation and a fuzzy expert system for strategy formulation under uncertainty. Expert Syst. Appl.36, 5557–5564. 10.1016/j.eswa.2008.06.095
39
Li X. Kong J. (2014). Application of GA–SVM method with parameter optimization for landslide development prediction. Nat. Hazards Earth Syst. Sci.14, 525–533. 10.5194/nhess-14-525-2014
40
Ma Y. Geng X. Wang J. He K. Athanasopoulos D. (2022). Deep learning framework for multi‐round service bundle recommendation in iterative mashup development. New York: CAAI Transactions on Intelligence Technology.
41
Magliulo P. Di Lisio A. Russo F. Zelano A. (2008). Geomorphology and landslide susceptibility assessment using GIS and bivariate statistics: A case study in southern Italy. Nat. hazards47, 411–435. 10.1007/s11069-008-9230-x
42
Martelloni G. Segoni S. Fanti R. Catani F. (2012). Rainfall thresholds for the forecasting of landslide occurrence at regional scale. Landslides9, 485–495. 10.1007/s10346-011-0308-2
43
Meneses B. M. Pereira S. Reis E. (2019). Effects of different land use and land cover data on the landslide susceptibility zonation of road networks. Nat. Hazards Earth Syst. Sci.19, 471–487. 10.5194/nhess-19-471-2019
44
Meng J. Li Y. Liang H. Ma Y. (2022). Single-image dehazing based on two-stream convolutional neural network. J. Artif. Intell. Technol.2, 100–110. 10.37965/jait.2022.0110
45
Moayedi H. Mehrabi M. Kalantar B. Abdullahi Mu’Azu M. Rashid A. et al (2019). Novel hybrids of adaptive neuro-fuzzy inference system (ANFIS) with several metaheuristic algorithms for spatial susceptibility assessment of seismic-induced landslide. Geomatics, Nat. Hazards Risk10, 1879–1911. 10.1080/19475705.2019.1650126
46
Moghaddamnia A. Gousheh M. G. Piri J. Amin S. Han D. (2009). Evaporation estimation using artificial neural networks and adaptive neuro-fuzzy inference system techniques. Adv. Water Resour.32, 88–97. 10.1016/j.advwatres.2008.10.005
47
Mokhtarzad M. Eskandari F. Jamshidi Vanjani N. Arabasadi A. (2017). Drought forecasting by ANN, ANFIS, and SVM and comparison of the models. Environ. earth Sci.76, 729–810. 10.1007/s12665-017-7064-0
48
Oh H.-J. Pradhan B. (2011). Application of a neuro-fuzzy model to landslide-susceptibility mapping for shallow landslides in a tropical hilly area. Comput. geosciences37, 1264–1276. 10.1016/j.cageo.2010.10.012
49
Pal S. C. Chakrabortty R. Saha A. Bozchaloei S. K. Pham Q. B. Linh N. T. T. et al (2022a). Evaluation of debris flow and landslide hazards using ensemble framework of Bayesian-and tree-based models. Bull. Eng. Geol. Environ.81, 55–25. 10.1007/s10064-021-02546-2
50
Pal S. C. Chowdhuri I. (2019). GIS-based spatial prediction of landslide susceptibility using frequency ratio model of Lachung River basin, North Sikkim, India. SN Appl. Sci.1, 416–425. 10.1007/s42452-019-0422-7
51
Pal S. C. Ruidas D. Saha A. Islam A. R. M. T. Chowdhuri I. (2022b). Application of novel data-mining technique based nitrate concentration susceptibility prediction approach for coastal aquifers in India. J. Clean. Prod.346, 131205. 10.1016/j.jclepro.2022.131205
52
Panahi M. Gayen A. Pourghasemi H. R. Rezaie F. Lee S. (2020). Spatial prediction of landslide susceptibility using hybrid support vector regression (SVR) and the adaptive neuro-fuzzy inference system (ANFIS) with various metaheuristic algorithms. Sci. Total Environ.741, 139937. 10.1016/j.scitotenv.2020.139937
53
Paryani S. Neshat A. Javadi S. Pradhan B. (2020). Comparative performance of new hybrid ANFIS models in landslide susceptibility mapping. Nat. Hazards103, 1961–1988. 10.1007/s11069-020-04067-9
54
Pham B. T. Prakash I. Chen W. Ly H.-B. Ho L. S. Omidvar E. et al (2019). A novel intelligence approach of a sequential minimal optimization-based support vector machine for landslide susceptibility mapping. Sustainability11, 6323. 10.3390/su11226323
55
Polykretis C. Chalkias C. Ferentinou M. (2019). Adaptive neuro-fuzzy inference system (ANFIS) modeling for landslide susceptibility assessment in a Mediterranean hilly area. Bull. Eng. Geol. Environ.78, 1173–1187. 10.1007/s10064-017-1125-1
56
Pradhan B. (2013). A comparative study on the predictive ability of the decision tree, support vector machine and neuro-fuzzy models in landslide susceptibility mapping using GIS. Comput. Geosciences51, 350–365. 10.1016/j.cageo.2012.08.023
57
Price K. Storn R. M. Lampinen J. A. (2006). Differential evolution: A practical approach to global optimization. Germany: Springer Science & Business Media.
58
Reynolds R. G. (1994). Proceedings of the 3rd annual conference on evolutionary programming. China: World Scientific Publishing, 131–139.An introduction to cultural algorithms
59
Ruidas D. Chakrabortty R. Islam A. R. M. T. Saha A. Pal S. C. (2022a). A novel hybrid of meta-optimization approach for flash flood-susceptibility assessment in a monsoon-dominated watershed, Eastern India. Environ. earth Sci.81, 145. 10.1007/s12665-022-10269-0
60
Ruidas D. Pal S. C. Islam A. R. M. T. Saha A. (2021). Characterization of groundwater potential zones in water-scarce hardrock regions using data driven model. Environ. earth Sci.80, 809–818. 10.1007/s12665-021-10116-8
61
Ruidas D. Pal S. C. Saha A. Chowdhuri I. Shit M. (2022b). Hydrogeochemical characterization based water resources vulnerability assessment in India's first Ramsar site of Chilka lake. Mar. Pollut. Bull.184, 114107. 10.1016/j.marpolbul.2022.114107
62
Ruidas D. Pal S. C. Towfiqul Islam A. R. M. Saha A. (2023). Hydrogeochemical evaluation of groundwater aquifers and associated health hazard risk mapping using ensemble data driven model in a water scares plateau region of eastern India. Expo. Health15, 113–131. 10.1007/s12403-022-00480-6
63
Saha A. Pal S. C. Chowdhuri I. Chakrabortty R. Roy P. (2022). Understanding the scale effects of topographical variables on landslide susceptibility mapping in Sikkim Himalaya using deep learning approaches. Geocarto Int.37, 17826–17852. 10.1080/10106049.2022.2136255
64
Salahshoor K. Kordestani M. Khoshro M. S. (2010). Fault detection and diagnosis of an industrial steam turbine using fusion of SVM (support vector machine) and ANFIS (adaptive neuro-fuzzy inference system) classifiers. Energy35, 5472–5482. 10.1016/j.energy.2010.06.001
65
Sarkar A. Biswas A. Kundu M. (2022). Development of q-rung orthopair trapezoidal fuzzy Einstein aggregation operators and their application in MCGDM problems. J. Comput. Cognitive Eng.1, 109–121. 10.47852/bonviewjcce2202162
66
Seifi A. Ehteram M. Singh V. P. Mosavi A. (2020). Modeling and uncertainty analysis of groundwater level using six evolutionary optimization algorithms hybridized with ANFIS, SVM, and ANN. Sustainability12, 4023. 10.3390/su12104023
67
Sestras P. Bilașco Ș. Roșca S. Dudic B. Hysa A. Spalević V. (2021). Geodetic and UAV monitoring in the sustainable management of shallow landslides and erosion of a susceptible urban environment. Remote Sens.13, 385. 10.3390/rs13030385
68
Sestras P. Bondrea M. V. Cetean H. Sălăgean T. Bilaşco Ş. Sanda N. et al (2018). Ameliorative, ecological and landscape roles of Făget Forest, Cluj-Napoca, Romania, and possibilities of avoiding risks based on GIS landslide susceptibility map. Not. Bot. Horti Agrobot. Cluj-Napoca46, 292–300. 10.15835/nbha46110866
69
Shafizadeh-Moghadam H. Tayyebi A. Ahmadlou M. Delavar M. R. Hasanlou M. (2017). Integration of genetic algorithm and multiple kernel support vector regression for modeling urban growth. Comput. Environ. Urban Syst.65, 28–40. 10.1016/j.compenvurbsys.2017.04.011
70
Shakeel N. Shakeel S. (2022). Context-free word importance scores for attacking neural networks. J. Comput. Cognitive Eng.1, 187–192. 10.47852/bonviewjcce2202406
71
Storn R. (1999). System design by constraint adaptation and differential evolution. IEEE Trans. Evol. Comput.3, 22–34. 10.1109/4235.752918
72
Tabari H. Kisi O. Ezani A. Talaee P. H. (2012). SVM, ANFIS, regression and climate based models for reference evapotranspiration modeling using limited climatic data in a semi-arid highland environment. J. Hydrology444, 78–89. 10.1016/j.jhydrol.2012.04.007
73
Tehrany M. S. Pradhan B. Mansor S. Ahmad N. (2015). Flood susceptibility assessment using GIS-based support vector machine model with different kernel types. Catena125, 91–101. 10.1016/j.catena.2014.10.017
74
Tien Bui D. Khosravi K. Li S. Shahabi H. Panahi M. Singh V. P. et al (2018). New hybrids of anfis with several optimization algorithms for flood susceptibility modeling. Water10, 1210. 10.3390/w10091210
75
Tien Bui D. Nguyen Q. P. Hoang N.-D. Klempe H. (2017). A novel fuzzy K-nearest neighbor inference model with differential evolution for spatial prediction of rainfall-induced shallow landslides in a tropical hilly area using GIS. Landslides14, 1–17. 10.1007/s10346-016-0708-4
76
Van Westen C. J. Castellanos E. Kuriakose S. L. (2008). Spatial data for landslide susceptibility, hazard, and vulnerability assessment: An overview. Eng. Geol.102, 112–131. 10.1016/j.enggeo.2008.03.010
77
Vapnik V. Guyon I. Hastie T. (1995). Support-vector networks. Mach. Learn20, 273–297. 10.1007/bf00994018
78
Wang J.-J. Liang Y. Zhang H.-P. Wu Y. Lin X. (2014). A loess landslide induced by excavation and rainfall. Landslides11, 141–152. 10.1007/s10346-013-0418-0
79
Wu Z. Luo G. Yang Z. Guo Y. Li K. Xue Y. (2022). A comprehensive review on deep learning approaches in wind forecasting applications. CAAI Trans. Intell. Technol.7, 129–143. 10.1049/cit2.12076
80
Yalcin A. Bulut F. (2007). Landslide susceptibility mapping using GIS and digital photogrammetric techniques: A case study from ardesen (NE-Turkey). Nat. hazards41, 201–226. 10.1007/s11069-006-9030-0
81
Yan G. Yin Y. Huang B. Zhang Z. Zhu S. (2019). Formation mechanism and characteristics of the jinjiling landslide in wushan in the three gorges reservoir region, China. Landslides16, 2087–2101. 10.1007/s10346-019-01234-3
82
Yilmaz I. Keskin I. (2009). GIS based statistical and physical approaches to landslide susceptibility mapping (Sebinkarahisar, Turkey). Bull. Eng. Geol. Environ.68, 459–471. 10.1007/s10064-009-0188-z
83
Zêzere J. L. S. De Brum Ferreira A. Rodrigues M. L. S. (1999). The role of conditioning and triggering factors in the occurrence of landslides: A case study in the area north of Lisbon (Portugal). Geomorphology30, 133–146. 10.1016/s0169-555x(99)00050-1
84
Zheng M. Zhi K. Zeng J. Tian C. You L. (2022). A hybrid CNN for image denoising. J. Artif. Intell. Technol.2, 93–99. 10.37965/jait.2022.0101
85
Zhu A.-X. Miao Y. Wang R. Zhu T. Deng Y. Liu J. et al (2018). A comparative study of an expert knowledge-based model and two data-driven models for landslide susceptibility mapping. Catena166, 317–327. 10.1016/j.catena.2018.04.003
Summary
Keywords
landslide, mapping, machine learning, hybrid models, support vector machine, meta-heuristic models, adaptive neuro-fuzzy inference
Citation
Elkhrachy I, Ranjan Yadav R, Nouh Mabdeh A, Nguyen Thanh P, Spalevic V and Dudic B (2023) Landslide susceptibility mapping and management in Western Serbia: an analysis of ANFIS- and SVM-based hybrid models. Front. Environ. Sci. 11:1218954. doi: 10.3389/fenvs.2023.1218954
Received
08 May 2023
Accepted
21 August 2023
Published
01 September 2023
Volume
11 - 2023
Edited by
Erhan Sener, Süleyman Demirel University, Türkiye
Reviewed by
Subodh Chandra Pal, University of Burdwan, India
Oznur Karaca, Çanakkale Onsekiz Mart University, Türkiye
Updates
Copyright
© 2023 Elkhrachy, Ranjan Yadav, Nouh Mabdeh, Nguyen Thanh, Spalevic and Dudic.
This is an open-access article distributed under the terms of the Creative Commons Attribution License (CC BY). The use, distribution or reproduction in other forums is permitted, provided the original author(s) and the copyright owner(s) are credited and that the original publication in this journal is cited, in accordance with accepted academic practice. No use, distribution or reproduction is permitted which does not comply with these terms.
*Correspondence: Ali Nouh Mabdeh, alinouh@aabu.edu.jo; Branislav Dudic, branislav.dudic@fm.uniba.sk
Disclaimer
All claims expressed in this article are solely those of the authors and do not necessarily represent those of their affiliated organizations, or those of the publisher, the editors and the reviewers. Any product that may be evaluated in this article or claim that may be made by its manufacturer is not guaranteed or endorsed by the publisher.