- 1Changsha General Survey of Natural Resources Center, China Geological Survey, Changsha, Hunan, China
- 2School of Engineering and Technology, China University of Geosciences, Beijing, China
- 3School of Civil Engineering, University of Queensland, Brisbane, QLD, Australia
Different land utilization types have unignorable impacts on adjacent aquifers, so studying the effects of varying land utilization types on groundwater balance and groundwater table in arid and semi-arid areas is crucial to facilitate the rational development of territorial space and groundwater resource management. This study investigated the relationship between land utilization type variations and groundwater dynamics from spatial and temporal scales in Huocheng plain, Xinjiang, China, via taking advantage of different land utilization maps provided by remote sensing techniques in 1990, 2000, and 2015. Based on the analysis of results, the findings can be summarized as follows. First, the cultivated and construction land has expanded significantly in the past 25 years. The migration of the regional center of cultivated land was insignificant, as it is still located almost in the center of the entire study area. However, the transfer span of the location center of construction land was more prominent, and its moving direction was mainly from south to northeast, directly affecting the groundwater balance state and groundwater table. Second, the total amount of groundwater storage exhibited a remarkable reduction, from a recharge in 1990 to a continuous discharge in 2000–2015, during which the total recharge and discharge had both continuously declined. Meanwhile, recharging and discharging elements were also changed profoundly as less groundwater recharges from ambient aqueous environments and more groundwater extraction. Thus, human activities were the fundamental driving terms causing the changes in groundwater sources. Third, the groundwater table gradually and continuously dropped from south to northeast in the study area over time. The drawdown of spatially averaged groundwater tables was positively correlated with construction and cultivated area extension. In addition, compared to the former literature, this study offers an alternative approach for groundwater protection and optimization of territorial space development and utilization in arid and semi-arid areas.
1 Introduction
Since initiating China’s modernization and globalization in the 1990s and accelerating the process of urbanization in the 2000s, the spatiotemporal variations of land utilization types have become the most straightforward manifestation of an expansion of human activities (e.g., the rapid expansion of cultivated and construction areas in recent decades). Meanwhile, underground aqueous resources, such as soil moisture in the vadose zone (Ma et al., 2014; Ma et al., 2015; Yan et al., 2022a; Yan et al., 2022b), perched water (Bear, 1972; Freeze and Cherry, 1979; Izbicki et al., 2015; Liu J. et al., 2019), shallow groundwater (Charbeneau and Sherif, 2002; Hancock, 2002; Hu et al., 2021), are scarce in arid and semi-arid regions. More adversely, the surging demand for water consumption leads to a nonnegligible groundwater table drawdown in these regions (Claessens et al., 2009; Chen et al., 2010; Lei-hua et al., 2012). As a result, the human beings-land interactive relationship is an essential component and core interest of modern research. More specifically, studying the effects of varying land utilizations on groundwater dynamics has become one of the current research challenges in environmental engineering and science.
Numerous environmental scholars have studied the impacts of various land utilization types on long-term groundwater dynamics by applying different methods. All those methods could be characterized into the following four categories. The first category is quantitative mathematical modeling. Mathematical models were used to simulate and analyze the varying land utilization types (Ghaffari et al., 2010; Tong et al., 2012) and their hydrological effects (Yan et al., 2021; Yan et al., 2022c; Ma et al., 2022), the influence of varying land utilization types on groundwater dynamics (Prabhakar and Tiwari, 2015; Elmahdy and Mohamed, 2016) and the spatiotemporal variation of earthen and aqueous environments (Deng, 2001; Ma et al., 2003), explicitly considering contamination transport during a hydrodynamic process (Bai et al., 2021a; Bai et al., 2021b). The second category is the geostatistical method. Based on the theory of geostatistics, the temporal and spatial changes of groundwater could be well revealed, and the spatial heterogeneity of seepage properties and groundwater table variation in responding to varying land utilization types has also been well analyzed (Liu J. et al., 2019; Hu et al., 2021; Zhang et al., 2022). The third category is the groundwater balance method. Through constructing a grid geographic information database, the groundwater balance method was applied to calculate the groundwater storage and study the effect of regional land utilization variation on groundwater recharge and discharge (Lei et al., 2017). The fourth category is the integration of remote sensing, hydrological survey, and consistent in situ monitoring; based on those three geological surveying methods, the varying land utilization types in response to groundwater dynamics have been further explored (Zhang et al., 2014; Cui et al., 2015; Shu et al., 2022; Liu et al., 2023). Although many scholars used different methods to analyze and study the impacts of underlying surface conditions variations on groundwater dynamics, few scholars have examined its impact on groundwater balance and groundwater table synthetically, and inadequate efforts have been devoted to comprehensively investigating this impact on regional long-term groundwater dynamics at multiscale.
The study aims to provide a more in-depth investigation of the research field for the selected region–Huocheng plain, Xingjiang, China. This plain is the gateway to central Asia, a vital node of the “Belt and Road Initiative.” It is also an area experiencing rapid urbanization but vulnerable to many adverse ecological and environmental impacts. The current environmental challenges in using soil and water resources in this region can be summarized as the following points: 1) strongly influenced by a population boom and economic growth, the total relative carrying capacity of resources in this region has been overloaded (Fu et al., 2016); 2) the over-reclamation and overgrazing overloaded the land in this area, subsequently prone to land desertification (Kang and Zhang, 2012); 3) the inadequate regulations on daily water consumption (i.e., water wasted) and insufficient investments in hydraulic infrastructures (Yang and He, 2008); 4) there are uneven spatial and temporal distributions of regional water resources, so the contradiction of engineering water shortage is prominent. Therefore, it is of practical significance to study the influences of land utilization variations on groundwater dynamics in Huocheng plain.
Based on the aforementioned considerations in the literature review, this case study selected datasets of land utilization types in Huocheng plain for three periods in 1990, 2000, and 2015. First, it analyzes the dynamic variations and spatiotemporal migrations of land utilization on two different temporal scales, e.g., one longer of 1990–2015 and the other shorter of 2000–2015. In addition, it superimposes this analysis on the evolution of groundwater dynamics in this area during the same period. This series of investigations contributes to exploring the impact of changes in land utilization types on groundwater balance and the groundwater table. In general, this case study provides an alternative analyzing method for the rational utilization of groundwater resources and optimizing the development and utilization of territorial space in arid and semi-arid areas.
2 The overview of the case study region
Huocheng county is located west of the Tianshan mountains, north of the Ili river, adjacent to Kazakhstan in the west, Yining city in the east, and the administrative division of Ili Kazak autonomous prefecture of Xinjiang Uygur autonomous region (see Figures 1A, B). The elevation of this terrain is generally higher in the north and east, and lower in the south and west, with a medium-high mountainous area in the north, a hilly area in the central region, and a plain area in the southwest.
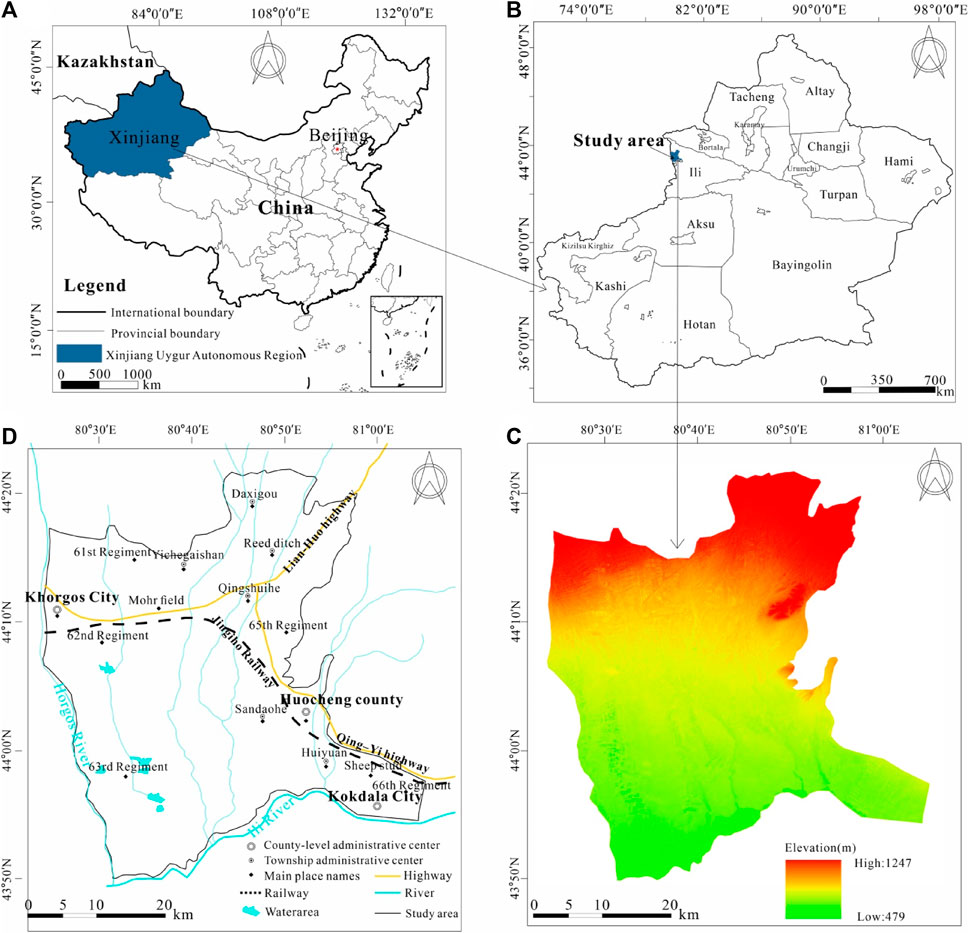
FIGURE 1. Geographic and administrative location of the study area: (A) The location of Xinjiang Uygur autonomous region in the map of China; (B) The selected study area in the map of Xinjiang; (C) The elevation map of Huocheng plain; (D) The brief information overview map for Huocheng plain in Xinjiang.
This paper focused on the southwest plain of Huocheng county as a study area with an elevation of 479–1,247 m. According to the geomorphic formation of Huocheng Plain, this region can be divided into the piedmont flood gravel plain, fine soil plain, eolian desert, and other geomorphic units from south to north (see Figure 1C). In addition, there are Horgos port (the largest land treaty port in Northwest China), Qingshuihe economic and technological development zone, and the fifth Production and Construction Corps, where we can collect the groundwater table data (see Figure 1D). The climate of this area is semi-arid (continental temperate). Its precipitation is far less than evaporation, e.g., its annual average precipitation of 220–700 mm compared to its evaporation in plain areas of 850–1,000 mm and evaporation in mountainous regions of less than 800 mm (Wang et al., 2012). There are seven main rivers, and gullies flow from north to south. The annual surface runoff is about 8.44 × 10⁸ m3, and the annual surface runoff only accounts for 6% of the total water storage in Ili valley. The groundwater is mainly stored in the gravel layer of the quaternary system. The hydraulic recharge from the upper part of an alluvial fan, which was geologically formed by the northern rivers running through the mountainous valleys, is an essential source of groundwater recharge (Li and Tao, 2015).
3 The collection of research database
3.1 Land utilization datasets
The land utilization datasets were obtained from the Data Center for Resources and Environmental Sciences, Chinese Academy of Sciences (http://www.resdc.cn) (Xu et al., 2018), using Landsat-MSS and Landsat 8 as image data sources. The secondary classification monitoring raster datasets of land utilization type with a spatial resolution of 30 m × 30 m in 1990, 2000, and 2015 were explicitly selected. Remote sensing image data were preprocessed by geometric correction and radiation distortion correction. Based on artificial intelligence and machine learning, the interactive visual interpretation and field investigation ensured the consistency of land utilization data processing and the reliability of interpretation accuracy. ArcGIS 10.2 software extracted and reclassified datasets in different years according to the geo-photographic mask. It was finally divided into six categories (see Figure 2): cultivated land, forest land, grassland, waterbody, construction land (urban and rural, industrial, mining, and residential land), and unused land (sandy land, Gobi, saline-alkali land, marshland, bare land, bare rock, and stony land and other unused lands).
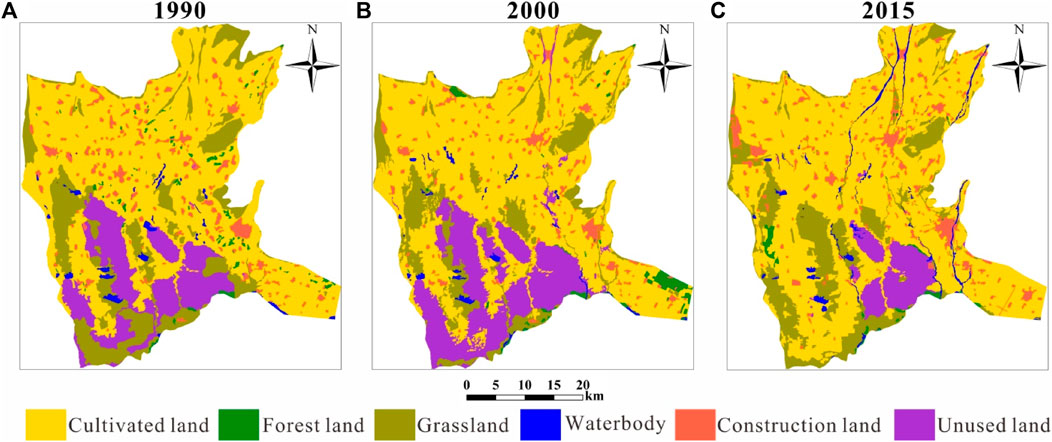
FIGURE 2. Type-distribution and evolution of land utilization in Huocheng plain in (A) 1990, (B) 2000, and (C) 2015 (the contour-plotted datasets were sourced from the Data Center for Resources and Environmental Sciences, Chinese Academy of Sciences (Xu et al., 2018).
3.2 Hydrological datasets
The groundwater datasets were mainly derived from the geological survey project of the China Geological Survey by Li et al. (2015) and the Regional Hydrogeological Survey Report of the People’s Republic of China: Ili Region, and some of the data were from their field measurements. Hydrometeorological data, such as precipitation and evaporation, are sourced from the Ili meteorological station. The information on water resources development and utilization (e.g., artificial extraction, spring water excretion, river runoff, canal head diversion water, etc.) was collected from the annals of Huocheng county, the statistical bulletin of Huocheng county, the yearbook of Huocheng county, the demonstration of water resources of Braxi mine (Ili shoer, Xinjiang) project of China Power Investment Corporation and the statistical yearbook of Ili Kazak autonomous prefecture (the aforementioned collections of research data libraries are not publicly released from their affiliated institutions and have still been archived as confidential documents in those affiliations).
4 Data processing methods
4.1 A dynamic model of land utilization degree
A comprehensive analysis model can express the extent of human development and land utilization within a specific period in the selected study area from the perspective of ecology, and its calculation formula (Li et al., 2006) can be provided as follows:
where Li is the land utilization degree composite index, Ai is the land utilization degree classification index of the ith type, Ci is the ratio of the area of the ith land utilization type to the study total area, and n is the number of classifications of land utilization degree. According to the actual situation of the study area and the existing research results (Wang et al., 2001), the land utilization degree classification index of construction land is assigned as the 4 points, cultivated land as the 3 points, forest land, grassland, and waterbody as the 2 points, and unused land as the 1 point.
4.2 Land utilization transfer matrix
The land utilization transfer matrix (Zhu and Li, 2003; Zheng et al., 2022) could be applied to reflect the dynamic processing information of mutual transformation among different types at the beginning and end of the study period in the selected investigation region. The mathematical form of the transfer matrix (S) could be given by
where
4.3 Standard deviation ellipse method
The standard deviation ellipse method (SDE) is the most direct modus to analyze the central, dispersion, and direction trends of data point sets or regions. This method quantitatively describes the overall characteristics of the spatial distribution of research objects through the spatial distribution ellipse with the center, major axis, minor axis, and azimuth Angle as the basic parameters. The calculation formula of the center of gravity could be presented as follows:
where (
4.4 Groundwater balance method
On the one hand, groundwater recharge has precipitation infiltration, river recharge, channel recharge, reservoir recharge, field irrigation, and lateral runoff recharge. On the other hand, groundwater discharge includes evaporation discharge, spring outflow, artificial extraction, and lateral drainage. In addition, the groundwater balance method was used to calculate and analyze the number of groundwater recharging/discharging sources. Thus, for comparing the groundwater recharging/discharging sources in different years, the mass balance of groundwater should be given as (Liu R. et al., 2019; Zhao et al., 2021):
where ΔQ is the variation of groundwater storage; Qin is the inflow for groundwater recharge; Qout is the outflow for groundwater discharge; Rp is precipitation infiltration; Rr is river recharge; Rc is channel recharge; Rre is reservoir recharge; Rf is field irrigation; Rl is lateral runoff recharge; De is evaporation discharge; Ds is spring outflow; Da is artificial extraction; Dl is lateral drainage.
5 Results and analysis
5.1 Analysis of temporal and spatial changes in land utilization
5.1.1 Dynamic analysis of land utilization
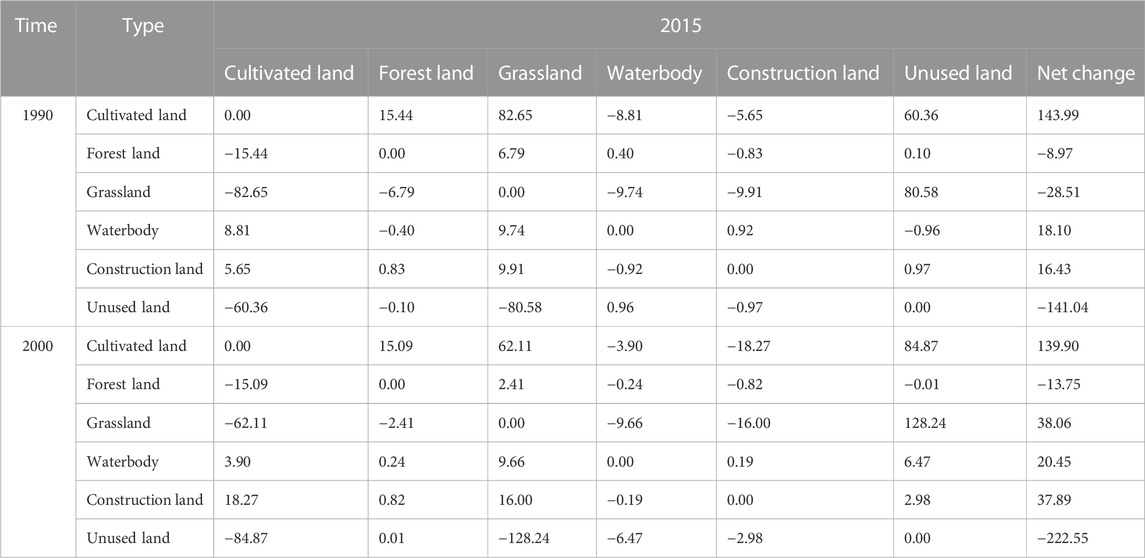
Based on the land utilization status datasets in 1990, 2000, and 2015, the evolutions and mutual transfers of land utilization types in the study area in the past 25 years were obtained (see Figure 3). This paper used the dynamic model of land utilization degree and land utilization transfer matrix to calculate the land utilization degree composite index and variation (see Table 1), transfer matrix (see Supplementary Table S1 in Supplementary Appendix S1), and its Sankey diagram (see Figure 4), and net land change of six land utilization types (see Table 2). The cultivated land and grassland are this selected area’s primary land utilization types. Since the 1990s, Huocheng plain has gradually evolved from agriculture and animal habitation to a comprehensive area including agricultural area, animal habitation, and industrial and commercial functionality.
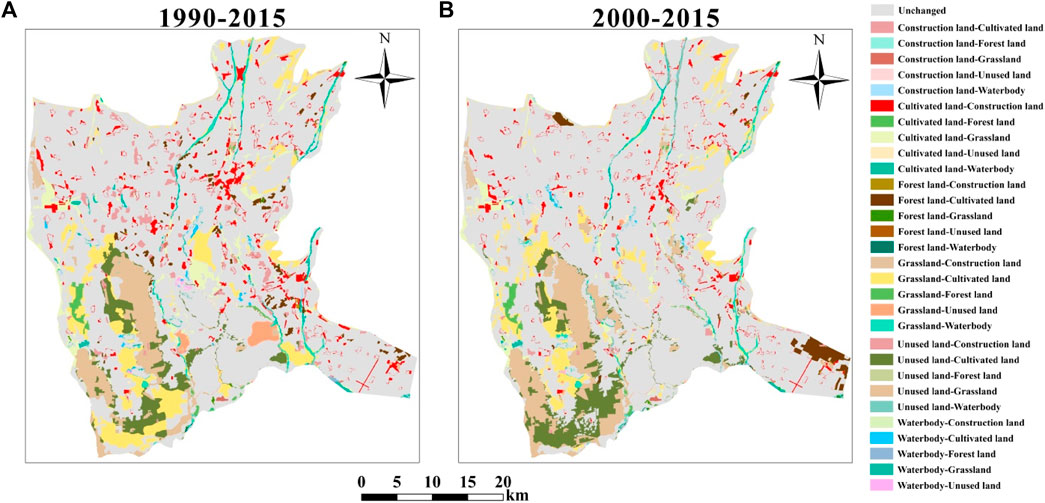
FIGURE 3. Variations of land utilization types from 1990 to 2015 based on datasets in a spatial resolution of 30 m: (A) 1990–2015 and (B) 2000–2015.
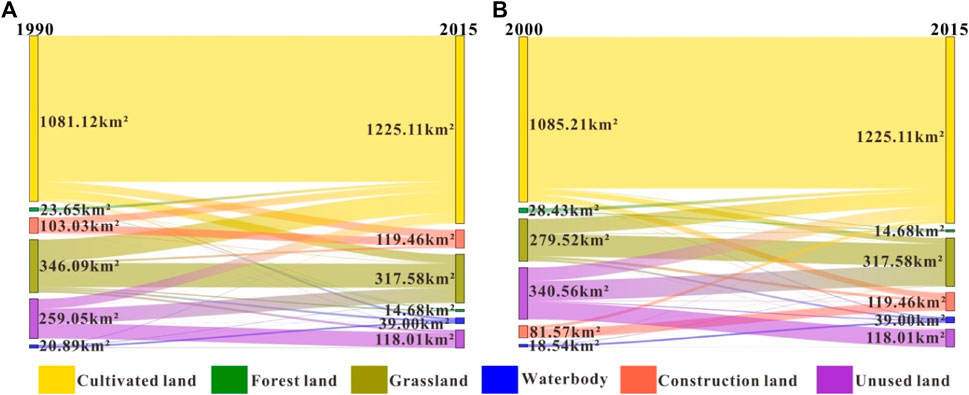
FIGURE 4. Sankey diagram of the land utilization transfer matrix in Huocheng plain: (A) 1990–2015 and (B) 2000–2015.
5.1.1.1 Long-term change in land utilization
From 1990 to 2015, the land utilization degree composite index of cultivated land, construction land, and waterbody showed an increasing trend in the selected period. Meanwhile, the land utilization degree variation of the cultivated and construction land was rapidly growing, and their areas significantly increased. The cultivated land area increased from 1,081.12 to 1,225.11 km2, increasing by 13.32%, with an average annual increasing rate of 0.53%. The construction land area increased from 103.03 to 119.46 km2, increasing by 15.95%, with an average annual increasing rate of 0.64%. During the same period, the area of unused land, forest land, and grassland decreased significantly. The area of forest land decreased from 23.65 to 14.68 km2, decreasing by 37.93%, with an average annual declining rate of −1.52%. The area of unused land decreased from 259.05 to 118.01 km2 by 54.45%, with an average yearly declining rate of −2.18%.
Over the past 25 years, land utilization in this region has evolved, and the cultivated land has increased continuously. The primary types of land utilization transferred were grassland, unused land, and forest land, whose areas were 82.65, 60.36, and 15.44 km2, respectively. The main transferred types were waterbody and construction land. The net transfer of cultivated land to waterbody was 8.81 km2, and the net transfer to construction land was 5.65 km2, mainly caused by continuous reclamation in the local area. Construction land increased significantly and mostly occupied cultivated land and grassland. The area of unused land was reduced considerably, which was the primary transfer type in the area, among which 60.36 and 80.58 km2 were transferred into cultivated land and grassland, respectively, reflecting the significant success of local desert control. Overall, the characteristics of land utilization change in Huocheng plain were attributed to the construction land occupying cultivated land and grassland and the cultivated land occupying grassland, unused land, and forest land.
5.1.1.2 Short-term change in land utilization
From 2000 to 2015, the land utilization degree composite index of cultivated land, construction land, and grassland showed an increasing trend in the selected period. Except for the cultivated land area, the construction land increased remarkably, and its area increased from 81.57 to 119.46 km2, with an increase of 46.45% and an average annual rate of change of 3.10%. In comparison, the unused and forest land area decreased significantly. As a result, the area of unused land decreased by 65.35% from 340.56 to 118.01 km2, with an annual rate of change of −4.36%.
Over the past 15 years, construction land increased substantially, and the primary transferred types were cultivated land, grassland, and unused land, whose areas were 18.27, 16.00, and 2.98 km2, respectively. On the other hand, the area of unused land had been significantly reduced, which was the main transferred type except for forestland. To a certain extent, this reflected that with the advancement of urbanization and economic development, more of the population was migrating to Huocheng county, Khorgos city, Qingshuihe town, and other areas in the selected region of Huocheng plain.
5.1.2 Temporal and spatial migration analysis of land utilization
As identified above, cultivated land and construction land were the two types with the most significant changes in Huocheng Plain, and their area continued to increase during 1990–2015. In addition, cultivated land and construction land were the main factors affecting the depth of groundwater balance and groundwater table in this region, so this paper mainly analyzed and discussed these two types of land utilization.
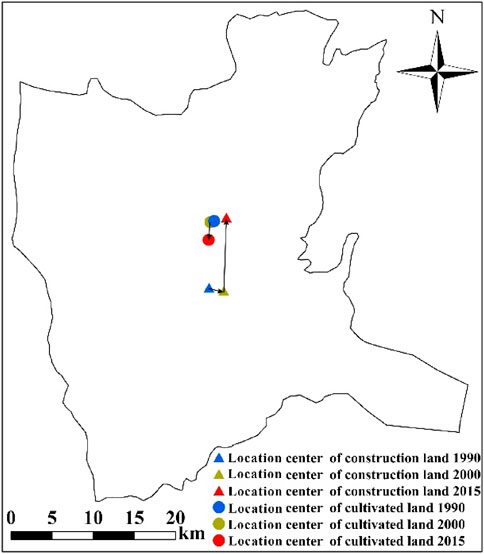
The spatial overlaying analysis of land utilization type images in three periods from 1990 to 2015 was carried out. During the dynamic evolution, the location centers of cultivated and construction land were super-combined to form the location center migration diagram of the two land utilization types (see Figure 5). During the study period, the shift of the location centers of cultivated land was slight, almost migrating towards the center of the entire study area. The transfer of the location center of construction land had a larger span and involved a much wider range than that of cultivated land. The transfer direction of the location center of construction land was mainly from south to northeast. From 1990 to 2000, the location center of construction land migrated to the southeast, with a distance of 1.82 km. From 2000 to 2015, the location center migrated to the northeast, and the migration distance was up to 8.90 km.
5.2 Groundwater balance analysis
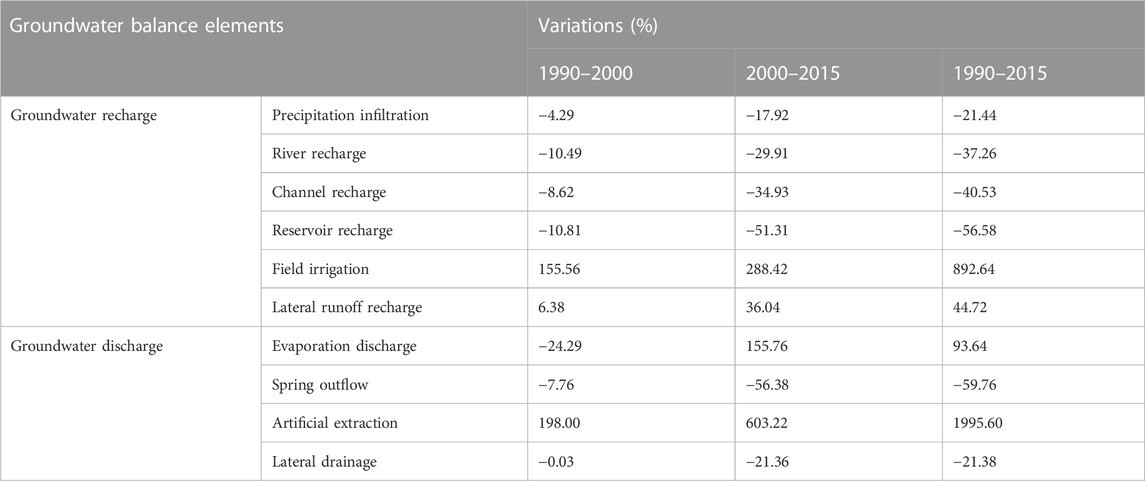
In this paper, the complete datasets for each decade in the selected representative years (1990, 2000, and 2015) were chosen as the temporal interval to analyze the groundwater dynamics since the 1990s. According to hydrogeological parameters, borehole datasets, and meteorological datasets of Huocheng county in different periods, groundwater recharging and discharging sources were calculated by the groundwater balance equation to determine the total recharge and discharge amount in different periods. Then, the changes in each recharging/discharging source were analyzed individually. As a result, the analysis of groundwater balance elements can be provided in Figure 6 (see Supplementary Table S2 in Supplementary Appendix S1), and the variations of groundwater balance elements are provided in Table 3.
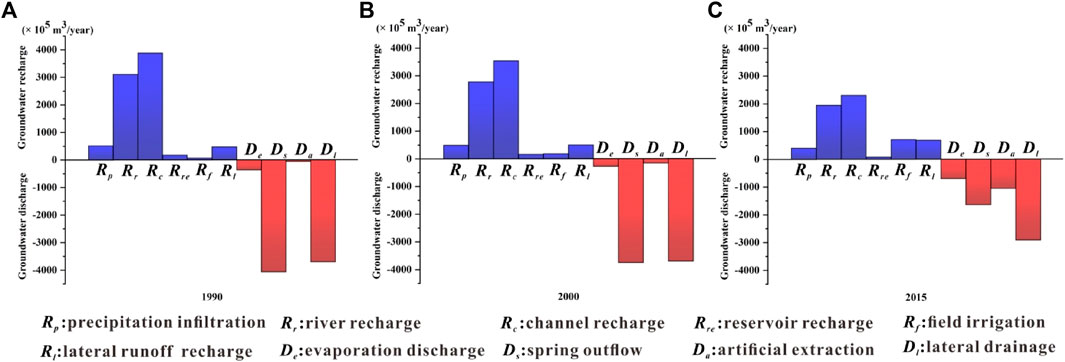
FIGURE 6. Analysis of groundwater balance elements in Huocheng plain from 1990 to 2015: (A) 1990, (B) 2000, and (C) 2015.
According to Figure 6 (see Supplementary Table S2 in Supplementary Appendix S1) and Table 3, the amount of change in groundwater storage in the three typical years was 69.10 × 10⁵, −186.50 × 10⁵, −137.60 × 10⁵ m3/year, respectively. It was found that the trend of groundwater storage in the long-term temporal scale (1990–2015) evolved from incremental to decremental. Specifically, the groundwater storage in Huocheng plain was recharged in the 1990s. After that, the amount of groundwater storage exhibited a decreasing trend, and the decreasing rate gradually increased. Therefore, by comparing the changing pace of groundwater storage in those different periods (1990–2015), it is apparent that the decreasing rate of groundwater storage significantly increased in the former decade (1990–2000) and then decreased gradually in the latter 1.5 decades (2000–2015).
From 1990 to 2015, the total groundwater recharge presented a significant downward trend, and the total amount of groundwater recharge decreased by 2.09 × 10⁸ m3/year. From 2000 to 2015, the decreasing rate of groundwater recharging sources was 1.82 times that from 1990 to 2000. The elements of groundwater recharging sources were similar in 1990 and 2000, among which the channel and river recharge accounted for 82%–85% of the total inflow, and field irrigation accounted for a minor proportion. However, the elements of recharging sources changed remarkably in 2015, including channel recharge, river recharge, and reservoir recharge in descending order. Compared to the amount of groundwater recharging elements in 1990 and 2000, the variations of field irrigation increased by 892.64% and 288.42%. Nevertheless, reservoir recharge decreased by 56.58% and 51.31%, and channel recharge reduced by 40.53% and 34.93%.
From 1990 to 2015, the total groundwater discharge exhibited a significant decline trend as well, and the total amount of groundwater discharge decreased by 1.88 × 10⁸ m3/year. From 1990 to 2000, the gross discharge decreased by 3.04 × 10⁷ m3/year, and the decreasing rate of discharge was 3.04 × 10⁶ m3/year. From 2000 to 2015, total groundwater discharge decreased by 1.58 × 10⁸ m3/year, and the decreasing rate of discharge was 1.05 × 10⁷ m3/year. Lateral drainage and spring outflow most significantly contribute to groundwater discharge. Compared to the amount of groundwater discharging elements in 1990 and 2000, the variations of artificial extraction increased by 1995.60% and 603.22%, yet spring outflow decreased by 59.76% and 56.38%.
In conclusion, both the total groundwater recharge and discharge continued to decline, mainly due to the increasing human activities. Human activities were the fundamental driving forces that caused the changes in groundwater recharging/discharging sources. With the spiking demand for groundwater extraction and limited available surface water, the groundwater storage dropped prominently because of the increasing urbanization and modernization, the expansion of cultivated land and construction areas, and increased irrigation demand and domestic water consumption.
5.3 Characteristics of the groundwater dynamics
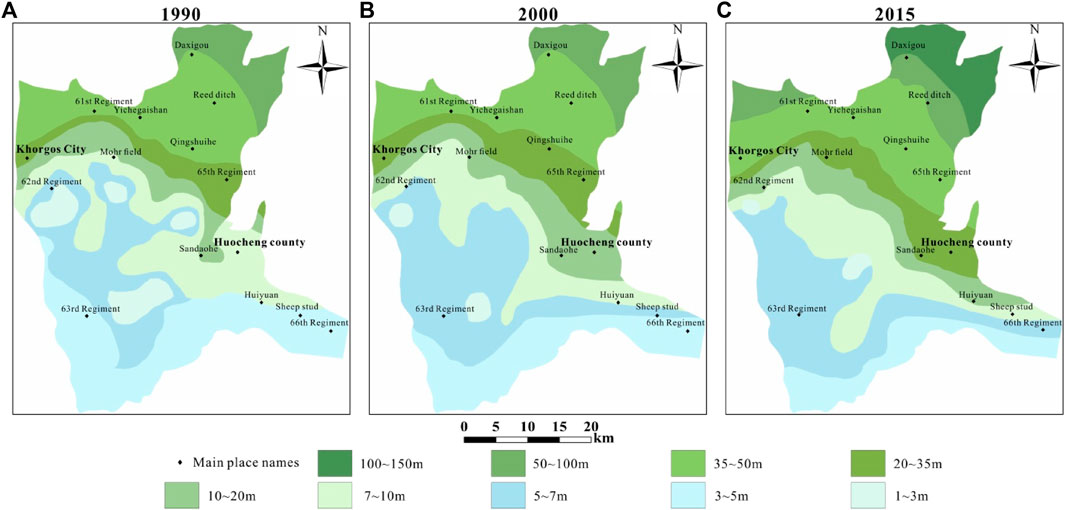
Based on the groundwater table datasets collected in the selected region, the depth-mapping groundwater table in Huocheng plain in 1990, 2000, and 2015 is shown in Figure 7. Through comparative analysis in the three selected years, the depth-contour of the groundwater table was mainly shown as relative shallows in the northeast and south regions, consistent with the topography of this study area. In 1990, the depths of the groundwater table in the northern inclined plain, near the mountainous valleys, were 10–50 m. In the central Aeolian desert area, the depths of the groundwater table were 5–10 m. Some of those were wetlands, where the depths of the groundwater table were much shallower, between 1 m and 3 m. In the southern alluvial plain, the depths of the groundwater table were 3–5 m. From 1990 to 2015, the depths of the groundwater table in most areas of Huocheng plain increased, i.e., the drawdown of groundwater storage in those areas continuously occurred during this period. For example, the depths of the groundwater table in Huocheng county were 7–10 m in 1990, 10–20 m in 2000, and 20–35 m in 2015, respectively. In the southern alluvial plain, the subdivision boundary between the shallower (0–10 m) and deeper groundwater tables (10–150 m), compared to that in 1990, moved northward obviously, and the groundwater table dropped more remarkably in the north in 2015 and 2000.
5.4 The effects of varying land utilizations on groundwater dynamics
After analyzing the distribution of land utilization types in 1990, 2000, and 2015, the different ranges of groundwater tables corresponding to each land utilization type were extracted from the aforementioned databases. First, the ratios of the region’s land utilization types in different depths of groundwater tables were calculated and presented in Figure 8 (see Supplementary Table S3 in Supplementary Appendix S1). Then, the changes in the average depths of groundwater table corresponding to the land utilization types in different periods were obtained, as shown in Figure 9.
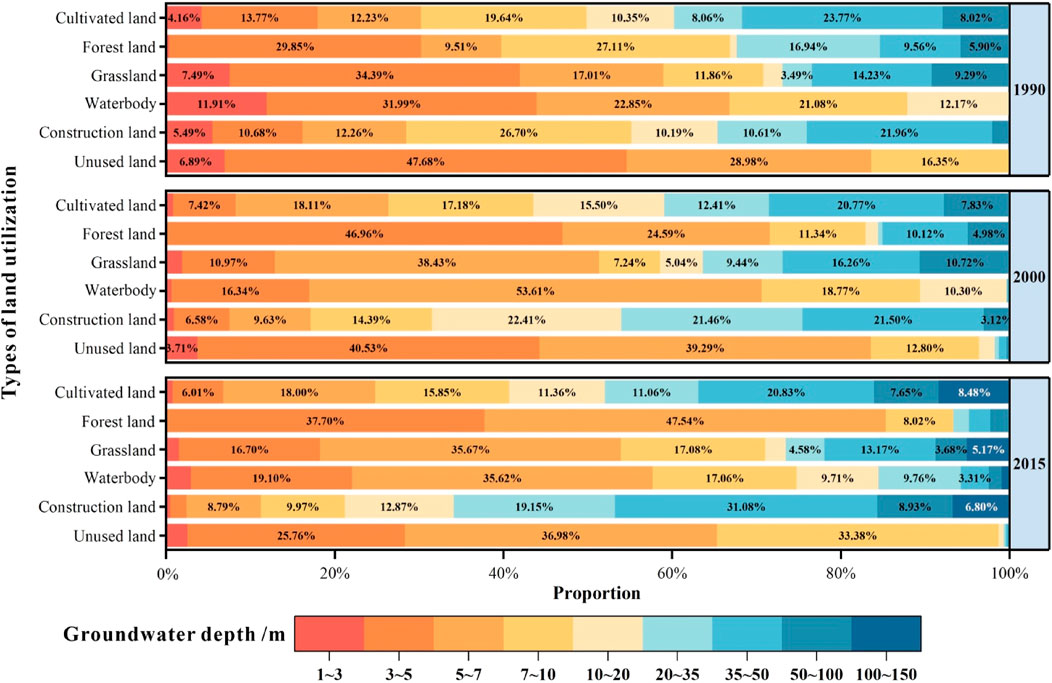
FIGURE 8. The ratios of land utilization types in different groundwater tables in 1990, 2000, and 2015 (the ratios less than 3% are not visible).
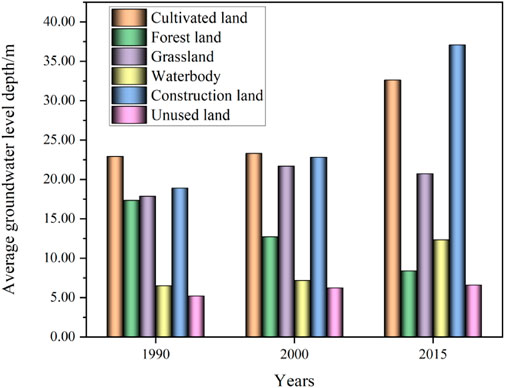
FIGURE 9. The average depths of groundwater table for various types of land utilization in Huocheng plain.
In general, between the years 1990 and 2000, the relationship of the average depth of groundwater table corresponding to each land utilization type was as follows: cultivated land > construction land > grassland > forest land > waterbody > unused land. However, in 2015, it was changed as follows: construction land > cultivated land > grassland > waterbody > forest land > unused land. The average depth of the groundwater table corresponding to construction land increased the most over this period, from 18.90 m in 1990 to 22.82 m in 2000 and ending at 37.06 m in 2015. It was followed by cultivated land, the groundwater table of which deepened from 22.92 m in 1990 to 23.30 m in 2000 and eventually approached 32.67 m in 2015. Unused land had a minor variation of groundwater table during this study period, maintained at 5–6 m. Nonetheless, the groundwater table of forest land became shallower over this duration, e.g., its corresponding depths decreased from 17.34 m in 1990 to 12.72 m in 2000 and finally down to 8.40 m in 2015.
The study area’s average depth of groundwater table gradually increased over time. For example, in 1990, the average depth of groundwater table was 18.98 m. However, due to the gradual expansion of the proportion of cultivated land and construction land in this study area, the average depth of groundwater table decreased to 19.54 and 28.55 m in 2000 and 2015, respectively, in this region.
By depth-mapping the groundwater table variations for the two selected periods (the longer one of 1990–2015 and the shorter one of 2000–2015), it was capable of determining the incremental/decremental variations of the groundwater table in the form of contouring maps for the investigated area (see Figure 10). Then, the outcomes could be superimposed with the area transfers among various land utilization types during 1990–2015 and 2000–2015 for additional in-depth analysis. As a result, the area changes of each land utilization type versus its corresponding depth variations of groundwater table in both shorter and longer periods are obtained in Figure 11 (see Supplementary Tables S4, S5).
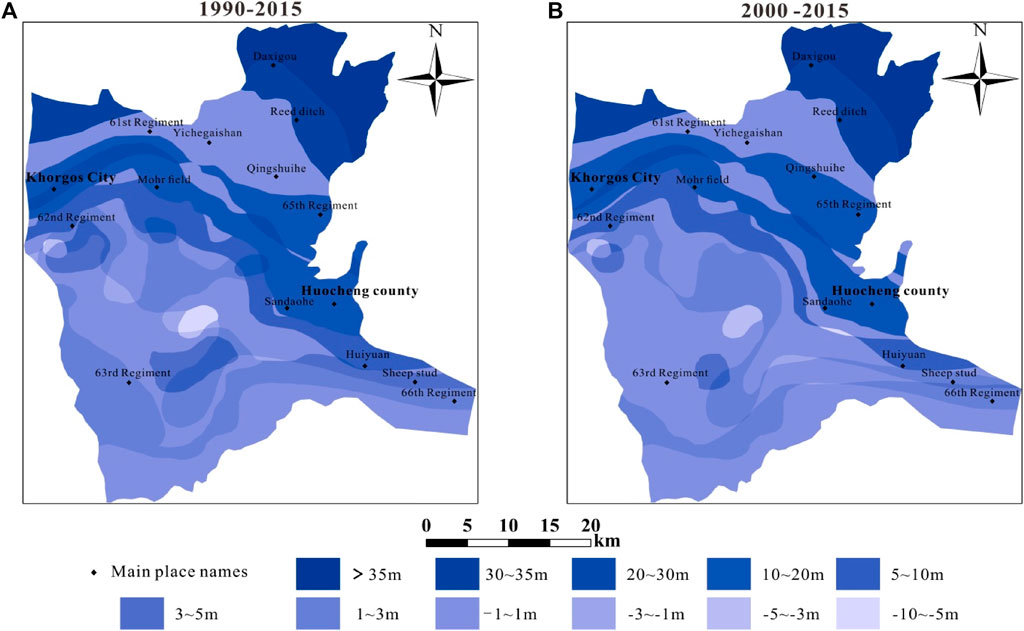
FIGURE 10. The spatial contour of the depth variation of the groundwater table in Huocheng plain: (A) 1990–2015 and (B) 2000–2015.
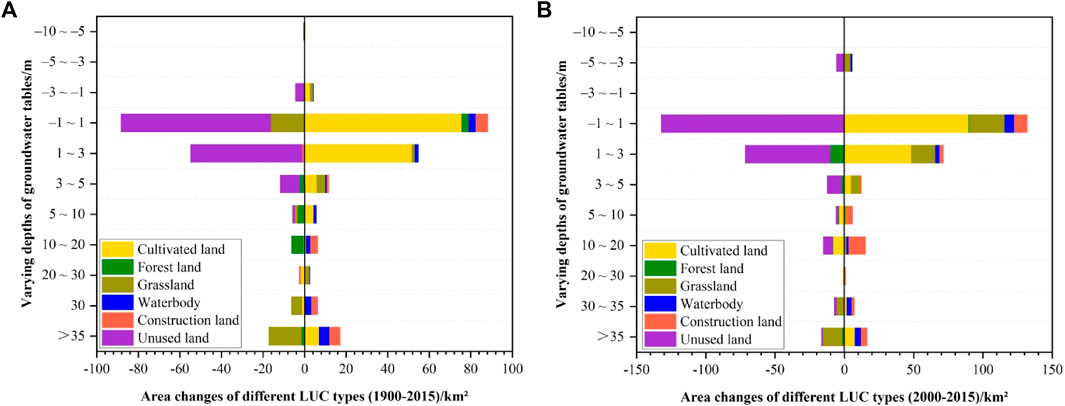
FIGURE 11. Area changes of land utilization types to varying depths of groundwater tables in Huocheng plain: (A) 1990–2015 and (B) 2000–2015.
As for the longer study period (1990–2015), the area where the depth of the groundwater table increased by more than 1 m was approaching 1,149.94 km2, accounting for 62.71% of the study area, as shown in Figure 5, including the area of cultivated land having increased by 65.24 km2, the area of construction land having increased by 10.88 km2, and the area of unused land having increased by 64.69 km2. The newly expanded area of cultivated land was mainly transferred from the sandy desert in the southern region of Huocheng plain since the sandy desert control became the primary goal in this region. Nevertheless, the surface water stored in adjacent rivers decreased due to increased catchment water discharging into ambient groundwater systems. Also, the surface water was almost cut off at all times except during the flood season, leading to decreased groundwater recharge from ambient surface water systems (e.g., rivers, creeks, other surface runoff, etc.). Simultaneously, under the influence of overirrigation in this area for a very extended period, the amount of irrigation into cultivated land per unit area was much higher than the water demand for crop growth, resulting in the constantly increasing groundwater consumption endlessly extracted from deep underground. Therefore, under the concurrent effect of multiple factors mentioned previously, such as the decrease of surface water supply and the continuous increase of groundwater extraction, the expansion of cultivated land area became the main reason for the groundwater table drawdown in Huocheng plain.
As for the shorter study period (2000–2015), the area where the depth of the groundwater table increased by more than 1 m ended with 999.02 km2, accounting for 54.48% of the entire study area, as shown in Figure 5; e.g., the area of cultivated land increased by 49.37 km2; the area of construction land increased by 28.16 km2; the area of unused land decreased by 84.39 km2. In addition, the construction land area increased significantly during this period, straightforwardly reflecting the continuous progress of urbanization in this region and the increasing dependence on groundwater consumption from which urban living and production were in need. The statistical analysis showed that the proportion of groundwater in the total water supply had increased nearly four times since 2000. Therefore, the expanding construction land area also became another reason for the decrease in the groundwater table in Huocheng plain.
6 Discussions
Through exploring the variations of land utilization types and groundwater tables in two different temporal scales in the Huocheng plain, the research findings could be summarized as follows.
(1) For the longer temporal scale (1990–2015), the expansion of cultivated land led to the increasing irrigation demand, promoting the increase of canal systems and groundwater extraction, and finally resulted in the groundwater drawdown. On the one hand, the utilization coefficient of the canal systems increased from 0.48 in 1990 to 0.68 in 2014. The proportion of irrigation consumption accounted for more than half of the annual surface water runoff by 2015, proving the decreasing groundwater recharge from ambient surface water in the region. On the other hand, since the groundwater extraction mainly relied on mechanical pumping through artificial wells, the number of electromechanical pumped wells increased by 3.7 times in this area from 2000 to 2011, and the proportion of groundwater artificially extracted in this area increased by 5.35 times from 2000 to 2015. Those correlative analyses and research findings are consistent with the results and findings of Yang and He (2008) and the statistical analysis of surveying data on mechanical and electromechanical wells in Huocheng county.
(2) For the shorter temporal scale (2000–2015), the expansion of construction land was another reason for the drawdown of groundwater table in this region. This can be confirmed by the numerical simulation results of groundwater dynamics under the newly built industrial zone in this area (Yin, 2016). Through numerical simulations of groundwater dynamics in this industrial zone (Yin, 2016), the simulated results and their post-analysis predicted that the annual variation of groundwater table near the industrial park in the future would be about 2–4 times that of other areas in Huocheng plain.
(3) During 1990–2015, the subdivision boundary of the groundwater table moved northeastward significantly. The main reason was attributable to the fact that the population distribution in the following areas, including Huocheng county, Khorgoz city, Qingshuihe town, and the 63rd regiment of the Xinjiang Production and Construction Corps were increasingly dense, so the agricultural, industrial, and residential needs were increasing. With a limited amount of surface water, large-scale groundwater extraction increased the depths of groundwater table in Huocheng plain. Those correlative analyses are consistent with the research outcomes of Huo et al. (2020).
(4) The datasets of long-term observations of groundwater recharging/discharging sources and groundwater table variations in this area are still yet to be adequate and, therefore, need to be more comprehensive and sufficient. Besides, further attention should be paid to groundwater extraction by in situ hydrogeological investigation in order to collect more data on actual groundwater consumption from various land utilization types, including human-impact factors. Moreover, to further study the impact of varying types of land utilization on groundwater storage, it is necessary to eliminate the influence of natural impact factors on groundwater in/outflow. Last but not least, to acquire the evaporation discharge accurately, it is also necessary to consider the total amount of ecological water or plant water, such as soil water taken up by plants from the ground, released by plants by evapotranspiration, and retained in plants.
7 Conclusion
Based on the datasets of land utilization types for Huocheng plain from 1990 to 2015, this paper analyzed the dynamic characteristics of land utilization change and the spatiotemporal migration characteristics in the study area by using the dynamic model of land utilization degree, the transferring matrix method and standard deviation ellipse method. The effects of land utilization variations on groundwater balance and groundwater table were explored. The concluding points can finally be summarised as follows.
(1) In the study period, land utilization types frequently changed. For the longer temporal scale (1990–2015), the cultivated and construction land were the two types with the most significant changes in the region, and their area continued to increase constantly. The expansion was mainly transferred from grassland, unused, and forest land. For the shorter temporal scale (2000–2015), the construction land area increased significantly in this study area, and the primary transferred categories included cultivated land, grassland, and unused land. In the spatiotemporal migration of land utilization, the shift of the location center of cultivated land was slight and almost limited in the center of the entire study area. However, the transfer span of the location center of construction land was more extensive, and its migrating direction was mainly from south to northeast.
(2) During the past 25 years, the total amount of groundwater storage in the study area exhibited a downward trend from initial storage growth in positive in 1990 towards an eventual storage reduction in negative between 2000 and 2015. Also, the total recharge amount decreased by 2.09 × 10⁸ m3/year, and discharge continuously declined by 1.88 × 10⁸ m3/year. Meanwhile, the groundwater recharging and discharging elements were significantly altered, among which field irrigation and artificial extraction were the elements with the most significant variations. Thus, human activities were the fundamental driving terms that caused the changes in groundwater sources.
(3) Compared with 2000 and 2015, the subdivision boundary of the groundwater table, i.e., the boundary between the shallower (0–10 m) and deeper groundwater tables (10–150 m), migrated from south to northeast remarkably since the 1990s and the decrease in the groundwater table was more significant in the north. The average depths of the groundwater table decreased continuously in the study area over this period. The intermediate groundwater table corresponding to the construction land dropped the most over this period, followed by the cultivated land, and the unused land encountered the most minor changes in groundwater drawdown, which proved the temporal and spatial variation of the groundwater table was significantly affected by artificial extraction.
In conclusion, variation in land utilization types has been identified and recognized as one of the main driving factors for changing the groundwater balance state and reducing groundwater storage in this region. The dynamic evolutions of groundwater table and storage are highly correlated with the areal change in cultivated and construction land.
Data availability statement
The raw data supporting the conclusion of this article will be made available by the authors, without undue reservation.
Author contributions
Conceptualization, YL, and WC; methodology, YL, and GY; software, YL, QX, and SD; validation, GY, and ZH; formal analysis, YL, and GY; investigation, WC, and CZ; resources, WC, and YL; data curation, GY, and LD; writing—original draft preparation, YL, WC, and GY; writing—review and editing, YL, and GY; visualization, SD, QX; supervision, JC, GY, and ZH; project administration, LD; funding acquisition, LD. All authors contributed to the article and approved the submitted version.
Funding
This research was supported and funded by the China Geological Survey Project (DD20230480 and DD2016008117).
Acknowledgments
The authors would like to acknowledge the technical support from Chong Xu at the Institute of Crustal Dynamics, China Earthquake Administration, China, and Haogang Dong at Changsha Comprehensive Survey Center of Natural Resources, China Geological Survey, China.
Conflict of interest
The authors declare that the research was conducted in the absence of any commercial or financial relationships that could be construed as a potential conflict of interest.
Publisher’s note
All claims expressed in this article are solely those of the authors and do not necessarily represent those of their affiliated organizations, or those of the publisher, the editors and the reviewers. Any product that may be evaluated in this article, or claim that may be made by its manufacturer, is not guaranteed or endorsed by the publisher.
Supplementary material
The Supplementary Material for this article can be found online at: https://www.frontiersin.org/articles/10.3389/fenvs.2023.1225916/full#supplementary-material
References
Bai, B., Jiang, S., Liu, L., Li, X., and Wu, H. (2021a). The transport of silica powders and lead ions under unsteady flow and variable injection concentrations. Powder Technol. 387, 22–30. doi:10.1016/j.powtec.2021.04.014
Bai, B., Nie, Q., Zhang, Y., Wang, X., and Hu, W. (2021b). Cotransport of heavy metals and SiO2 particles at different temperatures by seepage. J. Hydrology 597, 125771. doi:10.1016/j.jhydrol.2020.125771
Bear, J. (1972). Dynamics of fluids in porous media. New York, USA: American Elsevier Publishing Company, Inc.
Charbeneau, Rj, and Sherif, Sa (2002). Groundwater hydraulics and pollutant transport. Appl. Mech. Rev. 55 (2), B38–B39. doi:10.1115/1.1451232
Chen, X., Tu, X., Xie, P., and Li, Y. (2010). Progresses in the research of human induced variability of hydrological elements. Adv. Earth Sci. 25 (8), 800–811.
Claessens, L., Schoorl, J. M., Verburg, P. H., Geraedts, L., and Veldkamp, A. (2009). Modelling interactions and feedback mechanisms between land use change and landscape processes. Agric. Ecosyst. Environ. 129 (1-3), 157–170. doi:10.1016/j.agee.2008.08.008
Cui, J., Du, J., and Li, X. (2015). Effects of land use change on groundwater quality in Qiqihar city. Earth Environ. 43 (3), 308–315.
Deng, H.-P. (2001). Impacts of climate change and land use-land cover change on hydrology and water resources. Adv. Earth Sci. 16 (3), 436–441.
Elmahdy, S. I., and Mohamed, M. M. (2016). Land use/land cover change impact on groundwater quantity and quality: A case study of ajman emirate, the United Arab Emirates, using remote sensing and GIS. Arabian J. Geosciences 9 (19), 722–735. doi:10.1007/s12517-016-2725-y
Fu, Q., Yang, D., Zhang, X., Xia, F., and Fei, W. (2016). Time and space differentiation of relative carrying capacity of resources in Ili based on improved model. J. Univ. Chin. Acad. Sci. 33 (2), 170–177.
Ghaffari, G., Keesstra, S., Ghodousi, J., and Ahmadi, H. (2010). SWAT-simulated hydrological impact of land-use change in the Zanjanrood basin, Northwest Iran. Hydrological Process. Int. J. 24 (7), 892–903. doi:10.1002/hyp.7530
Hancock, P. J. (2002). Human impacts on the stream–groundwater exchange zone. Environ. Manag. 29 (6), 763–781. doi:10.1007/s00267-001-0064-5
Hu, X., Wu, B., Gao, F., Du, M., and Zhang, W. (2021). Response of groundwater level dynamics to land use change in hutubi county. J. Soil Water Conservation 35 (5), 227–234.
Huo, S., Wang, W., and Duan, L. (2020). An analysis of groundwater resources composition and driving force in Huocheng county. Hydrogeology Eng. Geol. 47 (2), 51–59.
Izbicki, J. A., Teague, N. F., Hatzinger, P. B., Böhlke, J. K., and Sturchio, N. C. (2015). Groundwater movement, recharge, and perchlorate occurrence in a faulted alluvial aquifer in California (USA). Hydrogeology J. 23 (3), 467–491. doi:10.1007/s10040-014-1217-y
Kang, L., and Zhang, H. (2012). Assessment of the land desertification sensitivity of newly reclaimed area in Yili, Xinjiang. Resour. Sci. 34 (5), 896–902.
Lei, M., Kong, X., Zhang, X., and Wu, F. (2017). Land use change and impact on groundwater storage in the Huang-Huai-Hai Plain. Resour. Sci. 39 (6), 1099–1116.
Lei-Hua, D., Li-Hua, X., Kun-Xia, Y., and Shuai, L. (2012). Research advances in effects of climate change and human activities on hydrology. Adv. Water Sci. 23 (2), 278–285.
Li, L., Huang, X., and Zhong, T. (2006). A likely molecular basis of the susceptibility of Giardia lamblia towards oxygen. Res. Soil Water Conservation 13 (2), 202–211. doi:10.1111/j.1365-2958.2005.04896.x
Li, Y., and Tao, Z. (2015). Investigation and evaluation report on groundwater resources and environment in Ili river valley, Xinjiang. Xi’an, Shaanxi, China: Xi’an Center of Geological Survey, China Geological Survey.
Liu, B., Yan, G., Ma, Y., and Scheuermann, A. (2023). Measurement of in-situ flow rate in borehole by heat pulse flowmeter: Field-case study and reflection. Geosciences 13 (5), 146. doi:10.3390/geosciences13050146
Liu, J., Yu, Q., Yue, D., Zhang, Q., and Wu, Y. (2019a). miRNA-223-3p and let-7b-3p as potential blood biomarkers associated with the ischemic penumbra in rats. Trans. Chin. Soc. Agric. Mach. 50 (12), 205–216.
Liu, R., Wang, J., Zhou, Y., Huang, H., and Chen, C. (2019b). Simulation of karst groundwater balance in the Westshan mountains, Heqing county, Yunnan Province. Carsologica Sin. 38 (4), 532–538.
Ma, X.-W., Li, B.-G., Wu, C.-R., Peng, H.-J., and Guo, Y.-Z. (2003). Predicting of temporal-spatial change of groundwater table resulted from current land use in Minqin oasis. Adv. Water Sci. 14 (1), 85–90.
Ma, Y., Kong, X. Z., Scheuermann, A., Galindo-Torres, S., Bringemeier, D., and Li, L. (2015). Microbubble transport in water-saturated porous media. Water Resour. Res. 51 (6), 4359–4373. doi:10.1002/2014wr016019
Ma, Y., Yan, G., and Scheuermann, A. (2022). Discrete bubble flow in granular porous media via multiphase computational fluid dynamic simulation. Front. Earth Sci. 10, 947625. doi:10.3389/feart.2022.947625
Ma, Y., Yan, G., Scheuermann, A., Li, L., Galindo-Torres, S., and Bringemeier, D. (2014). “Discrete microbubbles flow in transparent porous media,” in Proceedings of the 6th International Conference on Unsaturated Soils (UNSAT 2014), Australia , Sydney, July 2014, 1219–1223.
Prabhakar, A., and Tiwari, H. (2015). Land use and land cover effect on groundwater storage. Model. Earth Syst. Environ. 1 (4), 45–10. doi:10.1007/s40808-015-0053-y
Shu, L., Xu, L., Yuan, Y., Lv, Y., Lu, C., and Liu, B. (2022). Analysis on variation of groundwater flow field and its main influencing factors in the typical district of Sanjiang Plain. J. Hydraulic Eng. 53 (6), 644–654.
Tong, S. T., Sun, Y., Ranatunga, T., He, J., and Yang, Y. J. (2012). Predicting plausible impacts of sets of climate and land use change scenarios on water resources. Appl. Geogr. 32 (2), 477–489. doi:10.1016/j.apgeog.2011.06.014
Wang, S., Liu, J., Zhang, Z., Zhou, Q., and Zhao, X. (2001). Analysis on spatial-temporal features of land use in China. Acta Geographica Sinica 56 (6), 631–639.
Wang, Z., Xaymurat, A., and Hu, X.-G. (2012). Analysis on water environment change and its influence factors in Huocheng county of Xinjiang. Water Conservancy Sci. Technol. Econ. 18 (6), 3–8.
Xu, X., Liu, J., Zhang, S., Li, R., Yan, C., and Wu, S. (2018). “China many periods of land use land cover remote sensing monitoring data set (CNLUCC),” in Resources and environment science data center data registration and publication system, Chinese Academy of sciences. Beijing, China: Chinese Academy of Science.
Yan, G., Bore, T., Bhuyan, H., Schlaeger, S., and Scheuermann, A. (2022a). The technical challenges for applying unsaturated soil sensors to conduct laboratory-scale seepage experiments. Sensors 22 (10), 3724. doi:10.3390/s22103724
Yan, G., Bore, T., Schlaeger, S., Scheuermann, A., and Li, L. (2022b). Investigating scale effects in soil water retention curve via spatial time domain reflectometry. J. Hydrology 612, 128238. doi:10.1016/j.jhydrol.2022.128238
Yan, G., Li, Z., Bore, T., Galindo Torres, S. A., Scheuermann, A., and Li, L. (2022c). A lattice Boltzmann exploration of two-phase displacement in 2D porous media under various pressure boundary conditions. J. Rock Mech. Geotechnical Eng. 14 (6), 1782–1798. doi:10.1016/j.jrmge.2022.05.003
Yan, G., Li, Z., Bore, T., Torres, S. a. G., Scheuermann, A., and Li, L. (2021). Discovery of dynamic two-phase flow in porous media using two-dimensional multiphase lattice Boltzmann simulation. Energies 14 (13), 4044. doi:10.3390/en14134044
Yang, L., and He, G. (2008). Consid. water-saving irrigation Ili River Basin Yangtze River 39 (20), 50–51.
Yin, X. (2016). Aquifer structure study and groundwater resource evaluation in Huocheng Basin. Master of Engineering Thesis. New Delhi, India: Institute of Disaster Prevention.
Zhang, X., Zhang, L., and Gu, J. (2014). Spatial and temporal variation characteristics of groundwater and its response to land use/cover change in dunhuang oasis. J. Lanzhou Univ. Nat. Sci. 50 (3), 311–317.
Zhang, Y., Sheng, L., Yuan, G., Ge, Y.-Y., and Yu, J.-X. (2022). An analysis of the relationship between the groundwater depth and the land use change in arid and semi-arid areas: Taking kashgar delta as an example. China Rural Water Hydropower 475 (5), 38–44.
Zhao, Y., Zou, S., Shen, H., Zhou, C., Fan, L., Zhu, D., et al. (2021). Dynamic characteristics and equilibrium of water level of the karst groundwater system beneath the Huixian wetland. Carsologica Sin. 40 (2), 325–333.
Zheng, J., Wang, H., and Liu, B. (2022). Impact of the long-term precipitation and land use changes on runoff variations in a humid subtropical river basin of China. J. Hydrology Regional Stud. 42, 101136. doi:10.1016/j.ejrh.2022.101136
Keywords: land utilization type, groundwater balance, groundwater table, groundwater drawdown, Huocheng plain
Citation: Lu Y, Dai L, Yan G, Huo Z, Chen W, Lan J, Zhang C, Xu Q, Deng S and Chen J (2023) Effects of various land utilization types on groundwater at different temporal scales: a case study of Huocheng plain, Xinjiang, China. Front. Environ. Sci. 11:1225916. doi: 10.3389/fenvs.2023.1225916
Received: 20 May 2023; Accepted: 05 September 2023;
Published: 11 October 2023.
Edited by:
Guangjin Wang, Kunming University of Science and Technology, ChinaReviewed by:
Bing Bai, Beijing Jiaotong University, ChinaYihui Niu, Chongqing University of Science and Technology, China
Copyright © 2023 Lu, Dai, Yan, Huo, Chen, Lan, Zhang, Xu, Deng and Chen. This is an open-access article distributed under the terms of the Creative Commons Attribution License (CC BY). The use, distribution or reproduction in other forums is permitted, provided the original author(s) and the copyright owner(s) are credited and that the original publication in this journal is cited, in accordance with accepted academic practice. No use, distribution or reproduction is permitted which does not comply with these terms.
*Correspondence: Yongxing Lu, bHV5b25neGluZ0BtYWlsLmNncy5nb3YuY24mI3gwMjAwYTs=, WW9uZ3hpbmcuTHVfQ1NDU0NAb3V0bG9vay5jb20=; Guanxi Yan, Zy55YW5AdXEuZWR1LmF1
 Yongxing Lu1,2*
 Guanxi Yan
 Jian Chen
