 Zhaosheng Wang
 Zhengjia Liu
 Mei Huang
- National Ecosystem Science Data Center, Key Laboratory of Ecosystem Network Observation and Modeling, Institute of Geographic Sciences and Natural Resources Research, Chinese Academy of Sciences, Beijing, China
The accurate estimation of cropland net primary productivity (NPP) remains a significant challenge. We hypothesized that incorporating prior information on NPP simulated by process-based models into normalized difference vegetation index (NDVI) data would improve the accuracy of cropland ecosystem NPP estimations. We used NDVI, MNPP (NPP of process-based model), and SNPP (statistic-based NPP) data estimated by nine process-based models and yield statistics to build a learning ensemble of the random forest model (LERFM). We used the new model to re-evaluate the cropland NPP in China from 1982 to 2010. Large spatial discrepancies among MNPPs, which indicate uncertainties in cropland NPP estimation using different methods, were observed when compared to SNPP. The LERFM model showed a slightly underestimation of only −0.37%, while the multi-model average process-based model (MMEM) strongly underestimated −15.46% of the SNPP. LERFM accurately estimated cropland NPP with a high simulation skill score. A consistent increasing trend in the LERFM and MMEM NPP during 1982–2010 and a significant positive correlation (r = 0.795, p < 0.001) between their total NPP indicate that the LERFM model can better describe spatiotemporal dynamic changes in cropland NPP. This study suggests that a learning ensemble method that combines the NDVI and process-based simulation results can effectively improve cropland NPP.
1 Introduction
Cropland ecosystems are heavily impacted by human activity, affecting both the food supply and carbon cycle (Gray et al., 2014; Li et al., 2014; Medkova et al., 2017; She et al., 2017; Liu et al., 2022a). Accurate estimation of cropland net primary productivity (NPP) is crucial for understanding its ability to absorb atmospheric CO2, which is a critical indicator of the carbon balance in the ecosystem. Globally, cropland ecosystems account for approximately 14% of the total terrestrial NPP (Maestrini et al., 2022). In China, croplands are an important carbon sink contributing significantly to national terrestrial NPP and play a significant role in regulating the carbon balance on both global and regional scales (Pan et al., 2015; Tang et al., 2019; Tao et al., 2019).
However, accurate estimation of cropland NPP remains a significant challenge (Tao et al., 2005; Li et al., 2014; Yuan et al., 2015; Medkova et al., 2017; She et al., 2017). Compared to forest, grassland, and shrub ecosystems, cropland ecosystems are strongly influenced by various human activities such as management, fertilization, and irrigation. Consequently, changes in NPP are affected by complex factors, making the estimation process more challenging and causing greater uncertainty and variance between the results (Yuan et al., 2015). In addition, different estimation schemes use varying influencing factors or parameterization schemes, which causes more differences in the estimation results (Bonan et al., 2019). Furthermore, data-driven models with different mechanisms or structures also result in spatiotemporal differences in simulated cropland NPP (Bonan et al., 2019). As a result, the differences between these NPP results contribute to the uncertainty in accurate estimation to some extent. Therefore, improving regional-scale estimation accuracy and reducing uncertainty in secondary estimation results by referring to existing estimations remain challenging. Accurate estimation of cropland NPP is crucial for deepening our understanding of the carbon cycle mechanisms of cropland ecosystems, food security, mitigating climate change, and promoting the development of precision agriculture (Li et al., 2014). Currently, five main methods are used to estimate NPP: cropland surveys, empirical models, biochemical models, dynamic vegetation models, and remote sensing estimation models (Tao et al., 2005; Li et al., 2014; Jian et al., 2020; Maestrini et al., 2022). At a regional scale, NPP estimations primarily use model simulations and cropland inventories. For example, remote sensing data-driven estimation models can accurately estimate NPP at large scales, with the normalized difference vegetation index (NDVI) improving estimation accuracy. Although the cropland inventory is an important NPP estimation method, it lacks spatial details and is limited to statistical administrative units. These results contributed to global and regional cropland NPP estimations and helped narrow the uncertainty in the estimation results. Despite differences in cropland NPP estimates, these estimates still contain valuable prior information.
With the accumulation of observational data and the advent of the era of big data, the current research focus and challenge lies in utilizing observational data at various spatiotemporal scales to enhance the accuracy of simulation models (Shu-Shi et al., 2020; Medlyn et al., 2015). The challenge for agricultural geoscience big data is to fully utilize this information to improve NPP estimation accuracy (Tao et al., 2005; Schwalm et al., 2020; Zhang et al., 2021). Currently, there are several issues in accurately estimating cropland NPP: ①Significant discrepancies exist among simulation results from multiple models, which complicates the precise assessment of cropland NPP. This discrepancy primarily stems from variations in model structure, processes, parameters, and driving factors (such as climate, soil data, and land use data), as well as differences in spatial and temporal resolutions. As a result, considerable disparities were observed between the results of the multiple models. Projects such as TRENDY, MsTMIP (Multiscale Synthesis and Terrestrial Model Intercomparison Project), ISIMIP (the Inter-Sectoral Impact Model Intercomparison Project), and others that compare models have consistently demonstrated inconsistencies and uncertainties in the simulation results of various ecosystem process models. Consequently, there is considerable debate regarding the reliability of carbon sink simulations in regional terrestrial ecosystems (Stocker et al., 2013; Piao et al., 2022). ②Existing process-based models typically offer low spatial resolution for estimating NPP at the national scale, making it challenging to meet the practical requirements for high-precision carbon measurements in precision agriculture. This limitation hinders an accurate assessment of the carbon sink status of cropland ecosystems. Currently, there is a lack of methodological foundations for estimating NPP in cropland ecosystems at a large scale with high precision. Even with the use of advanced spatial interpolation techniques, the coarse spatial resolution of the model results can lead to overestimation or underestimation of variable values. ③ Traditional multi-model ensemble methods, which fail to fully consider the relationships between models, can introduce secondary errors in cropland NPP estimations. For instance, compared to the random forest learning ensembles of process-based models, the simple arithmetic mean ensemble method tends to overestimate variable values significantly, while the state-of-the-art machine learning method only slightly underestimates them (Pan et al., 2020; Han et al., 2022). ④Many existing process models lack dynamic vegetation simulation capabilities and struggle to realistically simulate the productivity of cropland ecosystems (Han et al., 2022). Currently, most process-based models ignore dynamic changes in agricultural plants, which increases the uncertainty of actual cropland NPP estimation. This limitation makes it difficult to meet the requirements for rapid, large-scale, and high-precision estimation of carbon components in cropland ecosystems.
To produce a NPP estimation with high accuracy and high confidence, we propose using machine learning (e.g., random forest) to combine simulation results from process-based models and observational large-scale remote sensing data to estimate cropland NPP in China more accurately. Machine learning methods can help to identify patterns and relationships in complex datasets, which can improve our understanding of the underlying processes governing terrestrial carbon dynamics (Pan et al., 2020; Schlund et al., 2020; Han et al., 2022; Pravalie et al., 2023; Yi and Wu, 2023; Zhang et al., 2021; Li et al., 2022; Peng et al., 2022; Tuia et al., 2022). For example, the use of a learning ensemble of the random forest model (LERFM) approach, leveraging multimodel data results, can enhance simulation accuracy and facilitate the precise estimation of carbon composition in terrestrial carbon ensemble measurements (Li et al., 2022; Peng et al., 2022; Xu et al., 2022; Pravalie et al., 2023; Wang et al., 2023; Yi and Wu, 2023). Better predictions of terrestrial ecosystem carbon can lead to improved decision making, especially in areas such as climate change mitigation (Cheong et al., 2022; Ladi et al., 2022), agricultural planning, and natural resource management (Frey, 2020). These methods are also designed to handle complex and large datasets, which is often the case in ecological modelling (Frey, 2020; Arellano-Garcia et al., 2021; Damgaard, 2021; Fan et al., 2021; Wang et al., 2021; Whytock et al., 2021; Tuia et al., 2022; Phang et al., 2023).
Notably, remote sensing vegetation observation data (e.g., NDVI) can provide accurate characterization information regarding spatiotemporal growth dynamics (Liu et al., 2017; Rodigheri et al., 2020; Yan et al., 2021; Xi et al., 2022; Xue et al., 2022; Liu et al., 2022b) of agricultural plants on a national scale. The integration of observational data with process models has been shown to improve the prediction accuracy compared to using either approach alone. This information can address weaknesses in process-based models and improve NPP estimation accuracy. Therefore, we propose combining NDVI with prior information from simulated MNPP (NPP of process-based model) and SNPP (statistic-based NPP) data to build an integrated machine-learning model to accurately estimate NPP in China’s cropland ecosystem from 1982 to 2010.
2 Materials and methods
Currently, China’s cropland ecosystem is a significant component of the global ecosystem carbon cycle, owing to its extensive area and high carbon storage capacity. Rice, wheat, and maize are the main crops in China. Figure 1 shows the spatial distribution of croplands in China.
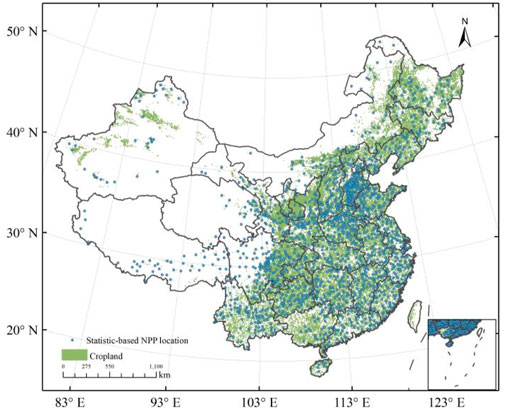
FIGURE 1. Geographical distribution of croplands in China. The solid dots show the locations of the 1244 statistic countries for NPP. The cropland distribution data were obtained from the Data Center for Resources and Environmental Sciences (http://www.resdc.cn).
2.1 Statistic-based NPP (SNPP) data
To train the constructed learning ensemble model with high accuracy, we used the statistic-based NPP (SNPP) of croplands obtained from the National Bureau of Statistics of China in 2005 to drive the LERFM model. The SNPP calculation formulas (Yan et al., 2007; Huang et al., 2007; Xi et al., 2022; Xue et al., 2022) are as follows:
where
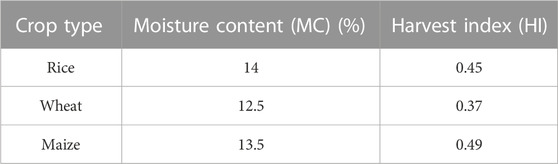
TABLE 1. The harvest moisture content (MC) and harvest index (HI) of three main crops. The two values were given in the Refs (Yan et al., 2021; Xue et al., 2022).
2.2 Process-based model NPP data
We incorporated the NPP outputs of eight models (AVIM2 (Huang et al., 2007; Ji et al., 2008), CEVSA2 (Gu et al., 2010), BIOME-BGC, CLASS-CTEM-N, CLM4, CLM4VIC, DLEM, ISAM, and TEMP6) to implement the new NDVI-driven learning ensemble model. The AVIM2 and CEVSA2 models provided 0.1-degree gridded annual NPPs for Chinese croplands from 1982 to 2010. The monthly NPP results for the other seven models were obtained from the MsTMIP model outputs, which are available online (https://doi.org/10.3334/ORNLDAAC/1225) (Huntzinger et al., 2013). Table 2 provides a short introduction to these land-process-based models.
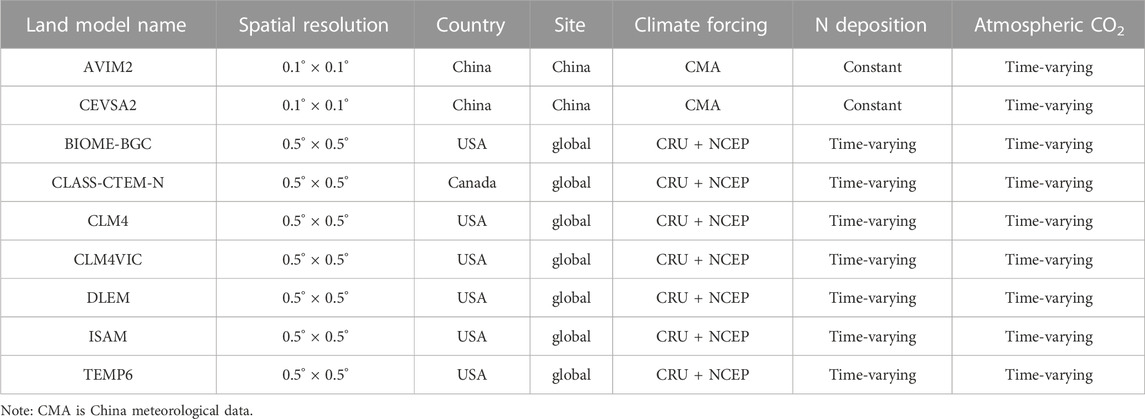
TABLE 2. Short introduction for process-based models.
These NPP outputs have been previously used to investigate terrestrial carbon cycle processes (Liu et al., 2019; Schwalm et al., 2020; Fer et al., 2021). The available period covered by the MsTMIP data is 1900–2010. There are no recent data from 2011 to 2022. Globally available NDVI data began in 1982. For these two reasons, this study used process model data from 1982 to 2010. Because the MsTMIP data do not have data products from 2011 to the present, this study cannot simulate and evaluate the cropland NPP from 2011 to the present. We extracted the annual NPP datasets from 1982 to 2010 over China using the CDO (Climate Data Operator, Version 1.9.9, available at https://code.mpimet.mpg.de/projects/cdo) software and then re-gridded them to a 0.1-degree spatial resolution using bilinear interpolation.
2.3 Normalized difference vegetation index (NDVI)
To minimize the uncertainty of NPP resulting from the modelling process using a static vegetation-driven physical process-based model, we utilized key spatiotemporal and growth information of crop vegetation from the NDVI between 1982–2010 to improve the accuracy of the national-scale cropland NPP estimation. We used the GIMMS NDVI3g.v1 dataset (https://iridl.ldeo.columbia.edu/SOURCES/.NASA/.ARC/.ECOCAST/.GIMmaximumvvaluendvi/) to produce monthly NDVI datasets–MVC (Maximum Value Compositing) method (Holben, 1986) for the period between 1982–2010. We then interpolated the NDVIs from 0.833-degree to 0.1-degree on the raster surface. In this study, we used a 12-month average annual NDVI value greater than 0.1. As NDVI describes the growth dynamics of agricultural vegetation, based on the cropland distribution data in Figure 1, we extracted cropland NDVI data from 1982 to 2010 as important auxiliary information for the estimation of cropland NPP.
2.4 A learning ensemble method for remap cropland NPP in China
By combining annual NDVI and SNPP values with MsTMIP cropland NPPs over China, we utilized the LERFM to re-estimate Chinese cropland NPP. Scikit-learn (version 1.2.2, https://scikit-learn.org/stable/modules/ensemble.html#forests-of-randomized-trees) was used to build and train LERFM. Here, we propose a theoretical model (see Eq. 2 for details) to describe this method. The formula for the LERFM is as follows:
where XMi,NPP (i = 1,2,3 … ,9) is the annual NPP value from a process-based model, and YMNPP is the LERFM annual NPP value. All of the SNPP was used to train the LERFM model.
The LERFM is an ensemble learning algorithm of random forest that improves the generalization ability of a model by constructing multiple decision trees and combining their prediction results. It consists of multiple decision trees, each of which is trained on a random sample of the original data. During the training process, for each decision tree, the algorithm randomly selects a subset of features for training, rather than using all features. This method of randomly selecting features helps to increase the randomness of the decision tree, reduce the variance of the model, and improve the overall generalization ability of the model. After obtaining the prediction results of each decision tree, the random forest votes or averages these results to obtain the final prediction class (classification problem) or average prediction value (regression problem). Since random forest contains multiple decision trees, it can reduce the overfitting problem of individual decision trees and improve the stability and accuracy of the model.
Figure 2 outlines the technical schemes used in this study. First, the NDVI and MNPP values for 2005 were extracted at the same coordinate points as the SNPP. Second, NDVI and eight MNPP variables were the new model input driving parameters, and SNPP was the target constraint value of the model to build the LERFM model. We employed a bootstrap sample and a hyperparameter optimization method to optimize the model. Third, we use the key parameter with the lowest prediction error to identify and select the optimal LERFM. Finally, the preferred LERFM was used to estimate the NPP of the Chinese croplands from 1982 to 2010.
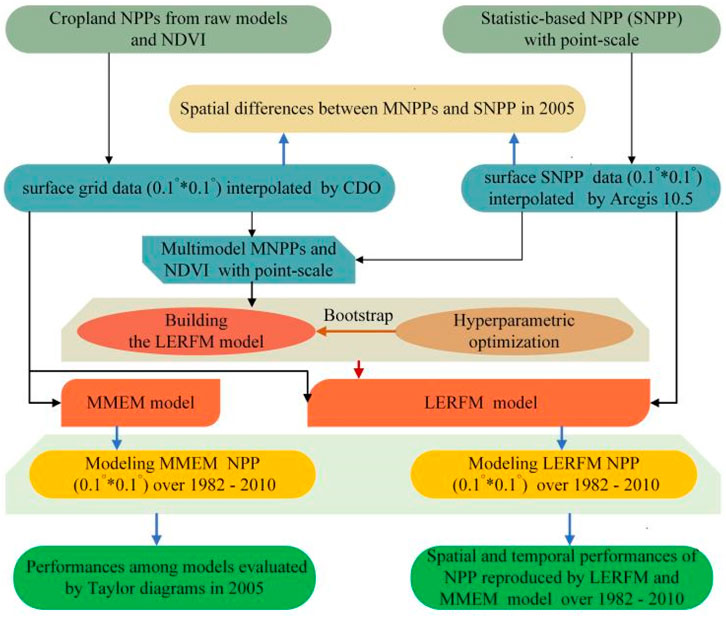
FIGURE 2. Flowchart of the method used in this study. MMEM is a simple multi-model arithmetic average method. MNPP is the NPP output of the process-based model.
2.5 An important model comparison method
We used the Taylor diagram statistical method to evaluate the performance of the LERFM (Taylor, 2001). We calculated three important metrics (r (correlation coefficient, see Eq. 3), root-mean-square difference (RMSD, see Eq. 5), and standard deviation (SD, see Eq. 4)) and plotted these variations to depict how well patterns match between the model results and observed data. The three metrics were calculated as follows:
Where MNPP and SNPP are the models and observations, respectively.
3 Results
3.1 Spatial discrepancy between SNPP and MNPP
We investigated the spatial distribution characteristics of SNPP and MNPP in 2005 (Figures 3, 4). The spatial distribution of SNPP showed that high and low SNPP values were mainly distributed in East and Northwest China, respectively (Figure 3A). Compared with SNPP, Figures 3B–J, Supplementary Figure S1, and Table 3 show the differences in the spatial distribution characteristics of NPP simulated by the nine models. For example, the average coverage area of NPP overestimated by the nine models accounted for 36.25% of the total cropland area, and the first three models with a large overestimation area were CEVSA2 (61.49%), CLM4 (58.45%), and DLEM (40.58%). In contrast, the average coverage area of NPP overestimated by the nine models accounted for 63.75% of the total area, and the first three models with large areas of underestimation were ClASS-CTEM-N (97.83%), ISAM (81.06%), and BIOME-BGC (67.23%). In addition, the probability distribution of NPP values (Figure 4) showed that the regional-average SNPP is 549 g C m−2, but the values from the raw models ranged from 86 to 646 g C m−2, the 9-model average NPP is 461 g C m−2 with a standard deviation of 165.8 g C m−2 (which is a 36.0% of the 9-model average NPP). Compared to the SNPP value, CEVSA2 and CLM4 were overestimated by 17.67% and 16.39%, respectively. Table 3 also shows that the underestimated magnitudes of NPP values of the remaining models range −84.34% to −9.47%. The first two magnitudes of CLASS-CTEM-N and ISAM are − −84.34% and −33.88%, respectively.
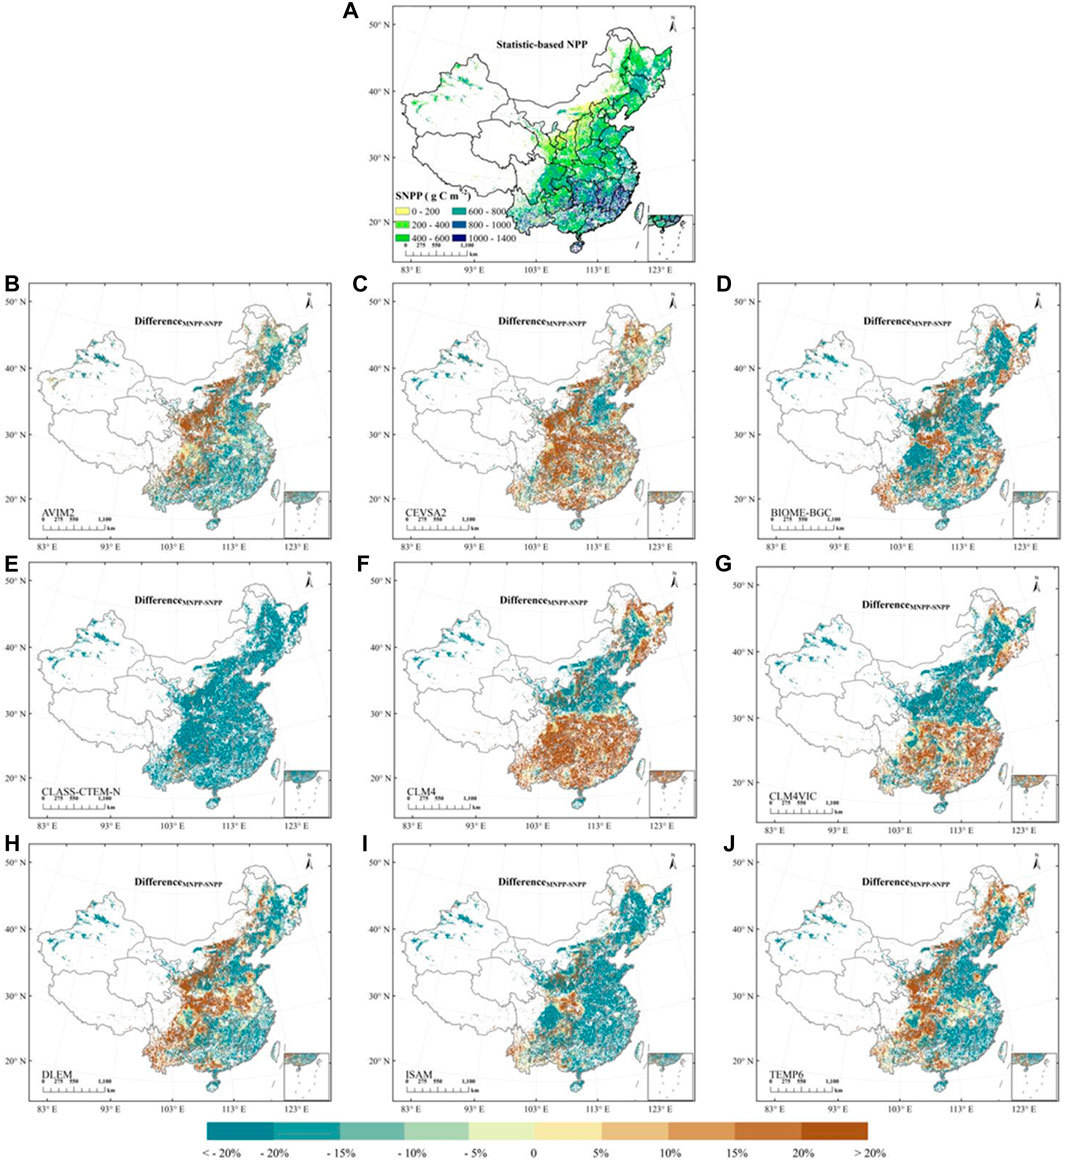
FIGURE 3. (A) Cropland SNPP (Statistic-based NPP) map of China for 2005. (B–J) for the spatial distribution of the difference in values of the MNPP-SNPP in 2005. The formula for the difference is
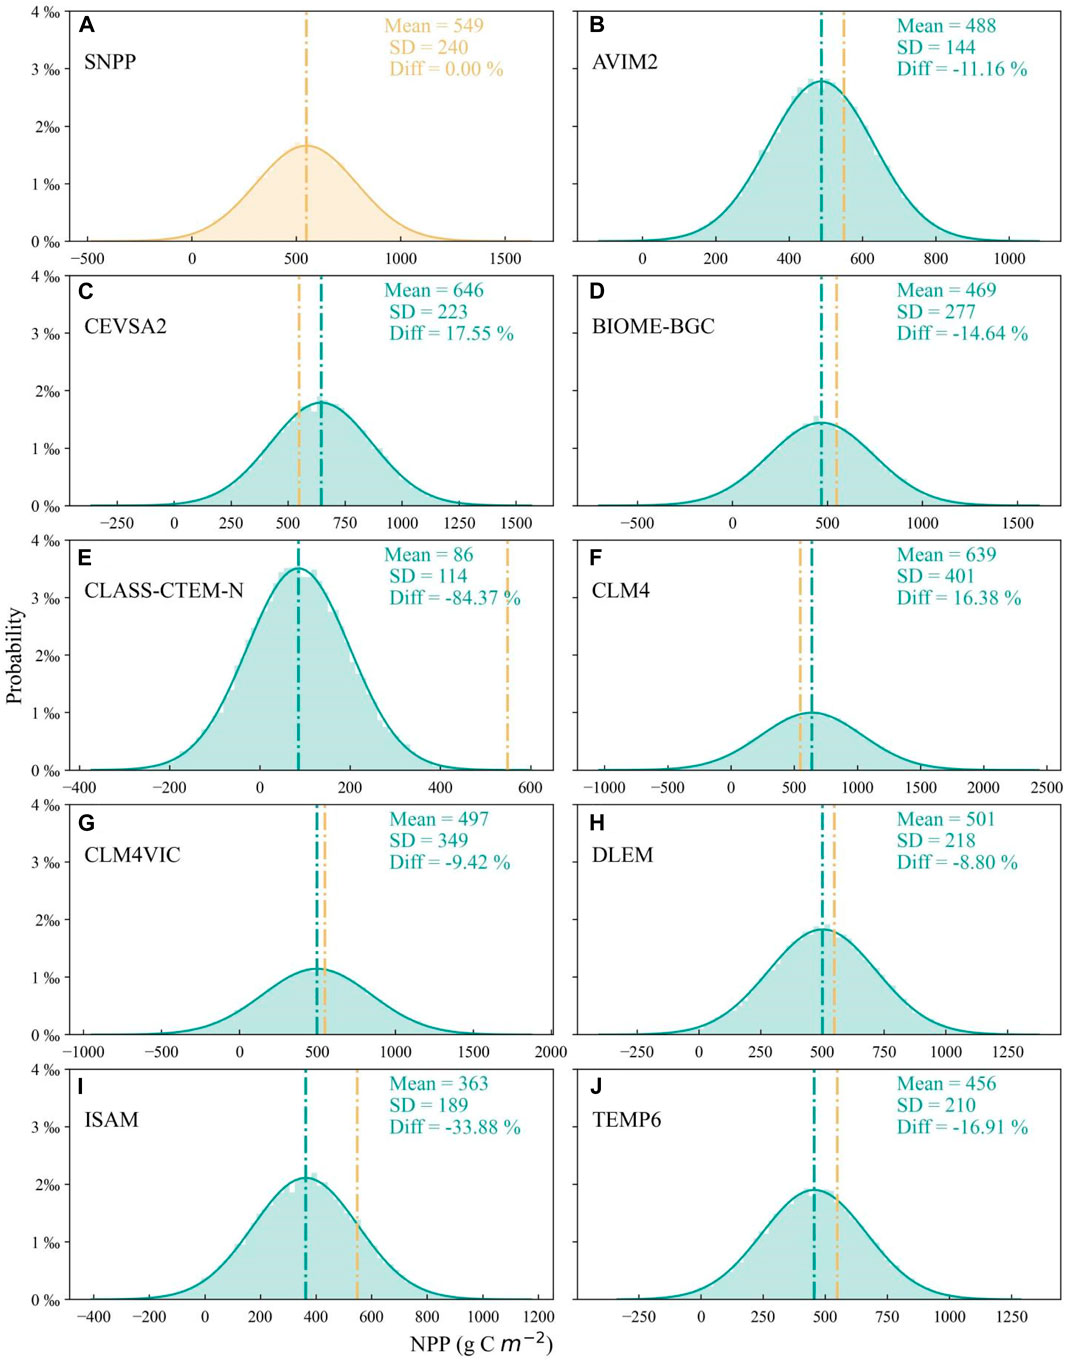
FIGURE 4. (A) Probability distribution of SNPP, but (B–J) for MNPP of AVIM2, CEVSA2, BIOME-BGC, CLASS-CTEM-N, CLM4, CLM4VIC, DLEM, ISAM, and TEMP6 models in 2005. The “SD” is a standard deviation of variation. The formula for Diff is
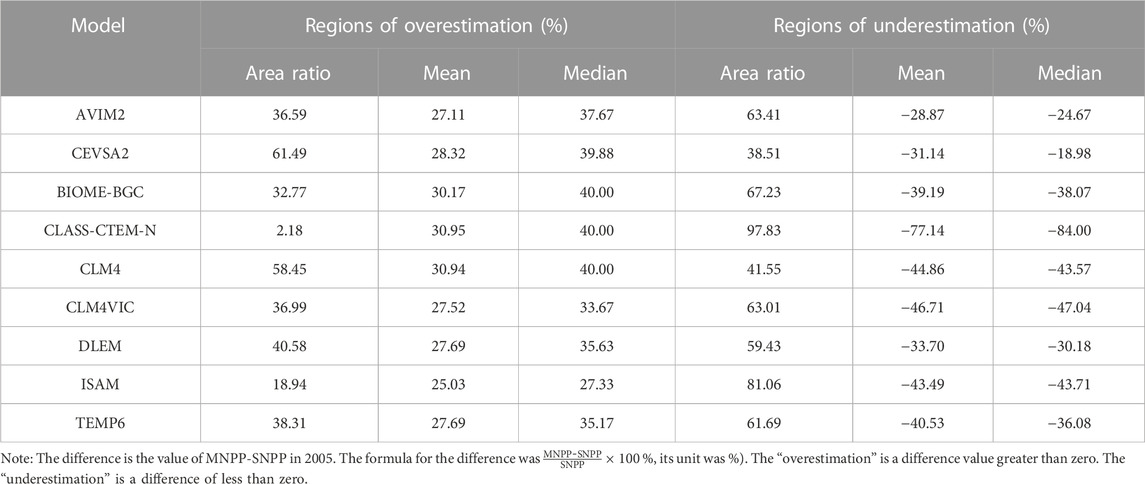
TABLE 3. Comparison of differences in NPP results from process models in 2005.
3.2 A static analysis on the LERFM performance in cropland NPP
We used the model constructed by the method described in Section 2 to simulated and estimate the NPP of cropland in China in 2005, and compared the effectiveness of the results. Here, using the SNPP value as a target constraint value, we employed the SD, RMSD, and r values of the classical Taylor diagram method to validate the LERFM model by analyzing the three important metrics of the 12 model MNPPs (Figure 5; Table 4). The Taylor statistical results in Figure 5 and Table 4 show that the LERFM exhibited the best NPP simulation performance among the 12 models. Compared with the SNPP, the LERFM had a smaller SD (3.08 g C m−2). Meanwhile, among 12 models, the LERFM model had the smallest RMSD (2.00 g C m−2) and the highest r values (0.58) of the MNPP for cropland. Furthermore, in Figure 6, we compared the probability distributions of LERFM NPP and SNPP, and the results show that they have highly similar peak-to-peak and valley-to-valley probability distributions. The LERFM NPP was only 0.36% lower than the SNPP at the national scale. This important statistical information further suggests that LERFM is the best model. Notably, the 2nd best model in Figure 5 and Table 4 is the MMEM, which suggests that its performance in NPP is not optimal.
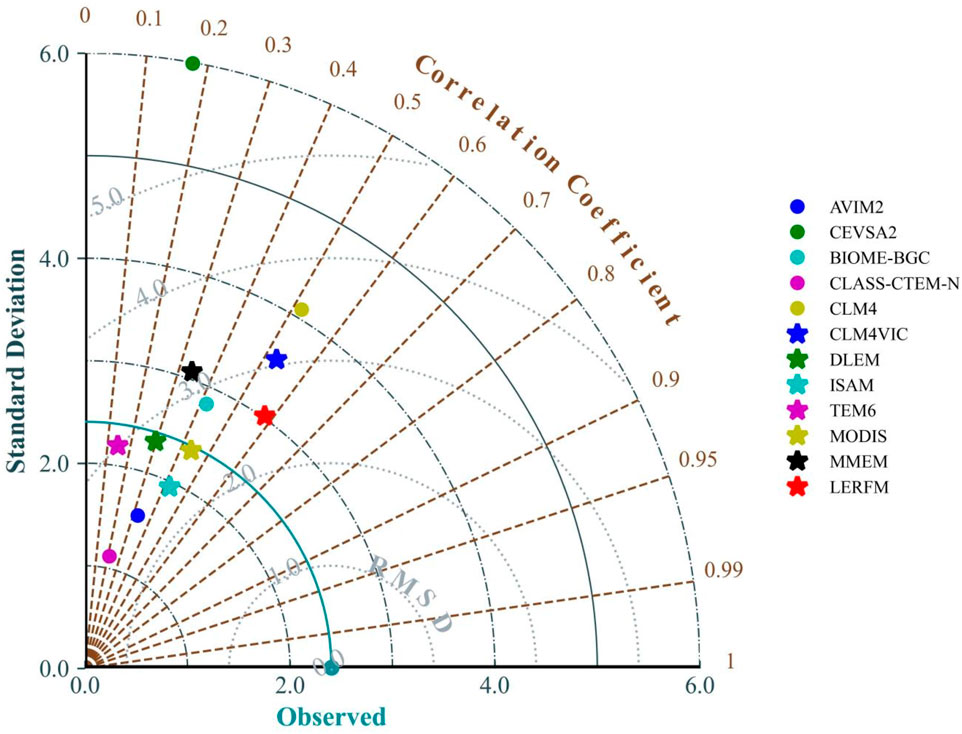
FIGURE 5. Taylor diagram of the crop NPP validation (MNPPs versus SNPP data) across China in 2005. The ‘Observed’ is SNPP value.MODIS NPP from http://ftp.ntsg.umt.edu/.autofs/MODIS/Mirror/MOD17_Science_2010/ (last accessed 14 January 2014) is also used to compare and validate the LEFRM model.
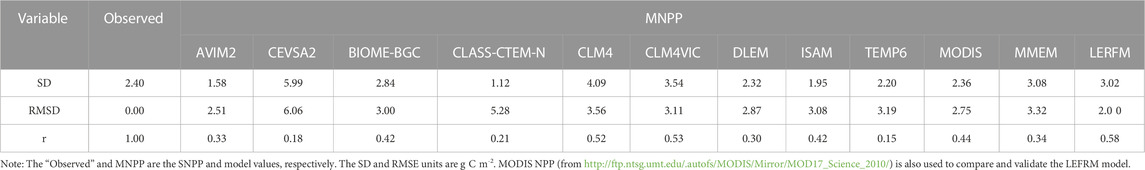
TABLE 4. Comparisons of the important metrics of Taylor diagram for multimodel results in 2005.
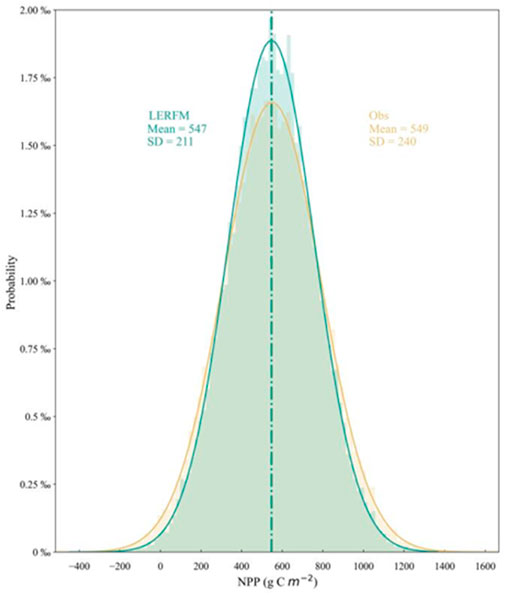
FIGURE 6. Probability distribution of LERFM NPP (dark-green color) and SNPP (“Obs,” orange color) in 2005. A positive or negative value represents only the probability of deviation from the NPP mean value.SD is the standard deviation. The units are g C m−2. The number of bins was set to 100.
Compared to the other results, Table 5 shows that LERFM NPP had 95% confidence interval (550.8 ± 52.3 g C m−2), which is close to the average of these results. These results suggest that the LERFM model exhibits strong simulation performance in estimating cropland NPP across China. For example, ignoring the synchrony of time, the LERFM NPP (547 g C m−2) in 2005 is only −0.69% less than the average value (550.8 g C m−2) of the other results in Table 5. And during 1982–2010 the LERFM NPP was only 4.3% less than that in Table 5. The LERFM model can integrate multiple data sources to improve the accuracy of NPP estimates compared with traditional statistical or process-based models. In summary, the LERFM can better simulate the NPP of cropland ecosystems in China.
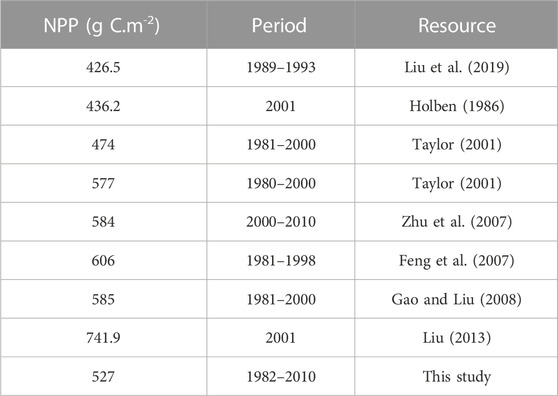
TABLE 5. Comparisons of cropland NPP in China.
3.3 A spatial and temporal dynamic analysis on performance of the LERFM NPP
To test the simulation performance of the LERFM in national-scale NPP estimation, both the LERFM and MMEM were used to separately re-estimate the Chinese cropland NPP from 1982 to 2010. Compared to the spatial distribution of the SNPP (see Figure 7), the regional average values for the LERFM and MMEM MNPP were 547 and 464 g C m−2, respectively, which were slightly 0.36% and 15.48% lower than the SNPP. Interestingly, the LERFM resulted in an underestimation of −5%, covering 58.61% of the total crop cover area, with only an overestimation of 14.65% for the remaining crop cover area. However, for the MMEM model, 26.11% overestimation and −30.91% underestimation covered 33.98% and 66.02% of the total crop cover area, respectively. The results also suggest that the spatial performance of the LERFM was better than that of the MMEM.
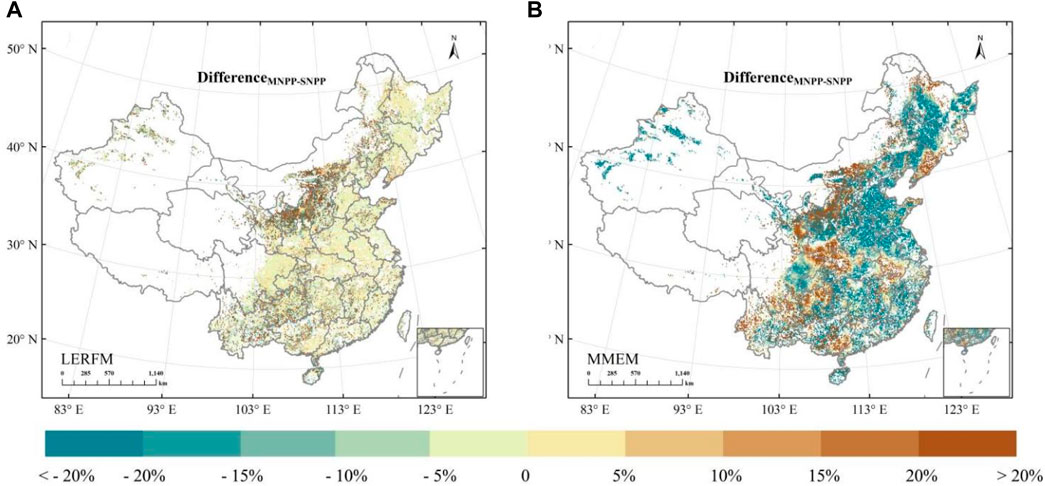
FIGURE 7. Spatial distribution of differences between LERFM (A) [or MMEM (B)] NPP and SNPP in 2005. The formula is
By comparing the annual variation trend of NPP simulated by the two models (see Figures 8, 9), we tested the performance of the annual change in LERFM NPP. Figure 8 shows that during 1982–2010 the annual average (Figure 8A) and maximum (Figure 8B) regional LERFM NPP values increased, whereas the minimum value decreased (Figure 8C). These three NPP trends were consistent with those of the MMEM. However, for the MMEM, the average value also showed an insignificant increasing trend. This indicates that the annual variation trends of the LERFM and MMEM NPP were consistent, meaning that the LERFM model performed better in simulating the annual variation trend of cropland NPP.
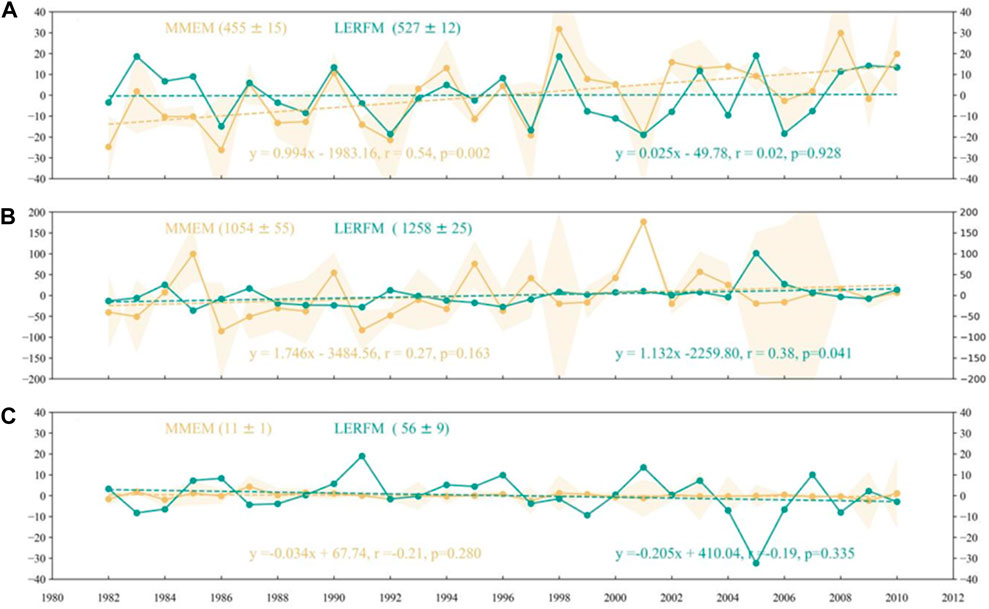
FIGURE 8. Annual variations in the national average (A), maximum (B), and minimum (C) NPP values simulated by the LERFM (red) and MMEM (blue) model during 1982–2010.The units are g C m−2. The shaded yellow line represents 95% confidence interval. This is based on calculations using multiple-process-based model results.
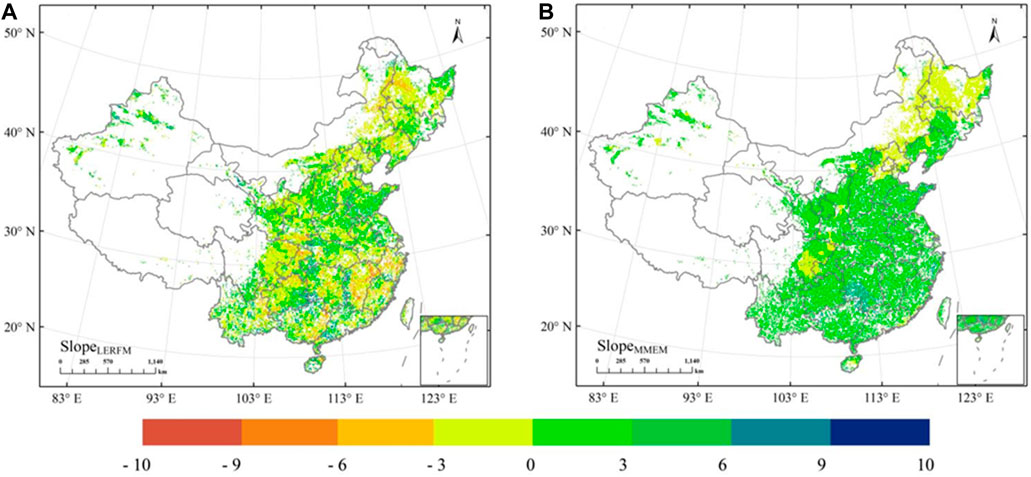
FIGURE 9. The spatial changes of slope in LERFM (A) and MMEM (B) NPP during 1982–2010.The units are g C m−2 y−1.
We further tested the consistency of the annual variation trends of the two NPPs on a grid-to-grid basis (Figure 9). The statistical results in Figure 9 show that the area-weighted average slopes of the LERFM and MMEM NPP were both greater than zero (0.085 and 0.498 g C m−2 y−1, respectively), indicating that the annual variation trends of LERFM and MMEM NPP in China were consistent.
We also investigated total NPP in China (see Figure 10). Figure 10A shows that the annual variation of the total NPP from LERFM and MMEM both showed a decreasing trend during 1982–2010, with slopes of −1.72 and −0.22 Tg C.a−1, respectively. Additionally, the year-to-year changes in the total NPP were consistent, and the two NPP showed a significant positive correlation (r = 0.795, p < 0.001). This indicates that the LERFM can better simulate the annual variation characteristics of the total NPP. Figure 10B also compares the total LERFM and MMEM NPP for the year 2005. Compared with the total amount of SNPP (572.49 Tg C), LERFM underestimates by only −0.37%, while MMEM underestimates by −15.46%. Furthermore, the multi-year average total LERFM NPP (576.57 ± 26.04 Tg C.a−1) was higher than that of MMEM (497.48 ± 20.98 Tg C.a−1), proving that MMEM greatly underestimated the total cropland NPP. The information mentioned above suggests that the LERFM can better estimate total cropland NPP.
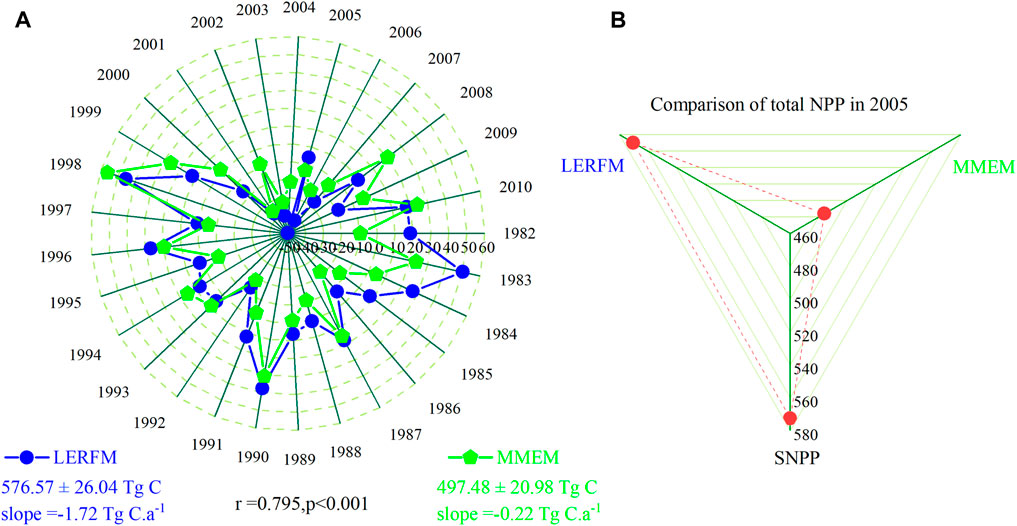
FIGURE 10. Annual variations in total NPP simulated by LERFM and MMEM. “576.57 ± 26.04” represents “the multi-year average ± standard deviation”. “r” represents the correlation coefficient between LERFM and MMEM NPP. “slope” represents the annual trend of LERFM (or MMEM) NPP during 1982–2010. SNPP is the statistic-based NPP.
4 Discussion
4.1 Possible causes of discrepancies among multimodel estimations in the cropland NPP
Discrepancies among the NPPs from the multi-model caused more difficulty in the accurate assessment of the cropland NPP. Therefore, we further discuss the possible causes of discrepancies in the multi-model simulation results. Figures 3, 4; Tables 3, 4 show large differences between cropland NPPs from the multi-model simulation. There are several main causes for this phenomenon. First, a process-based model driven by different input data yields different simulation results. For example, the AVIM2 (Ji et al., 2008) and CEVSA2 (Gu et al., 2010) models were driven by observational data from Chinese meteorological stations, whereas the process-based models from the MsTMIP were driven by the CRU-NCEP datasets (Huntzinger et al., 2013), and their NPPs showed large discrepancies. Although the AVIM2 and CEVSA2 models are driven by the same set of weather-driven data, spatiotemporal differences still exist in the NPPs. Discrepancies among the NPPs from the CRU-NCEP data-driven MsTMIP models further demonstrate that the difference in the input data is not the root cause of these discrepancies (Wang et al., 2023). From the perspective of the development framework structure of the model (ONeill and Melnikov, 2008; Reyer et al., 2016; Bonan et al., 2019; Shi et al., 2018; Arora et al., 2023), discrepancies in NPPs are mainly caused by differences in the carbon component calculation modules and the parametric scheme of these process-based models (Tao et al., 2003; Wang, 2004; Huang, 2006; Briley et al., 2017; Bonan et al., 2019). For instance, there are significant structural differences between AVIM2 and CEVSA2 as well as structural differences between the MsTMIP models (Bonan et al., 2019; Wang et al., 2023). Third, the downscaling post-processing of the output data also causes some differences (Wang et al., 2023; Bhunia et al., 2018) in the NPPs. The raw MsTMIP output with a spatial resolution of 0.5° was interpolated to a grid surface of 0.1° using bilinear interpolation, which caused an abnormal NPP value on the fine grid to a certain extent. Simultaneously, the accuracy of the output data is affected by the use of different validation data to calibrate the process-based model. For example, AVIM2 and CEVSA2 used a large amount of survey data from China to optimize the model; however, the MsTMIP models lacked more detailed validation data in China to calibrate the model, which caused cropland NPP discrepancies with AVIM2 and CEVSA2. In summary, discrepancies between the multi-model estimation results are inevitable. However, these discrepancies do not imply that they were useless. Information from multiple models can help to improve the accuracy of estimating the carbon composition of terrestrial ecosystems.
4.2 Favorable conditions for the LERFM model with strong simulation performance in cropland NPP
We make full use of the useful prior information from different models. For example, compared to the SNPP, Figures 2, 3 also show that although the NPPs from different models are different, the results of these models are closer to the SNPP, indicating that they have more useful prior information. In addition, the LERFM method that we used can better explore the relationship between the models, and their useful information is highly concentrated (Liu et al., 2022b). These were subsequently used to train the model. Notably, the process of training the model belongs to supervised learning mode, which effectively reduces the estimation loss of the model. For example, the spatial information of the NDVI of cropland vegetation growth was used to optimize the spatial simulation capability and improve the forecast accuracy of the model. It helps refine the assumptions of the model by providing valuable information on vegetation productivity patterns and dynamics and calibrates the learning ensemble model to improve the accuracy of model estimates of NPP. For example, in terms of the spatial distribution of the differences from the SNPP, Figure 7 shows that the LERFM NPP exhibits a more detailed display of smaller differences from the SNPP, whereas the MMEM NPP exhibits larger differences. Simultaneously, additional inventory statistics were used to calibrate the model and improve its accuracy. The LERFM benefits from these favorable conditions, resulting in strong simulation performance in simulating cropland NPP over China. In Figure 5, LERFM NPP has the smallest RMSE, largest r value, and smallest spatial differences from SNPP in Figure 7A, which confirms that using high-spatial-resolution NDVI and more detailed ground survey data can improve the simulation accuracy of cropland NPP.
4.3 Advances and limitations
Combining remote sensing observations and process-based model data to drive a learning ensemble model provides a good technique for near-realistic estimations of terrestrial ecosystem carbon components. For example, LERFM provides a very low underestimation of cropland NPP. As Earth observation technology continues to improve, increasing amounts of high-resolution data (such as NDVI, soil-adjusted vegetation index (SAVI), vegetation optical depth (VOD), canopy aggregation index, and hyperspectral data) are available to monitor crop growth from various perspectives over longer periods. These data provide accurate and timely information on crop growth. NDVI data can also be used to guide management decisions aimed at improving the NPP. By identifying areas with low vegetation productivity, NDVI data can help target interventions that promote ecosystem health and productivity (Lobell et al., 2002; Zhang et al., 2015) such as fertilization, water management, and restoration. In particular, high spatial resolution remote sensing data provide real physical constraints, further improving the accuracy of model estimation. Furthermore, this study not only helps to better understand the strengths and weaknesses of different model approaches, but has also been used to estimate carbon stock and vegetation carbon density on a national or global scale (Reichstein et al., 2019; Wang et al., 2023). In the future, more sophisticated process models and advanced machine learning methods will be available to deepen our understanding of crops and improve carbon measurements in cropland ecosystems.
Notably, the LERFM has a significant ability to estimate annual NPP trends. The average, maximum, and minimum NPP values of the LERFM and MMEM in Figure 8 showed consistent trends, but there were some differences in their annual trends. For example, compared to the annual NPP change rate of the MMEM, the LERFM had a relatively low NPP increase rate. Furthermore, the LERFM NPP model characterized the spatial heterogeneity of annual NPP trends more accurately. For example, the Eastern China region in Figure 9A shows a decreasing NPP trend, which is opposite to the annual NPP trend of the MMEM in Figure 9B. As mentioned above, the LERFM model method proposed in this study not only helps to increase the accuracy of cropland NPP estimation but also provides a new technology for reducing the uncertainty of multi-model estimation of cropland NPP. However, these subtle differences are related to the high spatial resolution NDVI-driven LERFM model. However, the lack of a long-term continuous inventory of cropland NPPs introduces uncertainty into the time series of NPPs simulated using the LERFM. This uncertainty may be due to possible convergence phenomena in the LERFM or the process-based model itself, which could result in anomalies in the NPP trend over longer timescales. This potential anomaly has not yet been addressed, and, if it exists, future trends in carbon sinks in terrestrial ecosystems may be underestimated.
However, in large-scale high-spatial-resolution simulation tasks, it is easy to cause the random forest model to have too many classification decision trees, which can lead to overfitting of the learning model.Overfitting is an important issue in machine learning. It usually occurs when a model performs too well on training data and thus performs worse on testing data. This is mainly because the model is too complex and “memorizes” the training data instead of “learning” from it, resulting in poor performance on new, unseen data. To solve the overfitting problem, multiple methods should be considered, including increasing training data, data preprocessing, simplifying the model, regularization, early stopping, dropout, and ensemble methods. Random Forest is an ensemble method that combines multiple decision trees to improve prediction performance. Besides, we did not further consider the uncertainty of simulation results caused by uneven spatial sample distribution, which may cause instability in the simulation results. This is also an important issue facing current unbalanced small-sample spatial simulation.
5 Conclusion
Accurate estimation of cropland NPP remains a significant challenge. We hypothesized that incorporating prior NPP information simulated by a process-based model into NDVI data would improve the accuracy of cropland ecosystem NPP estimation. To test this assumption, we built an integrated machine learning model using NDVI, MNPP simulated by nine process models, and SNPP data estimated using yield statistics to estimate China’s cropland NPP from 1982 to 2010. The MNPPs of the nine models showed a large discrepancy compared with the SNPP, indicating that different estimation models produce greater uncertainty. However, after testing, the LERFM model underestimated NPP by only −0.37%, while the average of the nine models underestimated by −15.46%. The LERFM also had the highest simulation skill score, demonstrating its effectiveness in improving the accuracy of cropland NPP estimation. Additionally, the annual change trend of the LERFM NPP increase was more consistent with the MMEM NPP trend, and there was a significant positive correlation between the total NPP (r = 0.795, p < 0.001), indicating that the LERFM could better describe the spatiotemporal dynamic change process of cropland NPP. These results demonstrate that a prior information-driven integrated machine learning model combining NDVI and process model simulation results can effectively improve the accuracy of cropland NPP estimation, leading to improved cropland carbon measurement and management.
Data availability statement
The original contributions presented in the study are included in the article/Supplementary Material, further inquiries can be directed to the corresponding author.
Author contributions
ZW: Conceptualization, Data curation, Formal Analysis, Funding acquisition, Methodology, Project administration, Resources, Software, Validation, Visualization, Writing–original draft, Writing–review and editing. ZL: Data curation, Formal Analysis, Investigation, Methodology, Writing–review and editing. MH: Conceptualization, Funding acquisition, Project administration, Supervision, Writing–review and editing.
Funding
The author(s) declare financial support was received for the research, authorship, and/or publication of this article. This research was supported by these Research programs on the flora of Yunnan Province, the Sustainable Utilization of Vegetation Resources in Yunnan, and National Natural Science Foundation of China (41971218). The APC was funded by MH.
Conflict of interest
The authors declare that the research was conducted in the absence of any commercial or financial relationships that could be construed as a potential conflict of interest.
Publisher’s note
All claims expressed in this article are solely those of the authors and do not necessarily represent those of their affiliated organizations, or those of the publisher, the editors and the reviewers. Any product that may be evaluated in this article, or claim that may be made by its manufacturer, is not guaranteed or endorsed by the publisher.
Supplementary material
The Supplementary Material for this article can be found online at: https://www.frontiersin.org/articles/10.3389/fenvs.2023.1304400/full#supplementary-material
References
Ardabili, S., Mosavi, A., Dehghani, M., Varkonyi-Koczy, A. R., and Obuda, U. (2019). “Deep learning and machine learning in hydrological processes climate change and Earth systems a systematic review,” in 18th international conference on global research and education inter-academia (HUNGARY: Obuda Univ), 52–62. doi:10.1007/978-3-030-36841-8_5
Arellano-Garcia, M. E., Camacho-Gutierrez, J. A., and Solorza-Calderon, S. (2021). Machine learning approach for higher-order interactions detection to ecological communities management. Appl. Math. Comput. 411, 126499. doi:10.1016/j.amc.2021.126499
Arora, V. K., Seiler, C., Wang, L., and Kou-Giesbrecht, S. (2023). Towards an ensemble-based evaluation of land surface models in light of uncertain forcings and observations. Biogeosciences 20 (7), 1313–1355. doi:10.5194/bg-20-1313-2023
Bhunia, G. S., Shit, P. K., and Maiti, R. (2018). Comparison of GIS-based interpolation methods for spatial distribution of soil organic carbon (SOC). J. Saudi Soc. Agric. Sci. 17 (2), 114–126. doi:10.1016/j.jssas.2016.02.001
Bonan, G. B., Lombardozzi, D. L., Wieder, W. R., Oleson, K. W., Lawrence, D. M., Hoffman, F. M., et al. (2019). Model structure and climate data uncertainty in historical simulations of the terrestrial carbon cycle (1850–2014). Glob. Biogeochem. Cycles 33 (10), 1310–1326. doi:10.1029/2019GB006175
Briley, L. J., Ashley, W. S., Rood, R. B., and Krmenec, A. (2017). The role of meteorological processes in the description of uncertainty for climate change decision-making. Theor. Appl. Climatol. 127 (3), 643–654. doi:10.1007/s00704-015-1652-2
Cheong, S. M., Sankaran, K., and Bastani, H. (2022). Artificial intelligence for climate change adaptation. Wiley Interdiscip. Reviews-Data Min. Knowl. Discov. 12 (5). doi:10.1002/widm.1459
Damgaard, C. (2021). Integrating hierarchical statistical models and machine-learning algorithms for ground-truthing drone images of the vegetation: taxonomy, abundance and population ecological models. Remote Sens. (Basel) 13 (6), 1161. doi:10.3390/rs13061161
Fan, J. T., Huang, G., Shi, Y., Jiang, J., and Feng, C. (2021). Prediction of chemical reproductive toxicity to aquatic species using a machine learning model: an application in an ecological risk assessment of the Yangtze River, China. Sci. Total Environ. 796, 148901. doi:10.1016/j.scitotenv.2021.148901
Feng, X., Liu, G., Chen, J., Chen, M., Liu, J., Ju, W., et al. (2007). Net primary productivity of China’s terrestrial ecosystems from a process model driven by remote sensing. J. Environ. Manage 85 (3), 563–573. doi:10.1016/j.jenvman.2006.09.021
Fer, I., Gardella, A. K., Shiklomanov, A. N., Campbell, E. E., Cowdery, E. M., De Kauwe, M. G., et al. (2021). Beyond ecosystem modeling: a roadmap to community cyberinfrastructure for ecological data-model integration. Glob. Chang. Biol. 27 (1), 13–26. doi:10.1111/gcb.15409
Frey, U. J. (2020). Putting machine learning to use in natural resource management improving model performance. Ecol. Soc. 25 (4), art45. doi:10.5751/es-12124-250445
Gao, Z. Q., and Liu, J. Y. (2008). Comparative study on net productivity of vegetation in China. Chin. Sci. Bull. 53 (3), 317–326. doi:10.1360/csb2008-53-3-317
Gray, J. M., Frolking, S., Kort, E. A., Ray, D. K., Kucharik, C. J., Ramankutty, N., et al. (2014). Direct human influence on atmospheric CO2 seasonality from increased cropland productivity. Nature 515 (7527), 398–401. doi:10.1038/nature13957
Gu, F. X., Zhang, Y., Tao, B., Wang, Q., Yu, G., Zhang, L., et al. (2010). Modeling the effects of nitrogen deposition on carbon budget in two temperate forests. Ecol. Complex. 7 (2), 139–148. doi:10.1016/j.ecocom.2010.04.002
Han, L., Yu, G., Chen, Z., Zhu, X., Zhang, W., Wang, T., et al. (2022). Spatiotemporal pattern of ecosystem respiration in China estimated by integration of machine learning with ecological understanding. Glob. Biogeochem. Cycles 36–11. doi:10.1029/2022gb007439
Holben, B. N. (1986). Characteristics of maximum-value composite images from temporal avhrr data. Int. J. Remote Sens. 7 (11), 1417–1434. doi:10.1080/01431168608948945
Huang, M., Ji, J. J., Li, K. R., Liu, Y. F., Yang, F. T., and Tao, B. (2007). The ecosystem carbon accumulation after conversion of grasslands to pine plantations in subtropical red soil of south China. Tellus Ser. B-Chemical Phys. Meteorology 59 (3), 439–448. doi:10.1111/j.1600-0889.2007.00280.x
Huang, M. (2006). Simulation of water and heat fluxes and carbon cycles in terrestrial ecosystems in China. Beijing: Institute of Geographic Sciences and Natural Resources Research, Chinese Academy of Sciences.
Huntzinger, D. N., Schwalm, C., Michalak, A. M., Schaefer, K., King, A. W., Wei, Y., et al. (2013). The North American carbon program multi-scale Synthesis and terrestrial model Intercomparison Project - Part 1: overview and experimental design. Geosci. Model Dev. 6 (6), 2121–2133. doi:10.5194/gmd-6-2121-2013
Ji, J. J., Huang, M., and Li, K. R. (2008). Prediction of carbon exchanges between China terrestrial ecosystem and atmosphere in 21st century. Sci. China Ser. D-Earth Sci. 51 (6), 885–898. doi:10.1007/s11430-008-0039-y
Jian, J. S., Du, X., Reiter, M. S., and Stewart, R. D. (2020). A meta-analysis of global cropland soil carbon changes due to cover cropping. Soil Biol. Biochem. 143, 107735. doi:10.1016/j.soilbio.2020.107735
Ladi, T., Jabalameli, S., and Sharifi, A. (2022). Applications of machine learning and deep learning methods for climate change mitigation and adaptation. Environ. Plan. B-Urban Anal. City Sci. 49 (4), 1314–1330. doi:10.1177/23998083221085281
Li, Z. P., Liu, S., Tan, Z., Bliss, N. B., Young, C. J., West, T. O., et al. (2014). Comparing cropland net primary production estimates from inventory, a satellite-based model, and a process-based model in the Midwest of the United States. Ecol. Modell. 277, 1–12. doi:10.1016/j.ecolmodel.2014.01.012
Li, L. Y., Zeng, Z. Z., Zhang, G., Duan, K., Liu, B. J., and Cai, X. T. (2022). Exploring the individualized effect of climatic drivers on MODIS net primary productivity through an explainable machine learning framework. Remote Sens. (Basel) 14, 4401–4417. doi:10.3390/rs14174401
Liu, Z., Wu, C., Peng, D., Wang, S., Gonsamo, A., Fang, B., et al. (2017). Improved modeling of gross primary production from a better representation of photosynthetic components in vegetation canopy. Agric For Meteorol 233, 222–234. doi:10.1016/j.agrformet.2016.12.001
Liu, Y. W., Piao, S., Gasser, T., Ciais, P., Yang, H., Wang, H., et al. (2019). Field-experiment constraints on the enhancement of the terrestrial carbon sink by CO(2)fertilization. Nat. Geosci. 12 (10), 809–814. doi:10.1038/s41561-019-0436-1
Liu, X., Xu, Y. Y., Sun, S. K., Zhao, X. N., Wu, P. T., and Wang, Y. B. (2022a). What is the potential to improve food security by restructuring crops in Northwest China? J. Clean. Prod. 378, 134620. doi:10.1016/j.jclepro.2022.134620
Liu, Y. H., Han, X. Z., Weng, F. Z., Xu, Y. M., Zhang, Y. P., and Tang, S. A. (2022b). Estimation of terrestrial net primary productivity in China from fengyun-3D satellite data. J. Meteorological Res. 36 (3), 401–416. doi:10.1007/s13351-022-1183-6
Liu, Y. B. (2013). The spatial and temporal variations of water use efficiency in China’s terrestrial ecosystems simulated using remote sensing and a process-based model. Nanjing: Nanjing University.
Lobell, D. B., Hicke, J. A., Asner, G. P., Field, C. B., Tucker, C. J., and Los, S. O. (2002). Satellite estimates of productivity and light use efficiency in United States agriculture, 1982-98. Glob. Chang. Biol. 8 (8), 722–735. doi:10.1046/j.1365-2486.2002.00503.x
Maestrini, B., Mimić, G., van Oort, P. A., Jindo, K., Brdar, S., Athanasiadis, I. N., et al. (2022). Mixing process-based and data-driven approaches in yield prediction. Eur. J. Agron. 139, 126569. doi:10.1016/j.eja.2022.126569
Medkova, H., Vackar, D., and Weinzettel, J. (2017). Appropriation of potential net primary production by cropland in terrestrial ecoregions. J. Clean. Prod. 150, 294–300. doi:10.1016/j.jclepro.2017.03.002
Medlyn, B. E., Zaehle, S., De Kauwe, M. G., Walker, A. P., Dietze, M. C., Hanson, P. J., et al. (2015). Using ecosystem experiments to improve vegetation models. Nat. Clim. Change 5 (6), 528–534. doi:10.1038/nclimate2621
ONeill, B. C., and Melnikov, N. B. (2008). Learning about parameter and structural uncertainty in carbon cycle models. Clim. Change 89 (1), 23–44. doi:10.1007/s10584-008-9404-2
Pan, S., Tian, H., Lu, C., Dangal, S. R. S., and Liu, M. (2015). Net primary production of major plant functional types in China: vegetation classification and ecosystem simulation. Acta Ecol. Sin. 35 (2), 28–36. doi:10.1016/j.chnaes.2015.03.001
Pan, S. F., Pan, N., Tian, H., Friedlingstein, P., Sitch, S., Shi, H., et al. (2020). Evaluation of global terrestrial evapotranspiration using state-of-the-art approaches in remote sensing, machine learning and land surface modeling. Hydrol. Earth Syst. Sci. 24 (3), 1485–1509. doi:10.5194/hess-24-1485-2020
Peng, M. M., Han, W. T., Li, C. Q., Yao, X. M., and Shao, G. M. (2022). Modeling the daytime net primary productivity of maize at the canopy scale based on UAV multispectral imagery and machine learning. J. Clean. Prod. 367, 133041. doi:10.1016/j.jclepro.2022.133041
Phang, W. K., Hamid, M. H. b. A., Jelip, J., Mudin, R. N. b., Chuang, T. W., Lau, Y. L., et al. (2023). Corrigendum: predicting Plasmodium knowlesi transmission risk across Peninsular Malaysia using machine learning-based ecological niche modeling approaches. Front. Microbiol. 14, 1126418. doi:10.3389/fmicb.2023.1178864
Piao, S., He, Y., Wang, X., and Chen, F. (2022). Estimation of China’s terrestrial ecosystem carbon sink: methods, progress and prospects. Sci. China Earth Sci. 65 (4), 641–651. doi:10.1007/s11430-021-9892-6
Pravalie, R., Niculiță, M., Roșca, B., Marin, G., Dumitrașcu, M., Patriche, C., et al. (2023). Machine learning-based prediction and assessment of recent dynamics of forest net primary productivity in Romania. J. Environ. Manage 334, 117513. doi:10.1016/j.jenvman.2023.117513
Reichstein, M., Camps-Valls, G., Stevens, B., Jung, M., Denzler, J., Carvalhais, N., et al. (2019). Deep learning and process understanding for data-driven Earth system science. Nature 566 (7743), 195–204. doi:10.1038/s41586-019-0912-1
Reyer, C. P. O., Flechsig, M., Lasch-Born, P., and van Oijen, M. (2016). Integrating parameter uncertainty of a process-based model in assessments of climate change effects on forest productivity. Clim. Change 137 (3), 395–409. doi:10.1007/s10584-016-1694-1
Rodigheri, G., Fontana, D. C., Schaparini, L. P., Dalmago, G. A., and Schirmbeck, J. (2020). “Net primary productivity and dry matter in soybean cultivation utilizing datas of ndvi multi-sensors,” in IEEE Latin American GRSS and ISPRS Remote Sensing Conference, Santiago, Chile, 22-26 March 2020, 115–120.
Schlund, M., Eyring, V., Camps-Valls, G., Friedlingstein, P., Gentine, P., and Reichstein, M. (2020). Constraining uncertainty in projected gross primary production with machine learning. J. Geophys. Research-Biogeosciences 125–11. doi:10.1029/2019jg005619
Schwalm, C. R., Huntzinger, D. N., Michalak, A. M., Schaefer, K., Fisher, J. B., Fang, Y., et al. (2020). Modeling suggests fossil fuel emissions have been driving increased land carbon uptake since the turn of the 20th Century. Sci. Rep. 10 (1), 9059. doi:10.1038/s41598-020-66103-9
She, W., Wu, Y., Huang, H., Chen, Z., Cui, G., Zheng, H., et al. (2017). Integrative analysis of carbon structure and carbon sink function for major crop production in China’s typical agriculture regions. J. Clean. Prod. 162, 702–708. doi:10.1016/j.jclepro.2017.05.108
Shi, Z., Crowell, S., Luo, Y., and Moore, B. (2018). Model structures amplify uncertainty in predicted soil carbon responses to climate change. Nat. Commun. 9 (1), 2171. doi:10.1038/s41467-018-04526-9
Shu-Shi, P., Chao, Y. U. E., and Jin-Feng, C. (2020). Developments and applications of terrestrial biosphere model. Chin. J. Plant Ecol. 44 (4), 436–448. doi:10.17521/cjpe.2019.0315
Stocker, T. F., Qin, D., Plattner, G. K., Tignor, M. M. B., Allen, S. K., Xia, Y., et al. (2013). “Climate change 2013: the physical science basis,” in Contribution of Working Group I to the Fifth Assessment Report of the Intergovernmental Panel on Climate Change.
Tang, H. Y., Liu, Y., Li, X. M., Muhammad, A., and Huang, G. Q. (2019). Carbon sequestration of cropland and paddy soils in China: potential, driving factors, and mechanisms. Greenh. Gases-Science Technol. 9 (5), 872–885. doi:10.1002/ghg.1901
Tao, B., Li, K. R., Shao, X. M., and Cao, M. K. (2003). Temporal and spatial pattern of net primary production of terrestrial ecosystems in China. Acta Geogr. Sin. 58 (3), 372–380. doi:10.11821/xb200303006
Tao, F. L., Yokozawa, M., Zhang, Z., Xu, Y. L., and Hayashi, Y. (2005). Remote sensing of crop production in China by production efficiency models: models comparisons, estimates and uncertainties. Ecol. Modell. 183 (4), 385–396. doi:10.1016/j.ecolmodel.2004.08.023
Tao, F. L., Palosuo, T., Valkama, E., and Makipaa, R. (2019). Cropland soils in China have a large potential for carbon sequestration based on literature survey. Soil Tillage Res. 186, 70–78. doi:10.1016/j.still.2018.10.009
Taylor, K. E. (2001). Summarizing multiple aspects of model performance in a single diagram. J. Geophys. Research-Atmospheres 106 (D7), 7183–7192. doi:10.1029/2000jd900719
Tuia, D., Kellenberger, B., Beery, S., Costelloe, B. R., Zuffi, S., Risse, B., et al. (2022). Perspectives in machine learning for wildlife conservation. Nat. Commun. 13 (1), 792. doi:10.1038/s41467-022-27980-y
Wang, X. G., Wu, F., and Liu, T. (2021). Modeling of the ecological economic activity based on machine learning. J. Intelligent Fuzzy Syst. 40 (2), 2755–2766. doi:10.3233/jifs-189317
Wang, Z. S., Gong, H., Huang, M., Gu, F., Wei, J., Guo, Q., et al. (2023). A multimodel random forest ensemble method for an improved assessment of Chinese terrestrial vegetation carbon density. Methods Ecol. Evol. 14 (1), 117–132. doi:10.1111/2041-210x.13729
Wang, J. B. (2004). Chinese terrestrial net ecosytem productive model applied remote sensing data. Hangzhou: Zhejiang University.
Whytock, R. C., Świeżewski, J., Zwerts, J. A., Bara-Słupski, T., Koumba Pambo, A. F., Rogala, M., et al. (2021). Robust ecological analysis of camera trap data labelled by a machine learning model. Methods Ecol. Evol. 12 (6), 1080–1092. doi:10.1111/2041-210x.13576
Xi, H. Y., Feng, Q., Cheng, W. J., Si, J. H., and Yu, T. F. (2022). Spatiotemporal variations of Alxa national public welfare forest net primary productivity in northwest China and the response to climate change. Ecohydrology 15 (8). doi:10.1002/eco.2377
Xu, M., Hu, C., Najjar, R. G., Herrmann, M., Briceno, H., Barnes, B. B., et al. (2022). Estimating estuarine primary production using satellite data and machine learning. Int. J. Appl. Earth Observation Geoinformation 110, 102821. doi:10.1016/j.jag.2022.102821
Xue, P., Liu, H. Y., Zhang, M. Y., Gong, H. B., and Cao, L. (2022). Nonlinear characteristics of NPP based on ensemble empirical mode decomposition from 1982 to 2015-A case study of six coastal provinces in southeast China. Remote Sens. (Basel) 14 (1), 15. doi:10.3390/rs14010015
Yan, H. M., Cao, M. K., Liu, J. Y., and Tao, B. (2007). Potential and sustainability for carbon sequestration with improved soil management in agricultural soils of China. Agric. Ecosyst. Environ. 121 (4), 325–335. doi:10.1016/j.agee.2006.11.008
Yan, W. B., He, Y. L., Cai, Y., Qu, X. X., and Cui, X. L. (2021). Relationship between extreme climate indices and spatiotemporal changes of vegetation on Yunnan Plateau from 1982 to 2019. Glob. Ecol. Conserv. 31, e01813. doi:10.1016/j.gecco.2021.e01813
Yi, Z. Q., and Wu, L. H. (2023). Identification of factors influencing net primary productivity of terrestrial ecosystems based on interpretable machine learning --evidence from the county-level administrative districts in China. J. Environ. Manage 326, 116798. doi:10.1016/j.jenvman.2022.116798
Yuan, W. P., Cai, W., Nguy-Robertson, A. L., Fang, H., Suyker, A. E., Chen, Y., et al. (2015). Uncertainty in simulating gross primary production of cropland ecosystem from satellite-based models. Agric For Meteorol 207, 48–57. doi:10.1016/j.agrformet.2015.03.016
Zhang, Q., Cheng, Y. B., Lyapustin, A. I., Wang, Y., Zhang, X., Suyker, A., et al. (2015). Estimation of crop gross primary production (GPP): II. Do scaled MODIS vegetation indices improve performance? Agric For Meteorol 200, 1–8. doi:10.1016/j.agrformet.2014.09.003
Zhang, L. L., Zhang, Z., Luo, Y. C., Cao, J., Xie, R. Z., and Li, S. K. (2021). Integrating satellite-derived climatic and vegetation indices to predict smallholder maize yield using deep learning. Agric For Meteorol 311, 108666. doi:10.1016/j.agrformet.2021.108666
Keywords: cropland NPP (net primary productivity), learning ensemble model, NDVI, process-based model, China
Citation: Wang Z, Liu Z and Huang M (2024) NDVI joint process-based models drive a learning ensemble model for accurately estimating cropland net primary productivity (NPP). Front. Environ. Sci. 11:1304400. doi: 10.3389/fenvs.2023.1304400
Received: 02 October 2023; Accepted: 18 December 2023;
Published: 15 January 2024.
Edited by:
Yiping Wu, Xi’an Jiaotong University, ChinaReviewed by:
Huiwen Li, Northwestern Polytechnical University, ChinaXiaotong Zhang, Beijing Normal University, China
Copyright © 2024 Wang, Liu and Huang. This is an open-access article distributed under the terms of the Creative Commons Attribution License (CC BY). The use, distribution or reproduction in other forums is permitted, provided the original author(s) and the copyright owner(s) are credited and that the original publication in this journal is cited, in accordance with accepted academic practice. No use, distribution or reproduction is permitted which does not comply with these terms.
*Correspondence: Mei Huang, aHVhbmdtQGlnc25yci5hYy5jbg==