 Muhammad Ahsan Mukhtar1,2,3
 Donghui Shangguan1,2,3*
 Yongjian Ding1,2,3
 Muhammad Naveed Anjum4
 Abhishek Banerjee1
 Asim Qayyum Butt1,2,3
 Nilesh yadav5
 Da Li1,2,3Qin Yang1,2,3Amjad Ali Khan1,2
 Ali Muhammad1,2,3
 Bei Bei He1,2,3
- 1State Key Laboratory of Cryospheric Science, Northwest Institute of Eco-Environment and Resources, Chinese Academy of Sciences, Lanzhou, China
- 2University of Chinese Academy of Sciences, Beijing, China
- 3China-Pakistan Joint Research Center on Earth Sciences, Chinese Academy of Sciences and Higher Education Commission of Pakistan, Islamabad, Pakistan
- 4Department of Land and Water Conservation Engineering, Pir Mehr Ali Shah Arid Agriculture University, Rawalpindi, Pakistan
- 5State Key Laboratory of Geographic Information Science (Ministry of Education), School of Geographic Sciences, East China Normal University, Shanghai, China
Floods are a widespread natural disaster with substantial economic implications and far-reaching consequences. In Northern Pakistan, the Hunza-Nagar valley faces vulnerability to floods, posing significant challenges to its sustainable development. This study aimed to evaluate flood risk in the region by employing a GIS-based Multi-Criteria Decision Analysis (MCDA) approach and big climate data records. By using a comprehensive flood risk assessment model, a flood hazard map was developed by considering nine influential factors: rainfall, regional temperature variation, distance to the river, elevation, slope, Normalized difference vegetation index (NDVI), Topographic wetness index (TWI), land use/land cover (LULC), curvature, and soil type. The analytical hierarchy process (AHP) analysis assigned weights to each factor and integrated with geospatial data using a GIS to generate flood risk maps, classifying hazard levels into five categories. The study assigned higher importance to rainfall, distance to the river, elevation, and slope compared to NDVI, TWI, LULC, curvature, and soil type. The weighted overlay flood risk map obtained from the reclassified maps of nine influencing factors identified 6% of the total area as very high, 36% as high, 41% as moderate, 16% as low, and 1% as very low flood risk. The accuracy of the flood risk model was demonstrated through the Receiver Operating Characteristics-Area Under the Curve (ROC-AUC) analysis, yielding a commendable prediction accuracy of 0.773. This MCDA approach offers an efficient and direct means of flood risk modeling, utilizing fundamental GIS data. The model serves as a valuable tool for decision-makers, enhancing flood risk awareness and providing vital insights for disaster management authorities in the Hunza-Nagar Valley. As future developments unfold, this study remains an indispensable resource for disaster preparedness and management in the Hunza-Nagar Valley region.
1 Introduction
Floods are an inherent component of the hydrological cycle, and their occurrence can lead to loss of life, population displacement, and environmental devastation, significantly jeopardizing economic progress (European Union, 2007). Certain human activities contribute to an elevated likelihood of flood events and their adverse consequences. Anthropogenic influences can diminish the natural retention and transformation capacities of basins (Fohrer et al., 2001; Wooldridge et al., 2001). Irresponsible and negligent actions within the basin frequently lead to a surge in economic losses. Consequently, we become susceptible to flooding risks, either willingly or due to societal demands for development. It is essential to recognize that complete protection against floods is unattainable. Therefore, adopting a comprehensive and integrated approach to flood protection becomes necessary (Plate, 2002; Werritty, 2006). When it comes to mitigating flood damage, the application of conventional flood protection measures remains crucial. However, equal emphasis should be placed on flood prevention and flood risk management, as their roles are progressively becoming more significant (Management, 2006; Apel et al., 2009).
Floods are one of the most destructive natural disasters on Earth, impacting around a billion people who live in areas that could flood (Di Baldassarre et al., 2013). Climate change projections indicate a significant increase in extreme hydrological events and flood risks in the future (Arnell and Gosling, 2016). Both industrialized and developing nations face growing concerns over natural hazards, with natural disasters accounting for 40% of global socioeconomic losses (Yahaya, 2008). Global warming alters rainfall patterns, leading to intensified and extreme rainfalls, and causing severe floods and extensive damage (Robert and Brown, 2004). These floods result in significant socioeconomic losses, loss of lives, and property destruction (Chen et al., 2015). During the summer monsoon season, South Asian countries experience significant impacts from floods, resulting in extensive devastation to both human lives and livelihoods. This region bears a higher burden of flood-related consequences compared to other parts of the world (Almazroui et al., 2020). Over the last 2 decades, flood events have impacted over 1 billion individuals in the South Asian region (EM-DAT - The International Disaster Database, 2023). The frequency of extreme floods is increasing in South Asian countries, and future projections suggest that these events are likely to occur even more frequently due to the warming climate (Hirabayashi et al., 2021). Over the past century, the average annual temperature in Pakistan has risen by 0.6°C in line with the global trend. Nonetheless, there was considerable variance in the pace and kind of change both temporally and spatially. The increase in temperature over northern Pakistan was greater than that over southern Pakistan (0.8°C vs. 0.6°C) (Khan et al., 2016). Climate change affects the northern areas of Pakistan by causing variations in stream flows, seasonal snowfall, and glacier ablation, all of which have an impact on the amount of water available downstream (Adnan et al., 2022).
Pakistan is a country that experiences considerable vulnerability to natural hazards (Ahmad et al., 2011). Pakistan faces various natural disasters, including floods, earthquakes, landslides, and droughts, making it vulnerable to such hazards. Among these, floods have become a significant and urgent concern, resulting in considerable damage to livelihoods and human life (Atta-ur-Rahman et al., 2011; Atta-ur-Rahman and Khan, 2011). The catastrophic flood that struck Pakistan in August 2022, preceded by a severe heat wave in May, has disproportionately affected the southern provinces of the country (Otto et al., 2023). Different scientific methods are used to predict flooding and its impacts, namely, hydrological models, monitoring river gauge data, satellite imagery and remote sensing technologies, information gathering on precipitation, river flow, soil moisture, and snowpack, reliable weather forecasts, and advanced meteorological models, can be used to predict the amount, intensity, and duration of rainfall or snowfall in a particular region these techniques can be used in flood prediction (Munawar et al., 2022). The massive flood impacted approximately one-third of the world’s fifth-largest populous country, leading to the internal displacement of around 32 million people and resulting in 1,486 fatalities, including 530 children (Region AJ and K, 2022). The flood-induced economic losses are projected to exceed $30 billion. Beyond the direct impacts, the widespread devastation of agricultural fields has raised concerns about famine, while the conditions in temporary shelters may give rise to potential disease outbreaks (Baqir et al., 2012; Sarkar, 2022). The causative factors behind the devastating flood in Pakistan in August 2022 remain a significant question for investigation. Various reasons have been identified as potential triggers for the flood event, including heavy rainfall, glacial melt contribution, and the development of an intense low-pressure system over the land area due to the summer heatwaves observed from May to June (Mukherjee et al., 2018; Hirabayashi et al., 2021). Furthermore, Pakistan ranks among the top 10 countries in the global climate risk index due to the climate deluges witnessed between 2000 and 2019. This underscores the country’s vulnerability to extreme events caused by climate variability (OECD, 2023).
The Hunza-Nagar Valley in Pakistan has a significant historical record of flood events, with widespread consequences for the region (KOONS, 2021). Located in the northern part of the country, the valley is susceptible to flooding during the summer monsoon season when intense rainfall occurs in the river catchments. The combination of melting snow from alpine regions and the monsoonal rains can lead to substantial floods, posing risks to human lives, infrastructure, and agricultural lands (Yaseen et al., 2022). Over the years, the valley has witnessed several devastating floods that have caused extensive destruction and forced communities to be displaced. Particularly, flash floods triggered by intense localized rainfall in hilly and semi-hilly areas have been extremely destructive, resulting in loss of lives and property damage (Awan, 2002). The unpredictability and severity of these floods highlight the urgency to implement effective flood risk management and mitigation strategies to protect the valley’s population and infrastructure. Hunza Valley experiences the largest variations in relative humidity between 59% in March and 91% in August, while the lowest variations occur between 23% in March and 52% in December, based on data recorded between 1998 and 2012. Large amounts of solar radiation (5,148 W/m2) are received by the basin in May, whereas small amounts (2563 W/m2) are received in December (M. Adnan et al., 2022).
Flood risk, also known as susceptibility, is the probability that a certain location may be impacted by a flood event. Conversely, flood vulnerability evaluates the possible degree of destruction and adverse outcomes that could occur following a flood. This assessment takes into account a number of variables, including the likelihood of flooding, the susceptibility of populations and infrastructure to flooding, and the possible effects on the environment, the economy, and society (Valjarević et al., 2022). Flood risk is a comprehensive evaluation of the potential for loss and damage due to flooding and goes beyond simple vulnerability. It considers hydrodynamic, ecological, social, economic, and physio-climatic variables (Quagliolo et al., 2021). Combining hazard and vulnerability assessments, either by adding or multiplying their respective numbers, is a common method of evaluating flood risk (Rinc et al., 2018). Analyzing flood risk can be a complex and challenging task, mainly due to limitations in data availability. To overcome these challenges, numerical modeling and index-based analyses have gained popularity as effective alternatives for flood risk assessments. These approaches facilitate the development and implementation of disaster mitigation strategies (Hapciuc et al., 2016).
Flood risk maps play a crucial role in urban planning for future development, helping to identify vulnerable areas at risk of flooding (Awan, 2002). Creating these maps involves considering multiple criteria factors and their spatial correlation (Minea, 2013; Lin et al., 2020). Three primary approaches are commonly used for mapping flood-prone areas (Teng et al., 2017). Physical modeling involves experiments to validate predictive models, while numeric models like Delft3D simulate flooding processes in various dimensions (Haq et al., 2020). Though providing precise predictions, physical-based approaches require extensive data input, including hydrological, topographic, morphological, and remote sensing data, processed in a Geographic Information System (GIS) (Ji et al., 2012). The empirical approach consists of three classes: Multi-criteria decision analysis (MCDA) (Bengal et al., 2019; Mujib et al., 2021), statistical methods for flood analysis and prediction (Youssef and Hegab, 2019; Costache et al., 2021), and machine learning and artificial intelligence models (Shafizadeh-Moghadam et al., 2018; Eini et al., 2020). Other popular methods include the frequency ratio (FR) method (Pradhan, 2011), analytical hierarchy process (AHP) (Yalcin, 2008; Stefanidis and Stathis, 2013; Papaioannou et al., 2015), and logistic regression (LR) (Pradhan, 2009; Tehrany, et al., 2014a).
The multi-criteria decision analysis model, specifically using the analytical hierarchy process (AHP) as an empirical approach, holds significant recognition and widespread adoption in flood risk assessment (Saaty, 1990). AHP involves a weighted evaluation process based on pairwise comparisons of each parameter, leading to the identification of optimal solutions for specific problems. This method has proven successful in flood analysis and mapping of flood-prone areas, particularly when integrated with Geographic Information Systems (GIS) and remote sensing (Das and Pardeshi, 2018). The combination of GIS with the AHP presents a dependable, efficient, and precise approach applicable to various regions worldwide (Chakraborty and Mukhopadhyay, 2019). Nonetheless, the AHP method’s reliance on expert opinions for determining indicator weight values introduces subjectivity and cognitive limitations (Danumah et al., 2016). To address this, the consistency of the ratio is assessed to ensure coherence in the weighted variables. Setting a threshold for the ratio’s consistency below 10% ensures meaningful and consistent values, reducing the impact of subjectivity and enhancing the reliability of the AHP method in flood analysis and mapping (Rahim et al., 2018). Flood-prone area mapping necessitates the integration of diverse datasets, encompassing topographic characteristics extracted from Digital Elevation Models (DEMs), hydrological data like rainfall and river discharge, and geomorphological information. These vital datasets are commonly obtained through remote sensing techniques and subsequently analyzed using Geographic Information Systems (GIS) to create comprehensive flood-prone area maps. (Arseni et al., 2020). The flood risk assessment for the proposed site incorporates various essential factors, including precipitation, distance to the river, elevation, slope, topographic wetness index (TWI), normalized difference vegetation index (NDVI), land use land cover (LULC), curvature, and soil type. These criteria and their respective significance have been carefully determined through a thorough analysis of existing research and relevant studies (Aydin and Sevgi Birincioğlu, 2022; Osman and Das, 2023; Waseem et al., 2023). The proposed research aims to create a comprehensive flood risk map for the Hunza-Nagar Valley in Pakistan. The study’s primary objective is to assess and analyze flood risk, susceptibility, and risk in the region by integrating various data sources, including topographic maps, hydrological data, geomorphological information, and climate data. Through the application of advanced Geographic Information Systems (GIS) techniques and multi-criteria analysis, the study intends to provide decision-makers and disaster management authorities with crucial insights for effectively developing and implementing flood risk reduction measures. This flood risk map is anticipated to serve as a valuable tool in understanding the vulnerability of the Hunza-Nagar Valley to floods, enabling proactive measures to minimize potential damages and safeguard the community and its assets. By considering the foremost purpose of this investigation, the following objectives are taken.
a) To assess climatic parameters and regional land use patterns using selected remote sensing data records.
b) To identify potential flood hazard zones using integration of multi-criteria decision-making and AHP techniques.
c) To measure spatial flood intensity using previous geo-hazards.
2 Materials and methods
2.1 Study area
The Hunza-Nagar Valley in Pakistan is located within the geographical coordinates of approximately 35° 45′15″to 37° 00′N latitude and 74° 0′00″to 76° 5′25″E longitude as represented in Figure 1 (Bacha, 2018), and is nestled amidst the breathtaking landscapes of the northern region, surrounded by the majestic Himalayas. The geographic extent of the Hunza-Nagar Valley encompasses an estimated area of 14,440 square kilometers. The elevation within the Hunza-Nagar Valley varies, ranging from approximately 1,640 to 7,896 m above sea level (Hyder et al., 2013). During the summer months, the valley receives monsoon rains, which significantly contribute to its annual precipitation. The valley is traversed by the Hunza River, a vital water source originating from melting glaciers and monsoonal rainfall. The river plays a crucial role in supporting local communities and sustaining agricultural activities in the region. Hunza-Nagar Valley is renowned for its lush greenery, diverse forests, and fertile agricultural fields, all of which influence the hydrological processes and flood dynamics. Due to its unique topography and the presence of the Hunza River, the valley faces potential risks of urban flooding during intense rainfall or snowmelt events. The Valley has experienced significant flooding events throughout its history. One notable disaster was the 2010 Attabad Lake incident, triggered by a massive landslide that blocked the Hunza River, leading to catastrophic flooding downstream. Additionally, the valley faces the risk of glacial lake outburst floods (GLOFs) due to the presence of numerous glaciers, which the Badswat GLOFs event is a recent catastrophe. These GLOFs can occur when glacial lakes formed by the melting glaciers suddenly breach their natural dams, releasing large volumes of water downstream. Hence, a comprehensive evaluation of flood risk in the area becomes essential to minimize potential harm to communities and infrastructure (Muneeb et al., 2021).
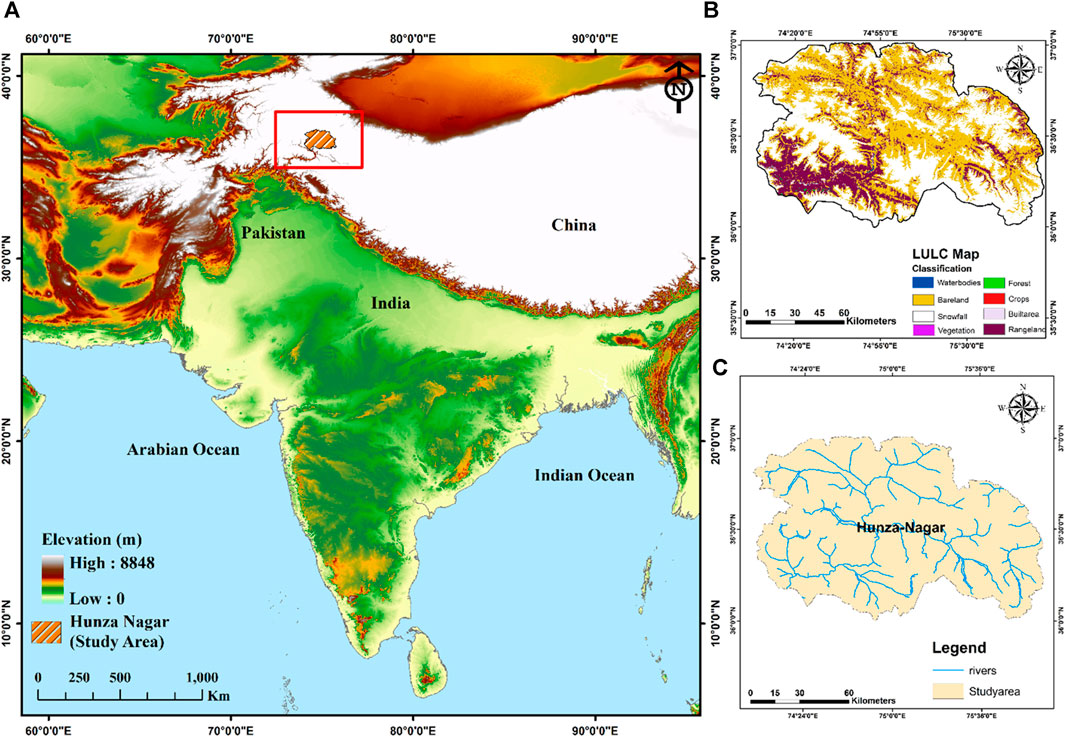
FIGURE 1. Study area map. (A) Location of Hunza basin, (B) Land use and land cover map of Hunza Nagar, (C) Distribution of stream networks.
2.2 Collection and processing of data
The methodology employed in this research is structured into five main sections:
1) The initial stage involved data collection
2) Factors contributing to flood risk were identified
3) Data processing was conducted using GIS to obtain reclassified maps for these contributing factors.
4) Reclassified maps were overlaid using the AHP method to produce the flood risk map.
5) The achieved result was then validated.
In this study, the data collection process played a crucial role in evaluating urban flood risk for the current study area. The acquisition of diverse and reliable datasets was vital for developing a comprehensive flood risk assessment model. Reputable sources were utilized to obtain data related to key factors influencing flood risk. Table 1 shows the data acquired for the current study with their proper description. The Digital Elevation Model (DEM) from Aster Global Digital Elevation Model (ASTER GDEM) at 30 m resolution provided essential topographic information for identifying flood-prone areas based on elevation and slope. Soil data was obtained from the World Digital Soil Map in high-resolution ESRI Shapefile format (5′ × 5′) sourced from the Food and Agricultural Organization of the United Nations (FAO) Map Catalog, contributing critical information about soil types affecting flood risk analysis (FAO Map Catalog, 2023). The High-Resolution Land Use/Land Cover Map from Sentinel-2, accessed through Esri Land Cover - ArcGIS Living Atlas, was instrumental in analyzing land use patterns and identifying areas vulnerable to flooding.
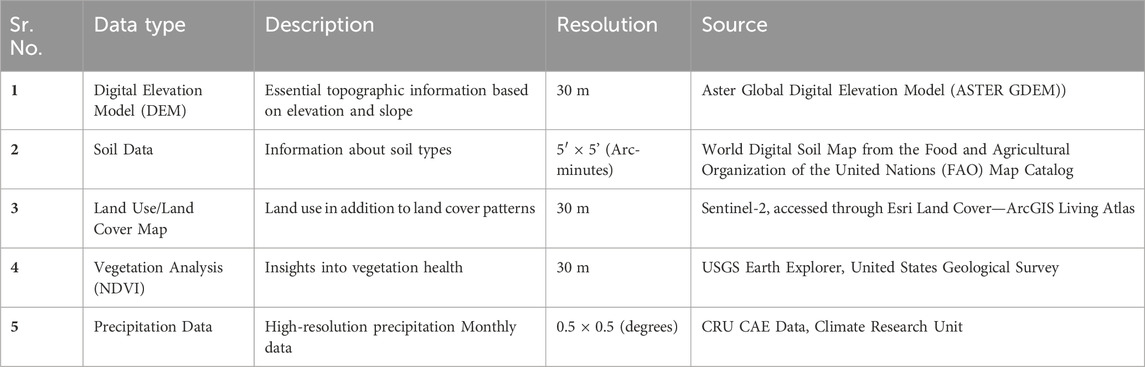
TABLE 1. Data sources of the remote sensing data.
Vegetation analysis was done by Level-1 Satellite Imagery (Landsat 8–9) obtained from the USGS Earth Explorer, providing insights into vegetation health and its impact on flood risk assessment (EarthExplorer, 2023). Rainfall data, a significant determinant of flood hazard, was sourced from the Monthly High-Resolution Precipitation Data (CRU TS) at 0.5 × 0.5 Degree Resolution, provided by the Climate Research Unit (CRU) UAE Data (Crudata and Crudata, 2023). All these datasets were integrated into a Geographic Information System (GIS) to facilitate the Multi-Criteria Decision Analysis (MCDA) approach. The selection of the nine parameters was based on an extensive literature review on flood risk assessment. The acquired data was then processed using ArcGIS version 10.8 to generate reclassified maps for each factor. In the reclassified map for each criterion, the flood risk level was classified into five classes, each assigned a number. With increasing values, the flood risk increases. Level 1 represents “Very Low,” Level 2 represents “Low,” Level 3 represents “Moderate,” Level 4 represents “High,” and Level 5 represents “Very High” flood hazard levels. The flood risk level for each criterion with the corresponding covered area is shown in Table 2. A combination of the Spatial Analyst tool and the analytical hierarchy process (AHP) was applied for a weighted overlay analysis, resulting in the final flood risk map. The current work’s methodological framework is depicted in Figures 5C, D performed using the Normalized Difference Vegetation Index (NDVI) data derived from Landsat.

TABLE 2. The scale of relative importance for developing a pairwise comparison matrix.
2.3 Analytical hierarchy process (AHP)
The AHP is a highly effective method used in a variety of decision-making situations in a wide range of industries, such as business, finance, education, politics, and engineering. A variety of multi-criteria decision-making techniques (MCDM) exist, one method that holds significant prominence is the AHP, originally devised by Saaty (Saaty and Saaty, 2013). AHP represents a versatile mathematical model that takes into account the preferences of individuals or groups, facilitating the evaluation of both quantitative and qualitative criteria in decision-making situations (Saaty, 1990). This study aimed at developing flood-prone regions for Hunza-Nagar, a total of nine factors influencing floods were identified. Utilizing Saaty’s scale of preference ranging from 1 to 9, and drawing insights from literature reviews, field expertise, and studies conducted in analogous geographical areas, the relative weight of each layer has been established. The scale of relative importance is shown in Table 2 below. The scale of relative importance supports the decision-making process.
2.3.1 Pairwise comparison matrix
After selecting the flood-contributing criteria, a pairwise comparison matrix table was constructed to facilitate the assessment process. Through this matrix, each aspect was systematically compared by the Expert to determine their respective importance (Rinc et al., 2018). The scale of relative importance was employed to assign relevant values to each comparison. Subsequently, using the comparison matrix table, various crucial parameters were determined, including the factor weight and class weight. The CR (Consistency Ratio) value was also computed as part of the evaluation process. The CR value plays a vital role in assessing the consistency of the pairwise comparisons made by the Expert, ensuring that the decision-making process remains robust and reliable. To calculate the CR value, a specific mathematical expression (Eq. 1) was utilized, considering the data obtained from the pairwise comparisons. The equation utilized is shown below. This value helps in gauging the consistency of the judgments and ensures that any inconsistencies or discrepancies are minimized during the decision-making process. The resulting CR value serves as an indicator of the matrix’s consistency. A CR value greater than zero implies an unreliable matrix, while a CR value of 0 indicates a reliable matrix. If the CR value is greater than 10, the result should be discarded, the and pairwise comparison matrix should be re-established so that the hat CR value is less than 10 which is considered as of viable consistency (Osman and Das, 2023).
The pairwise comparison matrix obtained for the current study is shown in Table 3, with a consistency ratio (CR) equal to 3.5% < 10%, which is of viable consistency.
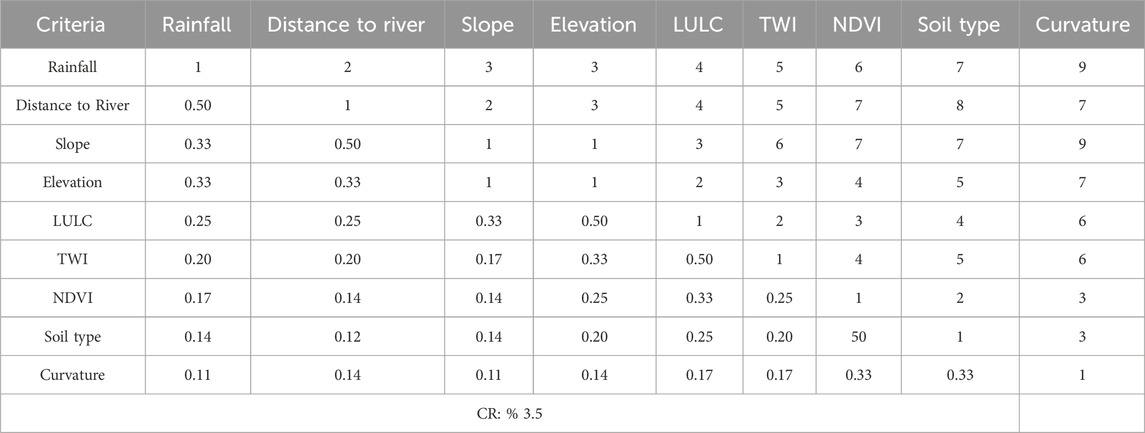
TABLE 3. Pairwise comparison matrix.
2.3.2 Consistency index (CI)
Consistency Index (CI) is a metric in the analytical hierarchy process (AHP) that evaluates the reliability of pairwise comparisons made by decision-makers. It quantifies the level of inconsistency in the comparison matrix, ensuring more dependable and robust decision-making. A lower CI value indicates higher consistency, which is crucial in AHP to produce meaningful and reliable results. The expression used for calculating CI is given below in Eq. 2.
After applying the AHP process, percentage weights were assigned to each criterion, with greater emphasis placed on the first four criteria: rainfall, distance to rivers, slope, and elevation, compared to the remaining five criteria. These weights are presented in Table 4 below in the order of their priority.

TABLE 4. Factors and sub-factors weightage for flood risk map development.
3 Results and discussion
3.1 Distribution of physical parameters
Low-lying areas in the Hunza-Nagar Valley are vulnerable to flooding due to the natural flow of water from higher to lower elevations. To assess the flood risk, a detailed elevation map was generated by reclassifying the Digital Elevation Model (DEM) data. The valley’s topographic elevation spans from 1,646 to 7,846 m, with upstream regions exhibiting notably higher elevations compared to downstream areas as shown below in Figure 2A). This combination of high elevation and steep slopes in the upstream regions contributes to significant runoff during heavy rainfall, thereby elevating the flood risk downstream. Conversely, the relatively flat land slope in lower regions allows the river to overflow during flood events. To quantify the flood risk probability, the Digital Elevation Model (DEM) was further classified into five distinct classes, each representing a specific flood risk zone. These classes are categorized as follows: “Very High” (1,646–3,348 m), “High” (3,349–4,223 m), “Moderate” (4,224–4,928 m), “Low” (4,929–5,658 m), and “Very Low” (5,659–7,846 m). Each elevation class was assigned a corresponding flood risk intensity scale, with values of 5, 4, 3, 2, and 1 respectively, represented in Figure 2B and Table 4. The analysis of the elevation data reveals a clear trend: as elevation increases, the probability of flood risk decreases, and vice versa.

FIGURE 2. Distribution of Physical Parameters. (A) Elevation map; (B) Reclassed Elevation map (C) Slope map; (D) Reclassed slope map.
The topographical slope of the terrain is a critical factor significantly influencing flood risk. Its direct and pivotal impact on drainage and surface runoff accessibility cannot be overstated. Steeper slopes facilitate faster surface runoff, resulting in increased volumes and velocities of water flow during heavy rainfall events. This amplified surface runoff, coupled with reduced groundwater infiltration, intensifies the potential for flooding in the area. In the specific context of the Hunza-Nagar study area, the slope map exhibits diverse variations, ranging from 0 to 81° as shown in Figure 2C. The variation in slope plays a crucial role in the assessment of flood risk. Regions with steeper slopes, particularly in the upstream areas, experience rapid rainwater runoff, thereby contributing to increased flood risk downstream. Such terrain characteristics heighten the vulnerability of low-lying areas to flooding, especially during intense rainfall events. To facilitate flood risk assessment, the terrain’s slope in the study area was classified into five distinct classes based on degree measurements: “0–15°,” “16–27°,” “28–38°,” “39–49°,” and “50–81°.” Each slope class corresponds to a specific flood risk intensity level in the reclassified slope map, with “Very High” assigned 5 points, “High” assigned 4 points, “Moderate” assigned 3 points, “Low” assigned 2 points, and “Very Low” assigned 1 point, representing the flood risk. Areas with steeper slopes (higher degrees) are associated with lower flood risk intensity points, indicating an elevated risk of flooding. Conversely, regions with flatter slopes (lower degrees) receive higher risk hazard intensity points, signifying a reduced susceptibility to flooding, as described in Figure 2D and Table 4.
The Curvature feature in this study characterizes the slope’s curvature and contour, using its second derivative to determine the surface’s concavity or convexity. Within the Hunza-Nagar study area, the terrain’s curvature significantly influences flood risk. Three curvature types have been identified: flat, concave, and convex as shown in Figure 3A. Flat curvature areas are associated with a “Very High” flood risk, with an intensity of 5 points assigned on the flood risk scale. Conversely, convex curvature areas have a “Moderate” flood risk, assigned three points on the intensity scale. For concave curvature regions, the flood risk is considered “Very Low,” with 1 point assigned on the intensity scale. These classifications are clearly illustrated in the reclassed curvature map in Figure 3B. The impact of curvature on flood risk is considerable. Flat curvature areas tend to retain water, increasing the risk of flooding. In contrast, convex curvature promotes better drainage, resulting in a more moderate flood risk. Concave curvature, characterized by inward-sloping terrain, exhibits a lower susceptibility to flooding, indicating a very low flood risk.
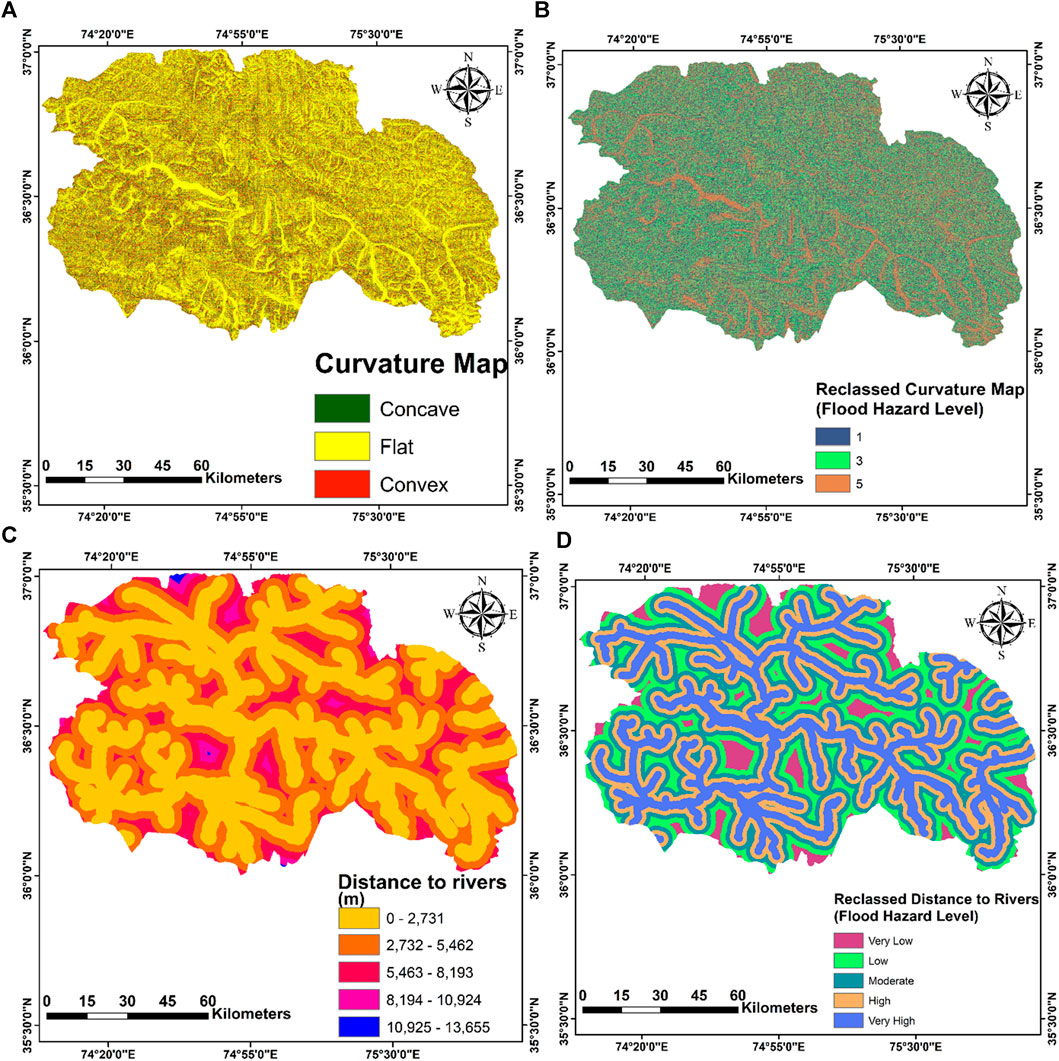
FIGURE 3. Spatial distribution of selected physical parameters. (A) Curvature map; (B) Reclassed curvature map; (C) Distance to the river; (D) Reclassed distance to the river.
The accurate assessment of flood risk zones and the computation of the flood risk index crucially depend on the proximity to the river network component. Areas near river networks are most susceptible to severe flood risks, while the impact of this parameter diminishes with increasing distance from the riverbed. Evaluating the distance between a specific area and nearby rivers provides valuable insights into the level of flood risk posed by that area. By applying the STRAHLER methodology to the extracted stream network within the study area, we can effectively identify and analyze different stream orders and their spatial distribution. This valuable information not only offers insights into the river system’s drainage pattern and connectivity but also aids in identifying areas at higher vulnerability to flooding due to their proximity to higher-order streams. In our research, the STRAHLER technique played a pivotal role in analyzing the river network and categorizing streams based on their respective orders. This classification of streams by order significantly contributes to the overall flood risk assessment. By identifying areas close to higher-order streams, where the river network displays increased complexity and a greater potential for water flow during flood events, we can better assess regions at heightened risk of flooding. The distance to the river is a critical factor in flood risk assessment, and we observe an inverse relationship between distance and flood risk probability, as evident in Figures 3C, D. To facilitate flood risk categorization, the distance to the river map was classified into five distinct classes: “0–2,731 m,” “2,732–5,462 m,” “5,463–8,193 m,” “8,194–10,924 m,” and “10,925–13,655 m” These distance classes were further associated with flood risk levels, where “Very High” receives five points, “High” receives four points, “Moderate” receives three points, “Low” receives two points, and “Very Low” receives 1 point, as illustrated in Table 4.
3.2 Spatial characteristics of geo-physical and climate attributes
Considering the role of land use/land cover in flood risk assessment is essential. Areas covered with vegetation exhibit lower susceptibility to flooding due to the negative correlation between flooding and vegetation density. Vegetated regions facilitate rainwater absorption and slow its flow, thus reducing the risk of runoff and flood incidents. Besides this, roads and residential areas characterized by impervious surfaces, as well as bare lands, contribute to heightened stormwater runoff (Tehrany et al., 2014b). Consequently, these factors elevate the likelihood of flooding in those particular areas. In our study area, a comprehensive analysis identified eight distinct land use types: waterbodies, trees, snowfall areas, rangelands, flooded vegetation, croplands, and built areas. The various land use types are visually represented in Figure 4A. To effectively assess flood risk levels, we employed the reclassified land use/land cover map, which established five classes representing flood risk intensity. Waterbodies and areas near them were categorized as having a “Very High” flood risk level, receiving five points on the intensity scale. “High” flood risk was assigned to build areas and croplands, as demonstrated in Figure 4B and Table 4. This classification allows for the prioritization of areas at higher risk of flooding due to their association with waterbodies, enabling a comprehensive evaluation of their vulnerability.
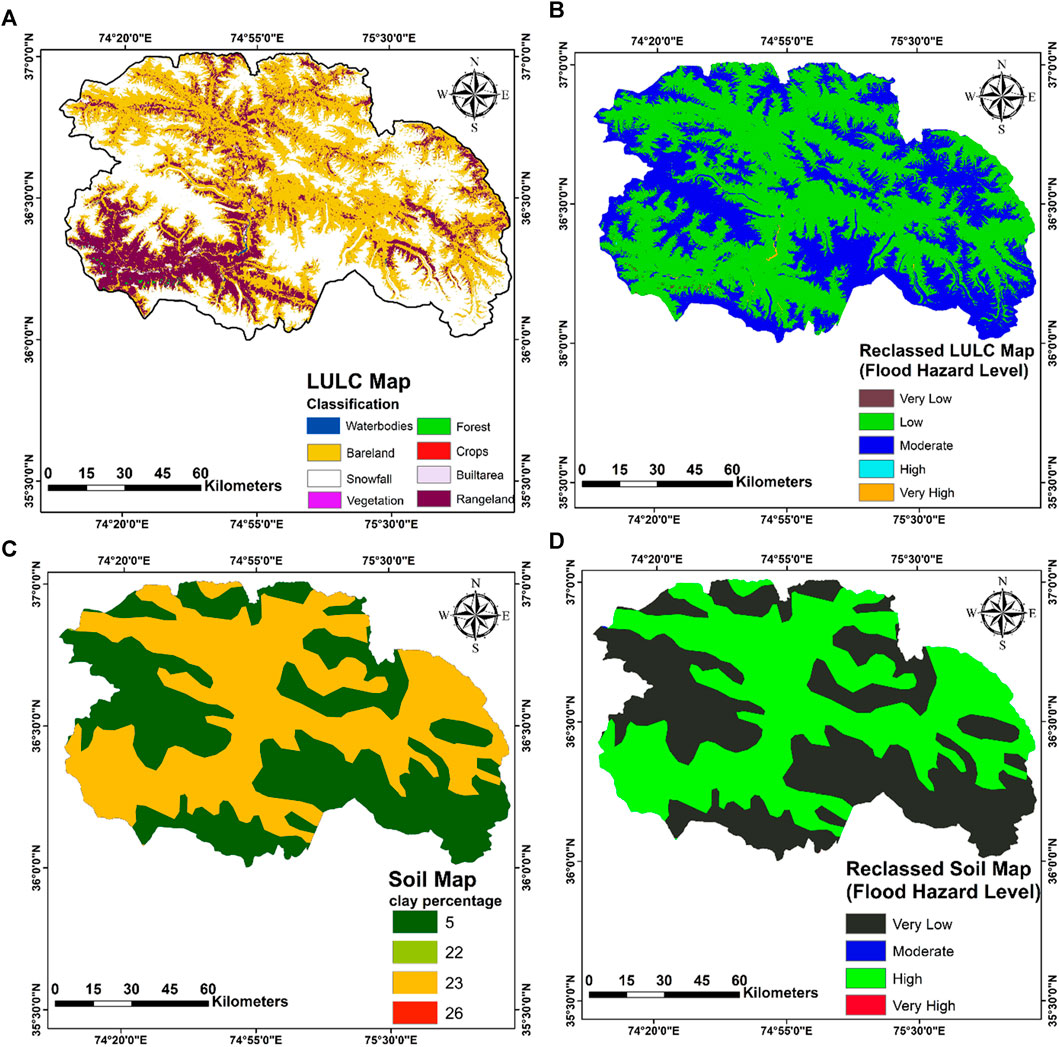
FIGURE 4. Spatial distribution of geo-physical attributes. (A) LULC map; (B) Reclassed LULC map; (C) Soil map; (D) Reclassed soil map.
The geological composition of the study area plays a crucial role in influencing flood occurrences, representing a significant factor that impacts the speed of flooding. Moreover, local geology provides essential insights into past paleo-flood events, enabling the estimation of historical flash flood frequencies. The permeability of various lithological units is a critical determinant during the infiltration phase, as increased permeability promotes faster infiltration, whereas impermeable layers contribute to heightened surface runoff, potentially leading to floods. The rate of infiltration shares a close correlation with the rocks’ permeability. Porous formations like coarse sand and conglomerates facilitate rainwater infiltration, effectively reducing flood risk. Conversely, the presence of impermeable deposits such as marly, clay, and gypsum can elevate runoff rates, thereby increasing the risk of flooding. In the current study, the soil map was classified based on the percentage of clay content, as clay is known to be highly impermeable, resulting in substantial runoff during rainfall and increased flood risk. The distribution of clay percentages across the entire study area ranges from 5% to 26%, and we categorized it into four classes: “5% or less,” “6%–15%,” “16%–23%,” and “24%–26%" as shown in Figure 4C The reclassified soil map provides valuable information regarding flood susceptibility, with each class corresponding to specific flood risk levels: “Very Low” (1 point), “Moderate” (three points), “High” (four points), and “Very High” (five points) respectively, as indicated in Figure 4D and Table 4.
The Topographic Wetness Index (TWI) plays a crucial role in characterizing the spatial distribution of wet and dry areas within the watershed. It provides insights into flow direction and accumulation at specific locations, offering valuable information for flood susceptibility assessment. High TWI values indicate areas that are particularly vulnerable to flooding, with a TWI value greater than 16 and a TWI value greater than 14, as reported by Ahmed M. Youssef and Hegab, signifying high flood susceptibility. In our study, the variation of TWI values spans from 1.58 to 24.94, which we categorized into five classes: “1.58–4.61,” “4.62–6.35,” “6.36–8.64,” “8.65–12.39,” and “12.40–24.94″as shown in Figure 5A. Each class corresponds to specific flood risk levels on the intensity scale: “Very Low” (1 point), “Low” (two points), “Moderate” (three points), “High” (four points), and “Very High” (five points), as illustrated in Figure 5B and Table 4. The analysis reveals that TWI values indicating high flood susceptibility, exceeding 14, only cover approximately 9.5% of the research area. Conversely, areas with low TWI values (<9) exhibit the widest distribution, accounting for about 83.5% of the study area. Understanding the distribution of TWI values across the study area is instrumental in formulating targeted flood preparedness strategies, thereby enhancing the resilience of the community and its assets.
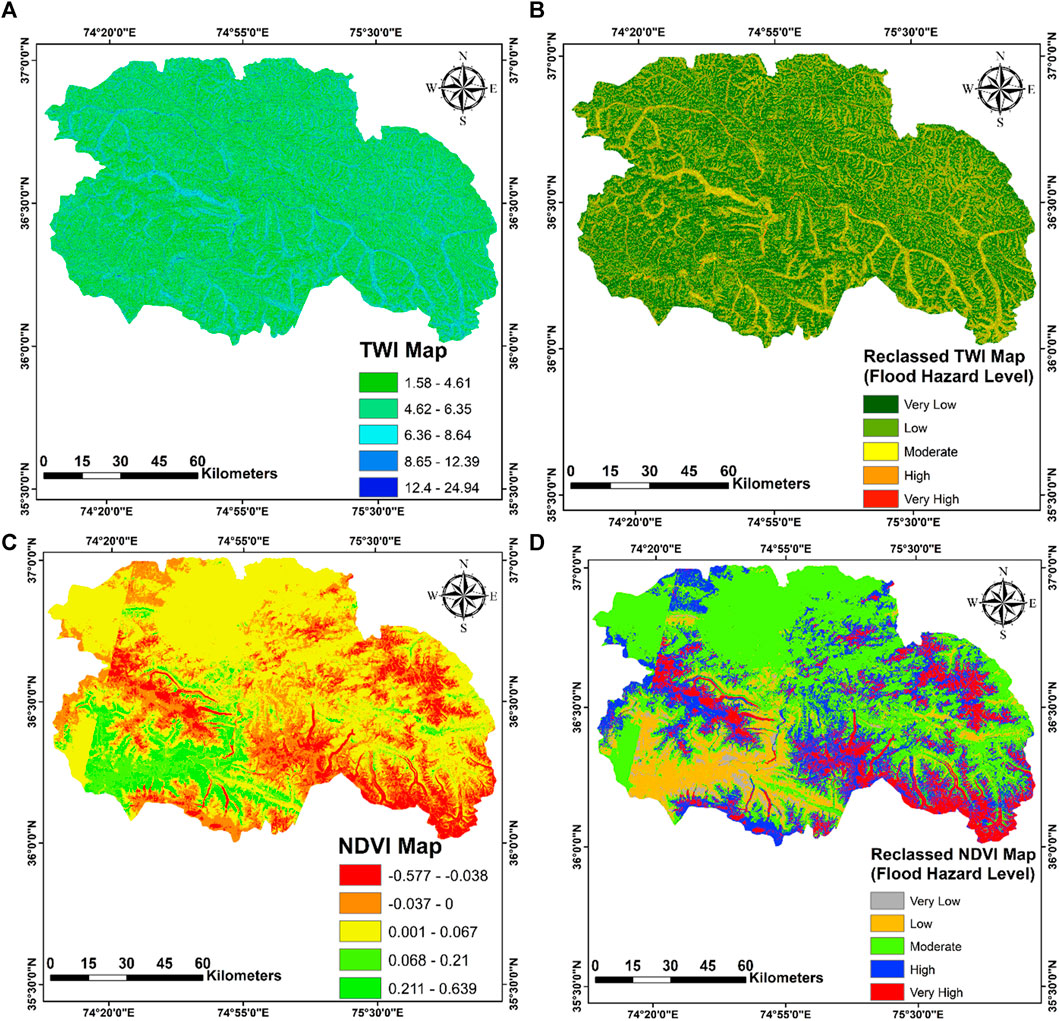
FIGURE 5. Distribution of geo-physical outcomes. (A) TWI map; (B) Reclassed TWI map; (C) NDVI map; (D) Reclassed NDVI map.
The Normalized Difference Vegetation Index (NDVI) serves as a remote sensing technique employed to evaluate the health of vegetation by analyzing light reflectance in visible and near-infrared (NIR) wavelengths. Its applications span across diverse fields, including agriculture, forestry, and ecology, providing valuable insights into vegetation growth, health, and stress monitoring. NDVI values offer valuable data for vegetation cover classification and detecting changes in plant health over time. The fundamental principle behind NDVI is that healthy green vegetation absorbs visible light and reflects NIR light, while non-vegetated areas exhibit different patterns of reflectance. The computation of NDVI involves subtracting the NIR reflectance from the red reflectance and then dividing the result by the sum of the NIR and red reflectance values. This calculation yields NDVI values ranging from −1 to 1, where negative values indicate non-vegetated areas, 0 represents bare soil or water, and values closer to 1 signify healthier and more abundant vegetation. Regarding flood risk assessment, NDVI and flood risk demonstrate an inverse relationship. Higher NDVI values are indicative of lower flood risk, whereas lower NDVI values are associated with higher flood risk. To effectively assess flood risk probability, we have classified the NDVI map into five distinct classes: "−0.577–0.038,” “−0.037–0,” “0.001–0.067,” “0.068–0.21,” and “0.211–0.639”as shown in Figure 5C. Each class corresponds to a specific flood risk probability on the intensity scale: “Very High” (five points), “High” (four points), “Moderate” (three points), “Low” (two points), and “Very Low” (1 point) as shown in Figure 5D and Table 4.
Rainfall plays a pivotal role in exacerbating flood risk within the study area, significantly influencing the potential for river overflow and subsequent flooding occurrences. The intensity of rainfall directly correlates with the extent of flooding, as heightened precipitation levels can exceed the river’s capacity to accommodate the increased water volume. This results in overflow and the inundation of adjacent regions. Conversely, instances of lower rainfall are associated with less severe flooding, as the river system can manage the relatively reduced influx of water without breaching its banks. For an accurate appraisal of flood risk and the formulation of flood risk maps, a profound comprehension of the spatial dissemination of rainfall patterns is imperative. In this endeavor, the study draws upon the Inverse Distance Weighted (IDW) methodology. The IDW technique serves as an interpolation approach, facilitating the estimation of values at unsampled locations by considering nearby data points. When applied to the collected rainfall data, the IDW method offers a holistic depiction of the dispersion of rainfall across the study area. The resulting rainfall map offers insights into areas susceptible to heavy rainfall, indicating regions at higher risk of flooding due to potential river overflow. The acquisition of rainfall data for this assessment was facilitated through the utilization of Monthly High-Resolution Precipitation Data (CRU TS) at a resolution of 0.5 × 0.5°, sourced from the Climate Research Unit (CRU) UAE Data. The data incorporated spanned from 2001 to 2022. Given the spatial nature of this dataset, the ISOHYETAL Method was adopted to craft comprehensive and informative rainfall maps. The Isohyetal Method typically involves the incorporation of cumulative (collective) rainfall data to create isohyetal lines on a map. These lines connect points of equal cumulative rainfall within a given period. This method is commonly used to represent spatial patterns of rainfall across an area and can provide valuable insights into areas that have received similar amounts of rainfall. The ISOHYETAL Method is particularly well-suited for delineating areas of equal precipitation intensity across an expanse, effectively aiding in the representation of varying rainfall depths within the Study area. The rainfall values in the Hunza-Nagar Study area vary spatially, ranging from 246 to 307 mm as shown in Figure 6A. There is a direct relationship between precipitation and flood risk, where an increase in rainfall intensity leads to higher flood risk, and vice versa, this can be confirmed by Figure 6B. In this study, the rainfall map was categorized into five segments, representing a progression from lower to higher rainfall depths. The corresponding reclassified map demonstrates the increasing flood risk level with the rise in rainfall depth.

FIGURE 6. Spatial scenario of climate factors and associated flood hazard zones. (A) Rainfall map (B) Reclassed Rainfall map (C) Weighted Overlay (D) Hunza River, Before Landside (2009) (E) Hunza River, After Landslide (2010) (F) Flood Inventory Map of Attabad Lake with its location in the study area (G) ROC-AUC Curve for model validation.
3.3 Regional flood hazard zonations and related geo-hazards
The flood risk map was created by incorporating nine primary flood-influencing parameters: rainfall, distance to rivers, slope, elevation, NDVI, TWI, soil type, LULC, and curvature. The analysis of the pairwise comparison matrix resulted in a consistency ratio (CR) value of 3.5%, which falls below the threshold value of 10%, confirming the credibility of the results obtained through the AHP process. The findings of this study revealed that elevation, slope, rainfall, and distance to the river were the dominant factors influencing flooding in the area. Areas with lower elevations were more vulnerable to flooding due to water accumulation during heavy rainfall events. Steeper slopes increased the risk of flash floods. Significant precipitation during the monsoon season contributed to flooding in the study area. Parameters like curvature, NDVI, TWI, LULC, and soil type showed lesser impact on flooding. Flat surfaces were prone to flooding as they retained water, and areas with negative NDVI values experienced higher flood risks due to the absence of vegetation to impede water flow. High TWI values indicated increased water accumulation capacity, elevating flood risk. Waterbodies, built-area, and bare lands were more flood-prone in terms of LULC. Clayey soil’s low drainage rate enhanced flood risk in areas with this soil type.
The flood risk map as depicted in Figure 6C, for the current research was developed using nine parameters contributing to flood risk, similar to a study conducted by a researcher. However, other researchers utilized varying numbers of parameters. Literature review reveals that there is no fixed rule for selecting the type and number of flood-influencing factors; researchers base their choices on experience, topographical features, and geological location of the study area. The final flood risk map for the current study area resulted from the weighted overlay of the reclassified maps of the nine parameters in “ArcGIS 10.8.” This flood risk map is classified into five categories for flood risk assessment: “Very High,” “High,” “Moderate,” “Low,” and “Very Low.” Figure 6C shows that the flood risk is more significant at the northwest side of the study area due to the concentrated natural flow of the Hunza River, elevating the flood risk level in those parts. This developed flood risk map holds crucial importance for disaster management authorities where real-time flood risk zonation data is not available.
Table 5 shows the percentage area each flood risk class covers. To minimize the adverse effects of flooding, it is essential to adopt strategic approaches for well-planned construction in these regions like effective town planning, and defining proper floodplains where any sort of construction should be prohibited. Eliminating encroachments, especially near riverbanks, will help mitigate vulnerability. The construction of flood protection walls is advised in areas where it can effectively reduce risks, with the South-West area of Hunza-Nagar being the most viable choice. The construction of a flood protection wall will divert the flood water from the areas that come under high risk flood zones due to haphazard and unplanned construction activities. By implementing these measures, the potential flood damage can be considerably reduced, ensuring the safety and protection of both the population and infrastructure in Very High and High flood-risk zones.
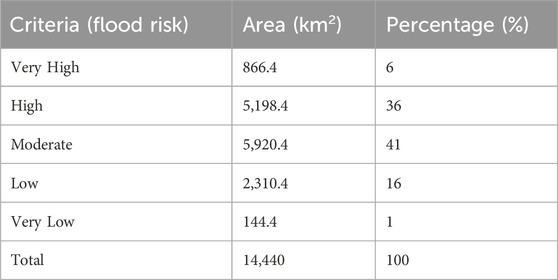
TABLE 5. Classification of flood risk zones in the study area.
Validating a model entails systematically comparing its outputs to real-world observations, and gauging prediction accuracy in quantity and quality. In flood susceptibility assessment, models evaluate regional vulnerability. Ensuring reliability for future flood risk evaluations demands validation on, aligning model outputs with observed or ground truth data through calibration. The flood risk map for this study was validated by checking its output with a flood inventory map developed for Attabad Lake through ROC-AUC (Area Under the Curve-Receiver Operating Characteristic) which is used to measure the performance of a model.
One of the biggest disasters that hit Hunza-Nagar on 4 January 2010, was a massive landmass collapse, destroying Attabad village and forming a natural dam across the Hunza River. The blocked river stretched around 2 km long and 500 m wide. The landslide also covered 1.3 km of the Karakoram Highway. By the end of May 2010, the formed lake had expanded to about 22 km in length and over 100 m in depth. It covered an approximate area of 23.4 square kilometers. The real-time images of the area before and after the landslide are presented above in Figures 6D, E, respectively. These images convey the extensive flooded area, making them an excellent choice for model validation due to their ability to showcase the magnitude of the impact.
To validate the model, a flood inventory map of Attabad Lake was generated using point features within ArcGIS 10.8. The lake’s polygon feature was extracted from the base map in ArcGIS through digitization. The map, along with the lake’s position in the study area, is shown in Figure 6F. The arrangement of flooded points corresponds with the polygon feature portraying Attabad Lake after the landslide. Importantly, it should be noted that these points do not convey the scale or frequency of flood events, potentially affecting validation outcomes as it is impossible to locate a flood event by a single point in space. Flooded point features denote the disaster-affected areas, while non-flooded points indicate regions unaffected by flooding.
The ROC-AUC (Receiver Operating Characteristics-Area Under the Curve) curve assesses the performance of a flood risk model by plotting the true positive rate against the false positive rate. An AUC value signifies the model’s ability to discriminate between flooded and non-flooded areas, with higher values indicating better accuracy. This validation metric confirms the robustness of our flood hazard map, providing a quantitative measure of its reliability in predicting and classifying flood risk in the studied region. The ROC-AUC analysis (Figure 6G) was conducted by comparing the flood risk map raster layer with flooded and non-flooded point features, using the ‘ArcSDM’ tool within the ArcGIS software. The ROC-AUC curve is depicted in the Figure below. The AUC values are divided into several categories: 0.9–1.0 (Excellent), 0.8–0.9 (Very good), 0.7–0.8 (Good), 0.6–0.7 (Satisfactory), and 0.5–0.6 (Unsatisfactory). The AUC value for the current model is 0.773 (77.3%), placing it in the good category and nearly approaching the very good range. This demonstrates the model’s effective performance in generating the flood risk map, yielding a favorable outcome.
4 Discussion
The investigation conducted here revolves around the evaluation of flood risk within the Hunza-Nagar Valley, Pakistan, utilizing the GIS-based AHP technique (Print et al., 2011; Patrikaki et al., 2023). The primary objective entailed delineating regions susceptible to flooding by dissecting nine core parameters with pronounced effects on flood occurrences: precipitation patterns, proximity to water bodies, terrain elevation, slope, vegetation health, topographic wetness index, land use/land cover, land curvature, and soil composition (Mitra and Das, 2023). A comprehensive assessment of these parameters involved determining their respective priority through pairwise comparisons and employing the AHP methodology. By combining these elements, a flood risk map was formulated, where a natural breaking approach segregated the landscape into five distinct categories, ranging from very high to very low-risk zones (Youssef and Pradhan, 2011; Janizadeh et al., 2021; Yilmaz, 2022). The resulting hazard map highlighted that approximately 6% of the total area exhibited a very high flood risk, 36% was designated as high risk, 41% lay within the moderate risk bracket, and 16% and 1% corresponded to low and very low flood risk categories, respectively (Norman et al., 2010; Olii et al., 2021). The outcomes underscored the paramount role played by factors such as elevation, slope, precipitation levels, and proximity to water bodies in influencing flood occurrences (Fernández and Lutz, 2010; Tehrany et al., 2014b). Areas characterized by lower elevations were discerned to be more susceptible to inundation during intense rainfall, while steeper terrains amplified the potential for rapid flash floods (Bonacci and Ljubenkov, 2006; He et al., 2007; Hüseyin et al., 2012; Zhu, 2016; Das, 2020). Moreover, the study identified significant monsoonal precipitation as a contributing factor to flooding events. Conversely, parameters such as land curvature, vegetation health, topographic wetness index, land use/land cover, and soil type exhibited comparatively diminished influence on flood risk. For instance, flat terrains were found to exhibit increased vulnerability due to water retention, and areas featuring negative normalized difference vegetation index (NDVI) values indicated heightened flood risks attributable to a lack of obstructing vegetation (Chakraborty and Mukhopadhyay, 2019). Likewise, locations with elevated topographic wetness index values posed an escalated flood threat due to enhanced water accumulation capacity, further accentuating the risk (Adnan et al., 2019). Aspects of land use/land cover were identified wherein water bodies, built-up areas, and barren land displayed a greater susceptibility to flooding. Clayey soil, characterized by its diminished drainage capacity, was also discerned as a contributing factor to augmented flood risk in regions with such soil composition. The Hunza-Nagar River basin has experienced a surge in catastrophic floods, notably the devastating 2010 landslide that obstructed the Hunza River and subsequently triggered extensive upstream flooding (Hayat et al., 2010; Abbas et al., 2016). Correspondingly, other studies have emphasized the necessity of prioritizing vulnerable populations, including children, the elderly, and disadvantaged households, for comprehensive flood impact assessments and responsive strategies (Ullah and Id, 2020; Shah and Rana, 2023). The investigation’s findings hold considerable significance for policymakers, offering insights crucial to flood risk mitigation strategies (Osman and Das, 2023; Waseem et al., 2023). By effectively identifying areas prone to flooding, authorities can implement preemptive measures to minimize potential damage and protect lives and assets during flood events. The Multi-Criteria Decision Analysis (MCDA) framework integrated within this study aids in formulating nuanced flood vulnerability assessments that encompass various dimensions such as economics, environment, and societal wellbeing (Management, 2006; Paquette and Lowry, 2012; Rahmati et al., 2016; Aydin and Sevgi Birincioğlu, 2022; Osman and Das, 2023). In summation, this research contributes to informed disaster planning, bolstering community resilience, and facilitating disaster response mechanisms in flood-prone regions. It furnishes a valuable tool for disaster management and planning entities to strategically allocate resources and establish preemptive measures in areas predisposed to flooding (Al-Abadi and Pradhan, 2020).
5 Limitations
Discussing study limitations is crucial as it provides transparency about potential weaknesses and constraints in the research approach. Acknowledging these limitations enhances the credibility of the findings, helps interpret results more accurately, and guides future research improvements, ensuring a balanced and realistic understanding of the study’s scope and implications.
• Reliance on diverse input data, with potential inaccuracies or data gaps impacting predictive precision.
• Temporal constraint due to reliance on historical and present data; future land use, climate trends, and infrastructure developments not considered, limiting long-term flood risk assessment.
• Utilization of Multi-Criteria Decision Analysis (MCDA) involves simplifications and assumptions, introducing uncertainties, especially for complex interactions.
• Results may not be directly applicable to other regions due to the uniqueness of Hunza-Nagar’s geography, requiring customization and validation.
• Assumption of stationarity, assuming past flood patterns remain consistent, without accounting for potential changes in climate, land use, or other dynamic factors.
• Limitations in spatial resolution of input data might compromise precision, especially for smaller-scale features.
• Potential for improved accuracy by incorporating high-resolution data to enhance results.
6 Conclusion
This study used the GIS-based AHP technique to create a flood risk map for Pakistan’s Hunza-Nagar Valley. Using ArcGIS 10.8 software, the flood risk map was created by analyzing important flood-triggering elements such as rainfall, river distance, elevation, slope, curvature, NDVI, TWI, LULC, and soil type. The aforementioned layers were integrated to build a full flood risk map by assigning weights to these elements using the AHP approach. The generated map shows the various levels of flood risk in the research area: 16% is classified as low risk, 1% as very low risk, 36% as high risk, 41% as moderate risk, and 6% as very high risk. This map of flood danger has important ramifications. It can serve as a valuable tool for policymakers and planners to make informed decisions regarding climate change adaptation, land use planning, and flood risk management. The study emphasizes the significance of combining diverse geographic information sources to improve the accuracy of risk assessment. Furthermore, regions classified as high- and extremely high-risk should be examined more thoroughly using higher-resolution satellite images. This research underlines the potential of geospatial approaches in disaster analysis and the vital significance of precise data integration. In the context of an increasingly vulnerable world, the flood risk map contributes to better risk mitigation strategies, ensuring the safety of communities and their assets. As future developments unfold, this study remains an indispensable resource for disaster preparedness and management in the Hunza-Nagar Valley region.
Data availability statement
The raw data supporting the conclusion of this article will be made available by the authors, without undue reservation.
Author contributions
MM: Methodology, Resources, Writing–original draft, Writing–review and editing. DS: Conceptualization, Funding acquisition, Supervision, Writing–original draft, Writing–review and editing. YD: Supervision, Writing–review and editing. MA: Writing–review and editing. AbB: Validation, Writing–review and editing, Investigation, Writing–original draft. AsB: Investigation, Writing–original draft, Writing–review and editing, Visualization. NY: Writing–original draft, Visualization, Software, Writing–review and editing. DL: Writing–review and editing, Validation. QY: Writing–review and editing. AK: Writing–review and editing. AM: Writing–review and editing. BH: Writing–review and editing.
Funding
The author(s) declare financial support was received for the research, authorship, and/or publication of this article. This work was financially supported by an international partnership of Chinese Academy of Sciences (Grant No. 046GJHZ2023069MI) and the Ministry of Science and Technology (Grant No. 2018FY100502), and Gansu Provincial Science and Technology Program (Grant No. 22ZD6FA005).
Acknowledgments
The authors would like to thank every person who has collaborated throughout the research work. The complication of this research work could not have been possible without the cooperation Muhammad Waseem (GIK Institute, Sawabi Pakistan).
Conflict of interest
The authors declare that the research was conducted in the absence of any commercial or financial relationships that could be construed as a potential conflict of interest.
Publisher’s note
All claims expressed in this article are solely those of the authors and do not necessarily represent those of their affiliated organizations, or those of the publisher, the editors and the reviewers. Any product that may be evaluated in this article, or claim that may be made by its manufacturer, is not guaranteed or endorsed by the publisher.
References
Abbas, N., Afsar, S., Jan, B., Waseem, L. A., Asad Naqvi, S. A., Hameed, A., et al. (2016). Environmental disaster assessment using geospatial techniques for Hunza-Nagar district, Gilgit-Baltistan, Pakistan. Sci. Int. 28 (6), 5319–5328.
Adnan, M., Liu, S., Saifullah, M., Iqbal, M., Ali, A. F., and Mukhtar, M. A. (2022). Spatiotemporal variations in runoff and runoff components in response to climate change in a glacierized subbasin of the Upper Indus Basin, Pakistan. Front. Earth Sci. 10 (August), 1–20. doi:10.3389/feart.2022.970349
Adnan, M. S. G., Dewan, A., Zannat, K. E., and Abdullah, A. Y. M. (2019). The use of watershed geomorphic data in flash flood susceptibility zoning: a case study of the Karnaphuli and Sangu river basins of Bangladesh. Nat. Hazards 99 (1), 425–448. doi:10.1007/s11069-019-03749-3
Ahmad, F., Kazmi, S. F., and Pervez, T. (2011). Human response to hydro-meteorological disasters: a case study of the 2010 flash floods in Pakistan. J. Geogr. Regional Plan. 4 (9), 518–524. http://www.academicjournals.org/JGRP.
Al-Abadi, A. M., and Pradhan, B. (2020). In flood susceptibility assessment, is it scientifically correct to represent flood events as a point vector format and create flood inventory map? J. Hydrology 590, 125475. doi:10.1016/j.jhydrol.2020.125475
Almazroui, M., Saeed, S., Saeed, F., Islam, M. N., and Ismail, M. (2020). Projections of precipitation and temperature over the South Asian countries in CMIP6. Earth Syst. Environ. 4 (2), 297–320. doi:10.1007/s41748-020-00157-7
Apel, H., Aronica, G. T., Kreibich, H., and Thieken, A. H. (2009). Flood risk analyses - how detailed do we need to be? Nat. Hazards 49 (1), 79–98. doi:10.1007/s11069-008-9277-8
Arnell, N. W., and Gosling, S. N. (2016). The impacts of climate change on river flood risk at the global scale. Clim. Change 134 (3), 387–401. doi:10.1007/s10584-014-1084-5
Arseni, M., Rosu, A., Calmuc, M., Calmuc, V. A., Iticescu, C., and Georgescu, L. P. (2020). Development of flood risk and hazard maps for the lower course of the Siret River, Romania. Sustain. Switz. 12 (16), 6588. doi:10.3390/su12166588
ASTER Global Digital Elevation (2023). ASTER global digital elevation model V003 | earthdata search. Retrieved July 29, 2023, from https://search.earthdata.nasa.gov/search/granules?p=C1711961296-LPCLOUD&pg[0][v]=f&pg[0][gsk]=-start_date&q=aster&tl=1690614150.935!3!!.
Atta-ur-Rahman, , and Khan, A. N. (2011). Analysis of flood causes and associated socio-economic damages in the Hindukush region. Nat. Hazards 59 (3), 1239–1260. doi:10.1007/s11069-011-9830-8
Atta-ur-Rahman, , Khan, A. N., Collins, A. E., and Qazi, F. (2011). Causes and extent of environmental impacts of landslide hazard in the Himalayan region: a case study of Murree, Pakistan. Nat. Hazards 57 (2), 413–434. doi:10.1007/s11069-010-9621-7
Awan, S. A. (2002). The climate and flood risk potential of northern areas of Pakistan. Proc. GCISC Introd. Workshop Math. Model. Its Appl. Dev. Issues, 100–109.
Aydin, M. C., and Sevgi Birincioğlu, E. (2022). Flood risk analysis using gis-based analytical hierarchy process: a case study of Bitlis Province. Appl. Water Sci. 12 (6), 122–210. doi:10.1007/s13201-022-01655-x
Bacha, A. S., Shafique, M., and van der Werff, H. (2018). Landslide inventory and susceptibility modelling using geospatial tools, in Hunza-Nagar valley, northern Pakistan. Hunza-Nagar Val. , North. Pak. 15, 1354–1370. doi:10.1007/s11629-017-4697-0
Baqir, M., Sobani, Z. A., Bhamani, A., Bham, N. S., Abid, S., Farook, J., et al. (2012). Infectious diseases in the aftermath of monsoon flooding in Pakistan. Asian Pac. J. Trop. Biomed. 2 (1), 76–79. doi:10.1016/S2221-1691(11)60194-9
Bengal, W., Chakraborty, S., and Mukhopadhyay, S. (2019). Assessing flood risk using analytical hierarchy process (AHP) and geographical information system (GIS): application. Nat. Hazards, 0123456789. doi:10.1007/s11069-019-03737-7
Bonacci, O., Ljubenkov, I., and Roje-Bonacci, T. (2006). Karst flash floods: an example from the Dinaric karst (Croatia). Nat. Hazards Earth Syst. Sci. 6, 195–203. doi:10.5194/nhess-6-195-2006
Chakraborty, S., and Mukhopadhyay, S. (2019). Assessing flood risk using analytical hierarchy process (AHP) and geographical information system (GIS): application in Coochbehar district of West Bengal, India. Nat. Hazards 99 (1), 247–274. doi:10.1007/s11069-019-03737-7
Chen, H., Ito, Y., Sawamukai, M., and Tokunaga, T. (2015). Flood hazard assessment in the kujukuri plain of Chiba prefecture, Japan, based on GIS and multicriteria decision analysis. Nat. Hazards 78 (1), 105–120. doi:10.1007/s11069-015-1699-5
Costache, R., Arabameri, A., Elkhrachy, I., Ghorbanzadeh, O., and Pham, Q. B. (2021). Detection of areas prone to flood risk using state-of-the-art machine learning models. Geomatics, Nat. Hazards Risk 12 (1), 1488–1507. doi:10.1080/19475705.2021.1920480
Crudata (2023). CRU TS v4.07 data variables. Retrieved July 29, 2023, from https://crudata.uea.ac.uk/cru/data/hrg/cru_ts_4.07/cruts.2304141047.v4.07/.
Danumah, J. H., Odai, S. N., Saley, B. M., Szarzynski, J., Thiel, M., Kwaku, A., et al. (2016). Flood risk assessment and mapping in Abidjan district using multi-criteria analysis (AHP) model and geoinformation techniques, (Cote d’Ivoire). Geoenvironmental Disasters 3 (1), 10. doi:10.1186/s40677-016-0044-y
Das, S. (2020). Remote Sensing Applications: society and Environment Flood susceptibility mapping of the Western Ghat coastal belt using multi-source geospatial data and analytical hierarchy process (AHP). Remote Sens. Appl. Soc. Environ. 20, 100379. doi:10.1016/j.rsase.2020.100379
Das, S., and Pardeshi, S. D. (2018). Comparative analysis of lineaments extracted from Cartosat, SRTM and ASTER DEM: a study based on four watersheds in Konkan region, India. Spatial Inf. Res. 26 (1), 47–57. doi:10.1007/s41324-017-0155-x
Di Baldassarre, G., Viglione, A., Carr, G., Kuil, L., Salinas, J. L., and Blöschl, G. (2013). Socio-hydrology: conceptualising human-flood interactions. Hydrology Earth Syst. Sci. 17 (8), 3295–3303. doi:10.5194/hess-17-3295-2013
EarthExplorer (2023). EarthExplorer. Retrieved July 29, 2023, from https://earthexplorer.usgs.gov/.
Eini, M., Kaboli, H. S., Rashidian, M., and Hedayat, H. (2020). Hazard and vulnerability in urban flood risk mapping: machine learning techniques and considering the role of urban districts. Int. J. Disaster Risk Reduct. 50, 101687. doi:10.1016/j.ijdrr.2020.101687
EM-DAT - The international disaster database (2023). EM-DAT - the international disaster database. Retrieved August 3, 2023, from https://www.emdat.be/.
Esri (2023). Esri | sentinel-2 land cover explorer. Retrieved July 29, 2023, from https://livingatlas.arcgis.com/landcoverexplorer/#mapCenter=−83.21%2C34.332%2C4&mode=step&timeExtent=2017%2C2021&year=2017.
European Union (2007). Directive 2007/60/EC of the European Counil and European Parliment of 23 October 2007 on the assessment and management of flood risks. Official J. Eur. Union 2455, 27–34. http://eur-lex.europa.eu/legal-content/EN/TXT/PDF/?uri=CELEX:32007L0060&from=EN.
FAO Map Catalog (2023). FAO map catalog. Retrieved July 29, 2023, from https://data.apps.fao.org/map/catalog/srv/eng/catalog.search;jsessionid=720033765F00749AEC8E85DA92963EBC?node=srv#/metadata/446ed430-8383-11db-b9b2-000d939bc5d8.
Fernández, D. S., and Lutz, M. A. (2010). Urban fl ood hazard zoning in Tucumán Province, Argentina, using GIS and multicriteria decision analysis. Eng. Geol. 111 (1–4), 90–98. doi:10.1016/j.enggeo.2009.12.006
Fohrer, N., Haverkamp, S., Eckhardt, K., and Frede, H. G. (2001). Hydrologic response to land use changes on the catchment scale. Phys. Chem. Earth, Part B Hydrology, Oceans Atmos. 26 (7–8), 577–582. doi:10.1016/S1464-1909(01)00052-1
Hapciuc, O., Romanescu, G., and Minea, I. (2016). Flood susceptibility analysis of the cultural heritage in the Sucevita catchment (Romania). J. Conservation Sci. 7 (2), 501–510.
Haq, T., Halik, G., and Hidayah, E. (2020). Flood routing model using integration of Delft3D and GIS (case study: tanggul watershed, Jember). AIP Conf. Proc. 2278. doi:10.1063/5.0014607
Hayat, T., Shah, H. P., Qureshi, M. U., and Karamat, S. (2010). Attabad landslide - dam disaster in Pakistan 2010 ISSMGE bulletin. Case Hist. Attabad Landslide- Dam Disaster Pak. 2010 4 (3).
He, B., Xu, Y., Huang, X., Luo, Z., Shi, Y., Yang, Q. J., et al. (2007). Age and duration of the Emeishan flood volcanism, SW China: geochemistry and SHRIMP zircon U – Pb dating of silicic ignimbrites, post-volcanic Xuanwei Formation and clay tuff at the Chaotian section. Earth Planet. Sci. Lett. 255, 306–323. doi:10.1016/j.epsl.2006.12.021
Hirabayashi, Y., Alifu, H., Yamazaki, D., Imada, Y., Shiogama, H., and Kimura, Y. (2021). Anthropogenic climate change has changed frequency of past flood during 2010-2013. Prog. Earth Planet. Sci. 8 (1), 36. doi:10.1186/s40645-021-00431-w
Hüseyin, E. Ç., Gonca, C., Cigizoglu, H. K., Ağıralioğlu, N., Abdurrahim, A., and Esin, A. İ. (2012). The analysis of 2004 flood on kozdere stream in istanbul. Nat. Hazards 63, 461–477. doi:10.1007/s11069-012-0165-x
Hyder, S., Khatoon, S., and Imran, M. (2013). Ethnobotanical studies on plants of district hunza-nagar. Int. J. Biol. Biotech. 10 (1), 91–99.
Janizadeh, S., Chandra, S., Saha, A., Chowdhuri, I., Ahmadi, K., Mirzaei, S., et al. (2021). Mapping the spatial and temporal variability of flood hazard affected by climate and land-use changes in the future. J. Environ. Manag. 298, 113551. doi:10.1016/j.jenvman.2021.113551
Ji, J., Choi, C., Yu, M., and Yi, J. (2012). Comparison of a data-driven model and a physical model for flood forecasting. WIT Trans. Ecol. Environ. 159, 133–142. doi:10.2495/FRIAR120111
Khan, M. A., Khan, J. A., Ali, Z., Ahmad, I., and Ahmad, M. N. (2016). The challenge of climate change and policy response in Pakistan. Environ. Earth Sci. 75 (5), 412–416. doi:10.1007/s12665-015-5127-7
Koons, A. (2021). Humanitarian response: disaster upon disaster. New York, NY, USA: Jstor. doi:10.2307/j.ctv1dwq12t.10
Lin, K., Chen, H., Xu, C. Y., Yan, P., Lan, T., Liu, Z., et al. (2020). Assessment of flash flood risk based on improved analytic hierarchy process method and integrated maximum likelihood clustering algorithm. J. Hydrology 584, 124696–124757. doi:10.1016/j.jhydrol.2020.124696
Management, F. R. (2006). Flood risk management: hazards, vulnerability and mitigation measures. Berlin, Germany: Springer. doi:10.1007/978-1-4020-4598-1
Minea, G. (2013). Assessment of the flash flood potential of Bâsca river catchment (Romania) based on physiographic factors. Central Eur. J. Geosciences 5 (3), 344–353. doi:10.2478/s13533-012-0137-4
Mitra, R., and Das, J. (2023). A comparative assessment of flood susceptibility modelling of GIS - based TOPSIS, VIKOR, and EDAS techniques in the Sub - himalayan foothills region of Eastern India. Environ. Sci. Pollut. Res. 30, 16036–16067. doi:10.1007/s11356-022-23168-5
Mujib, M. A., Apriyanto, B., Kurnianto, F. A., Ikhsan, F. A., Nurdin, E. A., Pangastuti, E. I., et al. (2021). Assessment of flood hazard mapping based on analytical hierarchy process (AHP) and GIS: application in kencong district, jember regency, Indonesia. Geos. Indones. 6 (3), 353. doi:10.19184/geosi.v6i3.21668
Mukherjee, S., Aadhar, S., Stone, D., and Mishra, V. (2018). Increase in extreme precipitation events under anthropogenic warming in India. Weather Clim. Extrem. 20, 45–53. doi:10.1016/j.wace.2018.03.005
Munawar, H. S., Hammad, A. W. A., and Waller, S. T. (2022). Remote sensing methods for flood prediction: a review. Sensors 22 (3), 960. doi:10.3390/s22030960
Muneeb, F., Baig, S. U., and Khan, J. A. (2021). Inventory and GLOF susceptibility of glacial lakes in Hunza River basin. West. Karakorum, 118. doi:10.3390/rs13091794
Norman, L. M., Huth, H., Levick, L., Burns, I. S., Guertin, D. P., Semmens, D., et al. (2010). Flood hazard awareness and hydrologic modelling at Ambos Nogales, United States–Mexico border. J. Flood Risk Manag. 3, 151–165. doi:10.1111/j.1753-318X.2010.01066.x
Olii, M. R., Olii, A., and Pakaya, R. (2021). The integrated spatial assessment of the flood hazard using AHP-GIS: the case study of gorontalo regency. Indonesian J. Geogr. 53 (1). doi:10.22146/ijg.59999
Osman, S. A., and Das, J. (2023). GIS-based flood risk assessment using multi-criteria decision analysis of Shebelle River Basin in southern Somalia. SN Appl. Sci. 5 (5), 134. doi:10.1007/s42452-023-05360-5
Otto, F. E. L., Zachariah, M., Saeed, F., Siddiqi, A., Kamil, S., Mushtaq, H., et al. (2023). Climate change increased extreme monsoon rainfall, flooding highly vulnerable communities in Pakistan. Environ. Res. Clim. 2 (2), 025001. doi:10.1088/2752-5295/acbfd5
Papaioannou, G., Vasiliades, L., and Loukas, A. (2015). Multi-criteria analysis framework for potential flood prone areas mapping. Water Resour. Manag. 29 (2), 399–418. doi:10.1007/s11269-014-0817-6
Paquette, J., and Lowry, J. (2012). Flood hazard modelling and risk assessment in the Nadi River Basin, Fiji, using GIS and MCDA. S. Pac. J. Nat. Appl. Sci. 30 (1), 33. doi:10.1071/sp12003
Patrikaki, O., Kazakis, N., Kougias, I., Theodossiou, N., Voudouris, K., and Patsialis, T. (2023). Assessing flood hazard at River basin scale with an index-based approach: the case of mouriki, Greece. Geosciences 8, 50. doi:10.3390/geosciences8020050
Plate, E. J. (2002). Flood risk and flood management. J. Hydrology 267 (1–2), 2–11. doi:10.1016/S0022-1694(02)00135-X
Pradhan, B. (2009). Flood susceptible mapping and risk area delineation using logistic regression, GIS and remote sensing. J. Spatial Hydrology 9 (2), 1–18.
Pradhan, B. (2011). Use of GIS-based fuzzy logic relations and its cross application to produce landslide susceptibility maps in three test areas in Malaysia. Environ. Earth Sci. 63 (2), 329–349. doi:10.1007/s12665-010-0705-1
Print, C. R., Fry, M. J., Print, C. R., Fry, M. J., Gadain, H., Muchiri, P., et al. (2011). An assessment of the surface water resources of the Juba-Shabelle basin in southern Somalia. Hydrological Sci. J. 56, 6667. doi:10.1080/02626667.2011.585470
Quagliolo, C., Comino, E., and Pezzoli, A. (2021). Experimental flash floods assessment through urban flood risk mitigation (UFRM) model: the case study of Ligurian coastal cities. Front. Water 3, 663378. doi:10.3389/frwa.2021.663378
Rahim, I., Ali, S. M., and Aslam, M. (2018). GIS based landslide susceptibility mapping with application of analytical hierarchy process in district ghizer, gilgit baltistan Pakistan. J. Geoscience Environ. Prot. 06 (02), 34–49. doi:10.4236/gep.2018.62003
Rahmati, O., Zeinivand, H., and Besharat, M. (2016). Flood hazard zoning in Yasooj region, Iran, using GIS and multi-criteria decision analysis. Geomatics, Nat. Hazards Risk 7 (3), 1000–1017. doi:10.1080/19475705.2015.1045043
Region AJ and K Region AJ and K balochistan injured remarks sindh total province/region AJ and K Punjab TOTAL roads (km) houses FD live-stock total. (2022). 1, 1–5.
Rinc, D., Khan, U. T., and Armenakis, C. (2018). Flood risk mapping using GIS and multi-criteria analysis: a greater Toronto area case study. Geosciences 8, 275. doi:10.3390/geosciences8080275
Robert, B., and Brown, E. B. (2004). No Covariance structure analysis of health-related indicators for elderly people living at home, focusing on subjective sense of health.
Saaty, T. L. (1990). How to make a decision: the analytic hierarchy process. Eur. J. Operational Res. 48 (1), 9–26. doi:10.1016/0377-2217(90)90057-I
Saaty, T. L., and Saaty, T. L. (2013). The modern science of multicriteria decision making and its practical applications: the AHP/ANP approach. Operations Res. 61, 1101–1118. doi:10.1287/opre.2013.1197
Sarkar, S. (2022). Pakistan floods pose serious health challenges. Bmj, o2141. doi:10.1136/bmj.o2141
Shafizadeh-Moghadam, H., Valavi, R., Shahabi, H., Chapi, K., and Shirzadi, A. (2018). Novel forecasting approaches using combination of machine learning and statistical models for flood susceptibility mapping. J. Environ. Manag. 217, 1–11. doi:10.1016/j.jenvman.2018.03.089
Shah, S. S., and Rana, I. A. (2023). Institutional challenges in reducing disaster risks in the remote city of Hindukush-Karakorum-Himalayan (HKH) region, Pakistan. Int. J. Disaster Risk Reduct. 88, 103581. doi:10.1016/J.IJDRR.2023.103581
Stefanidis, S., and Stathis, D. (2013). Assessment of flood hazard based on natural and anthropogenic factors using analytic hierarchy process (AHP). Nat. Hazards 68 (2), 569–585. doi:10.1007/s11069-013-0639-5
Tehrany, M. S., Lee, M. J., Pradhan, B., Jebur, M. N., and Lee, S. (2014a). Flood susceptibility mapping using integrated bivariate and multivariate statistical models. Environ. Earth Sci. 72 (10), 4001–4015. doi:10.1007/s12665-014-3289-3
Tehrany, M. S., Pradhan, B., and Jebur, M. N. (2014b). Flood susceptibility mapping using a novel ensemble weights-of-evidence and support vector machine models in GIS. J. HYDROLOGY 512, 332–343. doi:10.1016/j.jhydrol.2014.03.008
Teng, J., Jakeman, A. J., Vaze, J., Croke, B. F. W., Dutta, D., and Kim, S. (2017). Flood inundation modelling: a review of methods, recent advances and uncertainty analysis. Environ. Model. Softw. 90, 201–216. doi:10.1016/j.envsoft.2017.01.006
Ullah, K., and Id, J. Z. (2020). GIS-based flood hazard mapping using relative frequency ratio method: a case study of Panjkora River Basin, eastern Hindu Kush. PLoS One 25, 1–18. doi:10.1371/journal.pone.0229153
Valjarević, A., Popovici, C., Štilić, A., and Radojković, M. (2022). Cloudiness and water from cloud seeding in connection with plants distribution in the Republic of Moldova. Appl. Water Sci. 12 (12), 262. doi:10.1007/s13201-022-01784-3
Waseem, M., Ahmad, S., Ahmad, I., Wahab, H., and Leta, M. K. (2023). Urban flood risk assessment using AHP and geospatial techniques in swat Pakistan. SN Appl. Sci. 5 (8), 215. doi:10.1007/s42452-023-05445-1
Werritty, A. (2006). Sustainable flood management: oxymoron or new paradigm? Area 38 (1), 16–23. doi:10.1111/j.1475-4762.2006.00658.x
Wooldridge, S., Kalma, J., and Kuczera, G. (2001). Parameterisation of a simple semi-distributed model for assessing the impact of land-use on hydrologic response. J. Hydrology 254 (1–4), 16–32. doi:10.1016/S0022-1694(01)00489-9
Yahaya, S. (2008). Multicriteria analysis for flood vulnerable areas in hadejia-jama’are river Basin, Nigeria. Eur. J. Sci. Res. 42, 777–785.
Yalcin, A. (2008). GIS-based landslide susceptibility mapping using analytical hierarchy process and bivariate statistics in Ardesen (Turkey): comparisons of results and confirmations. Catena 72 (1), 1–12. doi:10.1016/j.catena.2007.01.003
Yaseen, M. W., Awais, M., Riaz, K., Rasheed, M. B., Waqar, M., and Rasheed, S. (2022). Artificial intelligence based flood forecasting for river Hunza at danyor station in Pakistan. Archives Hydroengineering Environ. Mech. 69 (1), 59–77. doi:10.2478/heem-2022-0005
Yilmaz, O. S. (2022). Flood hazard susceptibility areas mapping using analytical hierarchical process (AHP), frequency ratio (FR) and AHP - FR ensemble based on geographic information systems (GIS): a case study for kastamonu, türkiye. Acta Geophys. 70 (6), 2747–2769. doi:10.1007/s11600-022-00882-9
Youssef, A. M., and Hegab, M. A. (2019). “Flood-hazard assessment modeling using multicriteria analysis and GIS,” in Spatial modeling in GIS and R for Earth and environmental Sciences (Amsterdam, Netherlands: Elsevier Inc). doi:10.1016/b978-0-12-815226-3.00010-7
Youssef, A. M., Pradhan, B., and Hassan, A. M. (2011). Flash flood risk estimation along the St. Katherine road, southern Sinai, Egypt using GIS based morphometry and satellite imagery. Environ. Earth Sci. 62, 611–623. doi:10.1007/s12665-010-0551-1
Keywords: flood risk assessment, geospatial technology, big climate data, multi-criteria decision analysis (MCDA), Hunza Nagar Valley, floods
Citation: Mukhtar MA, Shangguan D, Ding Y, Anjum MN, Banerjee A, Butt AQ, Nilesh yadav , Li D, Yang Q, Khan AA, Muhammad A and He BB (2024) Integrated flood risk assessment in Hunza-Nagar, Pakistan: unifying big climate data analytics and multi-criteria decision-making with GIS. Front. Environ. Sci. 12:1337081. doi: 10.3389/fenvs.2024.1337081
Received: 12 November 2023; Accepted: 30 January 2024;
Published: 12 February 2024.
Edited by:
Deepak Kumar, University at Albany, United StatesReviewed by:
Muhammad Farjad Sami, Ghent University, BelgiumAleksandar Valjarević, University of Belgrade, Serbia
Copyright © 2024 Mukhtar, Shangguan, Ding, Anjum, Banerjee, Butt, Nilesh yadav, Li, Yang, Khan, Muhammad and He. This is an open-access article distributed under the terms of the Creative Commons Attribution License (CC BY). The use, distribution or reproduction in other forums is permitted, provided the original author(s) and the copyright owner(s) are credited and that the original publication in this journal is cited, in accordance with accepted academic practice. No use, distribution or reproduction is permitted which does not comply with these terms.
*Correspondence: Donghui Shangguan, ZGhndWFuQGx6Yi5hYy5jbg==