 Guojun Sheng
 Zhiyuan Sun1
 Mingyue Xue
 Danlan Xie
- 1School of Information and Business Management, Dalian Neusoft University of Information, Dalian, China
- 2College of Artificial Intelligence and E-Commerce, Zhejiang Gongshang University Hangzhou College of Commerce, Hangzhou, China
In light of the interrelated origins and processes of greenhouse gas (GHG) and atmospheric pollutant emissions, countries around the world are actively seeking synergistic strategies for their reduction. Urban transportation represents a critical sector for GHG and air pollutant emissions; however, the effectiveness of existing collaborative measures has proven inadequate. This ineffectiveness primarily stems from a focus on terminal emission reductions, neglecting potential pollutant emissions that arise during implementation. To address this gap, this paper develops seven scenarios for coordinated emission reductions in urban transportation and employs econometric methods to quantitatively assess the effectiveness of these strategies throughout their entire lifecycle. Furthermore, the evaluation integrates key indicators, such as synergistic emission reduction, a coordinated control system, and cross-elasticity, to provide a comprehensive analysis of the proposed measures. This paper uses Shenyang, China, as a case study, revealing that enhancing fuel quality emerges as the most critical strategy for synergistic emission reduction. Although the comprehensive synergistic emission reductions associated with rail transit and low-carbon travel are not the highest, they demonstrate a significant linkage effect. Although the promotion of new energy vehicles (NEVs) offers substantial terminal emission reductions, their energy generation processes and consumption during charging classify them as non-synergistic measures. This study addresses the prevalent issue of overemphasizing terminal governance, providing valuable insights for policymakers in the urban transportation sector. It facilitates a deeper understanding of the synergistic control characteristics of various measures, enabling the identification of effective strategies and the exploration of their interconnections.
1 Introduction
Urban transportation is characterized by dense road networks, a high density of motor vehicles, and significant energy consumption and pollution emissions, making it a major contributor to greenhouse gas (GHG) and air pollutant emissions. As of 2023, this sector has the fastest growth rate in carbon dioxide (CO2) emissions among all industries, accounting for approximately 17%–23% of global GHG emissions. Projections indicate that transportation-related CO2 emissions could increase by 57% by 2030, significantly outpacing growth in other sectors worldwide (Speizer et al., 2024). The primary exhaust emissions from urban transportation include carbon monoxide (CO), sulfur dioxide (SO2), nitrogen oxides (NOx), and hydrocarbons (CHx). Notably, the first three pollutants are highly hazardous, with mobile sources contributing over 20% of emissions in most large and medium-sized cities (Davidson et al., 2020).
GHGs and atmospheric pollutants share common characteristics, including identical origins, sources, processes of emission, frequencies, effects, governance pathways, and management objectives (Jiménez et al., 2015). Early research often treated GHG emissions and atmospheric pollutants in isolation; GHG mitigation primarily relied on energy policies, whereas atmospheric pollutant control was typically achieved through end-of-pipe measures (Wang et al., 2020). Since the 1990s, the Intergovernmental Panel on Climate Change (IPCC) has introduced the concept of synergistic governance for GHGs and atmospheric pollutants, initiating extensive research into their synergistic effects. Initial studies predominantly focused on evaluating one-way synergistic relationships, such as “from carbon to pollution” or “from pollution to carbon.”
In recent years, there has been increasing focus on evaluating the synergistic effects of comprehensive emission-reduction measures through policy analysis, model applications, and case discussions, resulting in a robust theoretical framework that supports the formulation of energy and environmental development policies (Xu et al., 2024; Xin et al., 2024). However, it is important to acknowledge that current research predominantly remains theoretical, with limited exploration of synergistic emission-reduction measures in specific domains. Particularly within urban transportation, the effectiveness of synergistic approaches is influenced by regional policy environments, residents’ travel behaviors, transportation and energy usage patterns, and pricing variations (Guzman et al., 2015). Consequently, existing research findings are not easily translatable to practical applications. To effectively select and implement synergistic emission-reduction measures, comprehensive planning must be grounded in quantitative research methods rooted in econometrics, an area that remains underexplored.
Countries worldwide have implemented various strategies to mitigate pollution and carbon emissions; however, the governance outcomes have not met expectations. Three primary reasons contribute to this issue (Oyewo et al., 2024). First, there are instances of “pollution reduction without carbon reduction” and vice versa, highlighting a lack of scientific evaluation to determine the coordination of carbon and pollution reduction effects or to assess the degree of synergy between them (Chen et al., 2023). Second, some measures focus solely on emission-end reductions without considering impacts throughout the entire lifecycle. Although certain new energy sources may demonstrate significant synergistic effects at the emission end, the energy generation processes can consume substantial electricity and emit GHGs and atmospheric pollutants that have not been quantitatively assessed (Junne et al., 2020). Finally, the coexistence of numerous pollution and carbon reduction measures, alongside differing implementing and regulatory entities, often leads to the prioritization of individual interests, resulting in conflicts and obstacles during implementation (Mahoney et al., 2022).
To address these challenges, this paper introduces the concept of a whole lifecycle approach, facilitating bidirectional coordination between “carbon to pollution” and “pollution to carbon” throughout the entire “source-process-end” continuum of GHGs and atmospheric pollutants (Wu et al., 2023). This approach mitigates the risk of increasing emissions within the supply chain due to an overly narrow focus on individual pollution reduction or carbon reduction measures. Then, by using the concept of “synergistic emission reduction equivalent,” this paper converts the emission reductions of various local air pollutants and greenhouse gases into a unified unit of measurement, thereby facilitating the comparison of emission-reduction effects of different measures (Zhang H. et al., 2023). This assessment is complemented by indicators such as the synergistic control-effect coordinate system and the cross-elasticity of pollutant emission reductions. A scientific evaluation of the governance effects of measures aimed at reducing pollution and carbon emissions is conducted within a consistent framework, allowing for the classification of emission-reduction measures into strong, weak, and non-synergistic categories (Cheng et al., 2024). Finally, adopting a system’s engineering perspective, the paper proposes a balanced strategy that reconciles the interests of multiple stakeholders. This strategy aims to enhance collaborative efforts for reducing pollution and carbon emissions within the urban transportation sector.
This paper examines the mechanisms of synergistic strategies for reducing GHG emissions and atmospheric pollutants in urban transportation. Such strategies not only enhance the theoretical framework for urban environmental governance but also minimize resource waste in controlling both GHG emissions and local air pollutants, thereby increasing governance efficiency. By elucidating the interrelationships among stakeholders within the synergistic governance framework, this research delineates the responsibilities of various actors, addressing governmental function “blind spots.” This approach aims to strengthen environmental regulations and operational standards while facilitating effective engagement from societal forces in urban environmental protection and low-carbon development. Furthermore, through a rigorous evaluation of the governance effects of these synergistic measures, this study offers scientific support for strategic combinations and lean management practices, thus mitigating extreme “movement-style” and “shock-style” initiatives. Ultimately, it seeks to align pollution reduction and carbon mitigation efforts with economic and social development principles.
The remainder of this paper is organized as follows: Section 2 introduces the measurement methods employed for the emission-reduction strategies discussed, detailing the principles of synergistic accounting methods, including the synergistic emission reduction equivalent, the synergistic control-effect coordinate system, and the cross-elasticity of pollutant emission reduction across various synergistic scenarios. Section 3 presents the measurement results and their analysis. Section 4 critically examines the differences between the findings of this study and those of related research, exploring the underlying reasons for these discrepancies, along with the scientific basis and implementation pathways for strategic combinations aimed at enhancing governance effectiveness. Finally, Section 5 concludes the paper by summarizing the key insights and implications of the research.
2 Methodology
2.1 Introduction to the research framework
This paper uses the concept of synergistic emission reduction for GHGs and atmospheric pollutants, conducting a measurement of pollutant emission reductions and a comprehensive evaluation of emission-reduction measures from a “whole lifecycle” perspective. The research process is illustrated in Figure 1 and consists of the following steps.
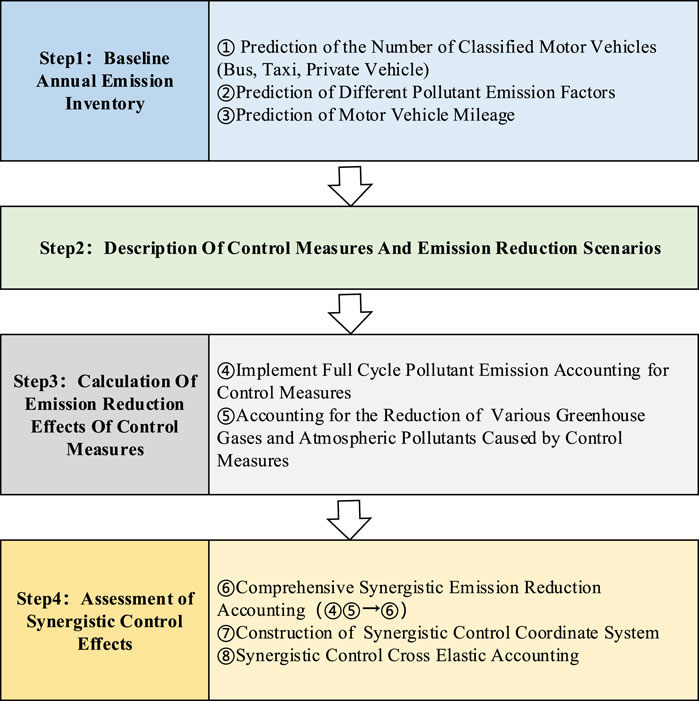
Figure 1. Research process of synergistic emission reduction for GHGs and atmospheric pollutants. Step 1: Identify the evaluation case, establish the base year and target year, and develop an emission inventory for the baseline year. Step 2: Design synergistic emission reduction measures tailored to the specific policy orientation, residents’ travel behaviors, energy pricing, and infrastructure configuration of the selected case city. Step 3: Conduct a comprehensive assessment of the effectiveness of these synergistic measures, emphasizing not only the intended implementation outcomes but also the potential pollutant emissions that may arise during the implementation process. Step 4: Establish a synergistic control coordinate system to facilitate a thorough evaluation of emission reduction measures, using key indicators such as cross elasticity and integrated synergistic emission reduction.
2.2 Baseline annual emission inventory
This paper selects Shenyang, China, as a case study due to its status as a significant urban center in northern China characterized by high population density and economic development. Historically an industrial hub, Shenyang has faced challenges with GHG and atmospheric pollutant emissions that frequently exceed regulatory standards. Over the past decade, the city has pursued a green transformation, drawing on the construction experiences of environmentally friendly cities both domestically and internationally while implementing various GHG and pollutant reduction strategies. However, early efforts were often hampered by a limited understanding of synergistic reduction effects, leading to a focus on the separate management of GHG and atmospheric pollutant emissions, which created barriers between complementary measures. The selection of Shenyang for this case study holds significant relevance for advancing coordinated approaches to urban air quality management, offering insights applicable to other cities in China and around the world.
The evaluation of synergistic reductions in GHG emissions and atmospheric pollutants is grounded in the differences observed in annual baseline emissions. This study designates 2024 as the base year for analysis and projects key variables, including the number of motor vehicles, average annual mileage, and atmospheric pollutant emission factors in Shenyang City through 2030. Using these projections, the paper calculates the synergistic emission-reduction effects across various strategic scenarios, providing a comprehensive assessment of potential outcomes and informing policy recommendations for effective urban environmental management.
2.2.1 Prediction of motor vehicle ownership
The ownership of motor vehicles is characterized by typical time series data, which can be analyzed and predicted using the autoregressive integrated moving average (ARMA) model. This model combines elements of both autoregressive (AR) and moving average (MA) components to capture the autocorrelation and smoothing characteristics present in time series data through linear combinations. A key advantage of the ARMA model is its ability to yield simpler models when the goodness of fit among various models is comparable, making it particularly effective for predicting stationary time series data. In practical applications, the growth in motor vehicle ownership is influenced by numerous factors, including economic growth, income levels, urbanization, and transportation policies. The ARMA model identifies the impact patterns of these factors on vehicle ownership changes by analyzing historical data, thus facilitating accurate predictions that can inform future urban transportation planning and policy decisions.
The ARMA model can usually be expressed as given in Equation 1:
Here,
2.2.2 Annual average mileage prediction
Previous studies indicate that urban planning significantly influences motor vehicle mileage (Ewing et al., 2013). First, urban structure—encompassing spatial layout, population density, and the distribution of functional areas—directly shapes travel needs and modes, thereby impacting vehicle mileage. Second, the efficiency and coverage of the urban transportation network, including roads and public transit systems, affect both the frequency and distance of vehicle use; a well-integrated transportation network enhances vehicle utilization and overall mileage (Lebedeva and Savvateeva, 2023). Furthermore, transportation policies, such as driving restrictions, license plate regulations, congestion charges, and support for public transport and non-motorized travel, also play crucial roles in determining vehicle mileage. Additionally, urban planning elements, including land use, the convenience of public transportation, urban design, and the development of new zones, exert varying degrees of influence on motor vehicle mileage (Ihlanfeldt, 2020).
In summary, average annual driving mileage is affected by numerous external factors, and its prediction relies primarily on historical data analysis, supplemented by considerations of urban development planning. The results of these forecasts are discussed in detail in the Results section.
2.2.3 Emission factor prediction
This paper uses official city data sources to predict the comprehensive emission factors for urban motor vehicles. Specifically, it examines the following emission factors: the emission factor of gasoline-powered motor vehicles (EFGi,j), the emission factor of electric motor vehicles (EFEi,j), and the emission factor of natural gas-powered motor vehicles (EFNGi,j). Each factor refers to the comprehensive emissions of the jth type of vehicle powered by gasoline, electricity, or natural gas, measured in grams per kilometer (g/km) for the ith type of atmospheric pollutant or GHG. The pollutants analyzed include three common atmospheric pollutants and one GHG in urban transportation, designated as follows: i = 1 for CO, i = 2 for NOx, i = 3 for SO2, and i = 4 for CO2. The vehicle types are categorized as follows: j = 1 for buses, j = 2 for ordinary taxis, j = 3 for online ride-hailing services, and j = 4 for private vehicles.
For the calculation of the EFGi,j, CO and NOx emission limit data are obtained from the “Emission Limits and Measurement Methods for Light-Duty Vehicle Pollutants” (Phase V). The SO2 emission factor is derived from the national standard of 10 ppm for the gasoline sulfur content, resulting in an SO2 emission of 0.028 g per liter of gasoline consumed. Consequently, the converted emission factor for SO2 is EFG3,4 = 0.08 × 0.028 = 0.002 g/km (Statistics, 2023). Here, 0.08 indicates that the average fuel consumption per kilometer of small passenger vehicles in China is 0.08 L. The data come from China’s official statistics. For CO2 emissions, calculations based on the combustion equation indicate the emission of 2,400 g per liter of gasoline burned, leading to a converted emission factor of EFG4,4 = 0.08 × 2,400 = 192 g/km. Ordinary taxis, online ride-hailing services, and private vehicles, all classified as small passenger vehicles, share the same comprehensive emission factor, represented as EFG private vehicles = EFG ordinary taxis = EFG online ride-hailing services. Furthermore, since the fuel consumption per kilometer for buses is four times that of small passenger vehicles—0.32 L per kilometer for buses compared to 0.08 L per kilometer for small vehicles—the emission factor for buses is calculated as EFG buses = 4 × EFG private vehicles.
This paper uses the following calculation formula given in Equation 2 for accounting EFEi,j:
Assuming that by 2030, thermal power generation will constitute 50% of total electricity generation, while the remaining 50% will be derived from wind, solar, and other non-fossil energy sources, the analysis focuses solely on the pollutants emitted during the power generation process, excluding indirect environmental impacts from other lifecycle stages. Let
In the calculation of the EFNGi,j, only ordinary taxis and buses, which use natural gas as fuel, are considered. The CO emission factor for small passenger vehicles running on natural gas is estimated to be 0.1 times that of gasoline-powered small passenger vehicles, expressed as EFNG4,1 = 0.1EFG4,1. Similarly, the NOx emission factor for these vehicles is estimated to be 0.7 times that of their gasoline counterparts, represented as EFNG4,2 = 0.7EFG4,2. The sulfur content of Class III natural gas for civilian use is limited to a maximum of 460 mg/m3. Consequently, the SO2 emissions per cubic meter of combusted natural gas are calculated to be 0.92 g. Given that small passenger vehicles consume approximately 8 m3 of gas per 100 km, the emission factor for SO2 can be expressed as EFNG3,2 = 0.92 × 8/100 = 0.0736 g/km. For CO2 emissions, based on the combustion equation, the emissions per cubic meter of combusted natural gas are 1,890 g. Given the same gas consumption of approximately 8 m3 per 100 km for small passenger vehicles, the CO2 emission factor is calculated as EFNG4,2 = 1,890 × 8/100 = 1,512 g/km. For buses, which consume approximately 30 m3 of gas per 100 km, the relationship with small passenger vehicles can be established as EFNG buses = 30/8 × EFNG private vehicles. This approach ensures that the comprehensive emission factors for natural gas-powered ordinary taxis and buses are accurately calculated, reflecting their respective operational characteristics.
The prediction of emission factors is complicated, so we briefly summarize the prediction process. First, we found the basic data of emission factor prediction in official statistical information such as Emission Limits and Measurement Methods for Light Vehicle Pollutants, China Power Industry Development Report, and China Mobile Source Environmental Management Annual Report Second, for individual missing data, we use data processing methods to complete the data according to the trend of factor changes. Finally, we combine Formula 2 and the calculation of carbon emission/sulfur emission chemical equations, power generation method weighting calculations, and other methods to calculate the emission factors. Due to the large differences in the calculation methods used for different emission factors and the limited space available in the main text, the process of emission factor determination is shown in Supplementary Appendix Table S2.
2.3 Control measures and scenario descriptions
This paper develops a synergistic emission-reduction strategy set categorized into three primary dimensions, namely, traffic control, technological innovation, and structural adjustment. Each category includes secondary strategies, which are described in detail, alongside specific implementation intensity control indicators for the measures. These indicators are designed to ensure effective monitoring and evaluation of the strategies’ impact. A summary of these strategies and their corresponding indicators is presented in Table 1.
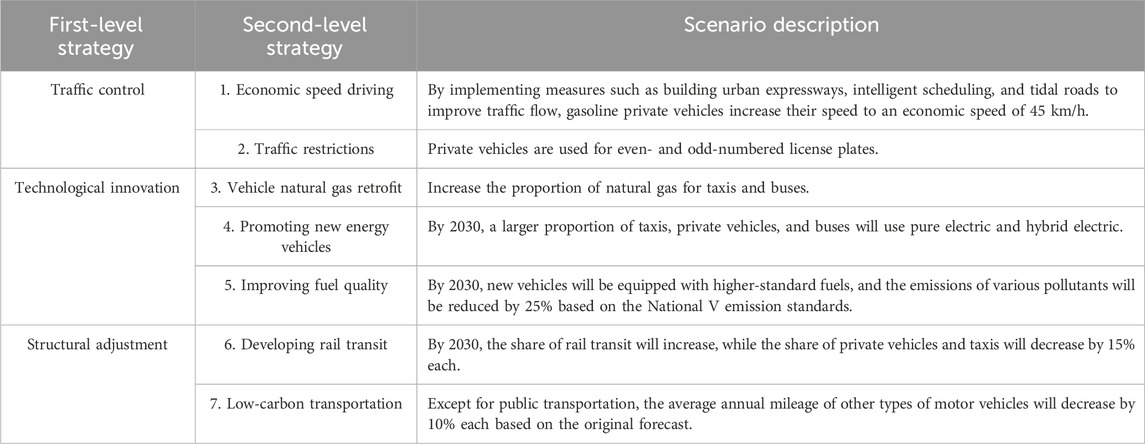
Table 1. Control measures and scenario descriptions.
2.4 Measurement of the emission-reduction effect
2.4.1 Economic speed driving
Economic vehicle speed is a widely discussed concept in the automotive industry and transportation economics, referring to the speed at which a vehicle achieves optimal fuel efficiency under specific conditions. Deviating from this speed—whether above or below—typically results in decreased fuel efficiency. Different vehicle models exhibit varying economic speeds; for instance, small cars may achieve optimal efficiency at speeds of 40–60 km/h, while larger vehicles or sports cars often have higher economic speeds. Maintaining an economical driving speed not only conserves fuel but also contributes to a reduction in GHG emissions, thereby positively impacting environmental protection (Yuan et al., 2022). Accordingly, this paper proposes increasing the average speed of gasoline-powered private vehicles in Shenyang from 30 to 45 km/h, aiming to enhance fuel efficiency and reduce emissions in the urban transport sector. The reduction in pollutants or GHG emissions caused by the increase in the economic vehicle speed can be expressed as follows (Xiao-mei et al., 2014; Xian-qiang et al., 2021):
Emission reduction amount = annual mileage of private cars × number of vehicles × (difference between economic speed and low − speed emission factors) × proportion of gasoline use
Due to space limitations, detailed formulas are presented in Supplementary Appendix S3. The detailed formulas for other strategies are also presented in Supplementary Appendix S3.
2.4.2 Traffic restrictions
Private vehicle number restrictions entail limiting access to roads based on the last digit of vehicle license plates, with buses and taxis exempt from this policy. Numerous studies have demonstrated that such restrictions significantly improve air quality. For instance, research conducted in a major urban center revealed substantial reductions in the concentrations of key pollutants, including CO, NOx, volatile organic compounds (VOCs), and particulate matter (PM 2.5 and PM 10), during the implementation of this policy. By comparing air quality data from before and after the restrictions, researchers observed daily concentrations of these pollutants decreasing by an average of 10–20 percent. Additionally, the rationing policy contributes to GHG emission reduction by controlling traffic flow, which subsequently lowers fuel consumption and CO2 emissions (Wei et al., 2020). Another study estimated that such curbs could decrease a city’s traffic-related CO2 emissions by approximately 15% (Hatzopoulou et al., 2022).
This paper proposes a measure to limit the number of private vehicles, aiming to reduce the proportion of gasoline-powered private vehicles by 40%. Consequently, the proportion of taxis is expected to increase by 15%, while the proportion of buses should remain unchanged. According to the policy planning of Shenyang City, online taxi-hailing services fall within this limit, whereas pure electric vehicles are exempt from restrictions. The specific calculations for synergistic emission reduction based on these changes are outlined as follows:
Emission reduction = Private car emission reduction (due to fewer trips) − Taxi emission increase (due to more trips).
2.4.3 Vehicle natural gas retrofit
The use of natural gas as a fuel in automobiles significantly reduces emissions primarily because its combustion generates fewer harmful pollutants than that of conventional gasoline or diesel fuels (Muhssen et al., 2024). The combustion of natural gas primarily produces CO2 and H2O while virtually eliminating SOx, NOx, and PM—common pollutants associated with traditional fuels. Furthermore, Shenyang benefits from readily available natural gas sources and possesses the necessary infrastructure to support the conversion of vehicles to natural gas, making it a viable option for enhancing urban air quality and reducing emissions.
The reduction in atmospheric pollutants and GHG emissions associated with the use of natural gas to power motor vehicles can be calculated using the following formula:
Emission reduction = ∑ average annual driving distance of each model × number of vehicles × (difference between gasoline/electricity and natural gas emission factors) × fuel use ratio.
2.4.4 Promoting new energy vehicles
Compared to traditional internal combustion engine vehicles, new energy vehicles (NEVs) produce almost no exhaust emissions during operation and demonstrate higher energy utilization efficiency (Feliciano et al., 2023). NEVs encompass battery electric vehicles (BEVs), plug-in hybrid electric vehicles (PHEVs), and fuel cell electric vehicles (FCEVs). According to urban planning in Shenyang City, it is anticipated that by 2030, a greater proportion of taxis, private vehicles, and buses will utilize BEVs and PHEVs. In type j motor vehicles, the proportion of gasoline vehicles is
Emission reduction = ∑ (pre-measure emissions of all types of motor vehicles − post-measure emissions).
2.4.5 Improving fuel quality
High-quality fuels generally contain fewer impurities and pollutants, enabling more complete and cleaner combustion, which subsequently reduces harmful emissions (Catapano et al., 2022). In this strategy, it is proposed that by 2030, gasoline- and oil-powered private vehicles will use higher-standard fuels, resulting in a 25% reduction in the emissions of various pollutants based on existing emission factors. The specific accounting method for this reduction can be outlined as follows:
Emission reduction = annual mileage of private cars × number of vehicles × proportion of gasoline used × reduction of emission factors (due to changes in fuel quality).
2.4.6 Developing rail transit
As an efficient and environmentally friendly mode of transportation, rail transit significantly contributes to reducing gaseous pollutant emissions due to its high energy efficiency and low per capita carbon footprint (Guo et al., 2023). It is projected that by 2030, the sharing rate of rail transit will continue to increase, while the sharing rates of private cars and taxis will decrease by 15% each.
The reduction in pollutants or GHGs resulting from the expansion of rail transit can be calculated using the following method:
Emission reduction = (private car emission reduction + taxi emission reduction) − increase in rail transit emission
2.4.7 Low-carbon transportation
Low-carbon transportation encompasses various behaviors aimed at minimizing greenhouse gas emissions and enhancing air quality, such as using public transit, cycling, walking, and operating new energy vehicles. This travel mode not only reduces our carbon footprint but also encourages healthier lifestyles while mitigating environmental impacts. In this context, if the increase in public travel does not lead to an increase in bus mileage—meaning that emissions remain stable—the reduction in pollutants or greenhouse gases can be calculated using the following approach:
Emission reduction = general taxi emission reduction + online car emission reduction + private car emission reduction (both due to mileage reduction).
2.5 Synergistic control-effect evaluation
2.5.1 Integrated air pollutant co-control emission reduction
Integrated Air Pollutant Co-control Emission Reduction (ICER) serves as a valuable metric for evaluating the effectiveness of energy-saving measures or emission reduction strategies on both local atmospheric pollutants and GHGs. By converting the reductions in various local pollutants, such as SO2, NOx, and PM, alongside GHGs like CO2, into a unified measurement, ICER facilitates comparisons of the emission reduction impacts and synergies among different strategies or entities (Ge et al., 2023), (Xian-qiang et al., 2021). In this paper, the reductions in local atmospheric pollutants (CO, NOx, and SO2) and GHG (CO2) under varying control strategies are transformed into integrated atmospheric pollutant collaborative emission reductions (ICERn). It should be noted that PM is not included in the pollutant discharge list in this study for the following reasons: first, there are limitations to the measurement methods. The measurement of pollutant emission factors is usually based on the MOBILE/MOVES method. This method is more suited for gaseous pollutants (HC, CO, and NOx), and the ability to estimate PM is relatively weak. Most of the components of PM 2.5 (e.g., sulfates and nitrates) come from secondary transformations of gaseous pollutants, while MOBILE/MOVES only counts primary particles emitted directly. In addition, PM pollution arises not only from exhaust emissions but also from non-exhaust sources, such as braking, tire wear, and road dust. Existing emission factor models make it difficult to accurately estimate PM emissions from the abovementioned pathways. Second, PM measurement varies greatly in different versions of the national standard. China’s light vehicle pollutant emission standards previously set PM limits only for diesel vehicles; however, with the launch of National Standard 6, set PM emission limits were extended to all gasoline vehicles. According to 2023 data estimates, by 2030, vehicles complying with National Standard 4 and National Standard 5 will still account for 20%–30% of all gasoline vehicles. This will result in no standard for estimating PM emission factors. Third, there are differences in governance methods. In future research, the author plans to study the collaborative treatment of air pollutants and greenhouse gases on the basis of collaborative emission reduction. The atmospheric pollutants considered in this paper (NOx, CO, and SO2) and greenhouse gases exhibit strong synergies in disposal methods, but PM disposal often involves technologies such as particle traps and diesel particulate filters (DPFs), which do not share synergies with other pollutants.
Given that all greenhouse gases are commonly expressed in terms of CO2 equivalent (CO2eq) for emissions and warming potential assessments, this paper uses CO2eq directly for calculating GHG emission reductions.
In formula (3),
In formula (4),
In formula (5),
In formula (6),
2.5.2 Synergistic control coordinate system
The coordinate system of synergistic control effects serves as a powerful analytical tool for assessing the emission reduction impacts of various strategies on multiple pollutants, along with their synergistic interactions. In this two-dimensional or multidimensional framework, each coordinate axis represents the reduction in a specific pollutant, allowing for a clear visualization of how different measures contribute to overall emissions reductions. By projecting the results of emission-reduction strategies onto this system, stakeholders can intuitively understand the effectiveness of each measure and its interplay with others. This approach facilitates the evaluation of comprehensive benefits and the prioritization of strategies based on their synergistic potential ultimately enhances the coordinated management of greenhouse gases and local air pollutants, fostering more effective environmental governance (Wang et al., 2023).
In this coordinate system, the emission-reduction effect of local air pollutants is plotted along the horizontal axis, while the vertical axis represents the reduction effect of greenhouse gases. Focusing on the first quadrant, a larger angle between the line extending from a specific point to the origin and the horizontal axis indicates a more effective emission-reduction strategy for local air pollutants while simultaneously achieving the same level of greenhouse gas reduction. Furthermore, for lines at the same angle to the horizontal axis, a greater distance from the origin signifies a higher intensity of emission reduction achieved by the control measures for both local air pollutants and greenhouse gases. This visualization allows for a nuanced understanding of the efficacy and synergy of different emission-reduction strategies, enabling stakeholders to identify the most impactful measures for comprehensive environmental benefits.
2.5.3 Co-control cross elasticity
Co-control cross elasticity is a valuable economic measure that assesses the interaction between emission-reduction effects of different pollutants, providing insights into the interconnected impacts of various strategies. In the context of synergistic emission reduction, it is crucial to understand how the reduction of one pollutant can influence the reduction of another. For instance, enhancing fuel quality may lead to a decrease in sulfur and particulate emissions while also potentially increasing fuel costs, which could alter travel patterns. If individuals respond by using public transport more or shifting to new energy vehicles, this may yield a further reduction in CO2 emissions, demonstrating positive cross-elasticity. Conversely, if the improvements in fuel quality do not significantly alter travel behavior or if the increased costs deter emission reductions, the positive cross-elasticity may diminish. The calculation of cross-elasticity, as given in Equation 7 in this paper, provides a clearer picture of these relationships, informing more effective environmental policy decisions.
Here,
2.5.4 Comprehensive performance evaluation
This paper aims to compare the comprehensive emission-reduction effects of various control strategies by conducting a thorough analysis of several key methodologies, including emission-reduction effect accounting, collaborative emission-reduction accounting, the synergistic control coordinate system, and the cross-elasticity of synergistic control among different strategies (Yue et al., 2024; Ji et al., 2024; Jing et al., 2024; Wang et al., 2024). The findings from these analyses will be utilized to classify the degree of coordination among the various emission-reduction strategies, as outlined in Table 2. This classification provides insights into the effectiveness and interrelations of each strategy, highlighting synergies that can enhance overall emission-reduction efforts and support sustainable urban development.
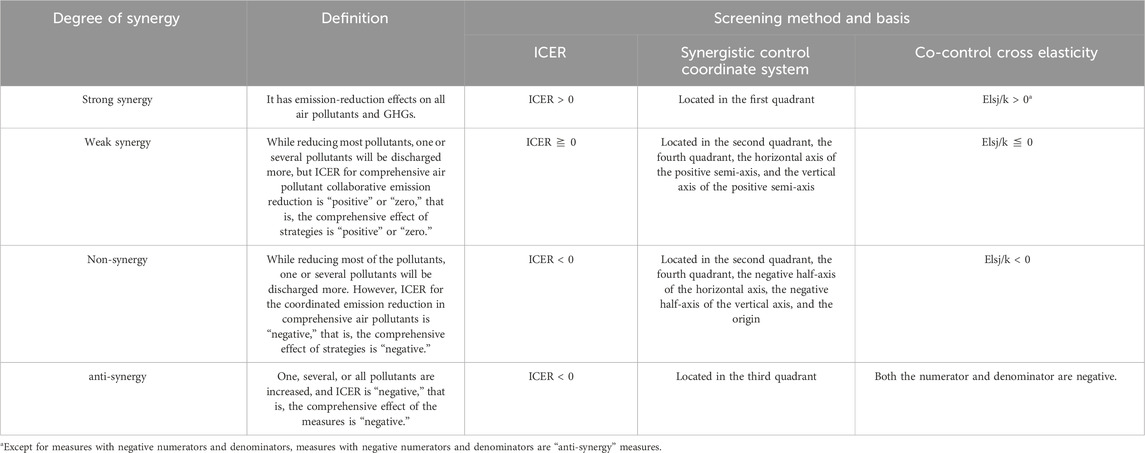
Table 2. Synergistic control performance evaluation of strategies.
In order to further increase the differentiation degree of strategies with the same degree of synergy, this paper increases the evaluation criteria for synergistic emission-reduction effect, setting the comprehensive emission-reduction effect ICER > 8 × 10⁷ as good, 1 × 10⁷ < ICER ≤ 8 × 10⁷ as medium, and ICER ≤ 1 × 10⁷ as bad.
3 Results
3.1 Relevant index data of target year measurement
3.1.1 Forecast results of vehicle ownership
The ARMA model has a strong scientific nature in the trend of time series data, which is demonstrated in Section 2.3. It should be noted that the core focus of this paper is not only to predict the number of vehicles in 2030 but also to evaluate the collaborative emission-reduction effects of different strategies based on that projected vehicle count. Therefore, the prediction does not necessarily require very precise data. The ARMA model is also used in this paper to improve the scientific nature of the article. Formula 1 was applied to forecast vehicle ownership based on the data presented in Supplementary Appendix S1, with missing data filled through interpolation. The forecasts indicate that by 2030, Shenyang is projected to have 5,899 buses and 3,136,803 private cars. Given the increase in online taxi-hailing services, recent regulations mandate that all new e-hailing vehicles must be pure electric. Thus, it is assumed that 50,000 of the private vehicles will be designated as online taxi-hailing cars, all classified as electric. Additionally, the number of taxis is forecasted to be 19,902, modeled using ARMA (5, 2). Detailed predictions are summarized in Table 3.
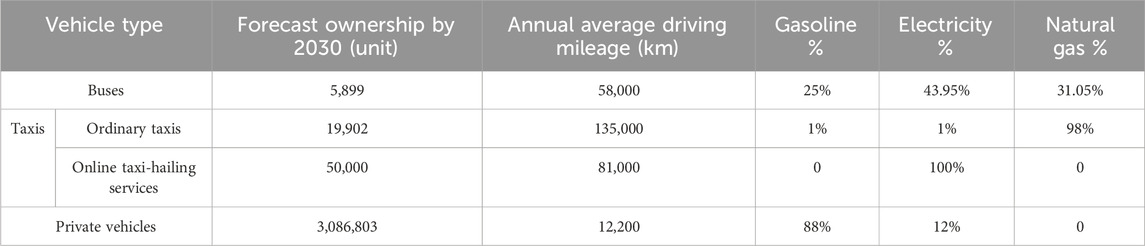
Table 3. Forecast of the vehicle ownership in Shenyang in 2030.
The forecast results underwent various validation tests, including fit degree tests and F-tests, confirming their reliability. However, since vehicle ownership forecasts are not the primary focus of this paper, detailed test results are not presented.
3.1.2 Annual mileage forecast
By examining the urban planning policies and average annual vehicle mileage in Shenyang over the past decade, it becomes evident that there have been no significant changes in either aspect. As such, the predicted annual vehicle mileage for 2030 will remain consistent with the survey data from 2024. Notably, since online taxi-hailing services utilize private vehicles, their operational time is typically 60% of that of ordinary taxis, leading to an average annual mileage that reflects this ratio. The specific forecast results are detailed in Table 4.
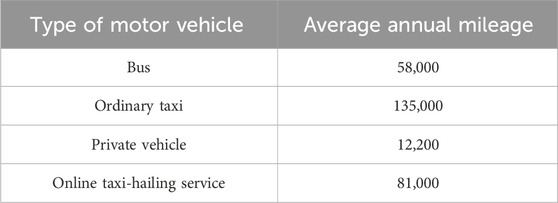
Table 4. Average annual mileage of motor vehicles in Shenyang in 2030.
3.1.3 Emission factor forecast
According to the forecasting methodology outlined in Section 2, the projected emission factors for motor vehicles in Shenyang for the year 2030 have been compiled and are presented in Table 5 (Tong et al., 2020; Zhang S. et al., 2023; Lee et al., 2011; Liu et al., 2023).
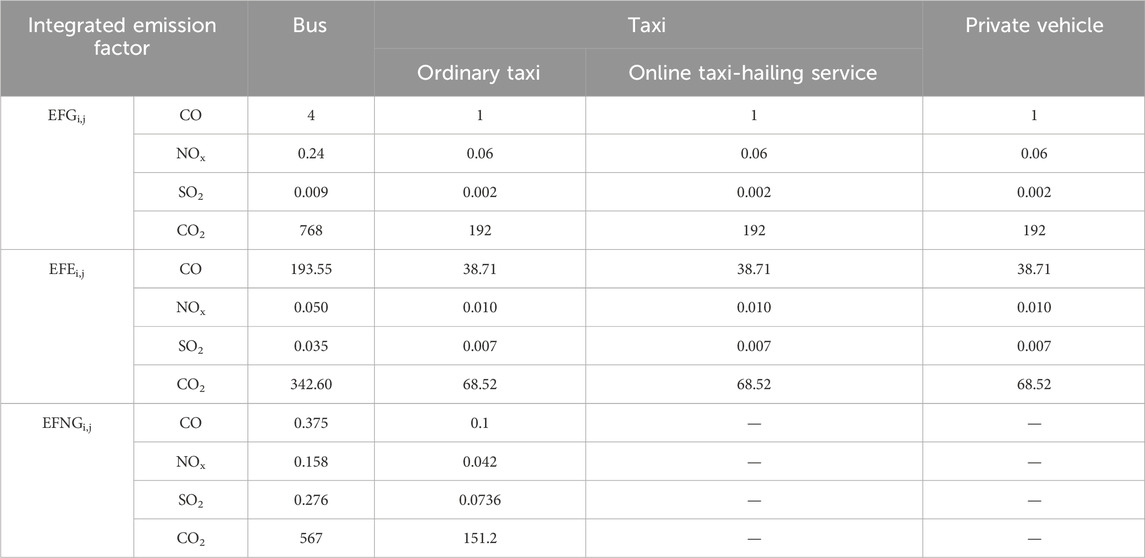
Table 5. Forecast of vehicle emission factors in Shenyang in 2030 (unit: g/km).
3.2 Measurement of the emission-reduction effect of control strategies
Through a quantitative analysis of seven distinct traffic control strategies, this paper demonstrates their potential impacts on reducing major atmospheric pollutants and greenhouse gas (CO2) emissions. The detailed accounting results are presented in Table 6.
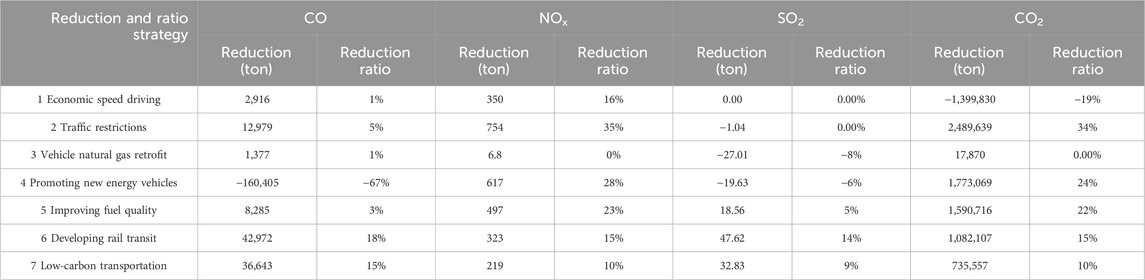
Table 6. Reduction in various atmospheric pollutants and CO2 under different control strategies (reduction ratio = emission reductions under strategy n/emissions without control strategies).
The calculation results indicate that Strategy 1 effectively reduces CO and NOx emissions due to increased combustion efficiency from higher speeds, although it does not impact SO2 and may actually increase CO2 emissions. Strategy 2 shows a substantial reduction in CO2 emissions, reaching approximately 2,489,639.12 tons, alongside decreases in CO and NOx, highlighting vehicle usage limitations as a viable pollution reduction approach. Strategy 3 provides some CO2 reduction but has less impact on CO and NOx due to natural gas’s combustion characteristics. Strategy 4 achieves the most significant CO2 reduction, approximately 1,773,068.88 tons, but has a negative effect on CO and SO2, indicating that while new energy vehicles reduce greenhouse gases, their overall synergistic effects warrant further investigation. Strategy 5 shows strong CO2 reduction, approximately 1,590,716.02 tons, while significantly lowering CO and NOx due to the complete combustion of high-quality fuels. Finally, strategies 6 and 7 yield similar outcomes, with noticeable reductions in CO2, CO, and NOx, but require more discussion on prioritizing their implementation due to lower coordinated emission reduction yields.
3.3 Comprehensive performance evaluation of synergistic emission reduction
3.3.1 Integrated air pollutant co-control emission reduction
The results of ICER calculations, based on formulas (3) to (6), are summarized in Table 7, allowing for easy comparison of their effectiveness in achieving synergistic reductions. The values presented highlight the relative contributions of each strategy to overall air quality improvement and greenhouse gas mitigation.
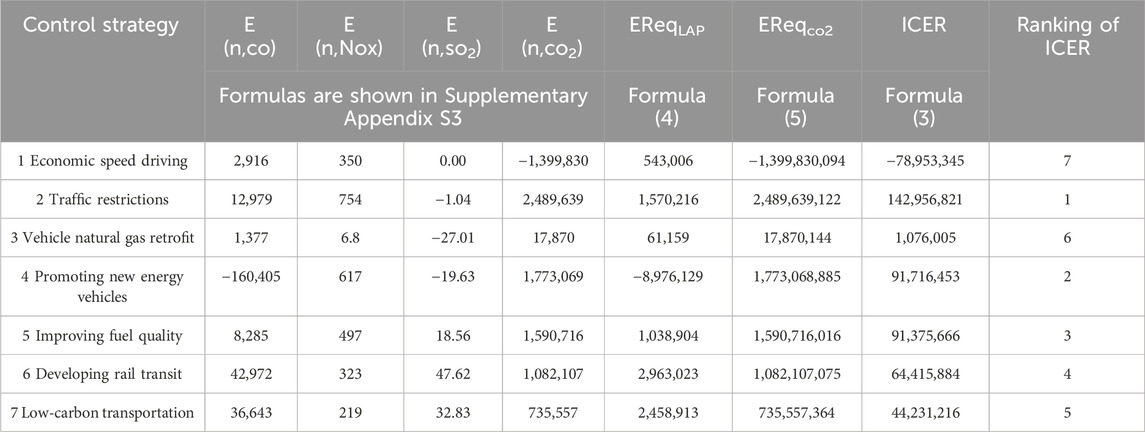
Table 7. Comprehensive overview of the emission reductions for various pollutants under different control strategies.
From the analysis of the results in Table 7, it is evident that the ICER value for strategy 1 is negative, indicating a poor overall synergistic emission-reduction effect. This outcome may be attributed to the increase in other pollutants or the high costs associated with emission reduction. Specifically, the increase in vehicle speed can result in greater energy requirements to overcome air resistance, particularly at higher velocities, potentially leading to increased fuel consumption and CO2 emissions.
Simply, increasing speed does not guarantee improved traffic mobility; it may actually exacerbate local traffic congestion due to excessive acceleration and deceleration, further contributing to emissions. Moreover, the fuel efficiency and design of different vehicles vary significantly, suggesting that increasing speed may not yield the desired emission reductions for all vehicle types, particularly older or less efficient models. Additionally, driving habits play a crucial role; frequent acceleration and sharp braking can negate the benefits of higher speeds by increasing fuel consumption and emissions. Thus, careful consideration of the application scenario for this measure is necessary when formulating specific policies.
Strategies 2–7 demonstrate positive synergistic effects with varying levels of ICER under different approaches. Notably, Strategy 2 has the highest ICER value, suggesting that it may be the most effective strategy for achieving synergistic emission reductions.
First, Strategy 2 directly reduces traffic flow by limiting the number of vehicles allowed on the road during specific times, leading to a decrease in overall pollutant emissions. Second, this strategy may encourage residents to opt for public transportation, non-motorized transport, or carpooling, all of which typically result in lower emissions per passenger than that of private vehicles.
Additionally, Strategy 2 encourages car owners to plan their usage more efficiently, minimizing ineffective driving and idle time, which contributes to further emission reductions. Finally, many implementations of Strategy 2 include exemptions or incentives for new energy vehicles, which produce significantly lower emissions than traditional fuel vehicles, thereby effectively decreasing overall pollutant levels.
This combination of direct traffic reduction, behavioral shifts, and support for cleaner vehicle options underscores the comprehensive benefits of Strategy 2 in achieving synergistic emission reductions.
3.3.2 Synergistic control coordinate system
In this paper, the coordinate system of synergistic control effects is illustrated by calculating the emission-reduction proportions of local air pollutants and CO2 under each strategy, as depicted in Figure 2. This visual representation allows for a clear comparison of how each strategy contributes to the reduction of different pollutants, highlighting their overall effectiveness and potential synergies. The axes of the coordinate system reflect the extent of emission reductions, providing insights into which strategies offer the most comprehensive benefits in terms of environmental impact.
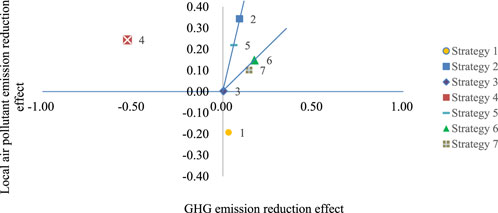
Figure 2. Synergistic control coordinate system under different control strategies (local air pollutant emission reduction effect = EReqLAP/emissions without control strategies, where EReqLAP refers to Table 7. GHG emission-reduction effect follows the same way).
In this paper, the synergistic emission-reduction effect of Strategy 5 is found to be better than that of Strategy 7, while Strategy 2 surpasses Strategy 5. Strategy 5 effectively reduces multiple air pollutants, including SOx and NOx, through improved fuel quality, impacting emissions across the entire lifecycle from production to use. This broader benefit extends to all vehicles, enhancing their overall effectiveness. Conversely, Strategy 2 adopts a direct approach by limiting the number of vehicles on the road, leading to an immediate reduction in traffic flow and pollutant emissions and providing quicker results. Although Strategy 5 reduces emissions per vehicle, it does not decrease the total vehicle count, making its overall impact less immediate than the direct effects of Strategy 2.
Strategy 4, positioned in the second quadrant, effectively reduces GHG emissions but leads to an increase in local air pollutants, indicating a trade-off. In contrast, Strategy 1 is in the fourth quadrant, suggesting that it increases GHG emissions while reducing local air pollutants. Both strategies 4 and 2 are less favorable from the collaborative perspective as they do not achieve a balanced reduction across all pollutants, highlighting the importance of selecting strategies that promote synergistic benefits.
3.3.3 Synergistic control cross elasticity
The calculation results based on formula (7) are presented in Table 8. This table summarizes the findings related to the integrated emission reduction impacts of the various strategies evaluated in the paper. Each strategy’s effectiveness in achieving synergistic benefits can be compared, facilitating a comprehensive understanding of their overall performance in reducing both GHG emissions and local air pollutants.
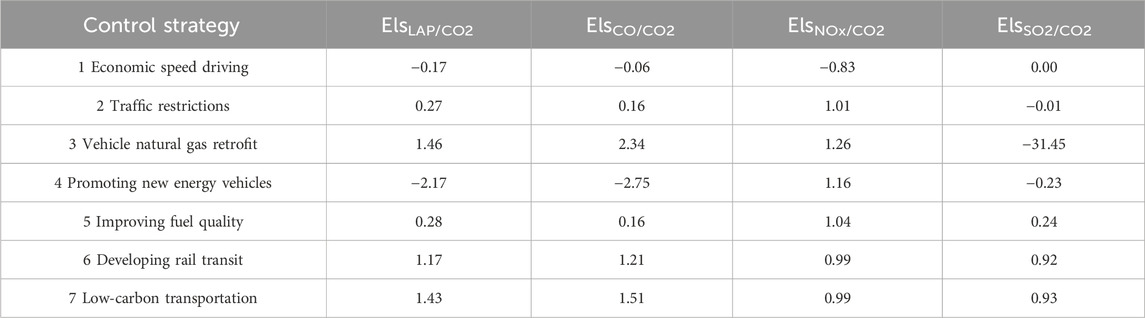
Table 8. Synergistic control cross-elasticity under different control strategies.
The calculation results indicate that strategies 5, 6, and 7 effectively reduce emissions of air pollutants and CO2, exhibiting significant synergistic control effects. In particular, Strategy 5 emerges as the most effective approach for addressing pollution at the source of motor vehicle energy supply as it reduces various air pollutants and CO2 emissions, thereby demonstrating robust synergistic benefits. Conversely, strategies 6 and 7 focus on energy conservation and emission reductions through alterations in travel modes, contributing to similar synergistic outcomes. Although the remaining four strategies show varying degrees of emission reduction, they lack true synergistic control effects. These strategies primarily achieve reductions during vehicle operation; however, they may generate additional emissions during production and manufacturing stages, resulting in an overall increase in pollutants. This underscores the importance of prioritizing source emission reductions to achieve comprehensive and sustainable environmental benefits.
3.3.4 Comprehensive performance evaluation
The comprehensive performance evaluation of the emission reduction strategies was conducted based on the criteria outlined in Table 3, with the findings presented in Table 9.
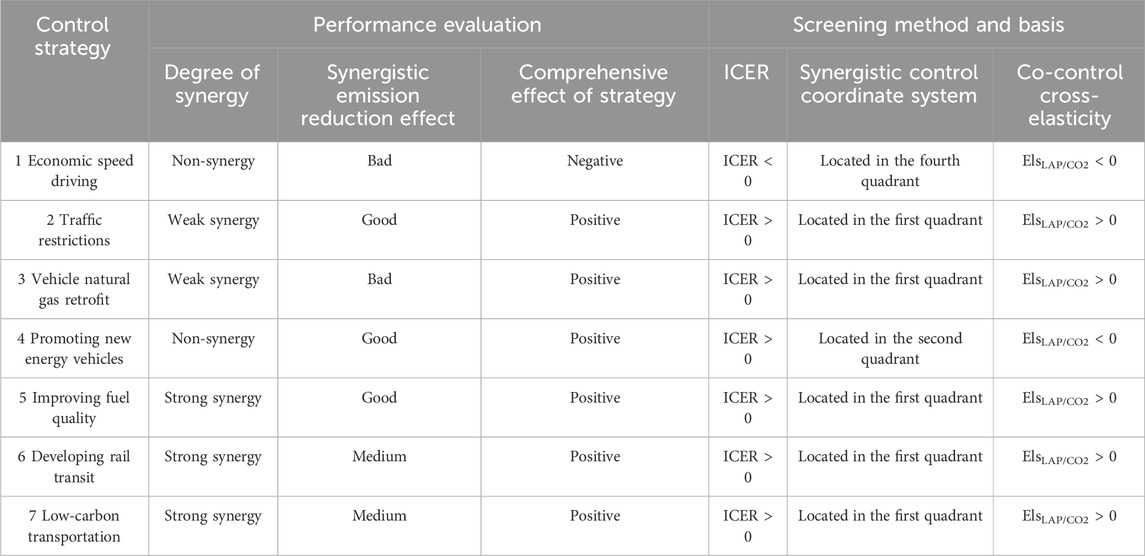
Table 9. Results of synergistic control performance evaluation under different control strategies.
Among the evaluated emission reduction strategies, strategies 5, 6, and 7 demonstrate effective reductions across various pollutants. In the cooperative control coordinate system, Strategy 2 outperforms Strategy 5, while Strategy 5 surpasses both strategies 6 and 7. Notably, only strategies 5, 6, and 7 exhibit positive cross-elasticity, indicating a beneficial cooperative control effect. Therefore, when considering all evaluation criteria comprehensively, Strategy 5 emerges as the most effective among the seven control strategies.
4 Discussions
This paper quantitatively evaluates the collaborative emission reduction strategies in the transportation sector of Shenyang from the perspective of a full life cycle and reveals significant differences from traditional terminal governance studies.
(1) This paper finds that Strategy 5 (improving fuel quality) is far more comprehensive and synergistic in emission reduction than other strategies. This result is in contrast to the findings of Huo et al. (2015): The latter is based on the terminal emission data of 10 Chinese cities, indicating that fuel quality improvement (country 5 standard) can only reduce CO2 emissions by approximately 12%, but through the whole life cycle accounting, this paper finds that Shenyang fuel quality improvement (country 5 to country 6) can increase CO2 emission reduction by 25% (Table 6), and SO2 reduction reaches 18.56 tons (Table 6), which is significantly higher than that predicted by the terminal model (Huo et al., 2011). The difference is due to the inclusion of emissions from the frontend link of logistics, thereby correcting the underestimation commonly found in traditional studies.
(2) Strategy 4 (promoting new energy vehicles) is a non-collaborative strategy, mainly due to the current power structure of Shenyang (thermal power accounts for 50%) and the implied emissions from battery production. If the proportion of thermal power decreases to 20%, the ICER value of Strategy 4 can increase from −1.8 × 10⁸ to 1.5 × 10⁸, but its economic cost will increase by 23% (based on the local price elasticity estimate). This finding highlights the key impact of the regional power mix on policy effectiveness.
(3) Strategy 2 (traffic restrictions) is a weak coordination strategy. The reason is that under the license plate restriction scenario, the annual mileage of taxis increases by 15% (Table 4), resulting in 27.01 tons of SO2 emissions from natural gas taxis. This result challenges the conclusions of Zhao and Feng (2024). Based on the case of Beijing, the latter believes that the license plate restriction policy is one of the best strategies for collaborative emission reduction, but it does not consider the hidden emissions of vehicle detours and alternative travel modes. This paper quantifies the local pollution transfer effect of the license plate restriction policy for the first time through the dynamic correction model of annual taxi mileage, which provides data support for its optimal design.
(4) Strategies 6 (developing rail transit) and 7 (low-carbon transportation) are also strong synergistic strategies, but the comprehensive emission reduction effect is moderate. Although both strategies are inferior to Strategy 5 in terms of single-strategy implementation priority, the two strategies clearly exhibit good linkage. Designing policies is considered to ensure that policies 6 and 7 are implemented simultaneously. For example, we can learn from the experience of Japan and implement dynamic management of the urban expressway toll fee and parking fee of private cars according to the density of vehicles on the road to encourage urban residents to actively choose low-carbon travel or use rail transit and other travel modes during busy hours.
5 Conclusion
This paper addresses the evaluation and research of collaborative emission-reduction measures in urban transportation, correcting the tendency to focus solely on terminal emission-reduction effects. By adopting a “whole lifecycle” perspective, it measures the interplay of various emission reduction strategies and their synergistic effects across different scenarios. Comprehensive evaluations are conducted through the integration of characteristic indicators from the synergistic control coordinate system and cross-elasticity metrics. The findings offer a model for the implementation of collaborative management measures targeting greenhouse gases and air pollutants in specific contexts, providing theoretical support for governmental agencies in prioritizing measures and exploring the interlinkages between strategies.
However, due to space constraints, although this paper discusses the potential for linkages among different strategies, it does not accurately quantify the emission-reduction effects arising from these interconnections. This aspect will be addressed in future research. Furthermore, economic efficiency—specifically the cost per unit of pollution reduction associated with implementing these measures—must also be considered in the deployment of emission-reduction strategies. Future studies will incorporate metrics such as unit pollutant emission-reduction cost and marginal emission-reduction cost to evaluate the “environment-economic” rationality of these strategies, aiming to minimize the costs associated with achieving specific emission reductions and devise synergistic control pathways for various industries or regions.
Data availability statement
The original contributions presented in the study are included in the article/Supplementary Material; further inquiries can be directed to the corresponding author.
Author contributions
GS: conceptualization, resources, and writing – original draft. ZS: data curation and writing – review and editing. MX: formal analysis and writing – original draft. DS: writing – review and editing. DX: supervision and writing – review and editing.
Funding
The author(s) declare that financial support was received for the research and/or publication of this article. This research was funded by the Technology Innovation Project of Dalian Neusoft University of Information TIFP202308.
Acknowledgments
The authors would like to thank the editor and reviewers for their valuable comments.
Conflict of interest
The authors declare that the research was conducted in the absence of any commercial or financial relationships that could be construed as a potential conflict of interest.
Generative AI statement
The author(s) declare that no Generative AI was used in the creation of this manuscript.
Publisher’s note
All claims expressed in this article are solely those of the authors and do not necessarily represent those of their affiliated organizations, or those of the publisher, the editors and the reviewers. Any product that may be evaluated in this article, or claim that may be made by its manufacturer, is not guaranteed or endorsed by the publisher.
Supplementary material
The Supplementary Material for this article can be found online at https://www.frontiersin.org/articles/10.3389/fenvs.2025.1521914/full#supplementary-material
Abbreviations
IPCC, intergovernmental panel on climate change; ARMA model, autoregressive integrated moving average model; GHG, greenhouse gas; EFGi,j, emission factor of gasoline-powered motor vehicle; EFEi,j, emission factor of electric motor vehicle; EFNGi,j, emission factor of natural gas-powered motor vehicle; NEVs, new energy vehicles; BEVs, battery electric vehicles; PHEVs, plug-in hybrid electric vehicles; FCEVs, fuel cell electric vehicles; ICER, integrated air pollutant co-control emission reduction; LAPeq, local air pollutant equivalent; IAPeq, integrated air pollutant equivalent.
References
Brockwell, P. J., and Davis, R. A. (2016). Modeling and forecasting with ARMA processes. Cham: Springer.
Catapano, F., Iorio, S. D., Magno, A., and Vaglieco, B. M. (2022). Effect of fuel quality on combustion evolution and particle emissions from PFI and GDI engines fueled with gasoline, ethanol and blend, with focus on 10–23 nm particles. Energy 239, 122198. doi:10.1016/j.energy.2021.122198
Chen, X., Meng, Q., Wang, K., Liu, Y., and Shen, W. (2023). Spatial patterns and evolution trend of coupling coordination of pollution reduction and carbon reduction along the Yellow River Basin, China. Ecol. Indic. 154, 110797. doi:10.1016/j.ecolind.2023.110797
Cheng, X., Yu, Z., Gao, J., Liu, Y., and Jiang, S. (2024). Governance effects of pollution reduction and carbon mitigation of carbon emission trading policy in China. Environ. Res. 252, 119074. doi:10.1016/j.envres.2024.119074
Davidson, K., Fann, N., Zawacki, M., Fulcher, C., and Baker, K. R. (2020). The recent and future health burden of the U.S. mobile sector apportioned by source. Environ. Res. Lett. 15, 075009. doi:10.1088/1748-9326/ab83a8
Ewing, R., Hamidi, S., Gallivan, F., Nelson, A. C., and Grace, J. B. (2013). Combined effects of compact development, transportation investments, and road user pricing on vehicle miles traveled in urbanized areas. Transp. Res. Rec. 2397, 117–124. doi:10.3141/2397-14
Feliciano, H. N. F., Rovai, F. F., and Mady, C. E. K. (2023). Energy, exergy, and emissions analyses of internal combustion engines and battery electric vehicles for the Brazilian energy mix. Energies 16, 6320. doi:10.3390/en16176320
Ge, Y., Vieno, M., Stevenson, D., Wind, P., and Heal, M. R. (2023). Global sensitivities of reactive N and S gas and particle concentrations and deposition to precursor emissions reductions. Atmos. Chem. Phys. 23, 6083–6112. doi:10.5194/acp-23-6083-2023
Guo, H., Zhao, L., and Zang, S. (2023). “Calculation of greenhouse gas emissions of urban rail transit systems in China,” in Proceedings of the institution of civil engineers. Bingley, United Kingdom: Emerald Publishing Limited.
Guzman, L. A., Hoz, D. d.l., and Circella, G. (2015). Evaluation of synergies from transportation policy packages using a social welfare maximization approach: a case study for Madrid, Spain. Case Stud. Transp. Policy 3, 99–110. doi:10.1016/j.cstp.2014.07.004
Hatzopoulou, M., Xu, J., and Song, G. (2022). Comparative analysis of drive-cycles, speed limit violations, and emissions in two cities: Toronto and Beijing. Sci. Total Environ. 811, 152323. doi:10.1016/j.scitotenv.2021.152323
Huo, H., Zhang, Q., He, K., Yao, Z., Wang, X., Zheng, B., et al. (2011). Modeling vehicle emissions in different types of Chinese cities: importance of vehicle fleet and local features. Environ. Pollut. 159, 2954–2960. doi:10.1016/j.envpol.2011.04.025
Ihlanfeldt, K. R. (2020). Vehicle miles traveled and the built environment: new evidence from panel data. J. Transp. Land Use 13, 23–48. doi:10.5198/jtlu.2020.1647
Ji, S., Zhang, Z., Meng, F., Luo, H., Yang, M., Wang, D., et al. (2024). Scenario simulation and synergistic effect analysis of CO2 and atmospheric pollutant emission reduction in urban transport sector: a case study of Chengdu, China. J. Clean. Prod. 438, 140841. doi:10.1016/j.jclepro.2024.140841
Jiménez, E., Tapiador, F. J., and Sáez-Martínez, F. J. (2015). Atmospheric pollutants in a changing environment: key issues in reactivity and monitoring, global warming, and health. Environ. Sci. Pollut. Res. 22, 4789–4792. doi:10.1007/s11356-014-3850-3
Jing, J., Liu, Y., Sun, J., Wang, Z., and Zhang, J. (2024). Research on the pollutant reduction control for P2.5 hybrid electric vehicles. SAE Tech. Pap. Ser. doi:10.4271/2024-01-2376
Junne, T., Simon, S., Buchgeister, J., Saiger, M., Baumann, M., Haase, M., et al. (2020). Environmental sustainability assessment of multi-sectoral energy transformation pathways: methodological approach and case study for Germany. Sustainability 12, 8225. doi:10.3390/su12198225
Lebedeva, O. A., and Savvateeva, E. (2023). “Increasing the efficiency of the urban network through the application of a multi-criteria public transport assessment model,” in Sbornik naučnyh trudov Angarskogo gosudarstvennogo tehničeskogo universiteta 2023, 154–159.
Lee, G.-J., Choe, G.-J., Yu, J.-H., and Chang, O. S. (2011). Variable emission factor prediction model for an air quality assessment of transportation projects. J. East. Asia Soc. Transp. Stud. 29, 117–128.
Liu, B., Ma, N., Liu, K., and Shi, H. W. (2023). Projection on China’s automobile stock and traffic carbon emissions. E3S Web Conf. 385, 02001. doi:10.1051/e3sconf/202338502001
Liu, Z., Hao, H., and Cheng, X. (2018). The impact of traffic restrictions on urban air quality: a case study in Beijing. Transp. Res. Part D Transp. Environ. 59, 526–538.
Mahoney, K., Gouveia, J., Lopes, R., and Sareen, S. (2022). Clean, green and the unseen: the CompeSA framework | assessing competing sustainability agendas in carbon neutrality policy pathways. Glob. transitions 4, 45–57. doi:10.1016/j.glt.2022.10.004
Muhssen, H. S., Zöldy, M., and Bereczky, Á. (2024). A comprehensive review on the hydrogen–natural gas–diesel tri-fuel engine exhaust emissions. Energies 17, 3862. doi:10.3390/en17153862
Oyewo, B., Tauringana, V., Vincent, T., and Aju, O. (2024). Impact of country governance mechanisms on carbon emissions performance of multinational entities. J. Environ. Manag. 352, 120000. doi:10.1016/j.jenvman.2023.120000
Siwiec, D., Frącz, W., Pacana, A., Janowski, G., and Bąk, Ł. (2024). Analysis of the ecological footprint from the extraction and processing of materials in the LCA phase of lithium-ion batteries. Sustainability 16, 5005. doi:10.3390/su16125005
Speizer, S., Fuhrman, J., Lopez, L. A., George, M., Kyle, P., Monteith, S., et al. (2024). Integrated assessment modeling of a zero-emissions global transportation sector. Nat. Commun. 15, 4439. doi:10.1038/s41467-024-48424-9
Statistics, N. B. o.S. E. (2023). China energy statistical yearbook. Beijing, China: China Statistics Press.
Tong, D., Cheng, J., Liu, Y., Yu, S., Yan, L., Hong, C., et al. (2020). Dynamic projection of anthropogenic emissions in China: methodology and 2015–2050 emission pathways under a range of socio-economic, climate policy, and pollution control scenarios. Atmos. Chem. Phys. 20, 5729–5757. doi:10.5194/acp-20-5729-2020
Wang, C., Li, J., Xu, A., Liu, Z., and Zhang, D. K. (2024). Sensitivity analysis and precursor emission sources reduction strategies of O3 for different pollution weather types based on the GRAPES-CUACE adjoint model. Atmos. Environ. 333, 120632. doi:10.1016/j.atmosenv.2024.120632
Wang, J., Ma, J., Wang, S., Shu, Z., Feng, X., Xu, X., et al. (2023). Coordination relationship of carbon emissions and air pollutants under governance measures in a typical industrial city in China. Sustainability 16, 58. doi:10.3390/su16010058
Wang, L., Wang, L., Chen, H., and Chen, W. (2020). Co-control of carbon dioxide and air pollutant emissions in China from a cost-effective perspective. Mitig. Adapt. Strategies Glob. Change 25, 1177–1197. doi:10.1007/s11027-019-09872-7
Wei, X., Wang, W., Yu, W., Hua, X., and Xiang, Y. (2020). A stochastic user equilibrium model under traffic rationing based on mode shifting rate. Sustainability 12, 5433. doi:10.3390/su12135433
Wu, F., Cheng, F., and You, J. (2023). Life cycle thinking supports 21st-century new pollutant and chemical management. Integr. Environ. Assess. Manag. 19, 859–860. doi:10.1002/ieam.4758
Xian-qiang, M., You-kai, X., Yu-bing, G., Feng, H., An, Z., Peng, K., et al. (2021). Study on GHGs and air pollutants co-control: assessment and planning. China Environ. Sci. 41, 3390–3398.
Xiao-mei, C., Yong-hong, L., Yong-zhao, C., Jian-zhang, H., and Jing, H. (2014). A comparative co-benefit analysis of the implements of vehicle emissions control policy in Pearl River Delta. China Environ. Sci. 34, 1599–1606.
Xin, B., Zhang, T., and Santibanez-Gonzalez, E. D. R. (2024). Synergistic effects of regional environmental governance on alleviating energy poverty and promoting household decarbonization. Energy Policy 185, 22024.
Xu, H., Xu, J., Wang, J., and Hou, X. (2023). Reduce production or increase efficiency? Hazardous air pollutants regulation, energy use, and the synergistic effect on industrial enterprises’ carbon emission. Energy Econ. 126, 107027. doi:10.1016/j.eneco.2023.107027
Xu, Y., Peng, J., Tian, J., Fu, S. Y., Hu, C., Fu, S., et al. (2024). The impact and mechanism analysis of clean development mechanism on the synergistic effects of pollution mitigation and carbon reduction. Environ. Res. Lett. 260, 119659. doi:10.1016/j.envres.2024.119659
Yuan, W., Frey, H. C., and Wei, T. (2022). Fuel use and emission rates reduction potential for light-duty gasoline vehicle eco-driving. Transp. Res. Part D-Trans. Environ. 109, 103394. doi:10.1016/j.trd.2022.103394
Yue, T., Liu, Q., Tong, Y., Gao, J., Zheng, Y., Li, G., et al. (2024). Analysis of emission evolution and synergistic reduction effect of air pollutants and CO2 from Chinese coal-fired power plants. Atmos. Pollut. Res. 15, 102001. doi:10.1016/j.apr.2023.102001
Zhang, H., Liu, B., Cai, A., Zhao, Z., Wang, X., and Li, R. (2023a). Study on synergistic emission reduction in greenhouse gases and air pollutants in Hebei Province. Sustainability 15, 16790. doi:10.3390/su152416790
Zhang, S., Xiong, Y., Liang, X., Wang, F., Liang, S., and Wu, Y. (2023b). Spatial and cross-sectoral transfer of air pollutant emissions from the fleet electrification in China by 2030. Environ. Sci. Technol. 57, 21249–21259. doi:10.1021/acs.est.3c04496
Keywords: urban transportation, atmospheric pollutants, greenhouse gas, synergistic emission reduction, whole lifecycle
Citation: Sheng G, Sun Z, Xue M, Sun D and Xie D (2025) Advancing synergistic strategies for greenhouse gas and atmospheric pollutant emission reduction in urban transportation: a whole lifecycle perspective. Front. Environ. Sci. 13:1521914. doi: 10.3389/fenvs.2025.1521914
Received: 11 November 2024; Accepted: 10 April 2025;
Published: 06 May 2025.
Edited by:
Jiachao Peng, Wuhan Institute of Technology, ChinaReviewed by:
Karn Vohra, University College London, United KingdomZhe Cui, Nantong University, China
Halil Ibrahim Oguz, Adiyaman University, Türkiye
Copyright © 2025 Sheng, Sun, Xue, Sun and Xie. This is an open-access article distributed under the terms of the Creative Commons Attribution License (CC BY). The use, distribution or reproduction in other forums is permitted, provided the original author(s) and the copyright owner(s) are credited and that the original publication in this journal is cited, in accordance with accepted academic practice. No use, distribution or reproduction is permitted which does not comply with these terms.
*Correspondence: Danlan Xie, eGRsQHpqaHpjYy5lZHUuY24=