 Qingqu Luo
 Yuwei Guan1*
- 1School of Resources and Environment, University of Electronic Science and Technology of China, Chengdu, China
- 2College of Earth and Planetary Sciences, Chengdu University of Technology, Chengdu, China
The rapid acceleration of urbanization, coupled with intensified human activities, has exacerbated the tension between human development and the ecological environment. This issue is particularly pronounced in Jiangsu Province, a major economic and commercial hub in China. Achieving a balance between ecological environmental quality and urbanization levels is critical for promoting regional sustainable development, with significant implications for both ecosystem management and urban planning. To investigate the intricate interactions between the ecological environment and urbanization in Jiangsu Province, we employed the Modified Remote Sensing Ecological Index (MRSEI) model, utilizing Google Earth Engine (GEE) and MODIS imagery to construct an ecological environmental quality assessment for the province from 2002 to 2022. Concurrently, the Population–Economic–Sociology–Space (PESS) model, combined with socioeconomic data and the Analytical Hierarchy Process–Criteria Importance Through Intercriteria Correlation (AHP-CRITIC) weighting method, was used to develop the Urbanization Level Index (ULI). The coupling coordination degree (CCD) model was applied to analyze the coordination relationship between the ecological environment and urbanization, while the Geodetector was used to identify the key factors influencing the MRSEI. The findings include: (1) the MRSEI incorporates more comprehensive indicator information than the RSEI and demonstrates greater sensitivity in capturing greenness and dryness variations in Jiangsu Province; (2) the ecological environment in northern Jiangsu has shown steady improvement, whereas southern Jiangsu experienced significant deterioration from 2002 to 2010, followed by recovery and stabilization from 2010 to 2022; (3) the urbanization level in southern Jiangsu is higher and has grown rapidly, while urbanization in northern Jiangsu accelerated after 2014 but remains at a lower level compared to the south; (4) the urbanization lag in northern Jiangsu and the eco-environment lag in southern Jiangsu have both improved, enhancing the overall coordination between ecological environment and urbanization; and (5) Jiangsu Province exhibits a significant heat island effect, with improvements in greenness, heat, and dryness having a positive influence on the MRSEI. This research provides an analytical framework and theoretical insights to address the persistent conflict between urbanization and ecological sustainability. The findings offer a scientific basis for policy formulation, supporting regional sustainable development strategies and urban planning in rapidly urbanizing areas.
1 Introduction
Rapid economic development has accelerated urbanization in China, with the urbanization rate increasing from 39.09% in 2002 to 65.22% in 2022, reaching an average annual growth rate of 3.3 percentage points. Such rapid development has significantly positively impacted economic structure adjustment and resource optimization. However, traditional urbanization has focused primarily on development speed, leading to severe urban issues such as ecological destruction, environmental pollution, and resource shortages (Boori et al., 2021). The ecological environmental problems caused by rapid urbanization have become increasingly prominent, ultimately constraining further urbanization. To some extent, the ecological environment and urbanization process form a mutually restrictive relationship (Song et al., 2022). On one hand, a healthy ecosystem provides essential conditions for urban development, including water resources, air quality, and a favorable living climate, all of which are fundamental to advancing urbanization. However, ecosystems have a limited carrying capacity, and excessive urban expansion can lead to water shortages, land degradation, and biodiversity loss, ultimately constraining a city’s potential for further development (Seifollahi-Aghmiuni et al., 2022). On the other hand, urbanization often negatively affects the ecological environment, particularly when effective environmental protection measures are lacking. The process of urbanization involves large-scale land use changes, which not only disrupt the structure and function of ecosystems but also cause ecological problems such as soil erosion, environmental pollution, and the urban heat island effect, further intensifying pressure on the ecological environment (Asabere et al., 2020). The coupling between the ecological environment and urbanization can be understood as a nonlinear interaction (Fang et al., 2021). Environmental pressures arising from urbanization affect the speed and direction of urban growth through feedback mechanisms, while ecological restoration and improvement, in turn, foster high-quality urban development (Feng et al., 2021). In this dynamic, achieving coordinated development is especially critical. Therefore, quantitatively assessing the coupling coordination development between the ecological environmental quality and urbanization level and exploring the driving mechanisms of eco-environmental changes are essential for optimizing regional development strategies and enhancing environmental management capabilities (Wu et al., 2021).
In recent years, there has been a growing recognition of the importance of the ecological environment for sustainable development, driven by an enhanced understanding of the relationship between this environment and human society. In 2006, China formulated the “Technical Criterion for Ecosystem Status Evaluation”, aiming to unify national ecological environment evaluation standards (Ministry of Ecology and Environment of the People’s Republic of China, 2006). With the rapid advancement of remote sensing technology, new ecological environment monitoring and assessment approaches have become significant in various fields and at different scales. Examples include the Normalized Difference Vegetation Index (NDVI) for describing vegetation changes (Gillespie et al., 2018), the Normalized Difference Water Index (NDWI) for assessing vegetation moisture (Taloor et al., 2021), and the Forest Disturbance Index (FDI) for evaluating forest ecosystem changes (Healey et al., 2005). However, these methods have limitations, such as data collection difficulties, reliance on single evaluation indicators, and incomplete information reflection. To address these issues, the Remote Sensing Ecological Index (RSEI) uses a principal component analysis to extract representative principal components from four key indicators: greenness, heat, wetness, and dryness (Xu, 2013; Chen et al., 2023). This approach constructs a more comprehensive evaluation index. The RSEI has been effectively implemented in various regions, providing robust support for monitoring, assessing, and predicting regional ecological environmental quality (Yuan et al., 2021; Li et al., 2022; An et al., 2022). Nonetheless, the ecological environments of different regions have unique characteristics, necessitating appropriate modifications to the RSEI to meet specific regional and task requirements. For instance, Zhang et al. (2023) introduced salinity and water network density into the RSEI model, enhancing its ability to reflect ecological environmental changes in the arid regions of Northwest China. Li et al. (2023) incorporated the soil erosion factor into the model, allowing for a comprehensive and objective assessment of the ecological environment in Shanxi Province and national coal planning mining areas. Cheng et al. (2021) proposed using the entropy weight method to assess each ecological factor comprehensively, applying it successfully to the ecological environmental analysis of the Mentougou District. These various RSEIs have been modified based on actual situations. In densely forested areas, optimizing the greenness index calculation to account for vegetation’s significant impact on the ecological environment can improve result accuracy. Conversely, in urban built-up areas, using more accurate identification methods to address the issue of misidentifying building land can enhance the representation of the dryness index and minimize the uncertainty in RSEI calculation.
As global urbanization accelerates, urban issues have become increasingly complex and diverse. Traditional evaluations of urbanization primarily focus on demographic factors, specifically the proportion of the urban population relative to the total population. However, a single demographic indicator no longer fully captures the complexities of urban development. Modern urbanization evaluations emphasize developing comprehensive indicator systems, such as “population-economy” (Wang et al., 2021), “population-economy-society-space” (Liang et al., 2019), and “economy-society-ecology-urban-rural coordination” (Yang et al., 2021). For example, Tang et al. created an indicator system based on “population-economy-society-space” to examine the relationship between urbanization level and ecological vulnerability in Hunan Province (Tang et al., 2024). Similarly, Yin et al. (2022) established a “population-land-economy-society-ecology” indicator system to explore the spatiotemporal changes and influencing factors of ecological urbanization in the Yangtze River Delta. In developing these indicator systems, scholars commonly use the Analytical Hierarchy Process (AHP)–entropy weight and principal component analysis (PCA) to assess the contribution of each indicator. The entropy weight method focuses on the internal variability of indicators but overlooks their interrelationships, while a principal component analysis may lead to ambiguous interpretations (Gou et al., 2021). The Criteria Importance Through Intercriteria Correlation (CRITIC) weighting method improves upon the entropy weight method by calculating indicator weights based on the information flow within the original data, considering conflicts and differences between indicators. This method has been widely adopted, including in Zhu et al.’s (2024) study of ecological vulnerability changes and their causes in Tianshui City from 2000 to 2022. Employing the AHP-CRITIC weighting method, which integrates both subjective and objective weights, can minimize weighting bias and improve both scientific and rational accuracy.
Jiangsu Province occupies a pivotal position within the Yangtze River Economic Belt and the Yangtze River Delta urban agglomeration. In recent decades, the province has experienced rapid economic growth and accelerated urbanization (Liu et al., 2022) due to the reform and opening-up policies and its strategic location. However, this urban expansion has also brought about a series of severe ecological challenges, profoundly affecting Jiangsu’s ecosystem (Huang et al., 2015; Wu et al., 2020). In this context, studying the coupling coordination between urbanization and the ecological environment in Jiangsu Province is not only regionally representative but also provides valuable insights for the sustainable development of other economically developed regions. This study innovatively integrated satellite remote sensing data with socioeconomic data, enhancing the objectivity and accuracy of the results through the use of multi-source data. Furthermore, by employing the Modified Remote Sensing Ecological Index (MRSEI) and the AHP-CRITIC weighting method, the study established a 20-year time series evaluation system for ecological environmental quality and urbanization level, revealing the conditions and trends in Jiangsu over different periods. Through an in-depth analysis of the coupling coordination relationship between these two evaluation systems at the county level as well as an exploration of the driving mechanisms behind ecological environmental changes, the study uncovered the unique characteristics of various regions in the interaction between urbanization and the ecological environment, thus providing a foundation for formulating region-specific sustainable development policies.
2 Study area and materials
2.1 Study area
Jiangsu Province is located in the eastern coastal region of China, downstream of the Yangtze and Huai Rivers (Figure 1). Covering 107,200 square kilometers, the province includes 13 prefecture-level cities and 96 districts and counties. Its diverse terrain, featuring plains, mountains, hills, and lakes, results in a variety of ecosystems. As a crucial part of the Yangtze River Delta urban agglomeration, Jiangsu includes major urban centers such as Nanjing, Suzhou, Wuxi, and Yangzhou. These cities lead China’s rapid urbanization and play a vital role in the national development strategy. By 2023, the province’s Gross Domestic Product (GDP) reached CNY 12,822.22 billion, with an urbanization rate of 75.04%.
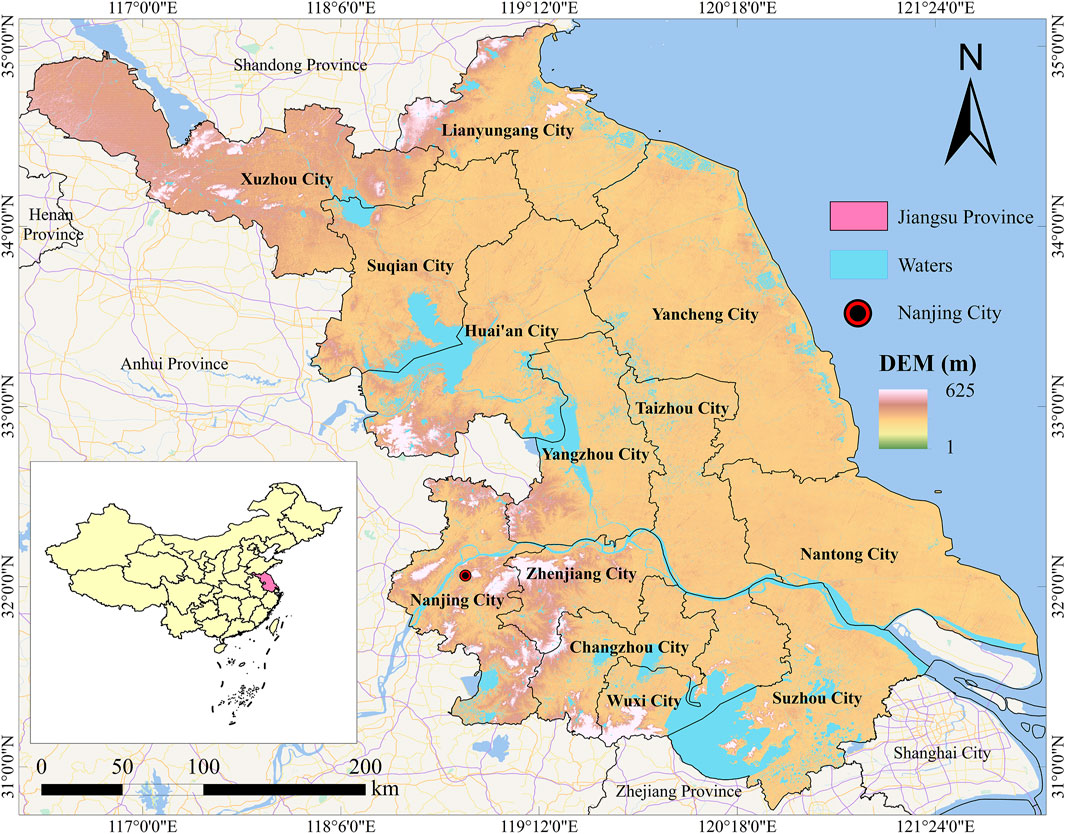
Figure 1. The location of Jiangsu Province.
2.2 Data sources
2.2.1 MODIS data
Calculating the MRSEI requires four key components: greenness, wetness, heat, and dryness. For research needs, we selected corresponding MODIS data products. It is worth mentioning that the Land Processes Distributed Active Archive Center (LPDAAC) is an affiliate of the United States Geological Survey (USGS), offering an extensive suite of remote sensing data products. These products include the surface temperature, surface reflectance, radiation, and vegetation index, adhering to Level 1B data standards and suitable for a wide range of applications (Xiong et al., 2021).
In this study, Google Earth Engine was used to process MODIS data products and calculate the MRSEI. We employed the MOD13A1 dataset to derive the greenness component of the MRSEI, the LST-Daytime band of the MOD11A2 V6 dataset to extract heat, and the MOD09A1 dataset to extract wetness and dryness. To mitigate the impact of different imaging times and pixel scales on the MRSEI components, MODIS images from July to September of each year were synthesized at four-year intervals, and the results were uniformly resampled to 500 m. MODIS data parameters are detailed in Table 1.
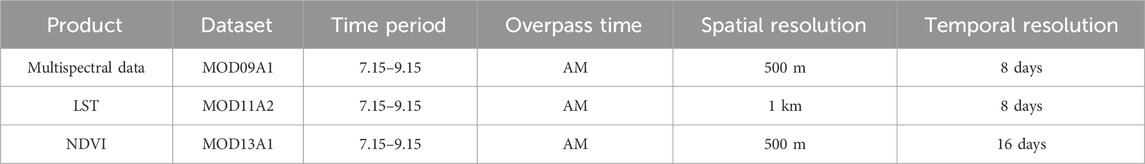
Table 1. MODIS data parameters from 2002 to 2022.
2.2.2 Socioeconomic data
Urbanization, as a reference for regional development, is a complex and dynamic process that encompasses population, industry, society, space, and ecology (Yang et al., 2017). Its connotations include population size, industrial structure, residents’ living standards, and the provision of public services. In the context of Jiangsu Province, factors related to urbanization include population and GDP growth, rising per capita income, increased consumption capacity, and infrastructure construction such as hospitals, schools, and highways. Moreover, evaluating the level of urbanization not only focuses on the growth of built-up areas but also emphasizes the overall development of these areas and their surrounding regions. Drawing on existing research (Xiong and Xiao, 2021; Liu and Ba, 2020), urbanization is categorized into four subsystems. Population urbanization captures the process of rural-to-urban migration and the subsequent settlement of these populations in urban areas. Economic urbanization highlights the rise in urban economic development and the shift from an agriculture-dominated economy to one primarily driven by industry and services. Social urbanization reflects changes in social structure, lifestyle, social relations, and public services, as urbanization fosters a shift from traditional rural lifestyles to modern urban living. Spatial urbanization focuses on the transformation of urban spatial layouts, morphological structures, and land use. With the advance of urbanization, urban spaces expand and optimize, while infrastructure and public services improve, leading to a more rational spatial structure. Considering the Population–Economic–Sociology–Space (PESS) model and the specific context of Jiangsu Province, we selected 16 socioeconomic indicators to evaluate these four dimensions of urbanization, ultimately constructing an urbanization-level evaluation system, as presented in Table 2. The relevant data from 2002 to 2022 were sourced from the National Bureau of Statistics website (https://www.stats.gov.cn, accessed on 27 October 2023), the Jiangsu Provincial Bureau of Statistics website (https://tj.jiangsu.gov.cn/index.html, accessed on 30 October 2023), and the websites of local statistical bureaus at various levels. For missing data, a comprehensive growth rate estimation method was used to supplement the missing data based on the long-term historical or segmented average growth rate.
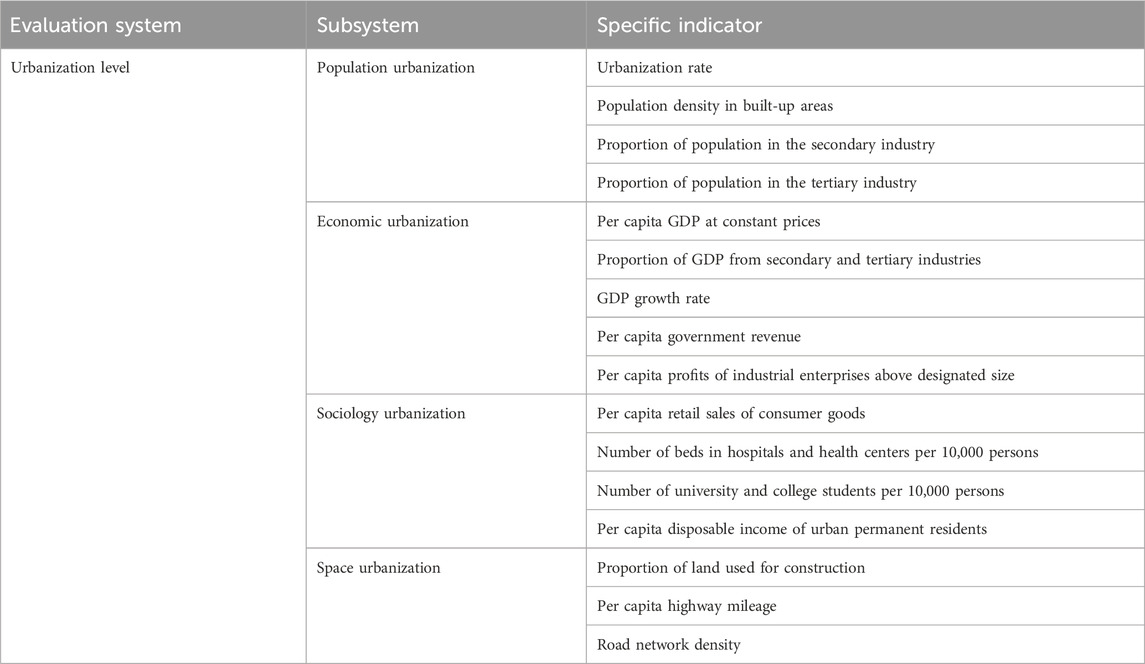
Table 2. Evaluation index system of urbanization level in Jiangsu Province.
2.2.3 Influencing factor data
To better understand the driving mechanisms of ecosystems and promote the harmonious coexistence of urban and ecological environments, we selected eight categories of data at four-year intervals to analyze the factors influencing ecological environmental quality in Jiangsu Province, considering data availability and existing research (Aizizi et al., 2023). These categories include MRSEI component indicators: kNDVI, LST, WET, and ENDISSI; natural factors: precipitation (PCP) and temperature (TEMP); and anthropogenic factors: nighttime lights (NTL) and population density (POP). The kNDVI serves as a key indicator of ecological environmental quality, reflecting ecosystem health and sustainability. LST is closely linked to regional climate change and land use, assessing the impact of human activities on ecosystems. WET affects watershed cycles, thereby influencing ecological health. The ENDISSI measures water scarcity and its pressure on ecosystems, aiding in evaluating climate change’s potential environmental impacts. PCP, a core indicator of water supply, directly influences ecosystem health. As an indicator of climate change, TEMP shows how rising temperatures can exacerbate environmental degradation, including ecological decline and biodiversity loss. NTL measures the intensity of human activities, particularly economic and urbanization processes, and their effect on ecosystems. Finally, POP reflects human demand for natural resources and the associated pressure on the environment, making it a crucial factor in determining ecological environmental quality. The kNDVI, LST, WET, and ENDISSI were calculated using MODIS images on the GEE cloud platform. Data on PCP and TEMP were derived from the monthly precipitation grid data and monthly average temperature grid data from the Tibetan Plateau National Data Center (https://data.tpdc.ac.cn, accessed on 14 November 2023). The NTL data were obtained from the annual corrected data integrated from DMSP-OLS and SNPP-VIIRS datasets by Wu et al. (2021). The POP data were sourced from the annual population distribution product developed by the U.S. Department of Energy’s Oak Ridge National Laboratory (https://landscan.ornl.gov, accessed on 17 November 2023).
3 Methodology
This study utilized MODIS data products to establish the MRSEI, analyzing the spatiotemporal evolution characteristics of ecological environmental quality in Jiangsu Province from 2002 to 2022. Additionally, based on the PESS model and the AHP-CRITIC weighting method, we constructed the urbanization level index (ULI) for evaluating urbanization progress using socioeconomic data. We investigated the coupling coordination relationship and its evolution trend between MRSEI and ULI at the county level using the coupling coordination degree (CCD) model. Finally, the primary factors influencing the ecological environment were identified using the Geodetector, providing valuable references for the sustainable development of Jiangsu Province. The methodology flowchart is illustrated in Figure 2.
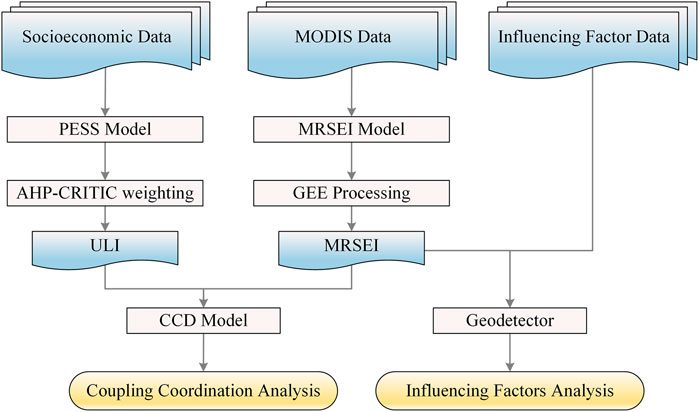
Figure 2. The methodology flowchart.
3.1 Construction of MRSEI
The MRSEI offers unique advantages over traditional ecological observation methods. It provides an efficient and convenient means to identify ecological conditions and monitor environmental spatiotemporal characteristics in specific areas. In the realm of natural factors that signify ecological environmental quality, greenness, wetness, heat, and dryness are crucial to human survival and ecosystem stability. Consequently, these factors are widely used by scholars to evaluate and analyze ecosystem conditions. MRSEI can be regarded as a function of these four key components, specifically expressed as Equation 1 (Yang et al., 2021):
Where kNDVI represents greenness, Wet represents wetness, LST represents heat, and ENDISSI represents dryness. Detailed information related to data processing and collection for each component is as follows.
(1) Greenness: NDVI is commonly used to reflect the vegetation growth status of an area and is the most widely used indicator. However, the NDVI formula, based on the ratio of NIR and Red, reduces atmospheric influence at the cost of easy saturation. This limitation is mainly reflected in its limited handling of atmospheric disturbances, its susceptibility to soil background and vegetation canopy in areas of sparse vegetation, and its tendency to saturate in areas of dense vegetation (Chen et al., 2024). To avoid the shortcomings of NDVI, we selected the kernel NDVI (kNDVI) to represent greenness. By applying machine learning and kernel method theory, kNDVI better addresses the saturation effect and provides more accurate vegetation cover information. The calculation Equation 2 is as follows (Wang et al., 2023):
Where NIR and Red represent the reflectance of the near-infrared (NIR1) and red bands, respectively. σ denotes a length scale parameter that can be adjusted to reflect the nonlinear sensitivity of NDVI to vegetation density. A reasonable choice is to set σ to the average value, σ = 0.5(NIR + RED). The hyperbolic tangent function (tanh) is then applied. Thus, the Equation 3 for kNDVI is as follows:
This study used the NDVI band from the MODIS13A1 dataset to calculate kNDVI.
(2) Heat: This study employed the LST-Daytime band from the MOD11A2 LST product to measure heat. As this product expresses temperature values in Kelvin, it is essential to convert the original LST (LST0) into Celsius units. The specific Equation 4 is as follows (Gong et al., 2023):
Where LST and LST0 are the land surface temperature and original land surface temperature, respectively.
(3) Wetness: The wetness component was derived from the MOD09A1 dataset through the Kauth–Thomas transformation, which correlates significantly with surface moisture and vegetation conditions. The Equation 5 for calculating wetness is as follows (Peng et al., 2023):
Where C1 to C7 are the wetness coefficients, with values C1 = 0.1147, C2 = 0.2489, C3 = 0.2408, C4 = 0.3132, C5 = 0.3122, C6 = 0.6416, and C7 = 0.5087. Reflectance for the MOD09A1 image is denoted by ρi (i = 1–7), corresponding to the bands 1 to 7.
To accurately characterize the wetness in Jiangsu, we utilized the Modified Normalized Difference Water Index (MNDWI) to extract water bodies from the imagery and apply masking. The specific Equation 6 is as follows (Yang et al., 2023):
(4) Dryness: In the original RSEI, dryness is represented as the average of the Index-based Built-up Index (IBI) and Soil Index (SI). IBI is typically used to identify and quantify building density in urban areas. It combines various spectral indices to enhance the signal of buildings while suppressing the interference of vegetation and water bodies. However, IBI is susceptible to the effects of spectral mixing and, in low-resolution data, struggles to distinguish buildings from other features, such as vegetation, bare soil, and water bodies. Additionally, IBI has a limited dynamic range and sensitivity in identifying high-reflectance building materials. In contrast, the Enhanced Normalized Difference Impervious Surface Index (ENDISI) integrates information from visible light, NIR, and SWIR bands. It effectively reduces the impact of spectral mixing, decreases interference from vegetation and water bodies, and provides more accurate impervious surface identification results (Chen et al., 2019). Therefore, we innovatively combined ENDISI and SI, introducing an advanced dryness index, the Enhanced Normalized Difference Impervious Surface and Soil Index (ENDISSI). The specific Equations 7–10 are as follows:
Where ρ1, ρ2, ρ3, ρ6, ρ7 are the corresponding bands of the MODIS09A1 dataset. The ()mean is the mean value of the image.
Following the acquisition and normalization of the four components, their values were constrained within the range between 0 and 1. Subsequently, we applied the PCA for the integration of these four components into the MRSEI’s construction. The first principal component was designated as the original MRSEI (MRSEI0). For ease of measurement and comparative analysis, MRSEI0 underwent normalization, and the normalization Equation 11 is as follows:
Where MRSEI is constructed from the MODIS dataset. Its value range is between 0 and 1. Ecological environment conditions improve as the MRSEI approaches 1; conversely, lower MRSEI values indicate poorer conditions.
3.2 Construction of ULI
(1) Indicator normalization: Considering that there are differences in the magnitude of the original data during the actual computation process, the Min–Max normalization Equation 12 was used to standardize the data:
Where Yij, Yj_mxn, and Yj_min represent the original indicator value, the maximum value of the original indicator, and the minimum value of the original indicator, respectively. Y*ij denotes the normalized indicator value, which ranges from 0 to 1.
(2) CRITIC weighting method: The CRITIC weighting method is based on strong mathematical principles, and the calculation process involves four steps: standard deviation, correlation coefficient, indicator information quantity, and objective weight. The standard deviation reflects the variability of indicator values; higher variability indicates greater distinguishability in the evaluation system, which in turn suggests that the indicator should be assigned a higher weight. The correlation coefficient measures the interrelationship between indicators. When two indicators are strongly correlated, it means they provide similar information, and their weights should be relatively lower. CRITIC calculates the information quantity for each indicator by combining its standard deviation with its correlation to other indicators. A higher information quantity leads to a higher weight. Through normalization, the information from each indicator is converted into a weight, ensuring the total weight sums to 1. This method considers both the discriminative power of the indicators (via standard deviation) and the redundancy of information between them (via correlation coefficient), achieving a balanced weighting system. Unlike methods that depend on subjective expert judgment, the CRITIC approach derives weights from the inherent characteristics of the data (variability and correlation), minimizing the impact of human factors. The specific calculation Equations 13–16 are as follows (Zhou et al., 2023):
Where Sj represents the standard deviation of the jth indicator, m is the number of indicator values, and Yj is the mean value of the normalized indicator, j = 1, 2, … , n.
Where Rij represents the correlation coefficient between the ith and jth indicators and Xi and Xj are the ith and jth columns of the normalized matrix X, i (j) = 1, 2, … , n.
Where Cj represents the information quantity of the jth indicator. The larger Cj is, the greater the role of the indicator in the overall evaluation system; thus, it should be allocated a higher weight.
Where Wj denotes the objective weight of the jth indicator.
(3) Comprehensive objective–subjective weighting method: In this study, objective weighting is determined using the CRITIC method, while subjective weighting employs the AHP method. The AHP method determines weights based on expert knowledge and existing research findings (Wang et al., 2023), addressing the importance of cross-comparing various indicators. Objective weights represent the relative importance of each indicator without the influence of subjective human intervention, and their values change dynamically with the progress of urbanization. In contrast, subjective weights reflect experts’ rankings and preferences for the importance of each indicator in assessing urbanization level and remain constant across different years. To balance the objectivity and temporal consistency of the comprehensive weights, this study combined both weighting methods, as illustrated by the following Equation 17 (Chen, 2020):
Where W*, Wi, and Wj represent the comprehensive, subjective, and objective weight values, respectively. To ensure the objectivity of the calculation results, α is set to 0.5 for the computation.
(4) Urbanization level index: Referring to previous studies, we calculated the urbanization level index (ULI) for each county using the standardized values of urbanization indicators and their corresponding weights. The calculation Equation 18 is as follows (Li et al., 2023):
Where ULI represents the urbanization level index, Y*i represents the standardized score of the ith indicator, W*i represents the corresponding comprehensive weight, and n is the number of indicators. A higher ULI denotes a greater level of urbanization, while a lower ULI signifies a lesser level of urbanization in the region.
3.3 Exploration of coupling coordination relationship
Coupling refers to the interaction and influence between two or more elements, reflecting the development trend from disorder to order within a system. It is widely used in studies examining the relationship and stress between urbanization and the ecological environment. However, in some cases, coupling degrees may not fully capture the overall benefits and synergies between urbanization and the ecological environment in a region. This is particularly true in comparative studies of multiple regions, where relying solely on coupling degrees can be misleading due to the intertwined, dynamic, and unbalanced nature of urbanization and the ecological environment in each region. To objectively assess the level of regional coordinated development, this study employs a coupling coordination model for urbanization level and ecological environmental quality. The calculation Equations 19, 20 are follows (Lei et al., 2024):
Where U represents ULI, M represents MRSEI, and CD represents the coupling degree between ULI and MRSEI. A higher CD signifies a stronger coupling between the ecological environment and urbanization. The CCD measures the level of coordinated development between these components, with a higher value reflecting a higher level of coordination. α and β are weight coefficients, and since ecological environmental improvement and urbanization level enhancement are considered equally important, both are set to 0.5. Drawing on existing research (Tang et al., 2021), the CCD was categorized into four types: extreme coordination, basic coordination, on the verge of disorder, and severe imbalance. Based on the characteristics of synchronous coordination and lagged imbalance and integrating the system scores of MRSEI and ULI, the coupling coordination category was further divided into 12 subcategories (Table 3).
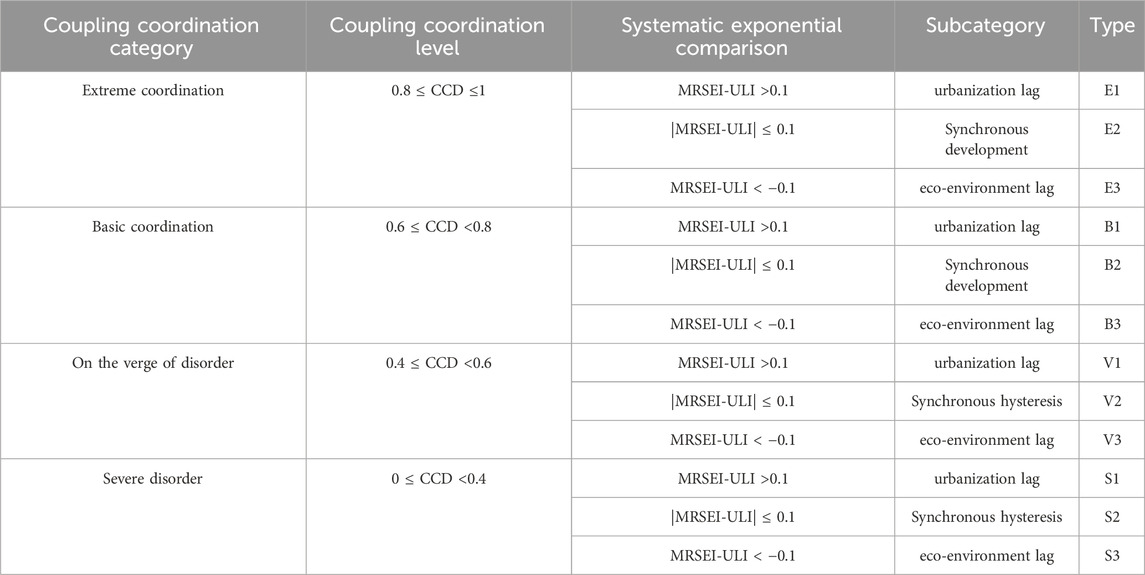
Table 3. Classification principles of coupling coordinated development of urbanization and ecological environment.
3.4 Geodetector
Spatial heterogeneity is intrinsic to geographic phenomena. The Geodetector serves as a statistical methodology to identify and elucidate the determinants of this heterogeneity (Zhu et al., 2020). In this study, we employed the single factor, interaction, and risk detectors of Geodetector to explore the influence of diverse factors on MRSEI.
Considering that the ecological environmental quality changes in Jiangsu result from both natural factors and human activities, this study designated MRSEI as the dependent variable (Y), with kNDVI, LST, WET, ENDISSI, PCP, TEMP, NTL, and POP as independent variables (X). Nevertheless, these independent variables originated from disparate data sources, exhibiting differences in spatial resolution. To obtain the integer data required by the Geodetector and unified spatial units, we used the natural breaks method to reclassify each independent variable into seven categories and constructed a 1 km × 1 km fishnet to determine the central sampling points. We finally obtained 91,044 sampling points and subsequently extracted the values of each variable for different years.
(1) The single-factor detection primarily measures how well a variable X explains the spatial heterogeneity of variable Y. It quantifies this influence using the metric q, which helps in identifying the contributing factors. The mathematical Equation 21 for this method is detailed below (Wang et al., 2016):
Where q represents the degree of influence on MRSEI, reflecting the explanatory capability, h is category levels ranging from one to L, and L signifies the number of classifications for the factors. Nh and N are the sample sizes of the classified and total areas, respectively, while σ2 and σ2 h are the variances of MRSEI within the classified regions and the overall region. A q value closer to one implies a stronger influence on MRSEI.
(2) The interaction detector assesses how different factors jointly affect a dependent variable. The interaction results can be divided into nonlinear weaken, univariate weaken, bivariate enhanced, nonlinear enhanced, and independent (Wu and Zhang, 2021).
(3) The risk detector is utilized to determine if significant disparities exist in the spatial distributions of the variable Y, among different variables X (Liu et al., 2021).
4 Results
4.1 Analysis of MRSEI results
Through the PCA of the component indicators in Jiangsu Province from 2002 to 2022, the PC1 loadings and PC1 contribution rates for each indicator in the RSEI and MRSEI were obtained (Table 4). The indicator loadings in the RSEI and MRSEI show the same characteristics on PC1: the loadings of the NDVI/kNDVI and WET are positive on PC1, while those of LST and the NDBSI/ENDISSI are negative. Additionally, the absolute value of the loading of the NDVI/kNDVI is the largest, followed by the NDBSI/ENDISSI, LST, and WET. Compared to the RSEI, the contribution rate of PC1 in the MRSEI is higher by 7.99%, 9.32%, 8.28%, 7.65%, 8.40%, and 9.04% across the respective periods, with an average value reaching 79.57%. This indicates that the MRSEI covers most of the indicator information and better represents the ecological environment characteristics.
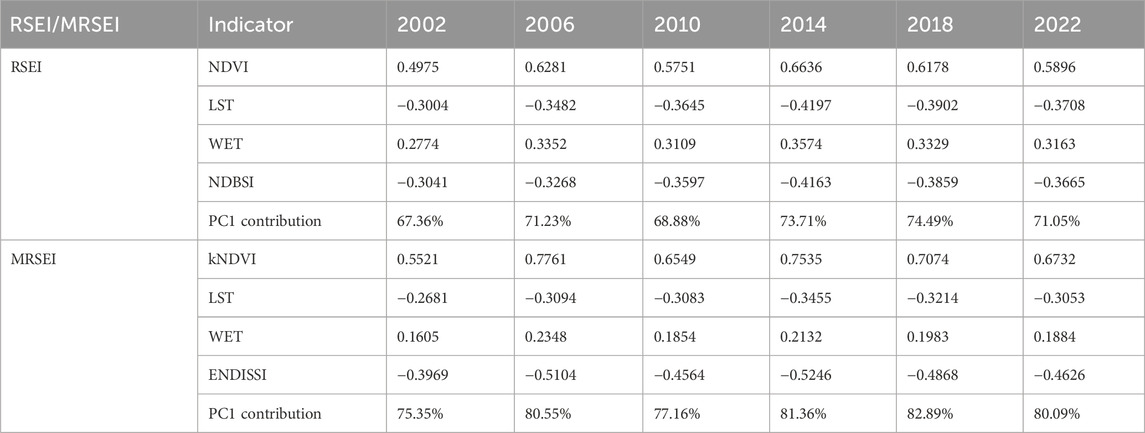
Table 4. The loadings of each indicator and the contribution rate of PC1 for the RSEI/MRSEI.
Taking 2022 as an example, the correlation between each indicator and the MRSEI was analyzed using sampling point data (Figure 3). The results indicate that the kNDVI (Pearson’s r = 0.9599) and WET (Pearson’s r = 0.3264) exhibit positive correlations with the MRSEI, while LST (Pearson’s r = −0.5941) and the ENDISSI (Pearson’s r = −0.8515) display negative correlations with the MRSEI. This situation is logical given the actual ecological conditions of the study area. The magnitude of the correlation is kNDVI > ENDISSI > LST > WET, which is consistent with the PCA results. All correlations were statistically significant with p < 0.01, suggesting that the MRSEI is more representative and comprehensive compared to any single indicator.
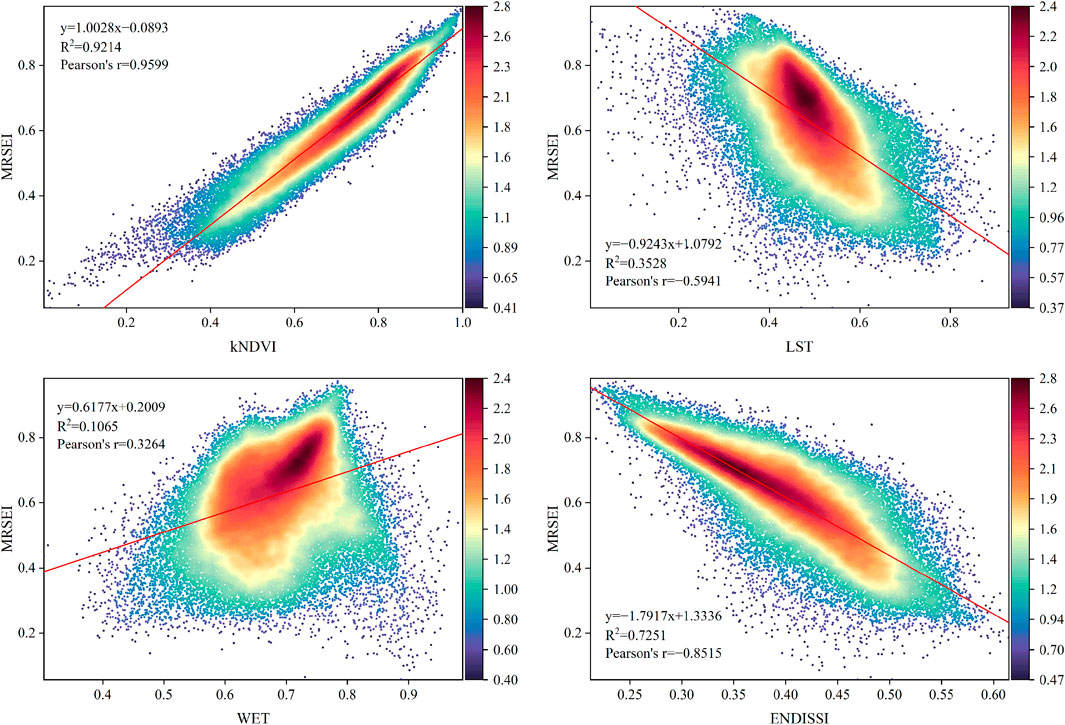
Figure 3. The point density map of the MRSEI with four indicator components.
4.2 Spatiotemporal change characteristics of ecological environmental quality
The MRSEI distribution in Jiangsu from 2002 to 2022 is presented in Figure 4. On the temporal scale, the MRSEI exhibits a fluctuating trend over the 20 years. On the spatial scale, the MRSEI shows a clear north-south differentiation.
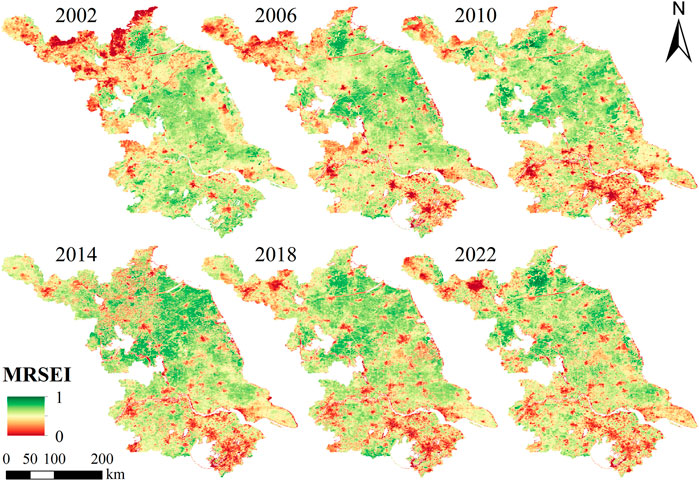
Figure 4. Ecological environmental quality distribution in Jiangsu Province.
In 2002, the mean MRSEI was 0.5713. By 2006, this value had increased to 0.6295. However, in 2010, the mean MRSEI reached its lowest point, dropping to 0.5492. Following this decline, the mean MRSEI rose significantly to 0.6697 by 2014, marking a 21.94% increase from 2010. The value experienced a slight rise again in 2018, peaking at 0.6728, before decreasing to 0.6072 in 2022.
In 2002, due to the more favorable natural conditions in southern Jiangsu, the MRSEI was significantly higher in the south compared to the north, with low-value areas concentrated in Xuzhou and Lianyungang. By 2006, economic development and urbanization had led to a decline in the MRSEI in southern Jiangsu, notably in Nanjing, Changzhou, Suzhou, and Wuxi, while northern Jiangsu experienced an increase. This trend persisted in 2010 when the MRSEI in the northern region surpassed that of the south. In 2014, increased environmental awareness and national policy guidance helped mitigate the decline in southern Jiangsu, while northern Jiangsu began to show a downward trend due to accelerated development. By 2018 and 2022, the MRSEI in the southern region stabilized, whereas the northern region continued a slight downward trend, with the most significant decline occurring in Xuzhou.
To more accurately understand the changes in the MRSEI of Jiangsu over various periods, the MRSEI was divided into five levels using the equal interval classification method: excellent (0.8–1), favorable (0.6–0.8), moderate (0.4–0.6), mediocre (0.2–0.4), and poor (0–0.2). The proportions of areas with each ecological environmental quality level over the 20 years are presented in Table 5.
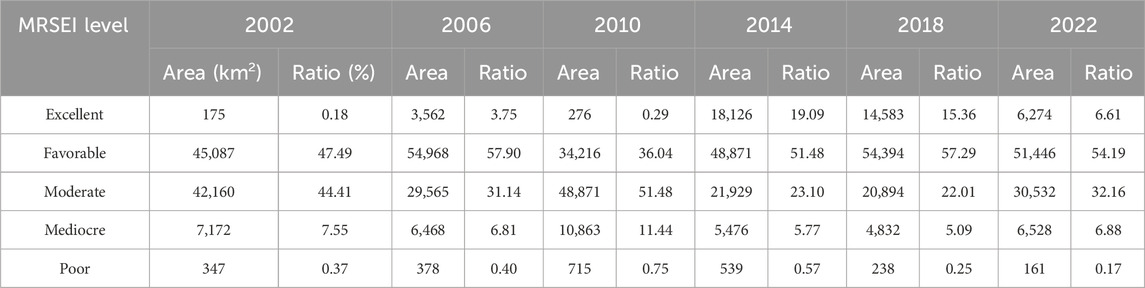
Table 5. Statistical table of different ecological environmental quality levels in Jiangsu Province.
From 2002 to 2022, the MRSEI level in Jiangsu Province has been predominantly favorable and moderate. The favorable area proportion increased from 47.49% in 2002 to 54.19% in 2022, representing an increase of 6,359 km2. Conversely, the proportion of moderate areas decreased from 44.41% in 2002 to 32.16% in 2022, indicating a reduction of 11,628 km2. The proportion of excellent areas increased significantly from 0.18% to 6.61%, showing a growth of 3,485% over 20 years. The proportions of mediocre and poor areas showed little change, remaining at relatively small percentages. Notably, in 2010, the proportion of favorable areas declined rapidly, while the proportion of moderate areas increased quickly. This shift caused the proportion of moderate areas to exceed that of favorable areas for the first time. However, in 2014, this situation was reversed, and the favorable areas regained the largest proportion.
Due to the diversity of natural, economic, and policy factors in different regions of Jiangsu Province, there is significant geographical differentiation in ecological environmental quality. In China’s administrative system, districts and counties are crucial links between local and central governments, essential for governance and development. To more intuitively identify the spatiotemporal changes in Jiangsu Province’s ecological environmental quality, this study used districts and counties as units to derive the distribution of the mean MRSEI (Figure 5).
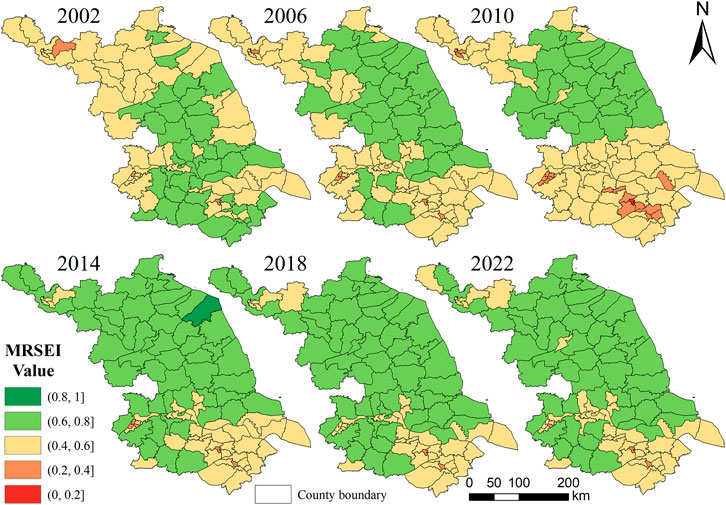
Figure 5. MRSEI mean value distribution of district and county units in Jiangsu Province.
In 2002, there were 56 moderate units, accounting for 58.33% of the total; 37 favorable units; and 3 mediocre units, located in Nanjing, Wuxi, and Xuzhou, respectively. There were no excellent or poor units. In 2006, the ecological environment in the north improved, leading to an increase in the number of favorable units. In contrast, the ecological environment in the south deteriorated, which reduced the number of favorable units and increased the number of mediocre units to 6. As a result, the total number of favorable units decreased to 33. This trend of ecological environmental change became more pronounced in 2010. All favorable units were distributed in the north, reducing to 25, while the number of mediocre units in the south continued to increase to 16. Even the ecological environmental quality in the Liangxi District of Wuxi deteriorated to poor. However, by 2014, the overall ecological environment in Jiangsu Province had significantly improved. The number of excellent and favorable units reached 53, accounting for 55.21% of the total, while the number of moderate and mediocre units was 43, accounting for 44.79%. In 2018 and 2022, the ecological environment remained relatively stable. The proportion of favorable units was 59.38% and 54.17%, respectively. Moderate and mediocre units were mainly concentrated in Nanjing, Suzhou, and Wuxi in southern Jiangsu and Xuzhou in northern Jiangsu. These areas have relatively developed economies, larger populations, and higher levels of urbanization, which to some extent hinder the restoration and improvement of the ecological environment.
4.3 ULI weighting system and urbanization process
Based on the actual urbanization development situation in Jiangsu Province, this paper utilized the PESS model and selected 16 types of socioeconomic data. The AHP-CRITIC weighting method was then utilized to obtain the comprehensive weights of each indicator, as presented in Table 6.
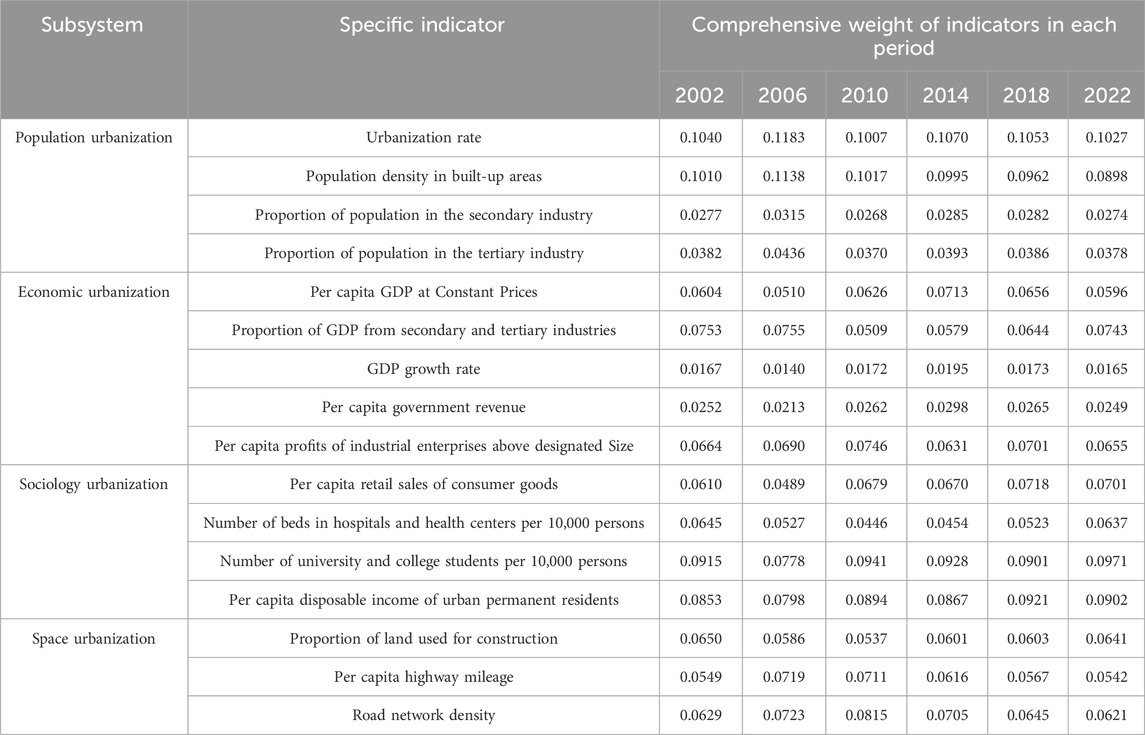
Table 6. Comprehensive weights of each indicator from 2002 to 2022.
Using the ULI formula, the urbanization level index for each district and county unit in Jiangsu Province was calculated. The ULI was categorized into five levels using equal interval classification: high level (0.8–1), relatively high level (0.6–0.8), moderate level (0.4–0.6), relatively low level (0.2–0.4), and low level (0–0.2). The results are shown in Figure 6.
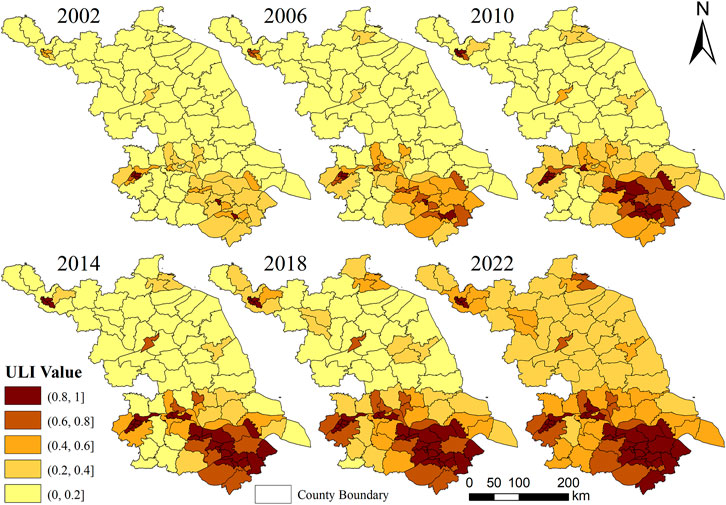
Figure 6. ULI value distribution of district and county units in Jiangsu Province.
Urbanization levels in Jiangsu Province have exhibited a consistent upward tendency from 2002 to 2022. However, there is a significant disparity between the southern and northern regions, with more rapid growth in southern Jiangsu and relatively slower growth in northern Jiangsu. In 2002, the majority of units in Jiangsu Province were at the low level, with 56 units accounting for 58.33%. Urbanization levels in the southern region were significantly higher than those in the northern region, aligning with the practical situation. Notably, Nanjing, Wuxi, and Suzhou, as important components of the Yangtze River Delta urban agglomeration, had higher initial urbanization levels, with 6 high-level units. By 2014, significant urbanization progress was observed in southern Jiangsu, with an increase in high-level and relatively high-level units. In contrast, northern Jiangsu, constrained by factors such as transportation, climate, and investment, showed limited self-development capacity, leading to only modest improvements in urbanization levels. At this time, there were 42 low-level units (43.75%) mainly distributed in the north, while 26 high-level units (27.08%) were primarily located in the south, radiating from major cities to surrounding areas. Starting from 2014, supported by poverty alleviation policies, a significant number of low-level units transitioned to relatively low and moderate levels, with this trend being particularly pronounced in northern Jiangsu. By 2022, all units had reached at least a relatively low level of urbanization, with a notable increase in high-level units, totaling 31 and accounting for 32.29%.
4.4 Analysis of the coupling coordination relationship between MRSEI and ULI
To analyze the coordinated development pattern between ecological environmental quality and urbanization level in Jiangsu Province, the coupling coordination degree model was used in conjunction with the MRSEI and ULI to determine the distribution of coupling coordination types, as shown in Figure 7.
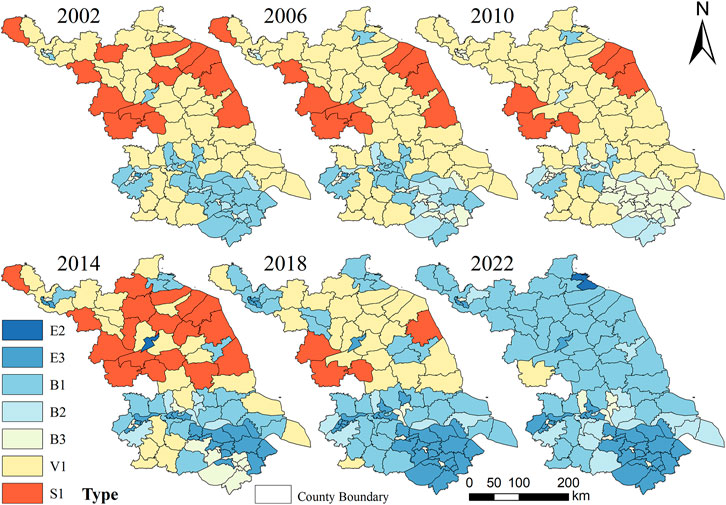
Figure 7. Coupling coordination type distribution of district and county units in Jiangsu Province.
The results showed that from 2002 to 2022, the overall CCD in Jiangsu Province has significantly improved, high-value areas are centered around the Yangtze River Delta urban agglomeration. In 2002, the Yangtze River Delta urban agglomeration and its surrounding areas, where both the ecological environment and urbanization level were higher, exhibited a relatively high CCD. District and county units in this area achieved basic coordination, with a predominant type of urbanization lag. Conversely, in the northern region, where urbanization and ecological environment levels were lower, severe disorder units were predominantly observed, and the type was urbanization lag. By 2010, improvements in both the ecological environment and urbanization in the north led to an increased CCD. The number of severe disorder units decreased from 13 in 2002 to 6 in 2010. Meanwhile, in the Yangtze River Delta urban agglomeration, ecological environmental deterioration coupled with ongoing urbanization led to a shift from urbanization lag to synchronous development and eco-environment lag. In 2014, with a significant overall improvement in the ecological environmental quality of Jiangsu, the CCD in southern Jiangsu also improved, characterized by an increase in both basic and extreme coordination units. The Yangtze River Delta urban agglomeration and its surrounding areas are mainly classified as extreme coordination with eco-environment lag and basic coordination with eco-environment lag units. In contrast, northern Jiangsu experienced a significant increase in severe disorder with urbanization lag units, reaching 18 due to a mismatch between lower urbanization levels and higher ecological environmental quality. From 2014 onwards, with stable overall ecological environmental quality and steady urbanization growth, the CCD continued to improve. Northern units increased at a faster rate. By 2022, most units had reached basic or extreme coordination, accounting for 98.96%. Northern units were predominantly classified as basic coordination with urbanization lag, while southern central cities had units classified as extreme coordination with eco-environment lag, and surrounding units were classified as basic coordination. Overall, despite the rapid urbanization in Jiangsu over the past 20 years, the implementation of environmental protection and ecological restoration measures has led to a high level of overall coupling coordination. Furthermore, there are regional differences between the south and north. In the south, urbanization exerts significant pressure on the ecological environment, while in the north, the ecological environment imposes a more pronounced constraint on urbanization.
As presented in Figure 8, over the past 2 decades, the proportions of V1 and S1 units have significantly decreased, while E3 and B1 units have notably increased, reaching a total proportion of 73.96% in 2022. This indicated that although Jiangsu Province has not fully achieved synchronous development between the ecological environment and urbanization, there has been substantial improvement in coupling coordination. The mean MRSEI exhibited an overall decreasing trend from 2002 to 2010 and a sharp increase from 2010 to 2014, and then, it remained relatively stable from 2014 to 2022. This suggested that the ecological environment in Jiangsu Province initially deteriorated due to urbanization but subsequently recovered due to environmental protection measures, eventually reaching a stable level. The mean ULI exhibited a steady upward trend from 2002 to 2014, with a noticeable acceleration in growth from 2014 to 2022, eventually reaching a high level. This indicated that urbanization in Jiangsu Province has been progressing steadily, with its pace accelerating further due to policies such as poverty alleviation. The mean CCD maintained a relatively fast growth rate except for the period from 2010 to 2014. This reflected that with improvements in the MRSEI and increases in the ULI, the interaction between the ecological environmental quality and urbanization level has become more coordinated, achieving a relatively balanced development state.
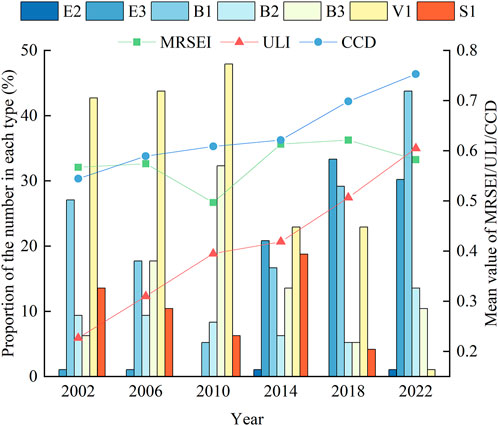
Figure 8. Proportion of each type and mean values of MRSEI/ULI/CCD in district and county units of Jiangsu Province.
Based on existing research, the 20-year changes in the MRSEI, ULI, and CCD at the county level in Jiangsu Province are categorized into five levels: change >0.3 as Dramatic Increase (DI), 0.3 > change >0.1 as Slight Increase (SI), 0.1 > change > −0.1 as Remain Stable (RS), −0.1 > change > −0.3 as Slight Decrease (SD), and change < −0.3 as Dramatic Decrease (DD). The spatial autocorrelation of these changes is analyzed using the local Moran’s I index, as presented in Figure 9.
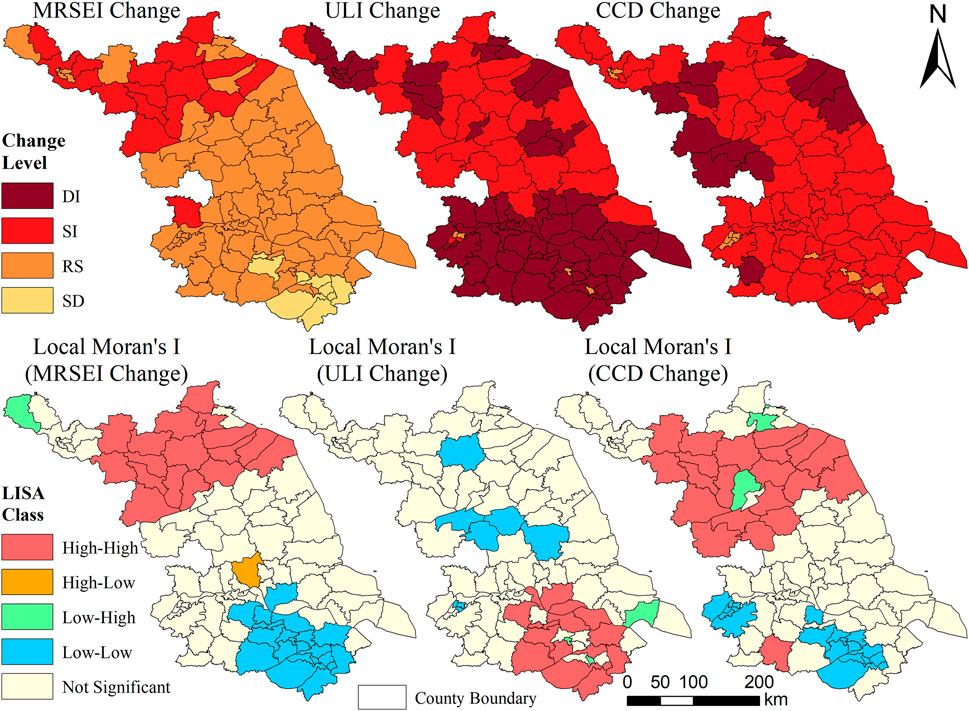
Figure 9. Changes in MRSEI/ULI/CCD and their local spatial autocorrelation distribution in Jiangsu Province.
The results indicated significant spatial autocorrelation in the changes in the MRSEI, ULI, and CCD in the study area. Specifically, the high–high clusters of MRSEI changes are concentrated in the northern part of Jiangsu Province, while the low–low clusters are concentrated in the southern part. This suggested significant improvement in the ecological environment in northern Jiangsu, whereas southern Jiangsu showed less improvement or even deterioration. The low–low clusters of ULI changes were identified in Huaian, Suqian, and Taizhou in the north and Nanjing in the south. The slow urbanization in the northern region was attributed to development constraints, while the limited progress in the southern region resulted from its already high initial level of urbanization. A similar pattern was observed in the high–high clusters, where central urban areas in the south showed less improvement in urbanization compared to their surrounding regions. The high–high clusters of CCD changes were mainly located in northern Jiangsu, while the low–low clusters were primarily in large cities such as Nanjing, Suzhou, and Wuxi. This indicated that over the past 20 years, northern regions with initially low ecological and urbanization levels have shown significant improvement. In contrast, economically developed and ecologically superior southern cities have experienced ecological degradation and excessively high urbanization, hindering the coordinated development of these two factors.
4.5 Investigation of factors affecting the MRSEI
The single-factor detector results showed that all influencing factors in this study have p-values below 0.01, indicating significant effects of the independent variables on the MRSEI’s spatial heterogeneity. The q values for the kNDVI, LST, WET, ENDISSI, PCP, TEMP, NTL, and POP were 0.82, 0.47, 0.26, 0.61, 0.12, 0.11, 0.23, and 0.09, respectively. Over the past 20 years, the kNDVI, the ENDISSI, and LST have had the most significant impact on MRSEI, serving as critical determinants of the ecological environment in Jiangsu Province (Figure 10). Notably, in 2002, the q value of the kNDVI was relatively low, while that of WET was high. Given that Jiangsu Province experienced severe flooding in 2002, which adversely affected vegetation growth, this situation is understandable.
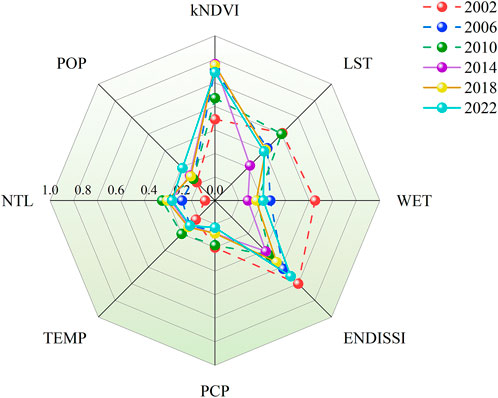
Figure 10. The q value of each influencing factor on the MRSEI in Jiangsu Province.
In this study, the interaction detector was employed to evaluate the joint impact of two independent variables on the MRSEI, obtaining 28 interaction results (Figure 11). The results show that from 2002 to 2022, the interactions involved bivariate enhancement and nonlinear enhancement. The interaction analysis offers more deterministic insight than the two independent variables alone, better elucidating the study area’s ecological driving force.
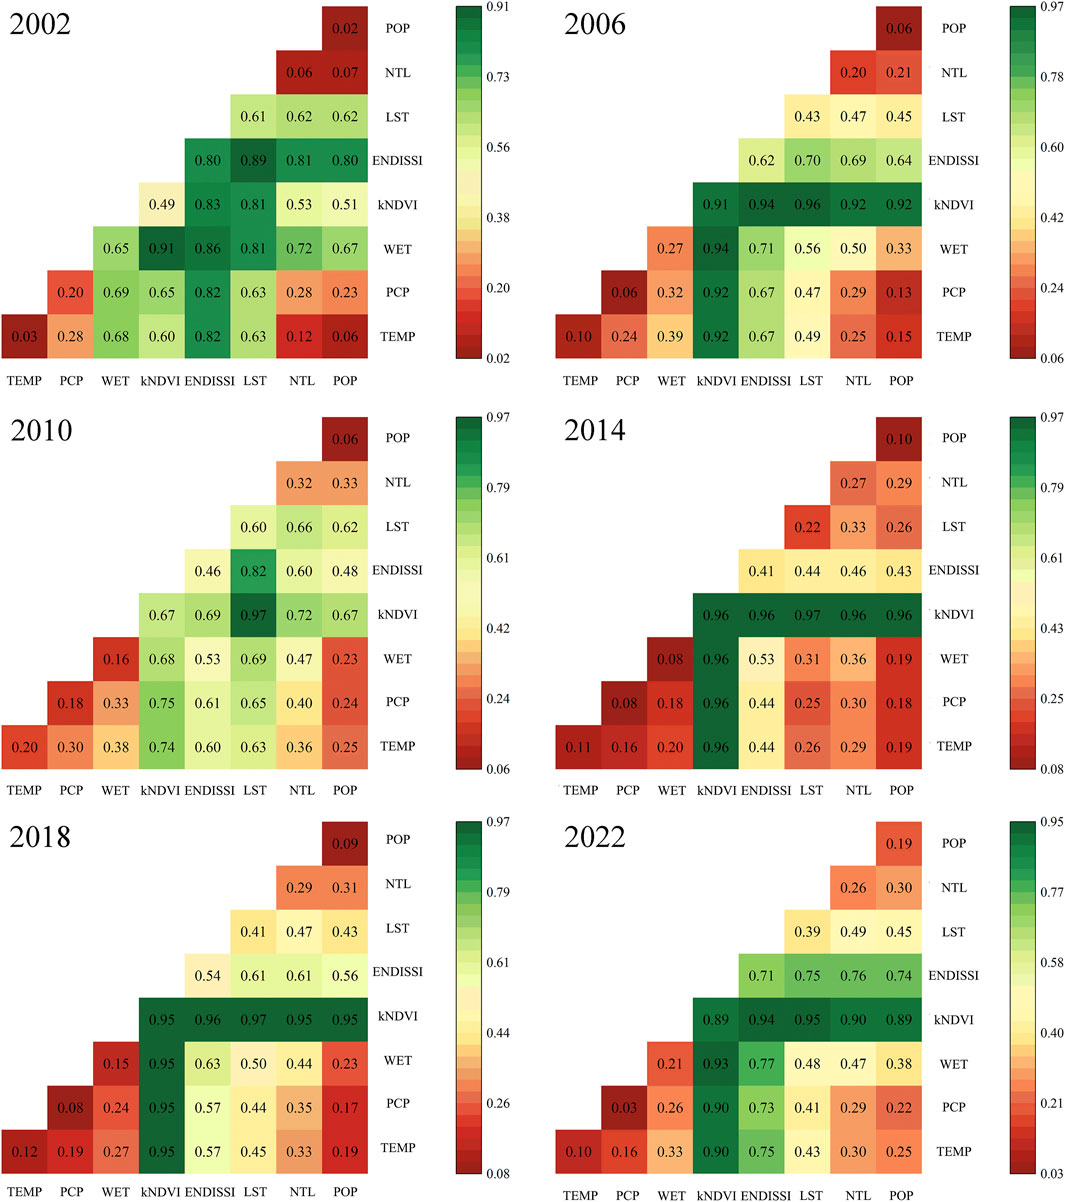
Figure 11. The interaction results of various influencing factors on the MRSEI in Jiangsu Province.
Specifically, in 2002, the study identified 19 instances of bivariate enhancement and 9 instances of nonlinear enhancement, with WET∩kNDVI presenting the greatest explanatory capability (q = 0.91), followed by ENDISSI∩LST (q = 0.89). By 2006, the number of bivariate enhancements had increased to 22, while the number of nonlinear enhancements had declined to 6, where LST∩kNDVI demonstrated the greatest explanatory capability (q = 0.96), followed by WET∩kNDVI and ENDISSI∩kNDVI (q = 0.94). By 2010, instances of bivariate enhancement rose to 27, along with one nonlinear enhancement, with LST∩kNDVI maintaining the greatest explanatory capability (q = 0.97) and ENDISSI∩LST following (q = 0.82). In 2014, there were 22 bivariate enhancements and 6 nonlinear enhancements, again with LST∩kNDVI showing the greatest explanatory capability (q = 0.97). This year also saw a relatively great explanatory capability for the kNDVI combined with other influencing factors (q = 0.96). By 2018, there were 25 instances of bivariate enhancement and 3 instances of nonlinear enhancement, with LST∩kNDVI remaining the most significant (q = 0.97), followed by ENDISSI∩kNDVI (q = 0.96). Finally, in 2022, there were 25 instances of bivariate enhancement and 3 instances of nonlinear enhancement, with LST∩kNDVI still demonstrating the greatest explanatory capability (q = 0.95), followed by ENDISSI∩kNDVI (q = 0.94).
This study utilized the risk detector to identify factors that positively influence ecological environmental quality, specifying their range (Figure 12). The risk detector results revealed that the highest MRSEI mean values occurred within 0–0.52 LST, 0.54–0.8 WET, 0.77–1 kNDVI, and 0–0.52 ENDISSI ranges. Furthermore, the digital values of NTL and POP reflected urbanization level and population density based on their respective characteristics. In this study, Jiangsu Province’s highest MRSEI mean values were observed within the NTL range of 0–18 and POP range of 0–987, indicating that higher levels of urbanization and human activity negatively impact the ecological environment. The study area also exhibited the highest MRSEI mean values within the PCP range of 747–1,030 mm and TEMP range of 12.86°C–15.11°C. Notably, WET and PCP demonstrated similar effects on the ecological environment within the same year. In 2010 and 2014, the lowest MRSEI mean values were associated with higher WET and PCP ranges, whereas in other years, the lowest mean values corresponded to their lower ranges.
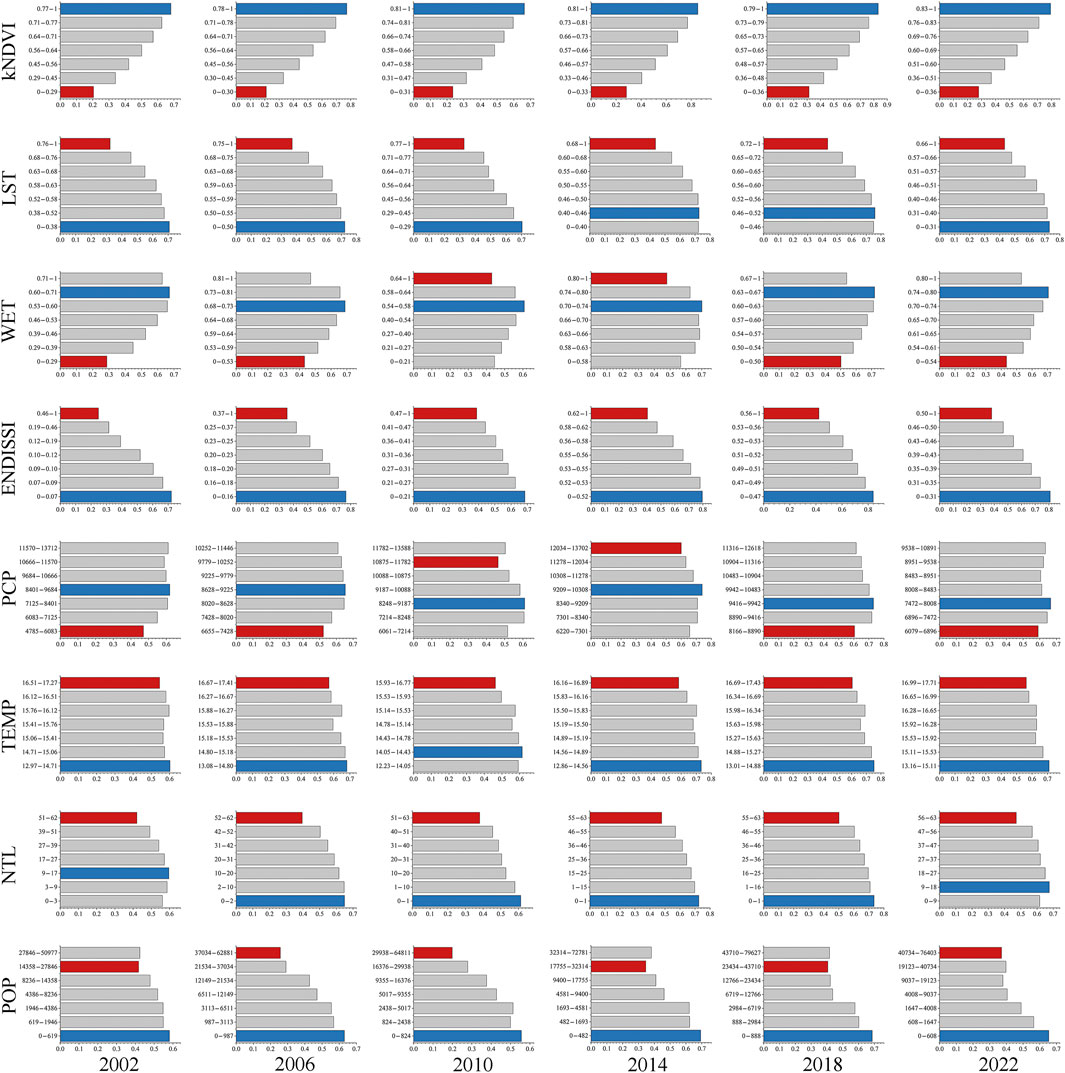
Figure 12. The adaptability of various influencing factors on the MRSEI in Jiangsu Province.
5 Discussion
5.1 Advantages of MRSEI and ULI
This paper introduced the MRSEI and the ULI, which were utilized to characterize the ecological environmental quality and urbanization level in Jiangsu Province, respectively. The MRSEI replaced the NDVI with the kNDVI and the IBI with the ENDSI. The traditional NDVI is susceptible to factors such as soil background and atmospheric conditions, leading to saturation effects in areas with high vegetation cover (Li et al., 2022), which can distort calculation results. By introducing a kernel function, the kNDVI captured more complex nonlinear relationships in vegetation reflectance data, enhancing the accuracy and sensitivity of vegetation cover measurements. While the IBI primarily reflects human constructions in a region, its calculation method is relatively simple and can be easily disturbed by bare land and water bodies (Sun et al., 2015). The ENDSI, on the other hand, comprehensively considers the spectral characteristics of various land features, allowing for more accurate identification of buildings and reducing interference from other land features, thus providing more reliable building information. By incorporating the kNDVI and ENDSI, the MRSEI can more accurately reflect the actual status of vegetation cover and human constructions, providing more reliable ecological environmental quality assessment results. Based on the PESS model, we selected 16 urbanization evaluation indicators to calculate the ULI. Economic development is the core and driving force of urbanization, while population concentration in cities serves as its fundamental catalyst. The improvement of living standards enriches urbanization’s meaning, and changes in land use along with infrastructure development directly reflect its progress level (Wu et al., 2018). Using the AHP-CRITIC weighting method to determine the comprehensive weights of various indicators effectively integrated subjective and objective information, thereby enhancing the scientific validity and applicability of the evaluation results.
5.2 Analysis of changes in ecological environmental quality in Jiangsu Province
Studies have shown that in 2002, Jiangsu Province’s ecological environment exhibited a spatial pattern characterized by better conditions in the south and poorer conditions in the north. Higher MRSEI values were mainly concentrated in the Jianghuai Plain and the southwestern low hills and mountains (Dong et al., 2020), regions characterized by favorable water and heat conditions, abundant rainfall, and minimal human interference. In contrast, lower MRSEI values were predominantly found in the Huanghuai Plain, which experienced less rainfall, a drier climate, more arable and industrial land, and less natural vegetation (Li et al., 2022). However, with economic development, the ecological environment of the Yangtze River Delta Plain in the south, particularly within the Yangtze River Delta urban agglomeration, rapidly deteriorated (Xu and Yin, 2021). Meanwhile, the north, which experienced slower development, gradually improved and recovered its ecological environment, eventually surpassing the south by 2010. The prioritization of ecological civilization construction following the 18th National Congress of the Communist Party of China in 2012 led to various measures aimed at curbing further ecological deterioration. These measures included formulating environmental supervision methods (Ministry of Ecology and Environment of the People’s Republic of China, 2012) and addressing prominent environmental issues (Jiangsu Provincial People’s Government, 2014). By 2014, these efforts significantly improved Jiangsu’s ecological environment and maintained this level until 2022. Additionally, in 2021, China invested CNY 949.18 billion in environmental pollution control, representing 0.8% of the GDP. This investment, which has increased 5.96 times since 2002, reflected an average annual growth rate of 10.75% (Ministry of Ecology and Environment of the People’s Republic of China, 2022). This substantial increase in investment supports the inference that government intervention has effectively reversed the trend of ecological deterioration, leading to the rise and stabilization of the MRSEI in Jiangsu Province.
5.3 Analysis of urbanization process in Jiangsu Province
From 2002 to 2022, Jiangsu Province experienced a significant growth in urbanization, with the urbanization rate rising from 44.70% in 2002 to 75.04% in 2023 (Jiangsu Provincial Bureau of Statistics, 2024). This growth has been primarily driven by economic development and government policies, with varying characteristics of urbanization across different regions. Southern Jiangsu, which includes economically developed areas such as Nanjing, Suzhou, Wuxi, and Changzhou, exhibits the highest urbanization levels. This region is a key part of the Yangtze River Delta urban agglomeration, crucial for regional economic growth and central to Jiangsu’s urbanization process. In contrast, northern Jiangsu has historically had a weaker economic foundation, lower industrialization levels, and a slower urbanization process. However, since 2015, the Chinese government’s poverty alleviation campaign has provided increased support to these northern areas, leading to a notable acceleration in urbanization. By 2022, urbanization levels in the north had significantly improved. Despite these advancements, the negative impacts of urbanization on regional ecosystems are well documented (Li et al., 2021; Shen et al., 2022). Research showed that the degree of ecological degradation in the Yangtze River Delta urban agglomeration is considerably higher compared to other regions, as supported by studies such as those by Shi et al. (2023). Urbanization contributed to ecological degradation through land use changes and pollutant emissions, while the large volumes of greenhouse gases produced further exacerbate climate change. These effects have significant implications for both regional and global environments.
5.4 Analysis of coupling coordination between ecological environment and urbanization in Jiangsu Province
As urbanization advances, the tension between urban development and ecological preservation intensifies, making sustainable development a critical concern. Both the Millennium Development Goals (MDGs) and Sustainable Development Goals (SDGs) emphasize the need to balance economic growth with ecological protection (Eisenmenger et al., 2020). Over the past 20 years, Jiangsu Province has seen significant improvements in the coupling coordination between ecological environmental quality and the urbanization level. This enhancement has been particularly notable since 2014, reflecting a strengthening of the coordinated development between these two aspects. The analysis revealed that this positive change can be attributed to two main factors. First, the implementation of ecological protection measures has improved and stabilized the previously deteriorating ecological environment in southern Jiangsu, addressing the issue of eco-environment lag. Second, poverty alleviation policies have accelerated urbanization in northern Jiangsu, mitigating the urbanization lag that had previously slowed progress. Research indicates that the comprehensive policy measures adopted by Jiangsu Province have yielded significant results in advancing regional sustainable development (Hu et al., 2022). These measures have not only improved ecological quality and mitigated the adverse effects of rapid urbanization but also fostered economic growth and social progress. Looking ahead, Jiangsu Province should emphasize sustainability and inclusiveness to find a balance between ecological preservation and urban development. This approach will ensure comprehensive and coordinated development and offer valuable insights for other regions seeking to achieve similar goals.
5.5 Analysis of influencing factors on ecological environmental quality in Jiangsu Province
According to the Geodetector analysis results, the kNDVI and ENDISSI are the two most significant factors affecting the ecological environmental quality in Jiangsu Province. This finding aligned with the characteristics of Jiangsu’s ecological environment, which is closely related to vegetation cover and human-made structures (Zheng et al., 2020; Jiang et al., 2021). It reflected the validity of the modified calculation methods for greenness and dryness in this study. LST also significantly impacted the MRSEI of the study area, which is logical given the influence of the heat island effect and land use changes on surface temperature. Furthermore, the kNDVI, LST, and ENDISSI exhibit the greatest explanatory capability. We believe that dryness and heat indirectly affected the ecological environmental quality of Jiangsu Province by influencing greenness. The reliability of this finding is corroborated by urban heat island research conducted by Rehman et al. (2022) and Wang et al. (2022). Additionally, the kNDVI demonstrated a strong explanatory capability with WET, PCP, and TEMP, consistent with the characteristics of Jiangsu’s subtropical monsoon climate. The study indicated that LST, ENDISSI, TEMP, NTL, and POP are significantly negatively correlated with the MRSEI, while the kNDVI showed a significant positive correlation with the MRSEI. Notably, excessively high or low WET and PCP result in a decline in the MRSEI. This may be attributed to extreme weather events, such as floods or droughts, which disrupt the ecological balance and negatively impact Jiangsu’s ecological environment (Wang et al., 2020; Zhu et al., 2020).
5.6 Limitations and potentials
Considering the study area’s characteristics, this paper utilized MODIS images with high temporal resolution and quality to construct a long-term series of ecological environmental quality in Jiangsu based on the MRSEI model. However, the spatial resolution of MODIS images is limited, hindering the detection of subtle changes in the ecological environment. Therefore, using higher spatial resolution remote sensing data for a detailed analysis of specific areas can improve analytical precision and reveal more subtle ecological changes. Although the MRSEI model can effectively characterize the ecological environmental quality in Jiangsu, it remains dependent on the quality of remote sensing images and the applicability of the algorithms. The evaluation results are limited by the capabilities of remote sensing information acquisition. To overcome this limitation, Zhang et al. (2024) utilized the Continuous Change Detection and Classification (CCDC) algorithm to construct a time-series model and developed a dynamic remote sensing ecological index. This approach refined the time scale of the RSEI in regional ecological quality monitoring and was applied to assess the spatiotemporal changes in ecological quality in Ningbo City. Introducing the CCDC algorithm in future research is crucial for meeting the requirements of ecological environmental quality monitoring across different regions and periods. Additionally, the CCD model may not fully capture all potential complex interactions and nonlinear relationships. Integrating the CCD model with other ecological models, such as the ecological footprint model (Wei et al., 2023) and the biodiversity model (Oskar, 2023), can provide a more comprehensive evaluation of the interactions between the ecological environment and urbanization.
6 Conclusion
(1) This study advanced the original remote sensing ecological index by introducing the MRSEI model, which improved the PC1 contribution rate by an average of 8.45% compared to the RSEI. Additionally, the absolute load values of the greenness and dryness components increased by 15.27% and 31.42%, respectively, indicating that the MRSEI integrates a broader range of indicator information. Furthermore, the incorporation of kNDVI and ENDISSI enhances sensitivity in representing ecological attributes in Jiangsu Province.
(2) By leveraging MODIS data on the GEE platform, this study conducted a detailed, long-term assessment of ecological environmental quality changes in Jiangsu Province from 2002 to 2022. Notably, the work uniquely documented a reversal in the spatial distribution pattern—from “better in the south and worse in the north” to “better in the north and worse in the south”—providing new insights into the region’s evolving environmental dynamics and the effectiveness of government interventions.
(3) Using the PESS model and 16 diverse socioeconomic indicators, this study innovatively assessed urbanization levels through the AHP-CRITIC weighting method. Over the past 20 years, urbanization in southern Jiangsu has been higher and has increased rapidly, forming a pattern centered around the Yangtze River Delta urban agglomeration and radiating outward. Conversely, northern Jiangsu has experienced lower urbanization levels with slower growth. This approach not only tracks urbanization trends but also integrates environmental and socioeconomic dimensions.
(4) The application of the CCD model to analyze the coupling coordination between the ecological environment and urbanization over the past 20 years is a distinctive feature of this study. From 2002 to 2022, the coupling coordination relationship in Jiangsu Province improved significantly. This study underscores how enhanced government interventions have mitigated the adverse impacts of rapid urbanization on the ecological environment, particularly by addressing the urbanization lag in northern Jiangsu and the eco-environment lag in southern Jiangsu.
(5) The application of the Geodetector to identify the primary drivers of ecological environmental quality—specifically kNDVI, ENDISSI, and LST—alongside an analysis of the heat island effect, introduced a novel dimension to this research. The study’s findings highlight the significant positive impact on MRSEI of improvements in greenness, heat, and dryness, while revealing negative correlations with LST, TEMP, NTL, and POP, providing critical insights for targeted environmental management.
Data availability statement
The raw data supporting the conclusions of this article will be made available by the authors, without undue reservation.
Author contributions
QL: Methodology, Software, Writing – original draft, Writing – review and editing. YG: Writing – review and editing. XL: Data curation, Investigation, Writing – review and editing.
Funding
The author(s) declare that financial support was received for the research and/or publication of this article. This study was funded by the Anhui Telit Science and Technology Co., LTD (grant number 220158).
Acknowledgments
The authors would like to acknowledge helpful comments from many researchers and colleagues.
Conflict of interest
The authors declare that the research was conducted in the absence of any commercial or financial relationships that could be construed as a potential conflict of interest.
The authors declare that this study received funding from Anhui Telit Science and Technology Co., LTD. The funder was not involved in the study design, collection, analysis, interpretation of data, the writing of this article, or the decision to submit it for publication.
Generative AI statement
The author(s) declare that no Generative AI was used in the creation of this manuscript.
Publisher’s note
All claims expressed in this article are solely those of the authors and do not necessarily represent those of their affiliated organizations, or those of the publisher, the editors and the reviewers. Any product that may be evaluated in this article, or claim that may be made by its manufacturer, is not guaranteed or endorsed by the publisher.
Supplementary material
The Supplementary Material for this article can be found online at: https://www.frontiersin.org/articles/10.3389/fenvs.2025.1537903/full#supplementary-material
References
Aizizi, Y., Kasimu, A., Liang, H., Zhang, X., Zhao, Y., and Wei, B. (2023). Evaluation of ecological space and ecological quality changes in urban agglomeration on the northern slope of the Tianshan Mountains. Ecol. Indic. 146, 109896. doi:10.1016/j.ecolind.2023.109896
An, M., Xie, P., He, W., Wang, B., Huang, J., and Khanal, R. (2022). Spatiotemporal change of ecologic environment quality and human interaction factors in three gorges ecologic economic corridor, based on RSEI. Ecol. Indic. 141, 109090. doi:10.1016/j.ecolind.2022.109090
Asabere, S. B., Acheampong, R. A., Ashiagbor, G., Beckers, S. C., Keck, M., Erasmi, S., et al. (2020). Urbanization, land use transformation and spatio-environmental impacts: analyses of trends and implications in major metropolitan regions of Ghana. Land Use Policy 96, 104707. doi:10.1016/j.landusepol.2020.104707
Boori, M. S., Choudhary, K., Paringer, R., and Kupriyanov, A. (2021). Spatiotemporal ecological vulnerability analysis with statistical correlation based on satellite remote sensing in Samara, Russia. J. Environ. Manag. 285, 112138. doi:10.1016/j.jenvman.2021.112138
Chen, C., Nie, P., Huang, F., Fan, D., Xiang, L., Zeng, J., et al. (2024). Ecological environmental quality evaluation and driving mechanism using modified RSEI model—a case study of Taojiang County, Hunan Province. Bull. Soil Water Conserv. 44 (3). doi:10.13961/j.cnki.stbctb.20240528.002
Chen, C., Wang, L., Yang, G., Sun, W., and Song, Y. (2023). Mapping of ecological environment based on Google Earth engine cloud computing platform and landsat long-term data: a case study of the zhoushan archipelago. Remote Sens. 15, 4072. doi:10.3390/rs15164072
Chen, J., Yang, K., Chen, S., Yang, C., Zhang, S., and He, L. (2019). Enhanced normalized difference index for impervious surface area estimation at the plateau basin scale. J. Appl. Remote Sens. 13, 1–016502. doi:10.1117/1.jrs.13.016502
Chen, X. (2020). Study on evaluation and regionalization of agroecological vulnerability in Guangxi. J. China Agric. Resour. Reg. Plan. 41, 212–219.
Cheng, L.-l., Wang, Z.-w., Tian, S.-f., Liu, Y.-t., Sun, M.-y., and Yang, Y.-m. (2021). Evaluation of eco-environmental quality in Mentougou District of Beijing based on improved remote sensing ecological index. Chin. J. Ecol. 40, 1177–1185. doi:10.13292/j.1000-4890.202104.021
Dong, F., Pan, Y., Zhang, X., and Sun, Z. (2020). How to evaluate provincial ecological civilization construction? The case of Jiangsu province, China. Int. J. Environ. Res. Public Health. 17, 5334. doi:10.3390/ijerph17155334
Eisenmenger, N., Pichler, M., Krenmayr, N., Noll, D., Plank, B., Schalmann, E., et al. (2020). The Sustainable Development Goals prioritize economic growth over sustainable resource use: a critical reflection on the SDGs from a socio-ecological perspective. Sustain. Sci. 15, 1101–1110. doi:10.1007/s11625-020-00813-x
Fang, C., Liu, H., and Wang, S. (2021). The coupling curve between urbanization and the eco-environment: China’s urban agglomeration as a case study. Ecol. Indic. 130, 108107. doi:10.1016/j.ecolind.2021.108107
Feng, Y., He, S., and Li, G. (2021). Interaction between urbanization and the eco-environment in the Pan-Third Pole region. Sci. Total Environ. 789, 148011. doi:10.1016/j.scitotenv.2021.148011
Gillespie, T. W., Ostermann-Kelm, S., Dong, C., Willis, K. S., Okin, G. S., and MacDonald, G. M. (2018). Monitoring changes of NDVI in protected areas of southern California. Ecol. Indic. 88, 485–494. doi:10.1016/j.ecolind.2018.01.031
Gong, C., Lyu, F., and Wang, Y. (2023). Spatiotemporal change and drivers of ecosystem quality in the Loess Plateau based on RSEI: a case study of Shanxi, China. Ecol. Indic. 155, 111060. doi:10.1016/j.ecolind.2023.111060
Gou, K., Jiang, H., and Liu, Z. (2021). Coupling coordination and influencing factors of rural water resource poverty and economic poverty in China during 2000–2017. Bull. Soil Water Conserv. 41, 255–263. doi:10.13961/j.cnki.stbctb.20210909.001
Healey, S. P., Cohen, W. B., Zhiqiang, Y., and Krankina, O. N. (2005). Comparison of Tasseled Cap-based Landsat data structures for use in forest disturbance detection. Remote Sens. Environ. 97, 301–310. doi:10.1016/j.rse.2005.05.009
Hu, K. Q., Lin, M. X., Lin, T., Ye, H., Zhang, G. Q., Sui, J. L., et al. (2022). Spatial identification and quantitative evaluation of conflict space between urban sprawl and ecological protection in the process of rapid urbanization: a case study of the Yangtze River Delta Eco-Green Integrated Development Demonstration Zone. Acta Ecol. Sin. 42, 462–473. doi:10.5846/stxb202102070402
Huang, C., Zhang, M., Zou, J., Zhu, A. x., Chen, X., Mi, Y., et al. (2015). Changes in land use, climate and the environment during a period of rapid economic development in Jiangsu Province, China. Sci. Total Environ. 536, 173–181. doi:10.1016/j.scitotenv.2015.07.014
Jiang, L., Liu, Y., Wu, S., and Yang, C. (2021). Analyzing ecological environment change and associated driving factors in China based on NDVI time series data. Ecol. Indic. 129, 107933. doi:10.1016/j.ecolind.2021.107933
Jiangsu Provincial Bureau of Statistics (2024). Jiangsu provincial statistical yearbook in 2023. Available online at: https://tj.jiangsu.gov.cn/index.html (Accessed May 16, 2024).
Jiangsu Provincial People’s Government (2014). Jiangsu province environmental bulletin in 2013. Available online at: https://www.jiangsu.gov.cn/art/2014/5/30/art_46680_2584240.html (Accessed April 22, 2024).
Lei, X., Liu, H., Li, S., Luo, Q., Cheng, S., Hu, G., et al. (2024). Coupling coordination analysis of urbanization and ecological environment in Chengdu-Chongqing urban agglomeration. Ecol. Indic. 161, 111969. doi:10.1016/j.ecolind.2024.111969
Li, J., Li, S., Guo, W., Yan, X., and Zhang, R. (2023). Ecological environment analysis of Shanxi province and coal mining areas based on modified remote sensing ecological index. Met. Mine. 52, 30–39.
Li, M., Yan, Q., and Li, G. (2022). The evaluation of ecological vulnerability of Xilingol based on EVI. Bull. Surv. Mapp. 0, 21–27. doi:10.13474/j.cnki.11-2246.2022.0289
Li, R., Huang, X., and Liu, Y. (2023). Spatio-temporal differentiation and influencing factors of China’s urbanization from 2010 to 2020. Acta Geogr. Sin. 78, 777–791. doi:10.11821/dlxb202304001
Li, W., Wang, Y., Xie, S., and Cheng, X. (2021). Coupling coordination analysis and spatiotemporal heterogeneity between urbanization and ecosystem health in Chongqing municipality, China. Sci. Total Environ. 791, 148311. doi:10.1016/j.scitotenv.2021.148311
Li, X., Wang, L., Pijanowski, B., Pan, L., Omrani, H., Liang, A., et al. (2022). The spatio-temporal pattern and transition mode of recessive cultivated land use morphology in the huaibei region of the Jiangsu province. Land 11, 1978. doi:10.3390/land11111978
Li, Y., Li, Z., Wang, J., and Zeng, H. (2022). Analyses of driving factors on the spatial variations in regional eco-environmental quality using two types of species distribution models: a case study of Minjiang River Basin, China. Ecol. Indic. 139, 108980. doi:10.1016/j.ecolind.2022.108980
Liang, L. W., Wang, Z. B., Fang, C. L., and Sun, Z. (2019). Spatiotemporal differentiation and coordinated development pattern of urbanization and the ecological environment of the Beijing-Tianjin-Hebei urban agglomeration. Acta Ecol. Sin. 39, 1212–1225. doi:10.5846/stxb201809162015
Liu, J., Li, H., and Liu, T. (2022). Decoupling regional economic growth from industrial CO2 emissions: empirical evidence from the 13 prefecture-level cities in Jiangsu province. Sustainability 14, 2733. doi:10.3390/su14052733
Liu, R.-j., and Ba, D.-x. (2020). The relationship between urban compactness and urbanization level in capital cities of China. J. Nat. Resour. 35, 586–600. doi:10.31497/zrzyxb.20200307
Liu, X., Wang, H., Wang, X., Bai, M., and He, D. (2021). Driving factors and their interactions of carabid beetle distribution based on the geographical detector method. Ecol. Indic. 133, 108393. doi:10.1016/j.ecolind.2021.108393
Ministry of Ecology and Environment of the People’s Republic of China (2006). Announcement on the release of the technical specifications for ecological environment assessment. Available online at: https://www.mee.gov.cn/gkml/zj/gg/200910/t20091021_171618.htm (Accessed January 15, 2024).
Ministry of Ecology and Environment of the People’s Republic of China (2012). Environmental monitoring measures. Available online at: https://www.mee.gov.cn/gzk/gz/202112/t20211210_963744.shtml (Accessed April 25, 2024).
Ministry of Ecology and Environment of the People’s Republic of China (2022). 2021 ecological environment annual report. Available online at: https://www.mee.gov.cn/hjzl/sthjzk/sthjtjnb/202301/W020230118392178258531.pdf (Accessed May 29, 2024).
Oskar, H. (2023). Coupling eco-evolutionary mechanisms with deep-time environmental dynamics to understand biodiversity patterns. Ecography 2023, e06132. doi:10.1111/ecog.06132
Peng, X., Zhang, S., Peng, P., Chen, A., Li, Y., Wang, J., et al. (2023). Unraveling the ecological tapestry: a comprehensive assessment of changtang nature reserve’s ecological and environmental using RSEI and GEE. Land 12, 1581. doi:10.3390/land12081581
Rehman, A., Qin, J., Shafi, S., Khan, M. S., Ullah, S., Ahmad, K., et al. (2022). Modelling of land use/cover and LST variations by using gis and remote sensing: a case study of the northern pakhtunkhwa mountainous region, Pakistan. Sensors 22, 4965. doi:10.3390/s22134965
Seifollahi-Aghmiuni, S., Kalantari, Z., Egidi, G., Gaburova, L., and Salvati, L. (2022). Urbanisation-driven land degradation and socioeconomic challenges in peri-urban areas: insights from Southern Europe. Ambio. 51, 1446–1458. doi:10.1007/s13280-022-01701-7
Shen, Z., Wu, W., Tian, S., and Wang, J. (2022). A multi-scale analysis framework of different methods used in establishing ecological networks. Landsc. Urban Plann 228, 104579. doi:10.1016/j.landurbplan.2022.104579
Shi, Z., Wang, Y., and Zhao, Q. (2023). Analysis of spatiotemporal changes of ecological environment quality and its coupling coordination with urbanization in the Yangtze River Delta urban agglomeration, China. Int. J. Environ. Res. Public Health. 20, 1627. doi:10.3390/ijerph20021627
Song, C., Sun, C., Xu, J., and Fan, F. (2022). Establishing coordinated development index of urbanization based on multi-source data: a case study of Guangdong-Hong Kong-Macao Greater Bay Area, China. Ecol. Indic. 140, 109030. doi:10.1016/j.ecolind.2022.109030
Sun, Q., Bai, Z., Cao, Y., Xie, M., Hu, X., Jiang, Y., et al. (2015). Ecological risk assessment of land destruction in large open-pit mine. Trans. Chin. Soc. Agric. Eng. Trans. CSAE 31, 278–288. doi:10.11975/j.issn.1002-6819.2015.17.037
Taloor, A. K., Drinder Singh, M., and Chandra Kothyari, G. (2021). Retrieval of land surface temperature, normalized difference moisture index, normalized difference water index of the Ravi basin using Landsat data. Appl. Comput. Geosci. 9, 100051. doi:10.1016/j.acags.2020.100051
Tang, L., Hu, X. J., Luo, Z. W., Wei, B. J., Wang, Y. Z., Zhang, Y. L., et al. (2024). Spatiotemporal coupling of ecological vulnerability and urbanization level and their interactive influencing factors: a case study of Hunan Province. Acta Ecol. Sin. 44, 4662–4677. doi:10.20103/j.stxb.202307181532
Tang, P., Huang, J., Zhou, H., Fang, C., Zhan, Y., and Huang, W. (2021). Local and telecoupling coordination degree model of urbanization and the eco-environment based on RS and GIS: a case study in the Wuhan urban agglomeration. Sustain. Cities Soc. 75, 103405. doi:10.1016/j.scs.2021.103405
Wang, G., Zhang, Q., Yu, H., Shen, Z., and Sun, P. (2020). Double increase in precipitation extremes across China in a 1.5 °C/2.0 °C warmer climate. Sci. Total Environ. 746, 140807. doi:10.1016/j.scitotenv.2020.140807
Wang, J. F., Zhang, T. L., and Fu, B. J. (2016). A measure of spatial stratified heterogeneity. Ecol. Indic. 67, 250–256. doi:10.1016/j.ecolind.2016.02.052
Wang, Q., Moreno-Martínez, Á., Muñoz-Marí, J., Campos-Taberner, M., and Camps-Valls, G. (2023). Estimation of vegetation traits with kernel NDVI. ISPRS J. Photogramm. Remote Sens. 195, 408–417. doi:10.1016/j.isprsjprs.2022.12.019
Wang, S., Cui, Z., Lin, J., Xie, J., and Su, K. (2021). Coupling relationship between urbanization and ecological resilience in the Pearl River Delta. Acta Geogr. Sin. 76, 973–991. doi:10.11821/dlxb202104013
Wang, Y., Liu, J., Zhou, L., Ren, C., and Zhang, B. (2023). Temporal and spatial evolution and prediction of ecological vulnerability in Songhua River basin based on AHP-SPCA entropy weight model. Bull. Soil Water Conserv. 43, 212–219. doi:10.13961/j.cnki.stbctb.2023.02.025
Wang, Z., Bai, T., Xu, D., Kang, J., Shi, J., Fang, H., et al. (2022). Temporal and spatial changes in vegetation ecological quality and driving mechanism in kökyar project area from 2000 to 2021. Sustainability 14, 7668. doi:10.3390/su14137668
Wei, Z., Jian, Z., Sun, Y., Pan, F., Han, H., Liu, Q., et al. (2023). Ecological sustainability and high-quality development of the Yellow River Delta in China based on the improved ecological footprint model. Sci. Rep. 13, 3821. doi:10.1038/s41598-023-30896-2
Wu, C., Chen, B., Huang, X., and Dennis Wei, Y. H. (2020). Effect of land-use change and optimization on the ecosystem service values of Jiangsu province, China. Ecol. Indic. 117, 106507. doi:10.1016/j.ecolind.2020.106507
Wu, H., Guo, B., Fan, J., Yang, F., Han, B., Wei, C., et al. (2021). A novel remote sensing ecological vulnerability index on large scale: a case study of the China-Pakistan Economic Corridor region. Ecol. Indic. 129, 107955. doi:10.1016/j.ecolind.2021.107955
Wu, X., and Zhang, H. (2021). Evaluation of ecological environmental quality and factor explanatory power analysis in western Chongqing, China. Ecol. Indic. 132, 108311. doi:10.1016/j.ecolind.2021.108311
Wu, Y., Liu, Y., and Li, Y. (2018). Spatio-temporal coupling of demographic-landscape urbanization and its driving forces in China. Acta Geogr. Sin. 73, 1865–1879. doi:10.11821/dlxb201810004
Wu, Y., Shi, K., Chen, Z., Liu, S., and Chang, Z. (2021). Developing improved time-series DMSP-OLS-like data (1992–2019) in China by integrating DMSP-OLS and SNPP-VIIRS. IEEE Trans. Geosci. Remote Sens. 60, 1–14. doi:10.1109/tgrs.2021.3135333
Xiong, X., and Xiao, J. (2021). Evaluation of coupling coordination between urbanization and eco-environment in six central cities, Wuling Mountain area. Acta Ecol. Sin. 41, 5973–5987. doi:10.5846/stxb202012183216
Xiong, Y., Xu, W., Lu, N., Huang, S., Wu, C., Wang, L., et al. (2021). Assessment of spatial–temporal changes of ecological environment quality based on RSEI and GEE: a case study in Erhai Lake Basin, Yunnan province, China. Ecol. Indic. 125, 107518. doi:10.1016/j.ecolind.2021.107518
Xu, H. (2013). A remote sensing urban ecological index and its application. Shengtai Xuebao/Acta Ecol. Sin. 33, 7853–7862. doi:10.5846/stxb201208301223
Xu, Z., and Yin, Y. (2021). Regional development quality of Yangtze River Delta: from the perspective of urban population agglomeration and ecological efficiency coordination. Sustainability 13, 12818. doi:10.3390/su132212818
Yang, K. C., Bi, R. C., Sun, R. H., and Chen, L. D. (2017). The spatio-temporal changes of urbanization in Beijing-Tianjin-Hebei region in Northern China. Acta Ecol. Sin. 37, 3998–4007. doi:10.5846/stxb201703070378
Yang, L.-j., Zhang, X.-h., Pan, J.-h., and Yang, Y.-c. (2021). Coupling coordination and interaction between urbanization and eco-environment in Cheng-Yu urban agglomeration, China. Chin. J. Appl. Ecol. 32, 993–1004. doi:10.13287/j.1001-9332.202103.012
Yang, W., Zhou, Y., and Li, C. (2023). Assessment of ecological environment quality in rare Earth mining areas based on improved RSEI. Sustainability 15, 2964. doi:10.3390/su15042964
Yang, X., Meng, F., Fu, P., Zhang, Y., and Liu, Y. (2021). Spatiotemporal change and driving factors of the eco-environment quality in the Yangtze River basin from 2001 to 2019. Ecol. Indic. 131, 108214. doi:10.1016/j.ecolind.2021.108214
Yin, S.-g., Yang, S., and Li, Z.-j. (2022). Spatial pattern and influencing factors of ecological urbanization in the Yangtze River Delta. J. Nat. Resour. 37, 1494–1506. doi:10.31497/zrzyxb.20220609
Yuan, B., Fu, L., Zou, Y., Zhang, S., Chen, X., Li, F., et al. (2021). Spatiotemporal change detection of ecological quality and the associated affecting factors in Dongting Lake Basin, based on RSEI. J. Clean. Prod. 302, 126995. doi:10.1016/j.jclepro.2021.126995
Zhang, S., Sun, C., Hu, M., Zheng, J. H., and Liu, Y. C. (2024). Construction of dynamic remote sensing ecological index using the Continuous Change Detection and Classification (CCDC) algorithm. Acta Ecol. Sin. 44, 497–510. doi:10.20103/j.stxb.202301190125
Zhang, W., Du, P. J., Guo, S. C., Lin, C., Zheng, H. R., and Fu, P. J. (2023). Enhanced remote sensing ecological index and ecological environment evaluation in arid area. Natl. Remote Sens. Bull. 27, 299–317. doi:10.11834/jrs.20221527
Zheng, Z., Wu, Z., Chen, Y., Yang, Z., and Marinello, F. (2020). Exploration of eco-environment and urbanization changes in coastal zones: a case study in China over the past 20 years. Ecol. Indic. 119, 106847. doi:10.1016/j.ecolind.2020.106847
Zhou, L., Li, W., Wang, Y., Bian, H., Wang, Q., Liu, Y., et al. (2023). Spatiotemporal coupling characteristics between urbanization and ecosystem health in Chongqing City. Bull. Soil Water Conserv. 43, 397–408. doi:10.13961/j.cnki.stbctb.20230419.001
Zhu, L., Meng, J., and Zhu, L. (2020). Applying Geodetector to disentangle the contributions of natural and anthropogenic factors to NDVI variations in the middle reaches of the Heihe River Basin. Ecol. Indic. 117, 106545. doi:10.1016/j.ecolind.2020.106545
Zhu, R., Ao, Z., and Jiang, Y. (2024). Assessment of ecological environment vulnerability in Tianshui city based on the CRITIC objective weighting method. J. Desert Res. 44, 321–331. doi:10.7522/j.issn.1000-694X.2024.00060
Keywords: Jiangsu province, modified remote sensing ecological index, urbanization level index, AHP-CRITIC weighting method, coupling coordination degree model, geodetector
Citation: Luo Q, Guan Y and Lei X (2025) Spatiotemporal coupling coordination between ecological environmental quality and urbanization level and influencing factors of eco-environment: a case study of Jiangsu, China. Front. Environ. Sci. 13:1537903. doi: 10.3389/fenvs.2025.1537903
Received: 02 December 2024; Accepted: 27 May 2025;
Published: 01 September 2025.
Edited by:
Venkata Ravibabu Mandla, National Institute of Rural Development and Panchayati Raj, IndiaReviewed by:
Zhen Zhang, Anhui University of Science and Technology, ChinaPrathiba Palanisamy, Indian Institute of Technology Roorkee, India
Copyright © 2025 Luo, Guan and Lei. This is an open-access article distributed under the terms of the Creative Commons Attribution License (CC BY). The use, distribution or reproduction in other forums is permitted, provided the original author(s) and the copyright owner(s) are credited and that the original publication in this journal is cited, in accordance with accepted academic practice. No use, distribution or reproduction is permitted which does not comply with these terms.
*Correspondence: Yuwei Guan, Z3Vhbnl1d2VpQHVlc3RjLmVkdS5jbg==