Abstract
Human activities and climate change exert significant influence on global land-use and land-cover (LULC) alteration. The integration of geo-spatial and remote sensing technologies is pivotal in comprehending these dynamics and formulating strategies for future natural resource management. This research is centered on the modeling of spatio-temporal trajectories of landscape transformation spanning from 1988 to 2018, with a forward-looking scenario up to 2040. By leveraging imagery from Landsat 5, LISS-3, and Sentinel 2A MSI, a detailed assessment of LULC changes was carried out for the Mashi Dam command (CMD) area in Rajasthan, India, covering a total expanse of 90.07 km2. Rigorous validation of the 2018 land cover map against ground-truth data ensured the reliability of predictions, which were subsequently utilized to forecast LULC patterns for 2031 and 2041. The analysis uncovered significant impacts on cropland, barren land, built-up areas, and scrub land throughout the study period. Notably, built-up areas, water bodies, and barren land exhibited substantial growth from 2008 to 2018, while cropland experienced a decline of 4.75% in the same timeframe. Projections indicate a further reduction in cropland by 2041, accompanied by an expansion of barren land. These results underscore the critical imperative for effective land management strategies to mitigate the conversion of cropland and scrub land into barren areas, thereby ensuring the sustainable utilization of agricultural resources in the region.
1 Introduction
Land use and land cover (LULC) are intertwined concepts that delineate the utilization of land and the assortment of vegetation and features adorning its surface. Land use encapsulates human activities on the land, while land cover embodies the physical attributes such as mountains, forests, vegetation, water bodies, and other natural elements (Pandey et al., 2021). The significance of land use and land cover lies in their profound influence on the environment and human sustenance (Moharir et al., 2025). Human endeavors like agriculture, mining, industrialization, and urbanization wield substantial impacts on the natural milieu, sculpting the land composition and modulating ecosystem services (Naikoo et al., 2020).
The dynamics of land use and land cover transformation can exacerbate climate change, biodiversity loss, and other environmental dilemmas. A comprehensive comprehension of these patterns holds paramount importance across diverse domains including land management, urban planning, natural resource stewardship, and environmental sustainability. Moreover, it guides policy formulations concerning sustainable development, conservation, and climate change mitigation. Remote sensing methodologies, notably satellite imagery, are frequently harnessed to scrutinize global and regional land use and land cover dynamics (Pande et al., 2024). These techniques furnish invaluable insights into temporal shifts and spatial variations in land utilization and coverage. In essence, the intricate interplay between land use and land cover serves as a crucial nexus for unraveling the intricate relationship between human undertakings and the natural ecosystem (Moharir et al., 2025).
The alteration in land use and land cover is a pervasive global concern with far-reaching implications for numerous regions worldwide. The swift appropriation of natural resources driven by ongoing human civilization development and heightened living standards has brought about substantial global transformations in land cover. Regrettably, over 80% of the Earth’s natural resources, notably land cover, have already endured degradation due to human activities (Pande et al., 2024).
Worldwide, LULC variation commonly issues the interference of the configuration and useful of terrestrial environments (Lambin and Meyfroidt, 2011; Winkler et al., 2021). LULC variation is difficult phenomenons that includes a variation in the determination, used to and purpose of a landscape and can get various systems, such as urbanization, deforestation and infrastructure growth (Foley et al., 2005; Song et al., 2018; Ersoy Tonyaloğlu, 2025). Various factors give to LULC changes entire different areas of the world. These alterations are mainly driven by both natural procedures and human activities (Ragini et al., 2023). Natural influences, adding into climatic differences, topography, soil composition, wildfires, and unforeseen events, serve as the basis for LULC transformations and use incomplete control over these shifts. Similarly, the human-induced aspects like population growth (Khan et al., 2023; Waleed et al., 2023), it is crucial role in determining LULC patterns.
Within India, out of the country’s expansive total geographic area of 328.7 million hectares, approximately 146.82 million hectares bear the brunt of various forms of land use and land cover change. Notably, land cover change has left a substantial impact on watershed areas, river corridors, and irrigated lands, precipitating significant disturbances (Pande et al., 2018). The gravity of the situation is such that simply halting further land abuse may not suffice to naturally restore these lands. The proliferation of degraded lands in the country is predominantly linked to the adoption of unsustainable agricultural practices, mining, and the excessive utilization of irrigation methods, intensifying the processes of land degradation, and propelling its rapid expansion (Pande et al., 2018).
1.1 LULC change impact on irrigated lands
In recent years, irrigated land-use and land-cover (LULC) dynamics have undergone significant changes due to anthropogenic interventions, including excessive irrigation and the overuse of fertilizers. These unsustainable practices have led to land degradation in several regions. This study aims to assess the impacts of such alterations and promote sustainable management strategies to mitigate degradation while raising awareness about the preservation of irrigated lands, particularly in arid and semi-arid regions (Su et al., 2024). Variations in land cover and land use patterns surrounding irrigated areas have the potential to modify the accessibility and quality of water resources as well as the properties of the soil. Moreover, these changes can impact water infiltration rates and groundwater recharge, consequently influencing the soil’s water-holding capacity and overall irrigation efficiency. Furthermore, improper agricultural practices, such as over-irrigation and excessive use of fertilizers, can trigger soil degradation and diminish its water retention capabilities, culminating in heightened runoff and soil erosion. These shifts in LULC present noteworthy challenges to the sustainability and productivity of irrigated lands, emphasizing the imperative need for adept agricultural management and water resource planning to mitigate their adverse ramifications (Lal et al., 2021).
1.2 Importance of LULC change analysis
The analysis of land use/land cover change constitutes a pivotal field of study that furnishes invaluable insights into the evolving patterns of LULC. It plays a crucial role in informing sustainable land management practices and policies, facilitating natural resource management, and supporting effective land use planning. Through the scrutiny of LULC change, decision-makers can glean enhanced understanding of the ramifications of land use change, identify the catalysts propelling change, and devise strategies for sustainable land utilization that harmonize economic advancement with environmental safeguarding (Seyam et al., 2023; Bandyopadhyay et al., 2017). The importance of LULC change analysis is underscored by several key reasons: Firstly, it aids in comprehending the factors driving change, such as urbanization, mining, agricultural expansion, and natural disasters, thus informing the formulation of effective policies and interventions. Secondly, it enables the evaluation of the environmental impacts of land use change, encompassing soil degradation, loss of biodiversity, and water quality, thereby guiding informed land management practices. Thirdly, it contributes to prospective land use planning by delineating areas suitable for conservation, urbanization, or agricultural expansion, thereby ensuring sustainable land use practices. Fourthly, it bolsters natural resource management, including forestry, water management, and agriculture, by guiding interventions that enhance sustainable practices. Furthermore, it facilitates land use planning through zoning regulations and land use plans that advocate for sustainable land use and the protection of natural resources. Lastly, it furnishes baseline data for monitoring changes in land use and land cover over time, thereby aiding in long-term decision-making and policy development.
1.3 Role of remote sensing in LULC change study
Remote sensing and geospatial technology constitute a diverse array of tools providing extensive data on the Earth’s surface, facilitating detailed analyses and change detection through various satellite and aircraft sensors. This technology offers valuable capabilities for understanding and efficiently managing Earth’s natural resources. Notably, remote sensing has evolved into a sophisticated technology for detecting LULC changes and for enhancing environmental and natural resource management (Halder et al., 2023). Geospatial technology delivers high-resolution satellite imagery that aids in mapping LULC features of an area, identifying alterations in LULC patterns, and monitoring the environmental impact of human activities (Chang et al., 2018). Remote sensing plays a pivotal role in the examination of LULC change by facilitating data acquisition, monitoring, mapping, temporal analysis, ensuring accuracy and consistency, and enabling integration with geospatial analysis. Geospatial techniques equip researchers with comprehensive and reliable information regarding LULC changes (Kumar et al., 2013; Wang et al., 2020; Girma et al., 2022). The land use variations predicted showing main alterations can support to land use experts, and management policymakers in endorsing sustainable development and mitigating harmful effects. So, discovering and calculating the LULC variations have become an significant consideration in a diversity of fields adding, modeling villager and city strategies (Parsa and Salehi, 2016), classifying biodiversity hotspot landscapes (Yirsaw et al., 2017) for proceeding conservation hard work, investigation changing aspects of desertification, etc. This study mainly focused on the detail assessment of land use land cover changes and also helps in forecast the data from the year 2031 and 2041. The result of the study shows that, there was increasing in the barren land. This study helps to implement the suitable land management practices and also suggested the sustainable use and conservation of agricultural resources in the area. The novelty of this research lies in its comprehensive modeling of land-use and land-cover (LULC) changes in the Mashi Dam command area from 1988 to 2018, with projections extending to 2040. Utilizing a combination of satellite imagery from Landsat 5, LISS-3, and Sentinel 2A MSI, the study rigorously validates the 2018 land cover map against ground-truth data. It identifies critical trends, such as a 4.75% decline in cropland and significant growth in built-up areas and barren land. These insights emphasize the urgent need for effective land management strategies to combat further agricultural land conversion and promote sustainable resource utilization. The prediction of 2031 and 2041 LULC maps is prepared for future LULC changes in the area, it can a very novel results of study area helpful to planning of LULC in the area. This study also supportive for scientists, policymakers, and land administrators which can gain valuable insights into the dynamics and effects of land transformations, thereby supporting informed decision-making for sustainable land management, environmental conservation, and socio-economic development.
The main objectives of this study are as follows:
i. To analyze the spatio-temporal land use/land cover patterns from 1988 to 2018.
ii. To forecast land use/land cover for 2031 and 2041 using the Land Change Modeler (LCM) in IDRISI TerrSet.
2 Materials and methods
2.1 Study region
The command area (CMD) of the Mashi Dam is situated between latitudes 26°17′ N and 26°41′ N and longitudes 75°65′ E and 75°76′ E, within the Peeplu Tehsil of Tonk District, Rajasthan, (India) (Figure 1). The area is fed by three tributaries: the Bandi, Mashi, and Sohadara rivers, all of which ultimately flow into the Banas River Basin. The topography of the study area, which encompasses Peeplu Tehsil, features a peneplain landscape with ground elevations ranging from 260 to 418 m above mean sea level. Isolated hillocks and continuous chains of hills can be found in the southeast near Sohela. The highest elevation in the region is 418 m at Chironj, while the lowest point, at 260 m, is located near the banks of the Banas River. The left bank of the Mashi River exhibits an undulating topography. The Mashi River is classified as a fifth-order stream, whereas the Sohadara River is a fourth-order stream within the Banas River Basin. Soil in this region is primarily yellowish-brown with a sandy loam texture. It is generally well-drained and calcareous, composed of fine loamy soil that characterizes the sloping plains.
FIGURE 1

Study area and Sentinel-2A MSI image (FCC) acquired on May, 2018.
The annual rainfall in Peeplu Tehsil averages 500.6 mm, which serves as the primary source for groundwater recharge. The climate in this region is classified as tropical dry, with mean maximum temperatures reaching 44.8°C in June and minimum temperatures dropping to 2.9°C in January. During the warmer months, the minimum relative humidity is recorded at 45% in April and 32% in May. In the Peeplu Tehsil, an area of 17,640.29 ha is irrigated through groundwater resources, including wells and tube wells, in addition to 3,440.37 ha irrigated by canals and tanks. The geological structure of the study area consists of several geological units, including alluvium, schist, migmatite, and gneiss. The topsoil is primarily composed of alluvial soil and river sand, with depths ranging from 3.0 to 8.0 m, making it suitable for agricultural activities.
2.2 Materials
The data acquisition and methodology for the LULC change study encompass several key steps, including the acquisition and pre-processing of satellite imagery, the classification of imagery into distinct LULC categories, the evaluation of classification accuracy and change matrix, and the application of change detection analysis over time to identify shifts in LULC. Additionally, the study includes the projection of LULC for future time points (2031 and 2041) utilizing the LCM model within the IDRISI software. This chapter specifically focuses on data acquisition for four different time periods: 1988, 1998, 2008, and 2018. Figure 2 illustrates the framework detailing the steps for data acquisition and subsequent procedures employed for the detection of LULC change and prediction modeling.
FIGURE 2
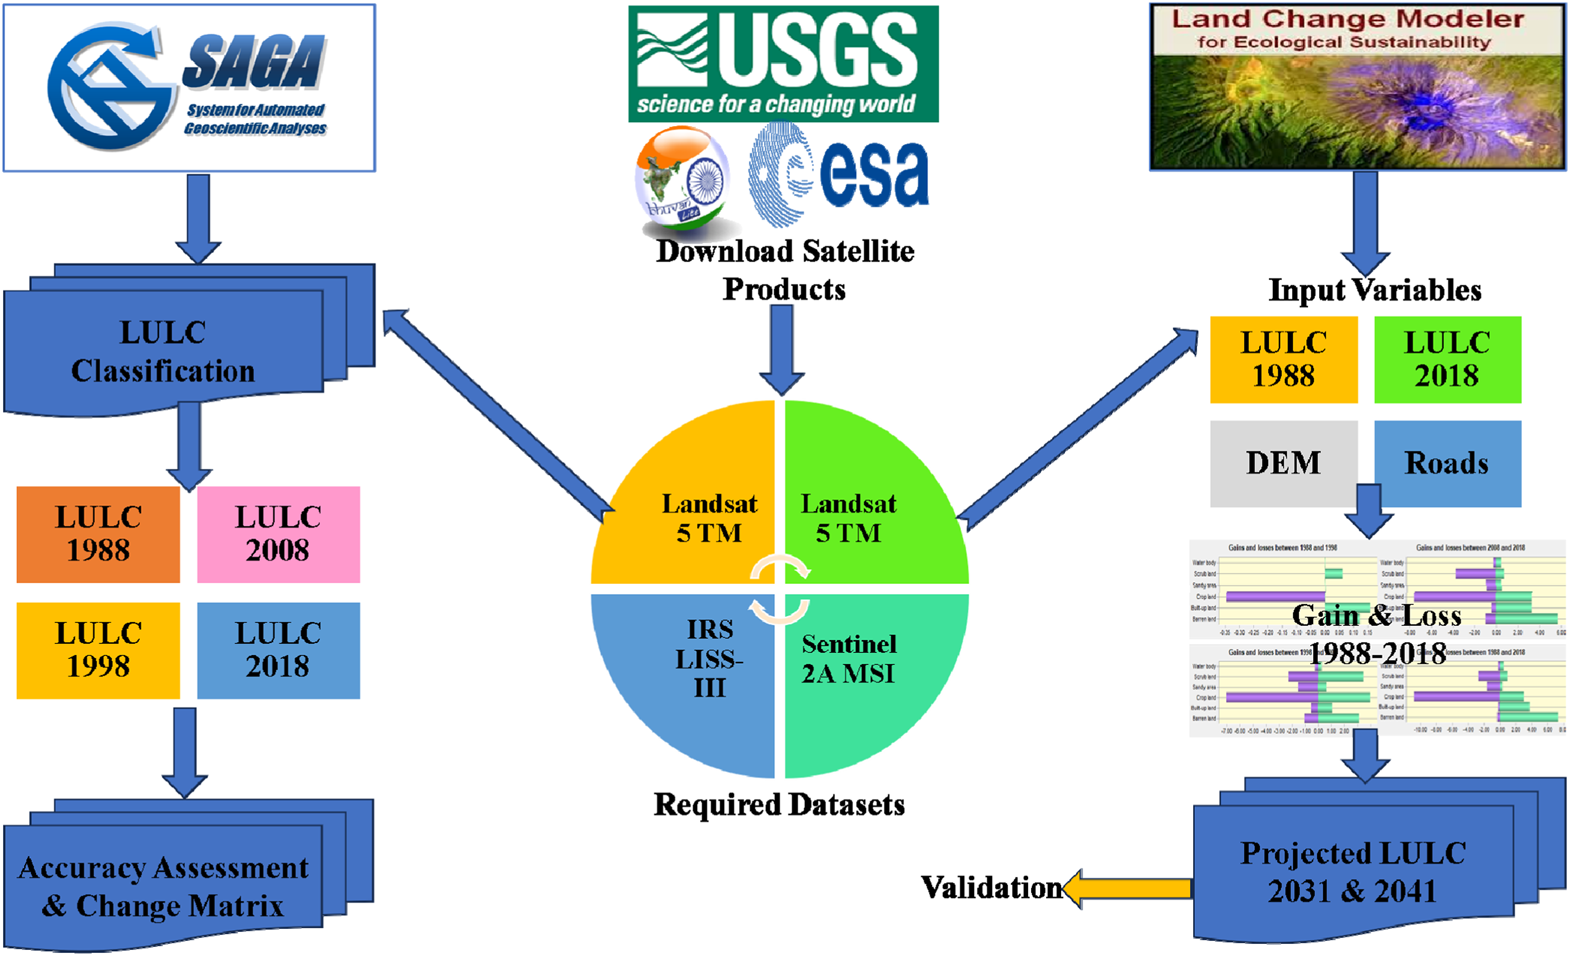
Methodology framework for LULC change detection and prediction modelling.
2.3 Data acquisition
The initial step entails the acquisition of satellite imagery corresponding to the various time periods under analysis. The selection of satellite data hinged on the desired spatial resolution, spectral bands, and other requisites specific to the study. Landsat satellites are frequently employed in land use/land cover change studies due to their extensive track record of furnishing high-quality imagery characterized by consistent spatial and spectral properties. Data collection for the 1988 and 1998 time periods involved the utilization of Landsat 5 satellites, whereas for 2008 and 2018, the acquisition of data relied on IRS LISS-III and Sentinel 2A MSI data products. A comprehensive understanding of the datasets and spectral characteristics used in the study is presented in detail in Supplementary Tables S1–S4, as well as in Supplementary Figures S1A–S1D, further elaborated upon by (Saipova et al., 2022).
3 Methodology
3.1 Image pre-processing
Prior to the commencement of image processing, corrections were applied to rectify the geometric and radiometric characteristics of the Sentinel 2A MSI data utilizing the SNAP tool (Sen2cor processor). However, such corrections were deemed unnecessary for the Landsat and LISS 3 data. Furthermore, cloud masking and image masking procedures were implemented to ensure the cloud-free nature of the study area, particularly for the precise classification of LULC (Matinfar et al., 2007).
The selection of the study years 1988, 1998, 2008, and 2018 was primarily based on field observations and feedback from respondents at the command area, which indicated that significant cropland degradation, particularly owing to soil salinity and overuse of groundwater, became apparent starting in 1988. To analyse this degradation over time, a 10-year interval was chosen for the datasets (1988, 1998, 2008, and 2018) to examine the changes in cropland condition at regular intervals, reflecting the gradual nature of such environmental changes.
3.2 Image classification
LULC classification involves the process of categorizing the land surface into distinct classes based on its physical and biological attributes. This task typically utilizes remote sensing data, such as satellite imagery, which can capture the spectral, spatial, and temporal characteristics of the land surface. The classification process encompasses assigning each pixel or object in the image to a specific land cover class, including categories such as cropland, salt-affected land, scrub land, water bodies, sandy areas, and built-up land. The selection of classes in the classification is determined by the study’s objectives and the available classification scheme, which is detailed in Supplementary Table S5, providing a comprehensive overview of its general description.
Image classification was conducted using an object-based classification method within the SAGA GIS software. The object-based classification method is preferred for its ability to incorporate spatial context and relationships among pixels, leading to more accurate and meaningful classifications. This approach effectively captures complex land-use patterns, particularly in heterogeneous landscapes, which enhances the differentiation of land cover types compared to pixel-based methods.
In this approach, the images were segmented into distinct objects based on their spectral and spatial properties (Halder et al., 2023). Subsequently, the objects were categorized into various LULC classes based on their spectral signature and other attributes using a rule-based classification method. The classification rules were defined based on the spectral and spatial characteristics of each LULC class. The resultant classified maps underwent visual inspection and validation utilizing ground truth data (from field surveys, Google Earth) and other supplementary information (Worldview 2 Image). Furthermore, the overall accuracy and kappa coefficient of the classified maps were computed to evaluate the accuracy of the classification (Stuckenberg et al., 2013).
3.3 Accuracy assessment and change matrix
The accuracy assessment is a critical process that enables the evaluation of how well the classified image aligns with the actual ground truth. Given that land use maps generated through image classification may contain errors, it is essential to conduct an accuracy assessment to gain confidence in the reliability of the results and facilitate the detection of temporal changes. In this study, the accuracy assessment involved comparing the classified maps with ground truth data collected from field surveys utilizing GPS for the years 1988, 1998, 2008, and 2018, in conjunction with information derived from Google Earth, field observations, and Worldview 2 imagery. The error/confusion matrix, a widely used and effective method for assessing the accuracy of classified images, provided information on overall accuracy, user accuracy, producer accuracy, and kappa statistics. The formulas for calculating these metrics are presented in Supplementary Table S6 and are employed to quantify and evaluate the accuracy of the classified image derived from remotely sensed imagery. Of particular note, the kappa coefficient is utilized to determine the level of agreement, as recommended by (Leta et al., 2021), where a kappa coefficient below 0.4 indicates poor agreement, a value between 0.4 and 0.8 represents moderate agreement, and a value above 0.8 signifies strong agreement.
3.4 LULC change statistics
The cartographic maps and statistical graphs for the LULC change study were generated using a combination of software, including SAGA GIS, IDRISI TerrSet, ArcGIS, and Microsoft Excel. These software packages provide a wide array of tools and functionalities for data analysis, visualization, and mapping. IDRISI and ArcGIS are frequently utilized for LULC prediction modeling and the formulation of LULC change matrices using intersect tools, while Excel is commonly employed for data processing and analysis. The utilization of multiple software tools ensures comprehensive and accurate data analysis and presentation, facilitating the integration of diverse data types to support the study’s objectives.
3.5 LULC change modelling and projected scenarios
The LCM, a component of IDRISI software, is designed for the analysis and prediction of land cover change, in addition to the assessment of habitat and biodiversity impacts. It encompasses a suite of automated tools that streamline the processes of change analysis, resource management, and habitat assessment. This model leverages artificial neural network (ANN), Markov Chain matrices, and transition suitability maps to forecast land use and land cover changes. Thematic raster images with the same number of classes and sequential order are employed to generate these predictions. In the context of this study, the LCM was used to forecast forthcoming land use and land cover changes in the Mashi command area for the years 2031 and 2041. This model executes a sequence of procedural steps to accomplish its objectives (Lemenkova, 2020).
3.5.1 Change analysis
The change analysis panel computes differences between two distinct time periods, denoted as time 1 and time 2, using the LULC maps. This analysis enables the swift evaluation of quantitative changes by visualizing gains and losses across various land cover types. Furthermore, it furnishes data on net change, persistence, and specific transitions in both map and geographical formats.
3.5.2 Spatial model variables and transition potential modeling
In order to project the LULC for the years 2031 and 2041, several spatial model variables were selected based on review of previous research literature. These variables include DEM, Slope, Distance from canals, Distance from river, Distance from roads, and Distance from built-up areas. Following the identification of these pertinent spatial variables, factor maps were generated. A critical step in this process involved performing geometry matching to ensure compatibility and consistency among the spatial data. This entailed ensuring that the raster data maintained consistent cell sizes, No-Data values, data extents, dimensions, and coordinate reference systems. In this study, the cell size for all spatial variables was set to 30 m, with a designated No-Data value of 0, indicating the absence of data, and utilizing the coordinate reference system WGS-84 UTM-Zone 43N. These measures were instrumental in ensuring proper alignment of the spatial variables, thereby facilitating effective analysis and integration within the study. Through the maintenance of consistent parameters across the spatial variables, the study is able to accurately assess and analyze the relationships and patterns among these variables (Mishra and Rai, 2016).
The LCM modeler comprises two sub-models: the Transition Potential sub-model and the Change sub-model. The Transition Potential sub-model predicts the likelihood of each pixel in the study area to transition from one land cover class to another based on the spatial and contextual relationships between neighboring pixels, utilizing the land cover map for the initial time period as input. On the other hand, the Change sub-model utilizes the output of the Transition Potential sub-model to simulate future land cover changes likely to occur over time, utilizing the initial land cover map and additional information such as the rate of change and the predicted time period. These two sub-models work conjointly to provide a thorough analysis of LULC change over time, taking into account historical patterns of change and potential future scenarios (Gadhave et al., 2022).
3.5.3 Multilayer perceptron (MLP) network
The multilayer perceptron (MLP) neural network plays a crucial role in the land change modeler. Comprising input, hidden, and output layers, the MLP utilizes feed-forward algorithms to compute weights for various nodes within the network. These weights propagate through the hidden layer, enabling the modeling of non-linear relationships and multiple transitions simultaneously. Data flows unidirectionally within the MLP, moving from the input layer to the output layer, with nodes receiving input signals and generating transformed signals for other nodes. Each node is assigned a weight inclusive of a threshold and undergoes a linear or non-linear stimulation function. Throughout the training phase, the weights are adjusted to minimize the disparity between observed and expected outcomes, ensuring precise forecasting. Once the MLP is trained with the influencing factors for each sub-model, it produces time-specific transition potential maps portraying change potential over time. These maps offer valuable insights into the specific changes anticipated within the modeled system (Kafy et al., 2020).
This study harnessed the Markov Chain analysis and Cellular Automata (CA) techniques available in IDRISI to model and predict future LULC changes. The methodology entailed utilizing land cover maps from 1988 to 2018 as inputs to forecast the land cover map for the years 2031 and 2041. To validate the accuracy of the projections, the resultant land cover map for 2018 was compared against the actual land use/cover map for 2018, generated using SAGA GIS. Following successful validation, the land cover maps from 1988 to 2018 were once more employed to predict the LULC map for the years 2031 and 2041.
The selection of the first prediction interval (14 years), this was done to create a longer-term forecast that extends beyond the 10-year intervals in the dataset, capturing a more extended horizon for policy and management planning. However, the years 2031 and 2041 were included in the prediction because they align with the planning horizons typically used in natural resource management and policy development. These years are intended to project future land degradation trends based on current observations, which is why they were selected despite the primary data being focused on the 10-year intervals.
4 Results
The LULC of the Mashi command area was mapped over a 30-year period, spanning from 1988 to 1998 and 2008 to 2018. Below, a comprehensive description of the distribution and detection of changes is provided, furnishing detailed information about the study area. LULC changes around the Mashi Dam are influenced by key spatial model variables shaping land development, water management, and ecosystem dynamics. DEM and Slope determine land use feasibility, with lower elevations supporting agriculture and settlements, while steeper slopes restrict construction. Around Mashi Dam, gentle slopes facilitate farming and urban expansion, while higher elevations remain under natural vegetation. Rivers and Canals play a crucial role in agricultural expansion and water distribution. The Mashi River and associated canals enhance irrigation, leading to cropland intensification, but also contribute to encroachment and soil degradation near water bodies. Built-up Areas near the dam have expanded due to water availability, infrastructure projects, and tourism, resulting in urban sprawl and deforestation. Increased settlements raise concerns about water resource depletion and environmental stress. Road Networks enhance accessibility, accelerating land conversion from natural landscapes to urban and agricultural uses. Roads near the dam influence commercial growth and settlement expansion, often at the cost of green cover. These factors collectively drive LULC changes in the Mashi Dam region, necessitating balanced planning to ensure sustainable development, water conservation, and ecosystem protection.
4.1 LULC change dynamics (1988, 1998, 2008 and 2018)
Figures 3A,B depicts the LULC maps of the Mashi command area for the years 1988 and 1998, while Table 1 presents a detailed breakdown of the area covered under each category during the period from 1988 to 1998. In 1988-1998, cropland, barren land, and scrub land were the predominant land cover types, respectively. The LULC map for 1988 indicates that approximately 80.12 km2 of the Mashi command area was classified as cropland, representing 88.95% of the total area. Furthermore, there were 1.24 km2 designated as built-up land, 1.35 km2 as barren land, 3.08 km2 as sandy area, 3.94 km2 as scrub land, and 0.34 km2 as water bodies. Notably, the proportions of each LULC class in the command area during the 1998 period reveal cropland as the dominant LULC, covering 88.53% of the study area, followed by barren land (1.64%), sandy area (3.42%), scrub land (4.46%), water bodies (0.38%), and built-up areas (1.57%) (refer to Table 1). Throughout the study period from 1988 to 1998, there was a significant expansion in barren land, scrub land, and built-up areas, with growth rates of 1.64%, 1.57%, and 4.46%, respectively. Additionally, barren land experienced a slight increase from 1.50% to 1.64%. Among the different land cover types, cropland incurred the highest net loss, followed by barren land, built-up areas, and scrub land, as outlined in Table 2. The trend observed from 1998 to 2008 aligns with the findings. Figure 4A presents comprehensive statistics of LULC change from 1988 to 2018 (Mirhosseini et al., 2016).
FIGURE 3
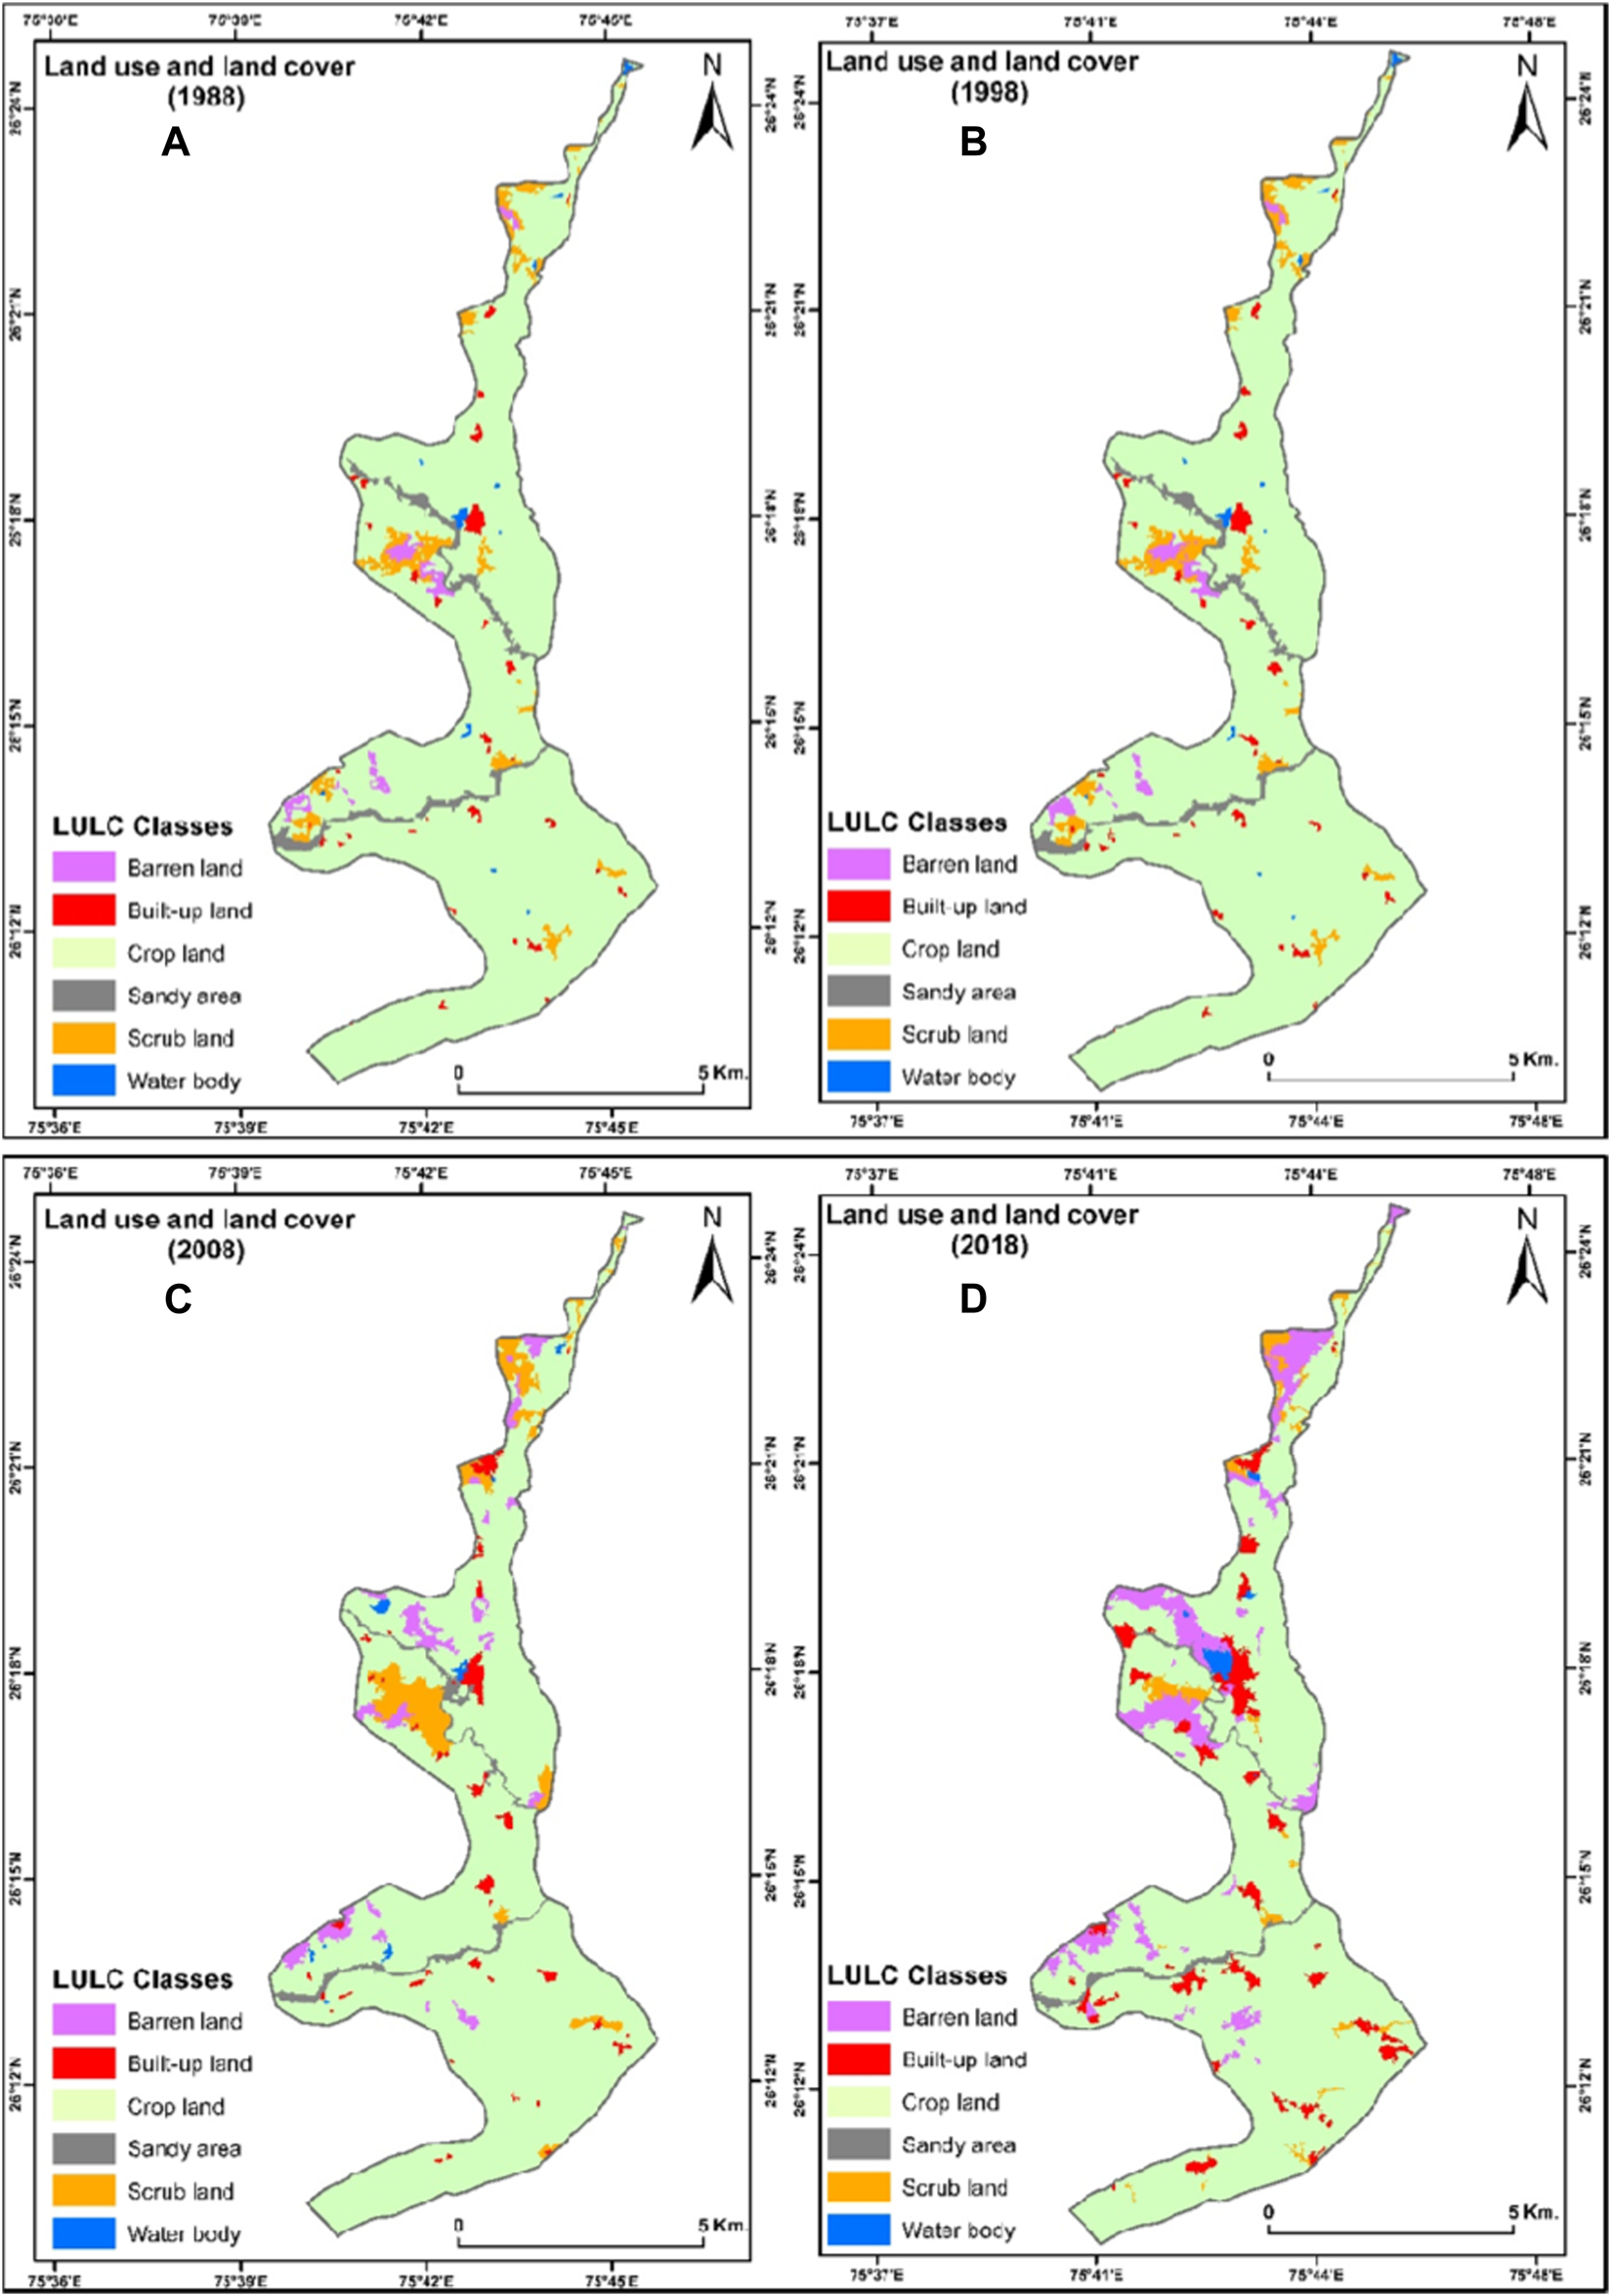
LULC maps of the study area (A) 1988, (B) 1998, (C) 2008, (D) 2018.
TABLE 1
| LULC class | 1988 | 1998 | Area of change (1988–1998) | ||
|---|---|---|---|---|---|
| Area in km2 | Area in % | Area in km2 | Area in % | % | |
| Barren land | 1.35 | 1.50 | 1.48 | 1.64 | +0.14 |
| Built-up land | 1.24 | 1.38 | 1.41 | 1.57 | +0.19 |
| Crop land | 80.12 | 88.95 | 79.74 | 88.53 | −0.42 |
| Sandy area | 3.08 | 3.42 | 3.08 | 3.42 | +0.00 |
| Scrub land | 3.94 | 4.37 | 4.02 | 4.46 | +0.09 |
| Water body | 0.34 | 0.38 | 0.34 | 0.38 | +0.00 |
| Total | 90.07 | 100 | 90.07 | 100 | |
Land Use and Land Cover change from 1988 to 1998.
TABLE 2
| LULC class | 1998 | 2008 | Area of change (1998–2008) | ||
|---|---|---|---|---|---|
| Area in km2 | Area in % | Area in km2 | Area in % | % | |
| Barren land | 1.48 | 1.64 | 3.58 | 3.97 | +2.33 |
| Built-up land | 1.41 | 1.57 | 2.03 | 2.25 | +0.69 |
| Crop land | 79.74 | 88.53 | 76.57 | 85.01 | −3.52 |
| Sandy area | 3.08 | 3.42 | 2.25 | 2.50 | −0.92 |
| Scrub land | 4.02 | 4.46 | 5.24 | 5.82 | +1.35 |
| Water body | 0.34 | 0.38 | 0.4 | 0.44 | +0.07 |
| Total | 90.07 | 100.00 | 90.07 | 100.00 | |
Land Use and Land Cover change from 1998 to 2008.
FIGURE 4
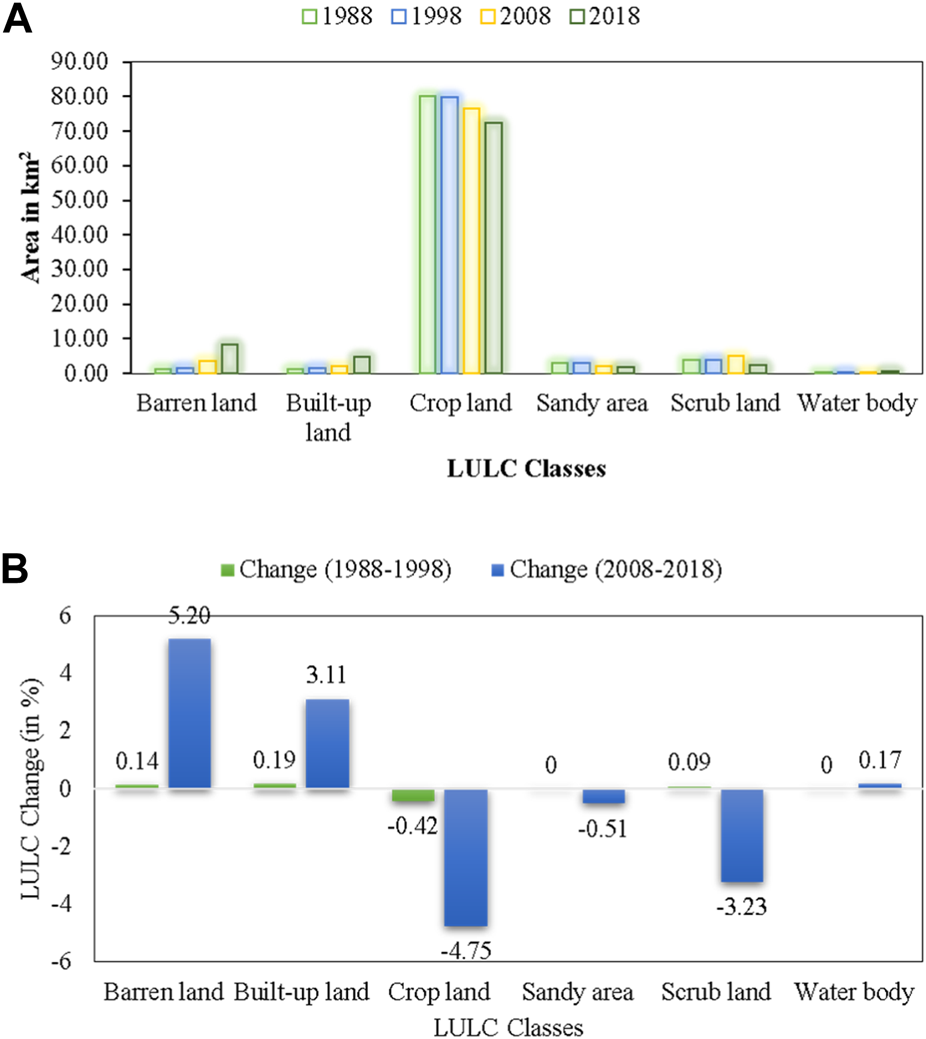
Changes in LULC areas (A) LULC change areas (in km2) for the period 1988–2018, (B) LULC change areas in percent from 1988 to 1998 and 2008 to 2018.
Moreover, Figures 3C,D delineates the types of LULC classes in the Mashi command area for the years 2008 and 2018, while Table 3 offers a detailed breakdown of the different land cover categories during that period. Between 2008 and 2018, the main types of land cover were cropland, barren land, and scrub land, with cropland covering the majority of the area in both 2008 and 2018. Notably, there was a clear increase in the extent of barren land, built-up areas, and water bodies during this period. Conversely, there was a decrease in the area of cropland, sandy areas, and scrub land, indicated in Figure 4B. The changes in different land cover types occurred at varying rates, with cropland experiencing the largest net loss, followed by barren land, built-up areas, and water bodies. The findings revealed a decrease of −0.51% in sandy areas and a −3.23% decline in scrub land between 2008 and 2018, while barren land, built-up areas, and water bodies experienced an increasing trend with growth rates of +5.2%, +3.11%, and +0.17%, respectively, as indicated in Figure 4B. This pattern aligns with the observations from 1988 to 1998, except for scrub land, sandy areas, and water bodies (Parsamehr et al., 2020).
TABLE 3
| LULC class | 2008 | 2018 | Area of change (2008–2018) | ||
|---|---|---|---|---|---|
| Area in km2 | Area in % | Area in km2 | Area in % | % | |
| Barren land | 3.58 | 3.97 | 8.26 | 9.17 | +5.20 |
| Built-up land | 2.03 | 2.25 | 4.83 | 5.37 | +3.11 |
| Crop land | 76.57 | 85.01 | 72.29 | 80.26 | −4.75 |
| Sandy area | 2.25 | 2.50 | 1.79 | 1.99 | −0.51 |
| Scrub land | 5.24 | 5.82 | 2.33 | 2.58 | −3.23 |
| Water body | 0.4 | 0.44 | 0.56 | 0.62 | +0.17 |
| Total | 90.07 | 100 | 90.07 | 100 | |
Land use and land cover change from 2008 to 2018.
The notable proportion of barren land observed between 1988 and 2018 can be attributed to factors such as salinity, waterlogging, and human activities, including over-irrigation, that occurred during that period. These factors likely contributed to the increased extent of unproductive and uncultivable land.
4.2 Accuracy assessment of the classified images
In this study, 50 points were randomly selected to assess classification accuracy. An accuracy assessment was conducted to analyze the changes in LULC by creating confusion/error matrices for the classified maps of 1988, 1998, 2008, and 2018. Various measures including user’s accuracy, producer’s accuracy, kappa statistics, and overall accuracy were utilized for the assessment. The kappa statistics and overall accuracy values for the classified images were as follows: 87.76% and 90% for 1988, 68.38% and 94% for 1998, 91.70% and 94% for 2008, and 86.36% and 90% for 2018 (as depicted in Supplementary Tables S7–S10). The more recent LULC maps exhibited higher accuracy, possibly attributable to the utilization of satellite images with higher spatial resolution. It is crucial to conduct accuracy assessment when employing remote sensing Landsat data for historical LULC studies. The achieved accuracy in this study falls within the acceptable range, signifying the reliability of the results (Alqadhi et al., 2021).
4.3 LULC change matrix
The LULC change matrices for the periods 1988-1998, 1998-2008, 2008-2018, and 1988-2018 are detailed in Tables 4–7, respectively. Bold values in the tables signify no change in the corresponding LULC categories during the specified time periods. The analysis of the LULC change matrix unveils substantial land cover transformations in the Mashi command area over the study period. Notably, during the 1988-1998 period, significant changes in LULC were observed. A considerable conversion of agricultural land to barren land occurred, with approximately 0.13 km2 transitioning to this land cover category. Conversely, 0.17 km2 of crop land areas converted to built-up land, primarily due to urban expansion. Additionally, the area under crop land decreased by approximately 0.08 km2, attributed to land degradation activities. These changes highlight the dynamic nature of land use in the study area during the specified period. The 1988-1998 LULC change matrix is presented in Table 4 (Murayama and Thapa, 2011).
TABLE 4
| LULC 1998 | ||||||||
|---|---|---|---|---|---|---|---|---|
| LULC classes | Barren land | Built-up land | Crop land | Sandy area | Scrub land | Water body | Total | |
| LULC 1988 | Barren land | 1.35 | 1.35 | |||||
| Built-up land | 1.24 | 1.24 | ||||||
| Crop land | 0.13 | 0.17 | 79.74 | 0.08 | 80.12 | |||
| Sandy area | 3.08 | 3.08 | ||||||
| Scrub land | 3.94 | 3.94 | ||||||
| Water body | 0.34 | 0.34 | ||||||
| Total | 1.48 | 1.41 | 79.74 | 3.08 | 4.02 | 0.34 | 90.07 | |
LULC change matrix from 1988 to 1998.
TABLE 5
| LULC 2008 | ||||||||
|---|---|---|---|---|---|---|---|---|
| LULCClasses | Barren land | Built-up land | Crop land | Sandy area | Scrub land | Water body | Total | |
| LULC 1998 | Barren land | 0.40 | 0.29 | 0.76 | 0.03 | 1.48 | ||
| Built-up land | 0.85 | 0.50 | 0.02 | 0.04 | 1.41 | |||
| Crop land | 2.53 | 1.11 | 72.61 | 0.62 | 2.61 | 0.26 | 79.74 | |
| Sandy area | 0.01 | 1.44 | 1.56 | 0.07 | 3.08 | |||
| Scrub land | 0.64 | 0.06 | 1.50 | 0.05 | 1.77 | 4.02 | ||
| Water body | 0.01 | 0.23 | 0.11 | 0.35 | ||||
| Total | 3.58 | 2.03 | 76.57 | 2.25 | 5.24 | 0.40 | 90.07 | |
LULC change matrix from 1998 to 2008.
From 1998 to 2008, there was an observable increase in the areas of barren land, built-up land, scrub, and water bodies within the study area. In contrast, other land use classes, such as crop land and sandy land, showed a decreasing trend. Notably, an increasing trend was observed in the areas of barren land, built-up land, and water bodies, while other land use classes, such as crop land, sandy land, and scrub land, exhibited decreases in their change rates.
Similar trends were observed from 2008 to 2018, with approximately 3.54 km2 of crop land converting to barren land due to issues such as waterlogging, salinity, and over-irrigation. Additionally, the conversion of 2.60 km2 of crop land to built-up areas was observed, driven by population growth in the villages within the command area. Around 0.67 km2 of crop land transitioned into scrub land, attributed to land degradation. The LULC matrix in Table 6 indicates approximately 1.89 km2 of scrub land converted to barren land, influenced partially by anthropogenic activities and land degradation. Furthermore, there was a conversion of 0.21 km2 of water bodies to barren land and 0.40 km2 of scrub land to built-up land.
TABLE 6
| LULC 2018 | ||||||||
|---|---|---|---|---|---|---|---|---|
| LULC classes | Barren land | Built-up land | Crop land | Sandy area | Scrub land | Water body | Total | |
| LULC 2008 | Barren land | 2.53 | 0.06 | 0.89 | 0.06 | 0.04 | 3.58 | |
| Built-up land | 0.01 | 1.57 | 0.42 | 0.03 | 2.03 | |||
| Crop land | 3.54 | 2.60 | 68.97 | 0.44 | 0.67 | 0.36 | 76.57 | |
| Sandy area | 0.09 | 0.19 | 0.64 | 1.30 | 0.02 | 0.01 | 2.25 | |
| Scrub land | 1.89 | 0.40 | 1.30 | 0.06 | 1.55 | 0.05 | 5.24 | |
| Water body | 0.21 | 0.01 | 0.07 | 0.11 | 0.40 | |||
| Total | 8.26 | 4.83 | 72.29 | 1.79 | 2.33 | 0.56 | 90.07 | |
LULC change matrix from 2008 to 2018.
Over the specified time period, there was an upward trend observed in the areas of barren land, built-up land, and water bodies, increasing from 1.46 km2 to 8.30 km2, 1.24 km2 to 4.89 km2, and 0.34 km2 to 0.56 km2, respectively. Conversely, other land use classes, such as crop land, sandy land, and scrub land, exhibited decreases in their areas, declining from 80.01 km2 to 72.13 km2, 3.08 km2 to 1.80 km2, and 3.94 km2 to 2.39 km2, respectively. The detailed LULC change matrix is presented in Table 7.
TABLE 7
| LULC 2018 | ||||||||
|---|---|---|---|---|---|---|---|---|
| LULC classes | Barren land | Built-up land | Crop land | Sandy area | Scrub land | Water body | Total | |
| LULC 1988 | Barren land | 1.02 | 0.07 | 0.18 | 0.19 | 1.46 | ||
| Built-up land | 1.04 | 0.2 | 1.24 | |||||
| Crop land | 5.79 | 3.4 | 69.11 | 0.32 | 0.96 | 0.43 | 80.01 | |
| Sandy area | 0.11 | 0.15 | 1.32 | 1.47 | 0.02 | 0.01 | 3.08 | |
| Scrub land | 1.26 | 0.21 | 1.22 | 0.02 | 1.23 | 3.94 | ||
| Water body | 0.12 | 0.01 | 0.09 | 0.13 | 0.34 | |||
| Total | 8.30 | 4.89 | 72.13 | 1.80 | 2.39 | 0.56 | 90.07 | |
LULC change matrix from 1988 to 2018.
4.4 LULC gain and loss analysis using LCM model
The land use categories in the Mashi command area have undergone changes over different time periods: 1988-1998, 1998-2008, 2008-2018, and 1988-2018. Figure 5 presents charts depicting the gains and losses for the six land use categories from 1988 to 1998, 1998-2008, 2008-2018, and 1988 to 2018, while Figure 6 illustrates the spatial gains and losses in crop land and built-up areas. The changes observed between 1988 and 1998 indicate a relatively slower conversion between land use categories compared to the changes between 1998-2008 and 2008-2018. Particularly, during the period from 1988 to 2018, the crop, barren, scrub, and built-up categories exhibit significant changes compared to the other land use categories (Munthali et al., 2019).
FIGURE 5
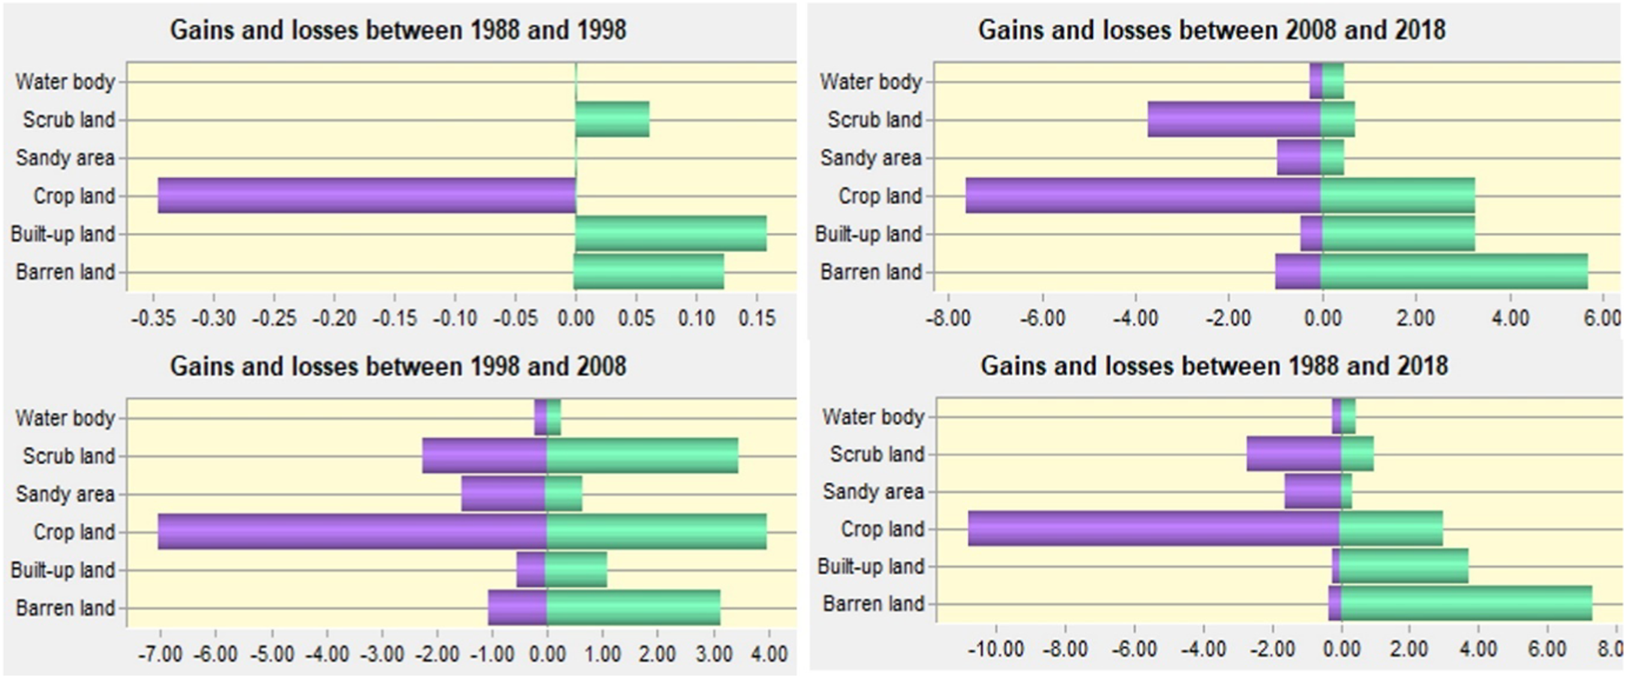
Gains and losses (in km2) each type of land-use in 1988–1998, 1998–2008, 2008–2018, and 1988–2018.
FIGURE 6
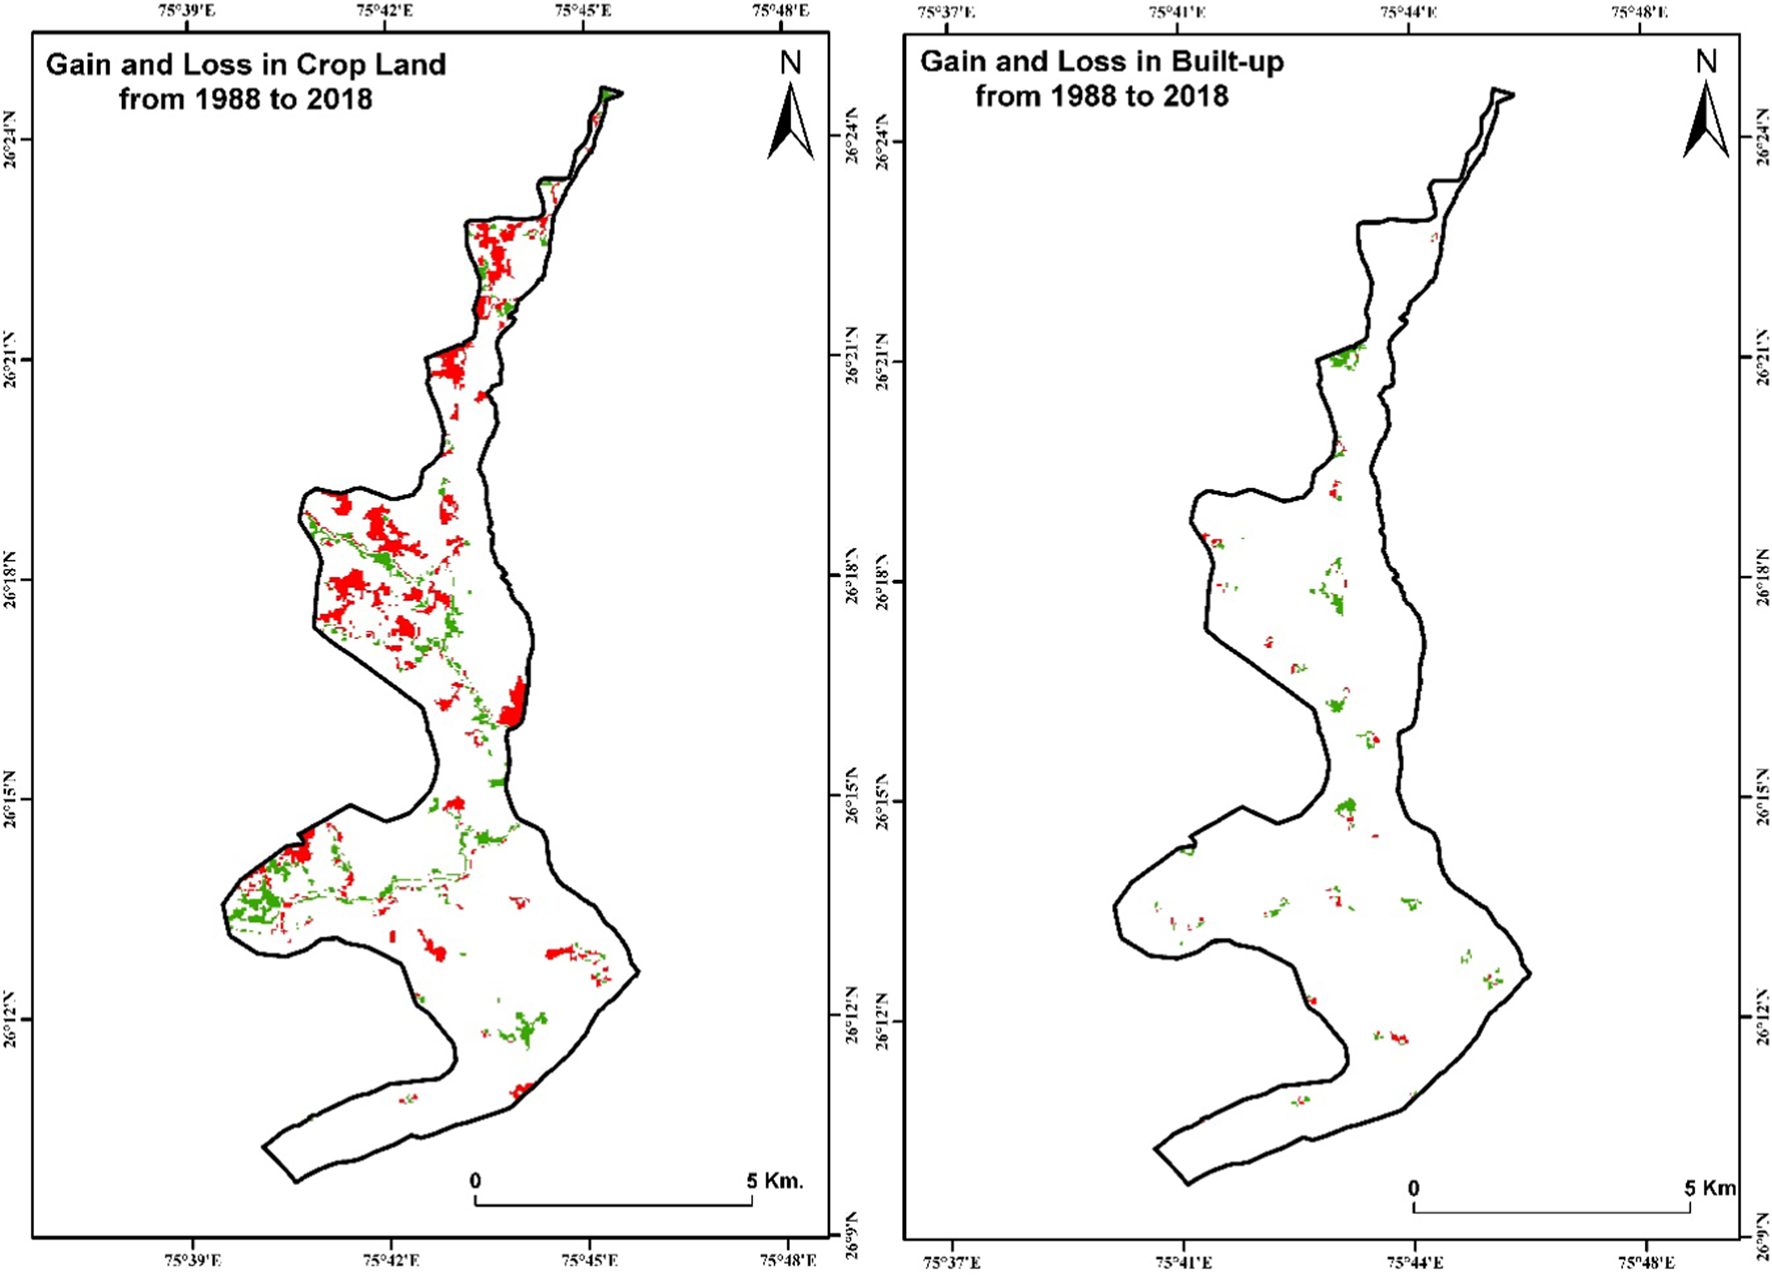
Gain and Loss in Crop land and built-up land from 1988 to 2018.
4.5 Explanatory variables for projected LULC
The selection of explanatory variables or drivers contributing to LULC change was based on factors influencing the suitability of specific activities. Topographic features, encompassing DEM and slope, play a crucial role in shaping land use patterns. Additionally, the proximity to resources such as rivers, canals, built-up areas, and roads also influences land use patterns. In this study, both topographic and proximity factors were considered to assess their impacts on land use/land cover change. The significance of each variable was evaluated using Cramer’s V, a quantitative measure. However, it is important to note that relying solely on Cramer’s V does not fully capture the complexity and scientific intricacies of the relationships. While it aids in determining whether a variable should be included as a driving factor of LULC change, further analysis is imperative to comprehensively understand these relationships. Supplementary Figure S2 comprises all the spatial model variables, with corresponding Cramer’s V values presented in Supplementary Table S11 (Rwanga and Ndambuki, 2017).
4.6 LULC transition from 1988 to 2018
To examine and comprehend the influence of land use/land cover change on the Mashi CMD area (specifically, irrigated-cropland) and the significant role of anthropogenic activities (such as over-irrigation, waterlogging, mining, etc.), Figure 7 illustrates the conversion of cropland into other land use types. The spatial visualization provided by the Land Change Modeler indicates that barren land is projected to be the most impactful LULC class in the next 30 years, potentially exerting negative effects on the croplands. Figure 5 demonstrates the continuous expansion of barren land in the command area from 1988 to 2018 (Haque and Basak, 2017).
FIGURE 7
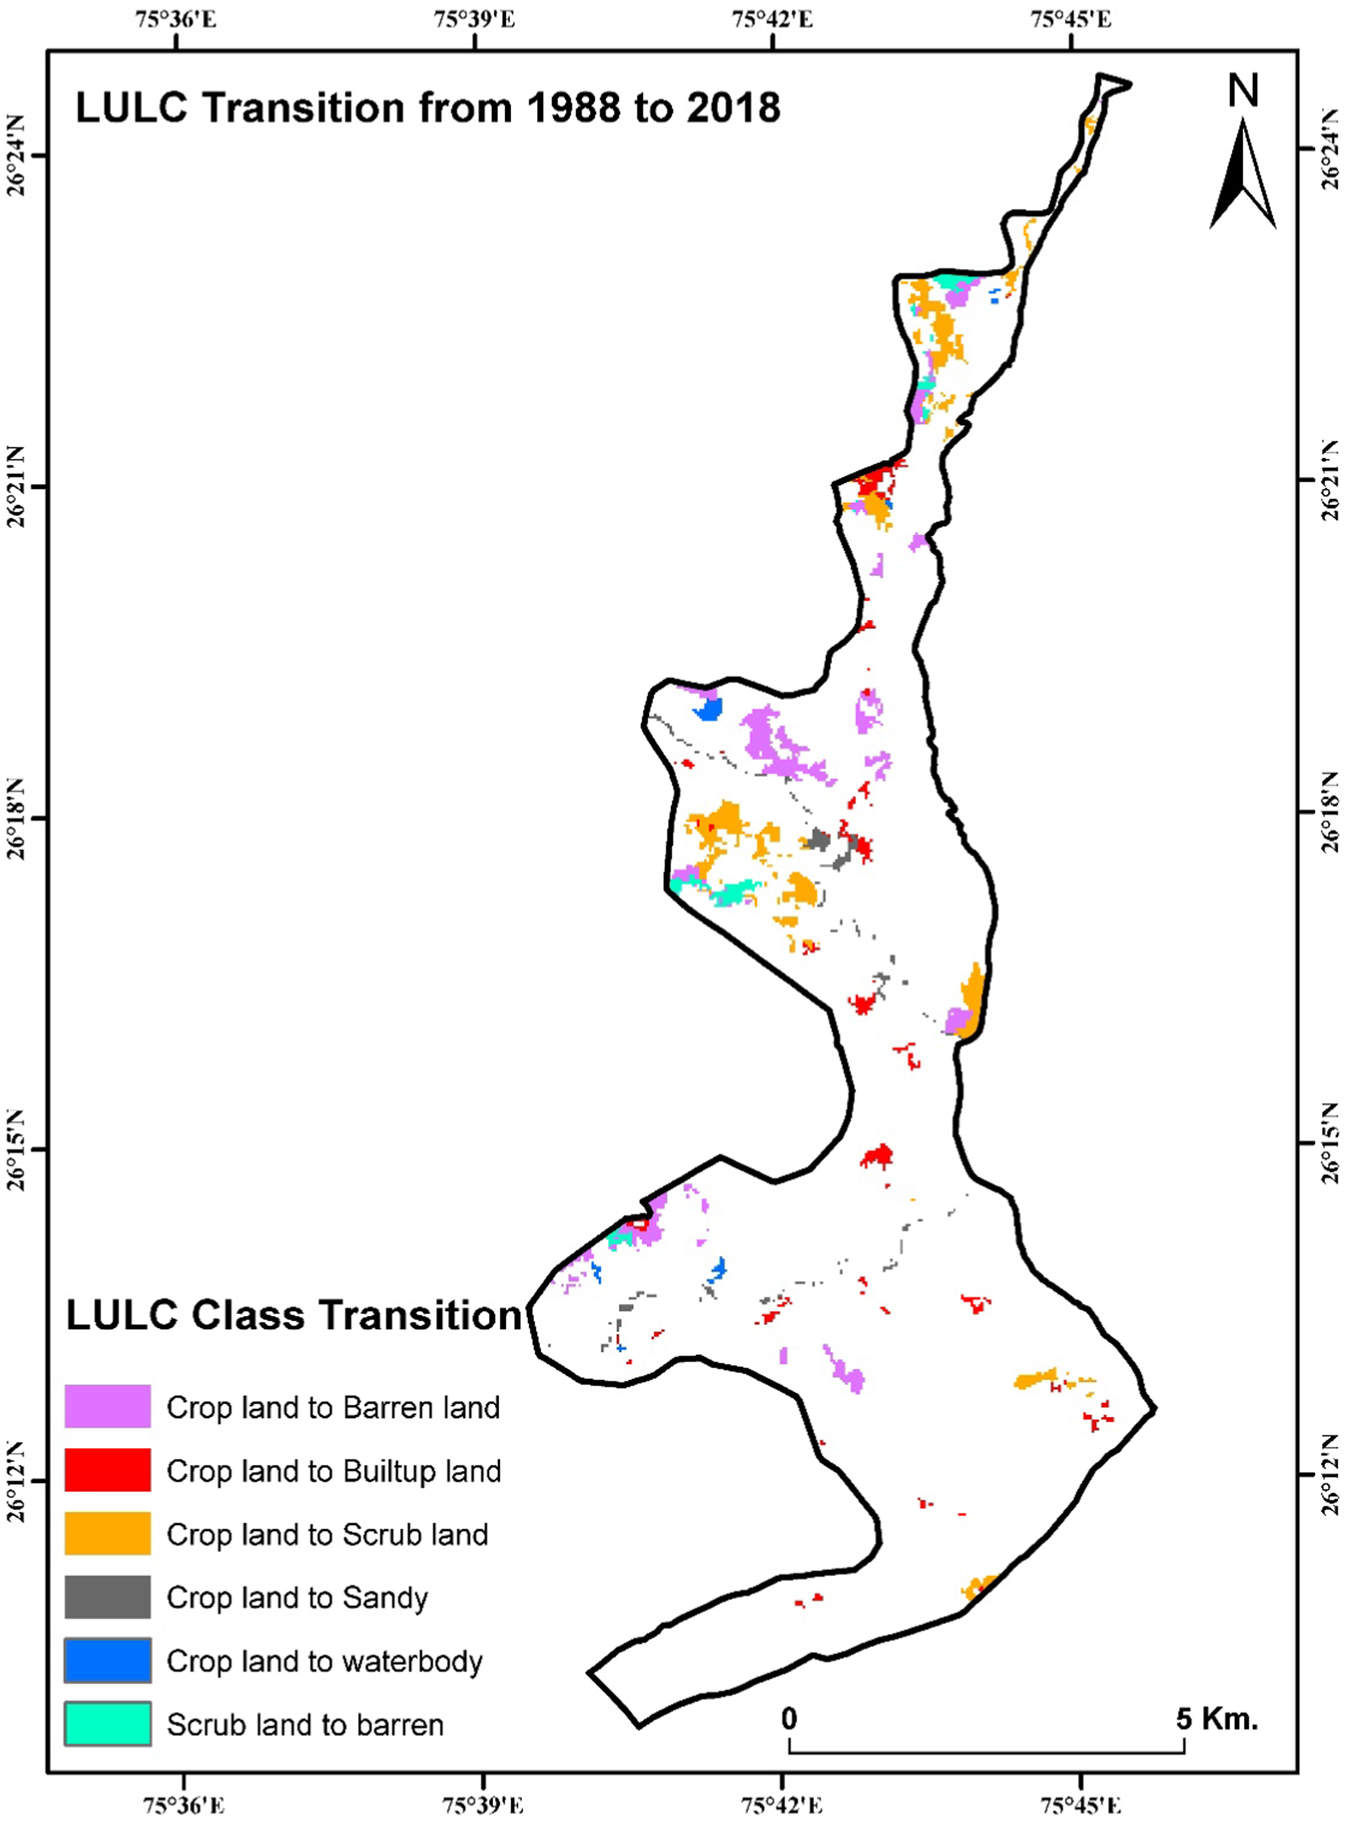
Transition in LULC from 1988 to 2018 using LCM Model.
4.7 Validation of the model
A validation process was executed to assess the accuracy and reliability of the LULC change predictions for the years 2031 and 2041. The validation entailed comparing the actual LULC map for 2018 with the simulated LULC map generated by the model for the same year. The accuracy analysis encompassed the computation of Kappa statistics and overall accuracy measures. The accuracy analysis results revealed a Kappa value of 0.79 and an overall accuracy of 0.83. These values indicate a reasonably good agreement between the simulated and actual LULC maps, suggesting the model’s potential applicability for projecting LULC changes in the Mashi command area for 2031 and 2041. A Kappa coefficient exceeding 0.60 is considered indicative of a reliable model. Table 8 presents the area and change statistics for different land use and land cover classes. According to the table, the simulated map underestimates crop areas and scrub land by 76.93% and 2.44%, respectively, while overestimating barren land, built-up areas, sandy areas, scrub land, and water body areas by 9.69%, 5.66%, 2.05%, and 3.22%, respectively.
TABLE 8
| LULC category | Actual LULC 2018 | Simulated LULC 2018 | ||
|---|---|---|---|---|
| Area in km2 | Area in % | Area in km2 | Area in % | |
| Barren land | 8.26 | 9.17 | 8.73 | 9.69 |
| Built-up land | 4.83 | 5.37 | 5.10 | 5.66 |
| Crop land | 72.29 | 80.26 | 69.29 | 76.93 |
| Sandy area | 1.79 | 1.99 | 1.85 | 2.05 |
| Scrub land | 2.33 | 2.58 | 2.20 | 2.44 |
| Water body | 0.56 | 0.62 | 2.90 | 3.22 |
| Total | 90.07 | 100 | 90.07 | 100 |
Validation of LULC change prediction: actual vs. projected 2018 LULC.
Overall, the validation results suggest that the model performs reasonably well in predicting LULC changes for the Mashi CMD area through the years 2031 and 2041. Nonetheless, it is crucial to consider the specific overestimation and underestimation patterns observed in different land use and land cover classes when interpreting the results (Ansari and Golabi, 2019).
4.8 Projected LULC
Following a successful validation process using the actual LULC map compared to the predicted LULC for the years 2031 and 2041, as depicted in Figure 7, the statistical change analysis of the projected land cover is presented in Supplementary Table S12. According to the model predictions, built-up land is expected to continue increasing significantly, reaching 4.84 km2 (5.33%) in 2031 and 4.93 km2 (5.47%) in 2041, compared to 4.83 km2 in 2018. This growth comes at the expense of a decrease in barren land, crop land, and scrub land. Barren land is projected to increase by 10.94 km2 in 2031 and 12.52 km2 in 2041, compared to the 8.26 km2 observed in 2018. Crop lands will decrease by 69.73 km2 and 68.02 km2 in 2031 and 2041, respectively, compared to the 72.29 km2 recorded in 2018. On the other hand, scrub land is anticipated to continue decreasing, with an estimated decline of 2.23 km2 in 2031 and 2.23 km2 in 2041, in contrast to the 2.33 km2 observed in 2018 (Supplementary Table S12). The overall changes in land use/land cover for the predicted years are depicted in Figure 8.
FIGURE 8
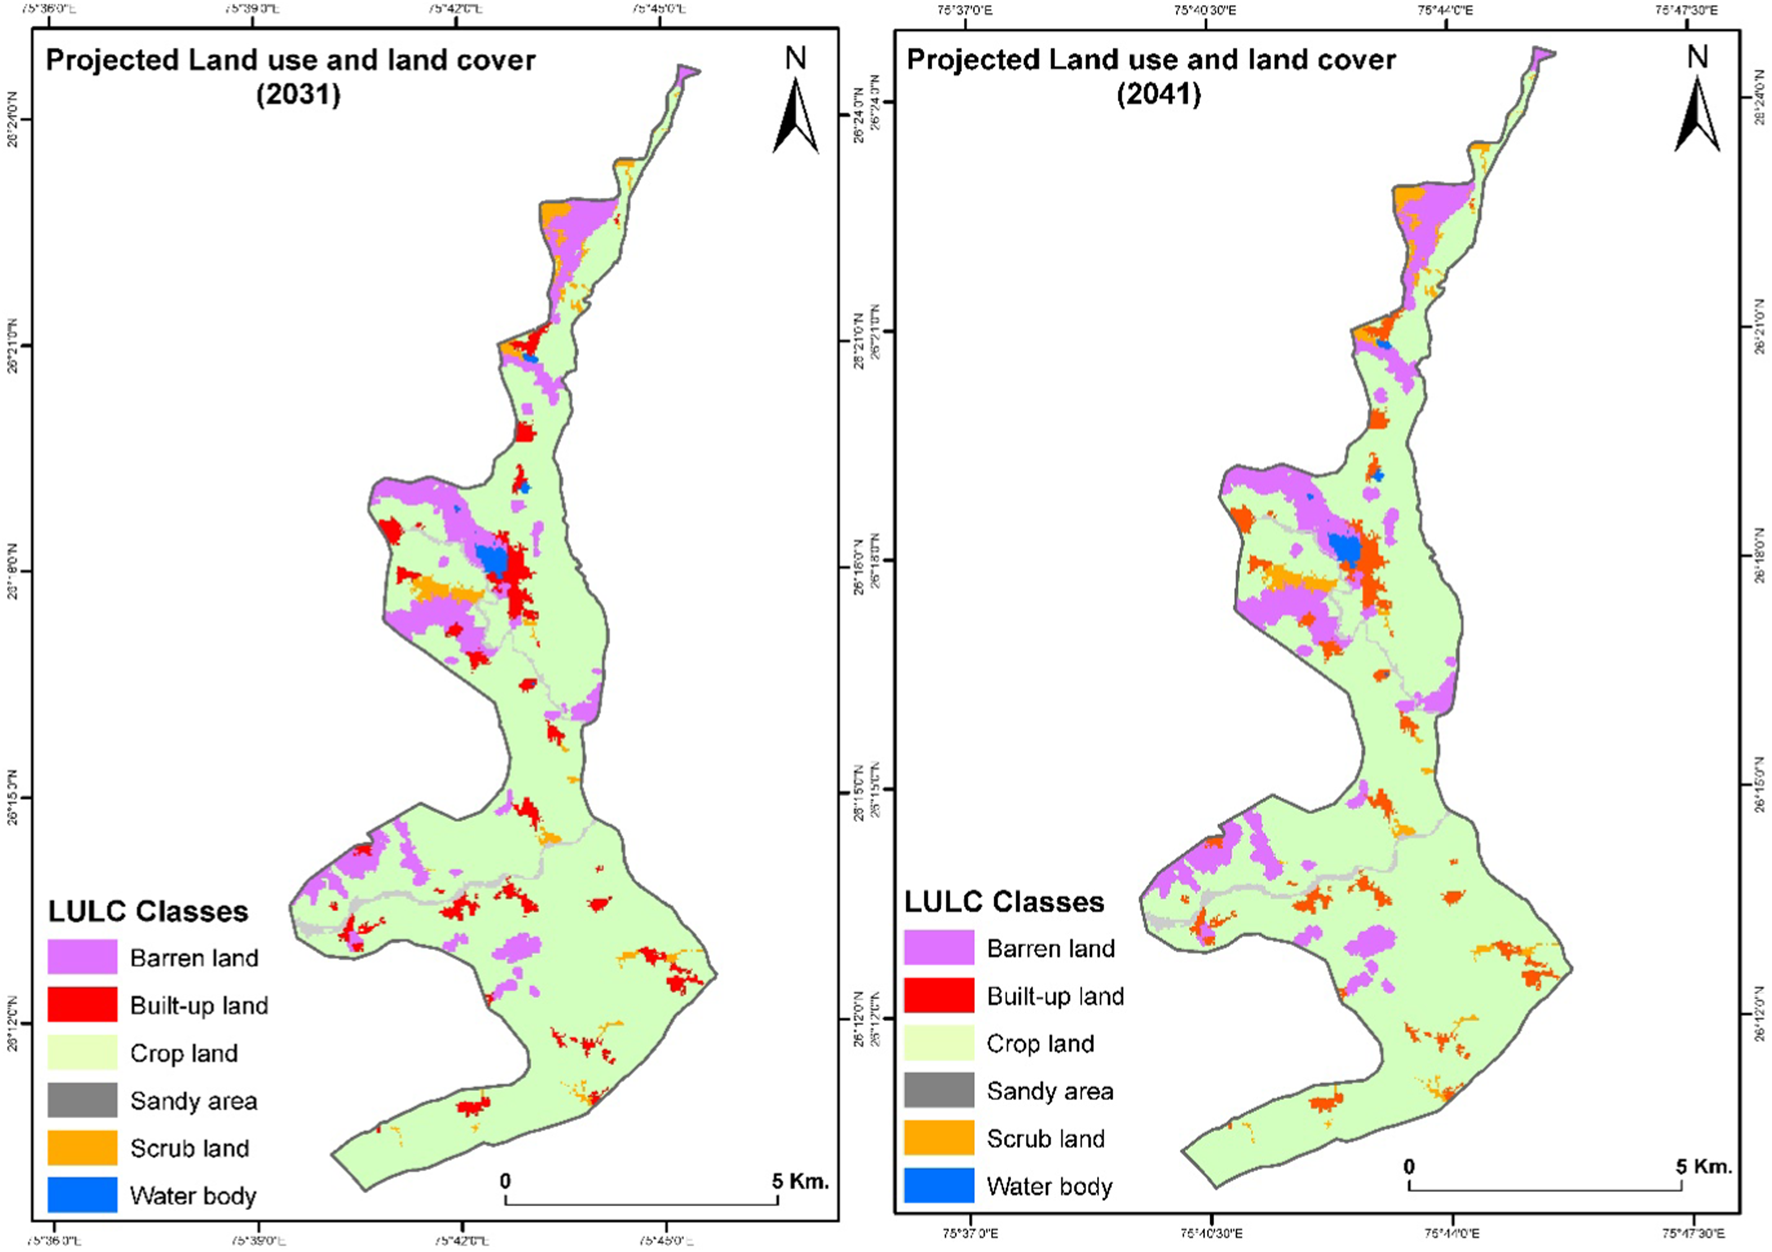
Projected land-use/land-cover for the period 2031 and 2041.
In summary, these predicted results affirm that the observed patterns will persist in the future, influenced by factors such as urban growth, waterlogging, salinity/sodicity issues, and sand mining activity. These changes will have significant impacts on the command area. Therefore, the future prediction results can be utilized to establish proper planning and environmental management strategies to mitigate the adverse effects of these changes (Abbas et al., 2021).
5 Discussion
The findings of this study illuminate the intricate dynamics of land-use and land-cover (LULC) changes in the Mashi Dam command area, reflecting broader trends influenced by human activities and climate change. The research identifies a troubling decline in cropland, which decreased by 4.75% from 2008 to 2018, while built-up areas and barren land witnessed significant expansions during the same period. This trend raises concerns regarding food security and ecological sustainability in the region, highlighting the urgent need for targeted land management strategies (Mall et al., 2006).
The integration of geo-spatial and remote sensing technologies facilitated a comprehensive understanding of these changes, enabling accurate spatio-temporal modeling. By leveraging high-resolution imagery from Landsat 5, LISS-3, and Sentinel 2A MSI, the study ensured robust data quality and validation through ground-truthing, enhancing the reliability of the predictions for 2031 and 2041. This methodological rigor provides a strong foundation for forecasting future scenarios in LULC, offering insights that are crucial for stakeholders engaged in resource management and urban planning (Abijith and Saravanan, 2022).
The projected further reduction of cropland by 2041, alongside the anticipated increase in barren lands, underscores the potential implications for local agricultural practices and biodiversity. These findings indicate a pressing need for effective interventions that promote sustainable land use, mitigate the conversion of fertile land, and enhance ecological resilience. Policymakers and land managers must therefore prioritize the development of adaptive strategies that consider both environmental sustainability and community livelihoods (Ahmad et al., 2024).
Ultimately, this research not only contributes to the understanding of LULC dynamics in Rajasthan but also serves as a call to action for the implementation of proactive measures aimed at preserving vital agricultural resources in the face of ongoing environmental challenges.
6 Conclusion
The findings of this study offer valuable insights into the location and extent of barren land expansion, which can be pivotal for natural resource planners when formulating strategies for barren land reclamation. The LCM utilized in this research demonstrates its effectiveness as a tool for depicting land cover changes, enabling policymakers to make informed decisions towards accomplishing sustainable development objectives. Across the period studied from 1988 to 2041, it is clear that the rise in barren land can be linked to anthropogenic activities such as soil salinity, waterlogging, mining, and over-irrigation, resulting in the degradation of crop land. These developments are not in harmony with sustainable development principles.
The study unveils a significant deterioration in the condition of crop lands over time, marked by substantial degradation. Moreover, the findings highlight a continual expansion of barren lands throughout the command area, primarily driven by anthropogenic influences. This situation presents numerous challenges for irrigated lands, impacting agricultural productivity and soil quality. Inappropriate agricultural practices are identified as the main drivers behind the proliferation of barren lands, leading to considerable harm to crop lands in the region. Addressing the issues related to barren lands and implementing suitable land management practices are essential to ensure the sustainable utilization and preservation of agricultural resources in the area. Policy implications or mitigation strategies has been mentioned properly. To strengthen the study, it is essential to incorporate a discussion on the long-term sustainability of LULC changes under climatic, socio-economic, and political conditions. Addressing how cropland degradation and barren land expansion may evolve due to factors such as changing rainfall patterns, population growth, and policy interventions will enhance the study’s relevance. Additionally, integrating policy implications and mitigation strategies can provide a more practical perspective. This includes sustainable land management practices, afforestation programs, soil conservation techniques, and urban planning policies that balance development with environmental protection. Considering regulatory frameworks, such as land-use zoning, water resource management near Mashi Dam, and conservation strategies, would help in formulating actionable recommendations. By incorporating these aspects, the study can provide a comprehensive assessment of LULC transformations while ensuring sustainable development in the region.
6.1 Limitations of the study
It is very significant to recognize the study’s limitations. On the basis of accuracy of remote sensing data various factors are influenced including data quality, and uncertainties in ground truthing. Additionally, this study primarily provides observational data and also observed the changes in land use. A more comprehensive understanding would require further research, including field investigations and a more in-depth analysis of local policies and socioeconomic factors influencing land use patterns. This study, while informative, is a stepping stone toward a more profound comprehension of the land use land cover in the region. Future research and collaborative efforts are necessary to build upon these findings and develop effective strategies for addressing the challenges posed by the land use land cover in Mashi Dam command area in Rajasthan.
Statements
Data availability statement
The original contributions presented in the study are included in the article/Supplementary Material, further inquiries can be directed to the corresponding authors.
Author contributions
BB: Conceptualization, Formal analysis, Methodology, Software, Validation, Writing – original draft. RS: Conceptualization, Formal Analysis, Methodology, Writing – review and editing. AK: Conceptualization, Methodology, Resources, Visualization, Writing – original draft, Writing – review and editing. SS: Data curation, Formal analysis, Validation, Writing – original draft, Writing – review and editing. FA: Data curation, Investigation, Resources, Writing – original draft, Writing – review and editing. CP: Data curation, Formal analysis, Methodology, Resources, Writing – original draft, Writing – review and editing. ZO: Funding acquisition, Investigation, Project administration, Writing – original draft, Writing – review and editing. AS: Formal analysis, Investigation, Methodology, Resources, Visualization, Writing – original draft.
Funding
The author(s) declare that no financial support was received for the research and/or publication of this article.
Acknowledgments
The authors extend their appreciation to Abdullah Alrushaid Chair for Earth Science Remote Sensing Research at King Saud University, Riyadh, Saudi Arabia for funding this research publication.
Conflict of interest
The authors declare that the research was conducted in the absence of any commercial or financial relationships that could be construed as a potential conflict of interest.
Generative AI statement
The author(s) declare that Generative AI was used in the creation of this manuscript. During the preparation of this work, the author(s) used Grammarly software to improve the readability of some parts such as (checking the grammar error, spelling mistakes, long sentences, tenses, and improving the sentences) of the manuscript. After using this tool/service, the author(s) reviewed and edited the content as needed and take(s) full responsibility for the content of the publication.
Correction note
A correction has been made to this article. Details can be found at: 10.3389/fenvs.2025.1646977.
Publisher’s note
All claims expressed in this article are solely those of the authors and do not necessarily represent those of their affiliated organizations, or those of the publisher, the editors and the reviewers. Any product that may be evaluated in this article, or claim that may be made by its manufacturer, is not guaranteed or endorsed by the publisher.
Supplementary material
The Supplementary Material for this article can be found online at: https://www.frontiersin.org/articles/10.3389/fenvs.2025.1540140/full#supplementary-material
References
1
AbbasZ.YangG.ZhongY.ZhaoY. (2021). Spatiotemporal change analysis and future scenario of LULC using the CA-ANN approach: a case study of the greater bay area, China. Land10 (6), 584. 10.3390/land10060584
2
AbijithD.SaravananS. (2022). Assessment of land use and land cover change detection and prediction using remote sensing and CA Markov in the northern coastal districts of Tamil Nadu, India. Environ. Sci. Pollut. Res.29, 86055–86067. 10.1007/s11356-021-15782-6
3
AhmadW. S.KaloopM. R.JamalS.TaqiM.HuJ. W.Abd El-HamidH. (2024). An analysis of LULC changes for understanding the impact of anthropogenic activities on food security: a case study of Dudhganga watershed, India. Environ. Monit. Assess.196, 105. 10.1007/s10661-023-12264-9
4
AlqadhiS.MallickJ.BalhaA.BindajamA.SinghC. K.HoaP. V. (2021). Spatial and decadal prediction of land use/land cover using multi-layer perceptron-neural network (MLP-NN) algorithm for a semi-arid region of Asir, Saudi Arabia. Earth Sci. Inf.14, 1547–1562. 10.1007/s12145-021-00633-2
5
AnsariA.GolabiM. H. (2019). Prediction of spatial land use changes based on LCM in a GIS environment for Desert Wetlands–A case study: meighan Wetland, Iran. Int. Soil Water Conservation Res.7 (1), 64–70. 10.1016/j.iswcr.2018.10.001
6
BandyopadhyayB. K.MajiB.LamaT. D. (2017). “Land degradation due to salinity, extent of losses in crop yield and strategies for management,” in Of 82nd annual convention and national seminar of Indian society of soil science. Editor SanyalS. K., 103–119.
7
ChangY.HouK.LiX.ZhangY.ChenP. (2018). Review of land use and land cover change research progress IOP Conference Series: earth and Environmental Science. IOP Publ.113 (1), 012087. 10.1088/1755-1315/113/1/012087
8
Ersoy TonyaloğluE. (2025). Future land use/land cover and its impacts on ecosystem services: case of Aydın, Turkey. Int. J. Environ. Sci. Technol.22, 4601–4617. 10.1007/s13762-024-05907-y
9
FoleyJ. A.DeFriesR.AsnerG. P.BarfordC.BonanG.CarpenterS. R.et al (2005). Global consequences of land use. Science309, 570–574. 10.1126/science.1111772
10
GadhaveR. S.GadeS. A.KalbandeS. R. (2022). Land use land cover and change detection of Rahuri Tehsil using remote sensing and GIS. Pharma Innovation J.11 (9S), 3156–3163.
11
GirmaR.FürstC.MogesA. (2022). Land use land cover change modeling by integrating artificial neural network with cellular Automata-Markov chain model in Gidabo river basin, main Ethiopian rift. Environ. Challenges6, 100419. 10.1016/j.envc.2021.100419
12
HalderS.DasS.BasuS. (2023). Use of support vector machine and cellular automata methods to evaluate impact of irrigation project on LULC. Environ. Monit. Assess.195 (1), 3. 10.1007/s10661-022-10588-6
13
HaqueM. I.BasakR. (2017). Land cover change detection using GIS and remote sensing techniques: a spatio-temporal study on Tanguar Haor, Sunamganj, Bangladesh. Egypt. J. Remote Sens. Space Sci.20 (2), 251–263. 10.1016/j.ejrs.2016.12.003
14
KafyA. A.RahmanM. S.HasanM. M.IslamM. (2020). Modelling future land use land cover changes and their impacts on land surface temperatures in Rajshahi, Bangladesh. Remote Sens. Appl. Soc. Environ.18, 100314. 10.1016/j.rsase.2020.100314
15
KhanN.RazaM.ShakoorM. S. A.BiswasF.RahamanM. (2023). Dynamic of population growth and its effect on land use/land cover of bahraich district in Uttar Pradesh. Pradesh J. Environ. Stud. Sci.13, 124–140. 10.1007/s13412-022-00805-6
16
Kumaret al.KumarP.JainS.GurjarB. R.SharmaP.KhareM.et al (2013). New directions: can a “blue sky” return to Indian megacities?Atmos. Environ.71, 198–201. 10.1016/j.atmosenv.2013.01.055
17
LalP.ShekharA.KumarA. (2021). Quantifying temperature and precipitation change caused by land cover change: a case study of India using the WRF model. Front. Environ. Sci.9, 766328. 10.3389/fenvs.2021.766328
18
LambinE. F.MeyfroidtP. (2011). Global land use change, economic globalization, and the looming land scarcity. PNAS108, 3465–3472. 10.1073/pnas.1100480108
19
LemenkovaP. (2020). Object based image segmentation algorithm of SAGA GIS for detecting urban spaces in yaoundé, Cameroon. Central Eur. J. Geogr. Sustain. Dev.2 (2), 38–51. 10.47246/cejgsd.2020.2.2.4
20
LetaM. K.DemissieT. A.TräncknerJ. (2021). Modeling and prediction of land use land cover change dynamics based on land change modeler (LCM) in Nashe watershed, upper Blue Nile basin, Ethiopia. Sustainability13 (7), 3740. 10.3390/su13073740
21
MallR.GuptaA.SinghR.SinghR.RathoreL. (2006). Water resources and climate change: an Indian perspective. Curr. Sci. Assoc.90 (12), 1610–1626.
22
MatinfarH. R.SarmadianF.Alavi PanahS. K.HeckR. J. (2007). Comparisons of object-oriented and pixel-based classification of land use/land cover types based on Lansadsat 7, ETM+ spectral bands (case study: arid region of Iran). American-Eurasian J. Agric. and Environ. Sci.2 (4), 448–456.
23
MirhosseiniS. M.JamaliA. A.HosseiniS. Z. (2016). Investigating and Predicting the extension of dunes using land change modeler (LCM) in the north west of Yazd, Iran. Desert21 (1), 76–90.
24
MishraV. N.RaiP. K. (2016). A remote sensing aided multi-layer perceptron-Markov chain analysis for land use and land cover change prediction in Patna district (Bihar), India. Arabian J. Geosciences9, 249–318. 10.1007/s12517-015-2138-3
25
MoharirK. N.PandeC. B.GautamV. K.DashS. S.MishraA. P.YadavK. K.et al (2025). Estimation of land surface temperature and LULC changes impact on groundwater resources in the semi-arid region of Madhya Pradesh, India. Adv. Space Res.75 (1), 233–247. 10.1016/j.asr.2024.09.025
26
MunthaliM. G.DavisN.AdeolaA. M.BotaiJ. O.KamwiJ. M.ChisaleH. L.et al (2019). Local perception of drivers of land-use and land-cover change dynamics across Dedza District, Central Malawi Region. Sustainability11 (3), 832. 10.3390/su11030832
27
MurayamaY.ThapaR. B. (2011). Spatial analysis and modeling in geographical transformation process: GIS-based Applications. 1st edn. Dordrecht: Springer, 1–302.
28
NaikooM. W.RihanM.IshtiaqueM.Shahfahad (2020). Analyses of land use land cover (LULC) change and built-up expansion in the suburb of a metropolitan city: spatio-temporal analysis of Delhi NCR using Landsat datasets. J. Urban Manag.9 (3), 347–359. 10.1016/j.jum.2020.05.004
29
PandeC. B.DiwateP.OrimoloyeI. R.SidekL. M.Pratap MishraA.MoharirK. N.et al (2024). Impact of land use/land cover changes on evapotranspiration and model accuracy using Google Earth engine and classification and regression tree modeling. Geomatics, Nat. Hazards Risk15 (1), 2290350. 10.1080/19475705.2023.2290350
30
PandeC. B.MoharirK. N.KhadriS. F. R.PatilS. (2018). Study of land use classification in an arid region using multispectral satellite images. Appl. Water Sci.8, 123–211. 10.1007/s13201-018-0764-0
31
PandeyP. C.KoutsiasN.PetropoulosG. P.SrivastavaP. K.Ben DorE. (2021). Land use/land cover in view of earth observation: data sources, input dimensions, and classifiers—a review of the state of the art. Geocarto Int.36 (9), 957–988. 10.1080/10106049.2019.1629647
32
ParsaV. A.SalehiE. (2016). Spatio-temporal analysis and simulation pattern of land use/cover changes, case study: naghadeh, Iran. J. Urban Manag.5 (2), 43–51. 10.1016/j.jum.2016.11.001
33
ParsamehrK.GholamalifardM.KoochY. (2020). Comparing three transition potential modeling for identifying suitable sites for REDD+ projects. Spatial Inf. Res.28, 159–171. 10.1007/s41324-019-00273-1
34
RaginiH. R.DebnathM. K.GuptaD. S.DebS.AjithS. (2023). Modelling and monitoring land use: land cover change dynamics of Cooch Behar District of West Bengal using multi-temporal satellite data. Agric. Res.12, 387–396. 10.1007/s40003-023-00657-8
35
RwangaS. S.NdambukiJ. M. (2017). Accuracy assessment of land use/land cover classification using remote sensing and GIS. Int. J. Geosciences8 (4), 611–622. 10.4236/ijg.2017.84033
36
SaipovaB.MamatkulovZ.AltievA.RajapbaevM.BekzodK. (2022). Importance of land use and land cover change analyze in land resource management. AIP Conf. Proc.2432 (1), 040038.
37
SeyamM. M. H.HaqueM. R.RahmanM. M. (2023). Identifying the land use land cover (LULC) changes using remote sensing and GIS approach: a case study at Bhaluka in Mymensingh, Bangladesh. Case Stud. Chem. Environ. Eng.7 (100293), 100293–100312. 10.1016/j.cscee.2022.100293
38
SongX. P.HansenM. C.StehmanS. V.PotapovP. V.TyukavinaA.VermoteE. F.et al (2018). Global land change from 1982 to 2016. Nature560 (7720), 639–643. 10.1038/s41586-018-0411-9
39
StuckenbergT.MünchZ.Van NiekerkA. (2013). Multi-temporal remote sensing land-cover change detection for biodiversity assessment in the Berg River catchment. South Afr. J. Geomatics2 (3), 189–205.
40
SuY.XuanY.ZangL.ZhangX. (2024). Is land fragmentation undermining collective action in rural areas? An empirical study based on irrigation systems in China’s frontier areas Land, Land (Basel)13 (7), 1041. 10.3390/land13071041
41
WaleedM.SajjadM.ShaziM. S. (2023). Urbanization-led land cover change impacts terrestrial carbon storage capacity: a high-resolution remote sensing-based nation-wide assessment in Pakistan (1990–2020). Environ. Impact Assess. Rev.105, 107396. 10.1016/j.eiar.2023.107396
42
WangS. W.GebruB. M.LamchinM.KayasthaR. B.LeeW. K. (2020). Land use and land cover change detection and prediction in the Kathmandu district of Nepal using remote sensing and GIS. Sustainability12, 3925. 10.3390/su12093925
43
WinklerK.FuchsR.RounsevellM.HeroldM. (2021). Global land use changes are four times greater than previously estimated. Nat. Commun.12 (1), 2501. 10.1038/s41467-021-22702-2
44
YirsawE.WuW.ShiX.TemesgenH.BekeleB. (2017). Land use/land cover change modeling and the prediction of subsequent changes in ecosystem service values in a coastal area of China, the Su-Xi-Chang Region. Sustainability9 (7), 1204. 10.3390/su9071204
Summary
Keywords
transformation, future prediction, LULC, geoinformatics, Rajasthan (India)
Citation
Bairwa B, Sharma R, Kundu A, Sammen SS, Alshehri F, Pande CB, Orban Z and Salem A (2025) Predicting changes in land use and land cover using remote sensing and land change modeler. Front. Environ. Sci. 13:1540140. doi: 10.3389/fenvs.2025.1540140
Received
05 December 2024
Accepted
24 March 2025
Published
10 June 2025
Corrected
09 July 2025
Volume
13 - 2025
Edited by
Eduardo Gomes, University of Lisbon, Portugal
Reviewed by
Srishti Gaur, University of California, Riverside, United States
Subrata Haldar, Agrawan Heritage University, India
Updates
Copyright
© 2025 Bairwa, Sharma, Kundu, Sammen, Alshehri, Pande, Orban and Salem.
This is an open-access article distributed under the terms of the Creative Commons Attribution License (CC BY). The use, distribution or reproduction in other forums is permitted, provided the original author(s) and the copyright owner(s) are credited and that the original publication in this journal is cited, in accordance with accepted academic practice. No use, distribution or reproduction is permitted which does not comply with these terms.
*Correspondence: Ali Salem, salem.ali@mik.pte.hu; Chaitanya Baliram Pande, pandechaitanya522@gmail.com
ORCID: Arnab Kundu, orcid.org/0000-0002-2291-5741, Saad Sh. Sammen, orcid.org/0000-0002-1708-0612
Disclaimer
All claims expressed in this article are solely those of the authors and do not necessarily represent those of their affiliated organizations, or those of the publisher, the editors and the reviewers. Any product that may be evaluated in this article or claim that may be made by its manufacturer is not guaranteed or endorsed by the publisher.