 David Poblete1,2*
 Sebastián Vicuña2,3,4Sebastián Aedo5
 Edmundo Molina-Perez6
 Hermilo Cortés6
 Oscar Melo3,7Anahí Ocampo-Melgar8Kiara Tesen2,9
 Francisco Suárez2,10Juan Pablo Herane3Francisco Meza3,11,12Katherine Duarte3Diego González3
 Sarah Leray2,3Megan Williams2,4,13Aurora Gaxiola3,13,14Gabriela Alfaro15David Morales-Moraga3,16
- 1Escuela de Ingeniería Civil, Universidad de Valparaíso, Valparaíso, Chile
- 2Departamento de Ingeniería Hidráulica y Ambiental, Pontificia Universidad Católica de Chile, Santiago, Chile
- 3Centro de Cambio Global, Pontificia Universidad Católica de Chile, Santiago, Chile
- 4Centro de Investigación para la Gestión Integrada del Riesgo de Desastres, Pontificia Universidad Católica de Chile, Santiago, Chile
- 5Latin America Centre, Stockholm Environment Institute, Bogotá, Colombia
- 6Escuela de Gobierno y Transformación Pública, Tecnológico de Monterrey, Monterrey, Mexico
- 7Department of Agricultural Economics, Pontificia Universidad Católica de Chile, Santiago, Chile
- 8Departamento de Gestión Forestal y Medio Ambiente, Facultad de Ciencias Forestales y de Conservación de la Naturaleza, Universidad de Chile, Santiago, Chile
- 9Instituto de Hidráulica, Hidrología e Ingeniería Sanitaria, Universidad de Piura, Piura, Peru
- 10Centro de Desarrollo Sustentable (CEDEUS), Pontificia Universidad Católica de Chile, Santiago, Chile
- 11Departamento de Ecosistemas y Medioambiente, Pontificia Universidad Católica de Chile, Santiago, Chile
- 12Instituto para el Desarrollo Sustentable, Pontificia Universidad Católica de Chile, Santiago, Chile
- 13Facultad Ciencias Biológicas, Pontificia Universidad Católica de Chile, Santiago, Chile
- 14Instituto de Ecología y Biodiversidad, Pontificia Universidad Católica de Chile, Santiago, Chile
- 15Facultad de Ciencias Sociales, Universidad de Chile, Santiago, Chile
- 16Facultad de Agronomía y Sistemas Naturales, Pontificia Universidad Católica de Chile, Santiago, Chile
Climate change, land use alterations, human activities, and regulatory frameworks all contribute to deep uncertainties that define water security in hydrological basins. This is particularly significant in drylands where water scarcity limits agricultural productivity. Robust Decision Making (RDM) is an effective approach for identifying strategies that perform well under uncertainty across a wide range of possible futures. One of RDM’s key strengths is its ability to guide decisions without relying on precise future predictions, emphasizing robustness rather than optimality. This study focuses on the Quilimarí River basin, located in the semi-arid coastal region of Chile, where groundwater is the primary water source. Small coastal communities rely on shallow boreholes, which have become brackish due to saline intrusion. We present the initial stages of implementing an RDM process with key local decisionmakers to explore the expected impacts of socio-hydrological stressors and uncertainties on the main water-dependent objectives. Different levels and approaches of participation during the 2 years of RDM process enabled the identification of critical concerns raised by local stakeholders and government agencies, the uncertainties likely to affect these issues, and potential actions for improving outcomes. To explore current and future vulnerabilities we used a WEAP-MODFLOW water resources model that integrates data on extraction wells, irrigation schemes, agricultural production, potable water supply, and associated costs, including saline intrusion processes. The model simulates trade-offs between different objectives, such as groundwater extraction for agriculture and job creation versus potable water for rural communities. The vulnerability exploration scenarios suggest a complex future, with up to a 40% reduction in precipitation and increased water demand from household and tourism use. To cope with the impacts associated with these global change scenarios a series of adaptation options were tested. Overall, desalination emerged as a favorable option for local human consumption demands, although tested only under basin-level metrics. This study illustrates valuable insights on how the water management strategies under uncertainty can benefit from local engagement towards testing robust decisions in arid and semi-arid coastal basis around the world.
1 Introduction
We live in a world of deep uncertainties and we struggle to fully comprehend how the socio-ecosystems we inhabit and depend on, function and can be best managed. Changes in climate and land use, the accelerated development of human activities, groundwater depletion and the configuration of management and regulations, all constitute and contribute to deep uncertainties that ultimately define the level of water security of hydrological basins that are critically important to national economies and international trade (Dalin et al., 2017). Sociohydrology emerges in this context, inside hydrological sciences as an interdisciplinary approach for understanding, interpreting, and predicting the water cycle, recognizing the co-evolutionary dynamics and emerging behaviors at multiple scales with the human dimension (Sivapalan et al., 2012; Sivapalan et al., 2014). Recognizing the relationship between water and people also implies acknowledging that there are no rigid rules for human behavior, nor is there consensus on what the relevant social processes are that should be included in hydrological processes (Blair and Buytaert, 2016). Therefore, sociohydrology researchers are continuously exploring possibilities and limits to understand the complexity of the interlinked human-water system (Van Oel et al., 2024).
An important insight gleaned in recent years is that the objective of water security can be approached and attained in different ways. For example, the existence of multiple adaptation pathways is the result of decision making at two levels (Wise et al., 2014): i) incremental actions within prevailing governance arrangements to tackle the proximate causes of vulnerability; and ii) proactive actions to influence existing rules and values on decision-making to alter the current governance system. Under this lens, the pursuit of water security under an unavoidable uncertainty can be understood as an iterative decision-making process that attempts to steer socio-hydrological systems towards desirable future states, considering forces of global, but also local change; both interacting with external drivers such as climate change as a tele coupled socio-ecological system (Butler et al., 2014; Kwakkel et al., 2016; Wise et al., 2014). Solutions, measures or actions should be effective, feasible and just means of reducing climate risk, increasing resilience and pursuing other climate-related societal goals (IPCC, 2022). In response to these challenges, stakeholder engagement, integrated modelling, robust decision making and adaptive management frameworks have been identified as necessary ingredients to make meaningful progress towards water security under deep uncertainties that could affect that progress (Haasnoot et al., 2019; Lempert et al., 2024; Marchau et al., 2019; Sadoff and Muller, 2009).
Robust Decision Making (RDM) has been used in many contexts to guide in the identification of options or strategies which can perform well under these deep uncertainties and over a wide range of possible futures (Groves and Lempert, 2007; Hall et al., 2012; Lempert et al., 2003; 2024; Lempert and Collins, 2007). RDM emphasizes the concept of robustness over optimality, defining robustness as the ability of an action to perform effectively across a wide range of uncertain future conditions. This can involve either minimizing negative impacts or reducing the variability in system responses, thereby highlighting the comparative reliability of a strategy relative to other alternatives (Kwakkel et al., 2016; Marchau et al., 2019). Considering the characteristics of climate change and the myriad adaptation objectives and interventions, RDM supports the evaluation of adaptation scenarios and decision making in relation to water resources planning. It can be considered as an alternative approach to more traditional economic assessment methods like cost-benefit analysis or SWOT, as RDM seeks robust options (“good enough”) instead of options deemed optimal in terms of economic efficiency, where robust relates more to minimizing regret instead of maximizing expected utility, although both concepts are not always in conflict. One of the biggest strengths of RDM in water resources is its capacity to help make informed decisions without relying on precise modelling the future state of the hydrological system, although the models used must capture the main hydrological fluxes, allocation rules and other relevant processes in a basin, as new infrastructure and/or new water policies may generate impacts. In RDM, adaptation strategies are tested across a large number of plausible future states and its main objective is to help decision makers anticipate or mitigate the impacts of a range of possible future scenarios (Lempert et al., 2003).
Water is a scarce resource in drylands, as aridity limits the supply of water resources and therefore the productivity of agriculture. In those areas people face severe difficulties in maintaining their livelihoods (Mirzabaev et al., 2022) and climate change exacerbates these problems. Globally, surface warming over global drylands (1.2°C–1.3°C) has been 20%–40% higher than that over humid lands (0.8°C–1.0°C), because the sparse vegetation cover and lower soil moisture of dryland ecosystems amplify temperature and aridity increases (Huang et al., 2017). In drylands, this intensified warming is projected to persist in the future, further aggravating water security challenges. These issues are often compounded by non-climatic factors, including inadequate infrastructure, poor water governance, and the cultivation of water-intensive crops. Productive activities like industries, agriculture, urban and rural water utilities conflict with each other and with other forms of water use, such as tourism and environmental conservation. This competition can impact negatively on the natural hydrological cycle, reducing the water availability in quantity and quality, aspects that deteriorate the adaptive capacity of basins located in drylands (Mirzabaev et al., 2022). Although this context, most of the research developed in socio-hydrology focuses on flood events, with relatively few applications (11%) addressing droughts, a critical issue in semi-arid basins and only one-third of the reviewed studies incorporated stakeholder participation, highlighting a gap in inclusive and participatory approaches (Vanelli et al., 2022).
Semi-arid coastal basins can be seen as distinctive examples of socioecological systems susceptible to the impacts of global change. Aside from the fact that water resources are scarce due to their natural climatic variability, coastal basins are subject to environmental degradation and large pressures on water demand from coastal tourism-related activities (Arabadzhyan et al., 2021; Garcia and Servera, 2003). On a more structural but related issue, coastal urban regions are more densely inhabited and show faster growth than inland settlements (Neumann et al., 2015). Given the context of these complex systems in semi-arid coastal basins, good management of water resources and effective strategies for adaptation are needed. For this purpose, it is paramount to understand how vulnerable or predisposed to be adversely affected are these basins and their human and natural components to climate change and other potential hazards. The challenges listed above position coastal semi-arid basins as valuable candidates for studying their vulnerabilities to climate and other global changes. They also provide a relevant context for evaluating adaptation strategies using modelling tools and local involvement.
Studies employing methodologies like the Robust Decision-Making (RDM) framework have been applied in diverse water, social, and ecosystem contexts, which differ significantly from the semi-arid coastal basins’ context. For example, Haasnoot et al. (2015) and Kwakkel et al. (2015), utilized Dynamic Adaptive Policy Pathways (DAPP), a methodology aligned with the deep uncertainty frameworks (including RDM), to address sea-level rise and potential flooding in lowland regions. Their approach tested various adaptive policies dynamically, demonstrating the value of such methods in managing uncertain and evolving risks. Verbist et al. (2020) analyzed strategies for reservoir water usage in the Limarí River Basin, in the semi-arid region in Chile, using the Critical Risk Informed Decision Analysis (CRIDA) framework, a collaborative water resource planning under uncertainties, used to analyze and develop strategies for managing risks in complex socio-environmental systems (Mendoza et al., 2018). However, their model did not account for critical factors such as detailed surface-groundwater interactions, agricultural extraction wells, or the inland groundwater-salt wedge phenomena. These factors, if not properly considered, can significantly impact decision-making and its outcomes, especially in semi-arid coastal basins.
Hence, the objective of this study is to explore multi-factorial vulnerability to water related issues using an RDM approach, considering two particularities of semi-arid coastal basins: marine-river-groundwater fluxes and agriculture-drinkable water consumption interactions. Water multi-factorial vulnerability refers here to the susceptibility of water resources to adverse impacts due to the combined and interacting effects of multiple stressors, such as climate change, population growth and agricultural demands: climate change alters precipitation patterns and increases temperature, affecting the balance of water resources; population growth expands the demand for freshwater for domestic, industrial putting additional strain on already limited resources and intensive farming practices and irrigation of water-intensive crops exacerbate water depletion, reducing the availability of clean water. But while population and agriculture are part of the stressors, they also can be impacted negatively. Lastly, natural ecosystems depend on stable water availability and quality to maintain biodiversity and services. Compromising these systems due to competing demands also increases their vulnerability. This compounded vulnerability reflects the interconnectedness of natural and human systems, and therefore trade-offs under different futures and adaptation strategies.
Chapter 2 outlines the study’s methodology, which applies the Robust Decision Making (RDM) framework using the XRLM matrix and several participation and stakeholder engagement instances. To support the RDM analysis, an existing water resources model for the Quilimarí river basin was enhanced (Dirección General de Aguas, 2020), which couples the WEAP model, a semi-distributed hydrologic and water allocation model forced by climate and water demands, with the MODFLOW model for groundwater modelling. This tool enables to quantify the interdependence between water management strategies and their socioeconomic and environmental impacts. Chapter 3 presents the exploration of vulnerability through the simulation results and the comparison of the different metrics and trade-offs between policy levers. Finally, Chapter 4 presents the conclusions of the study.
2 Methodology
In the following sections we introduce the different components of the methodological approach of the RDM framework through the explanation of the XRLM matrix, continuing with a description of the case study in the Quilimarí river basin. Then, we describe participation approaches in each stage, the modeling tool used in this study and the experimental design.
2.1 The XLRM matrix definition
Lempert et al. (2003) introduced the XLRM matrix as a tool for structuring the dialogs in a RDM framework. Haga clic o pulse aquí para escribir texto. The XLRM matrix requires a participatory approach, where facilitators engage with local stakeholders on identifying expectations and basin challenges into metrics that can be calculated quantitatively using computer models, as well as plausible future scenarios in which testing those strategies. The XLRM matrix is a four dimensional structure that allows including the basic elements of a RDM analysis including the uncertain factors or uncertainties (X) that potentially define futures scenarios; the management decisions, options, or policy levers (L) that comprise alternative strategies; the performance metrics (M) used to describe outcomes; and the relationships or models (R) used to simulate the system and interconnection of these elements.
In our system of interest, performance metrics or indicators (M), represent valuable assets of the socio-hydrologic system under study. It describes the indicators used to assess vulnerability conditions and compares the merits of different actions. As an example, Donatti et al. (2020) proposed metrics that permit to measure the direct impacts of climatic hazards on water supply and income from crop production through time.
Uncertainties (X) or lack of complete information and knowledge can be related to inaccurateness of climate and hydrological models to describe complex systems (IPCC et al., 2023; Kundzewicz et al., 2018). Climate change projections are one example of these uncertainties. Uncertainties are also related to other unknown features about the future of societies, their socio-economic development and the driving factors of that development such as population growth, lifestyle and culture, technologic improvements, etc. (Kundzewicz et al., 2018; Kundzewicz and Gerten, 2015). Current attitudes and values may not be the same in the future and what is valued today may not be valued as much in the future and vice versa (Lempert et al., 2003) and implementation of certain policies today may trigger actions or policies in the future that could not have been generated on their own.
The policy levers (L) are actions, projects or new behaviors that should address the reduction in harm, the risk of harm or the realization of benefits (IPCC, 2022) but also the needs of society and the environment to ensure water security, food security, and the protection of ecosystems, considering the different performance indicators and their thresholds in the vulnerabilities assessment (Donatti et al., 2020; Mendoza et al., 2018). These policy levers should be effective, feasible and just means of reducing climate risk, increasing resilience and pursuing other climate-related societal goals (IPCC, 2022).
The category Relations (R) describes the causal links, represented by computational tools or models, used to evaluate the performance of the actions in the face of the identified exogenous uncertainty factors. It is through these computational tools that we evaluate the performances (M) that different courses of action (L) have on system outcomes in different alternative future states of the world (X).
2.2 Case study: Quilimarí river basin
In this study, the RDM approach was applied in the Quilimarí river basin located in central Chile, shown in Figure 1A. In this small coastal basin, there are two major water users: agriculture and population, mainly composed of rural communities but also for tourism which is concentrated during the summer at the coastal edge of the basin (see Figure 1B). Although agricultural water use is much larger in volume than domestic demand, conflicts emerge because small villages across the basin have limited resources and lack access to deep wells, relying instead on shallow groundwater sources.
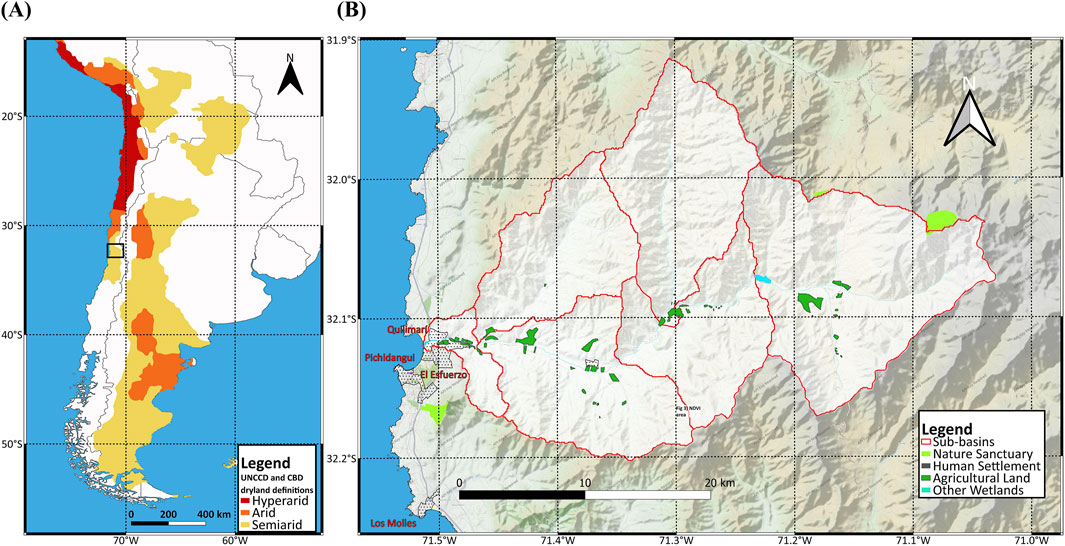
Figure 1. Case study presentation (A) The Quilimarí river basin location in the context of the transition from the semi-arid to the arid zone in central Chile. (B) The delimitation of the sub-basins, the location of agriculture and human settlements in the basin.
This 700 km2 basin is located at the transition zone between arid and semi-arid climates in Chile (at approximately 32°S latitude). It is affected by two major global change processes: the southward expansion of desertification, driven by climate change, and the unregulated, sometimes illegal, growth of coastal housing developments, which is contributing to a northward expansion of urban land use (Hidalgo et al., 2016), generating an increasing water demand. From a physical perspective, due to their relatively low altitude (maximum value of 700 m. a.s.l.), this basin lacks snow accumulation, hence superficial flow is intermittent and not a reliable source of water resource (Dirección General de Aguas, 2020). In this hydroclimatic context and with nearly inexistent surface water availability, most of the water supply in this basin depends on groundwater availability (Suárez et al., 2021). In addition, this and other coastal basins experience an influx of summer tourists, leading to a seasonal increase in freshwater demand. This generates additional pressure on the aquifers that supply the resource, exacerbating existing water stress during the driest months of the year (Arabadzhyan et al., 2021; Garcia and Servera, 2003). This situation, low surface availability and increasing water demand, is common to most semi-arid coastal basins in Chile (Suárez et al., 2021), making this case study useful for similar basins in arid and semi-arid regions.
In terms of climate, year 2010 marked the beginning of a significant climatic shift in central Chile, known as the “Mega Drought” (Boisier et al., 2016; 2018; Garreaud et al., 2020; 2021), attributed both to natural variability and anthropogenic climate change (Boisier et al., 2016). In the Quilimarí river basin, annual precipitation dropped around 30%, from the 1985–2009 yearly average value of 308 mm–211 mm per year, for the period 2010 to 2023. This sharp reduction severely impacted other semi-arid basins in central Chile (Barría et al., 2021; Dirección General de Aguas, 2020; Gironás and Fernández, 2021; Meza et al., 2015; Ocampo-Melgar et al., 2016). In this context, tanker trucks initially were used as an emergency source of water as well as in other parts of Chile but have become a regular part of the supply system as they have been used in combination with other local and national strategies (Nicolas-Artero and Blanco-Wells, 2024), with increasing financial, social and environmental costs. Agriculture area had been rising since the mid-2000s until it reached its peak in 2015–2016 season, but declined considerably since then, mostly link to problems with water supply and pumping.
Table 1 presents the main changes that occurred in the basin, comparing the same time periods. The data for this table is prepared combining observed information with data produced by a simulation model, originally presented by Dirección General de Aguas (2020), explained in Section 2.4.4. Both the observed and simulated data show that annual average streamflow reductions are even larger than the ones observed in precipitation, with a reduction of more than 70%. In terms of water demand and use, the drinkable water demand increased around 46% due to population growth. Finally agriculture water demand also increased, explained by water rights granted (that grew in 161%) and fruit trees cultivated area (that grew almost 300%). The basin presents basic water infrastructure: the Culimo reservoir, a small accumulation infrastructure of no more than 10 million cubic meters and a few irrigation canals that are mostly abandoned due to the drought and the extended use of groundwater.
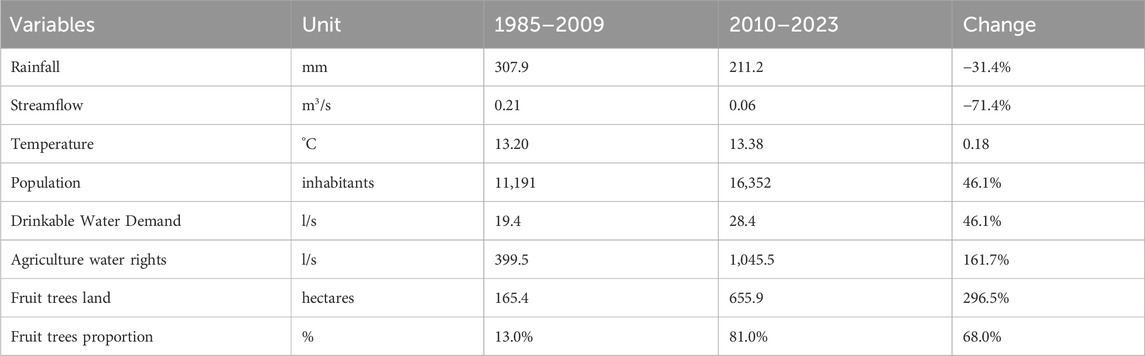
Table 1. Changes of yearly average hydro-climatological, water demand and agriculture variables over to consecutive periods in the Quilimarí river basin (1985–2009 vs. 2010–2023).
Some communities in this area are supplied by local community water providers called Asociaciones de Agua Potable Rural (APR by its acronym in Spanish), most of them run by members of the community appointed voluntarily. In some cases, APRs and other water utilities obtain water from wells close to the sea, resulting in low water quality due to their high salinity as a product of groundwater salt intrusion (Suárez et al., 2021). Possible causes of this salty contamination are the high levels of water pumping upstream in the catchment for crop irrigation and drinking water production (Taucare et al., 2024) but also from tidal effects, low recharge levels due to reductions in rainfall (Garreaud et al., 2020) and the sea level rise (Earll et al., 2024; Yu et al., 2022). During September of 2023, one of the coastal APR had to stop serving the population of El Esfuerzo due to the same problems that affected a water utility company a year before: water contaminated by excess of salt and other minerals. This led to widespread discontent among the population, with protestors temporarily disrupting traffic along the country’s main south-north highway. The major claim was that the brine discharge of the water utility was contaminating the aquifer, as the reverse osmosis byproduct has been disposed of at the soil surface close to the APRs groundwater well’s location. The combined effects of groundwater depletion and the increase in salt concentration, deriving from anthropic brine disposal and/or natural salt-water intrusion, implied that these rural communities were relying mostly on tanker trucks to the detriment of a continuous water supply by their own wells.
As part of the context of the Mega Drought and water scarcity in central Chile, in 2020 the Chilean water management agency (General Water Directorate or DGA by its Spanish acronym) presented the Strategic Plan of Water Resources Management (SPWRM) for this and other two neighbor basins, whose objective was to define a strategic plan for the water use in each basin for the next 30 years (Dirección General de Aguas, 2020). The SPWRM established the water balance of the basin, using a calibrated model capable of simulating the hydrology, rivers discharge, water demands, groundwater fluxes and storages and water allocations based on availability and water rights. In parallel, the SPWRM identified some of the basin water related problems through a series of virtual instances of participation with several stakeholders, in the context of the COVID pandemic. These instances also involved consultation on specific actions or projects to be implemented as well as a proposed coordinated action plan for the future of the basin.
2.3 Participatory scoping: workshops and meetings
Based on the main water-related problems identified in the SPWRM, the team contacted several decision makers groups to frame their visions and beliefs in the XRLM matrix and organized a series of engagement initiatives held during the years 2022 and 2023. These stakeholders were associated to local government (municipality of Los Vilos), water providers in the basin (local associations and one water utility), farmers, local environmental groups and regional representatives of national authorities (i.e., DGA, the General Directorate of Hydraulic Works, the National Irrigation Commission).
Stakeholders’ participation is an important element of the RDM process to assure incorporating yearnings and desires in the results of the approaches and tools, although there is no prescription on the level of participation required on each step. In this study, stakeholder engagement followed a series of formal and informal participatory instances. Some of these instances were small focus groups within one organization (e.g., gathering information on water distribution challenges, or expectations on land use change), and others were larger workshops with diverse stakeholders (e.g., discussing plausible strategies for water challenges). In addition, individual meetings were held with the DGA, the Ministry of Environment, the Regional Government and other key public services according to the actions and performances evaluated in the analysis.
Given the large extension of the territory, the diversity of uses and views over water, the after-COVID context, and the busy schedule of participants, the approach implemented small working groups in different parts of the basin focusing the discussion on RDM aspects that were of relevancy in that context. Depending on the stage of the RDM process, some instances had a consultation objective, and others were an involvement type of participation (based on the International Association of Public Participation, see Table 2). In total, delegates or participants from at least 20 local community water providers, environmental organizations and farmers from the basin and more than 15 local and regional government entities were involved in the process.
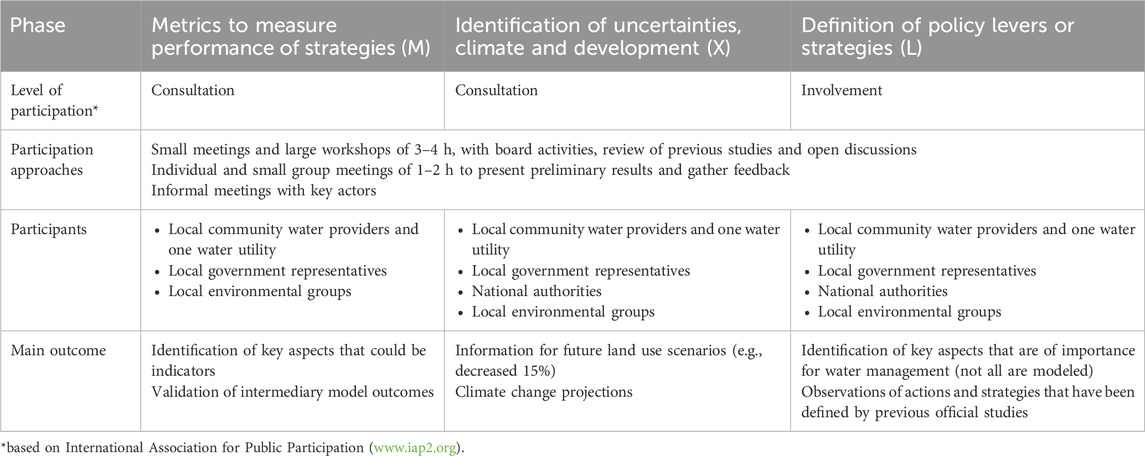
Table 2. Elements of the XRLM matrix for the RDM process and the participatory engagement approach followed.
The participatory instances followed an open dialogue approach to describe the scope of the study, communicate the methodological developments and engage in constructive discussion with participants regarding water resource management in the context of the continuous drought. The discussions were designed to get the key aspects regarding the different groups desires futures for the basin, the performance indicators to measure the success or failure of those futures, some actions or projects to improve or maintain desired aspects, and uncertainties or unknows that could impact negatively those indicators. To quantify complex ideas and concepts discussed during the workshops, some of the concepts were reviewed and described by the study team.
The results of these meetings allowed us to describe three of the four components of the XRLM matrix: the metrics (M), the uncertainties (X) and the policy levers (L), that will be explained in the next section. The last element, the Relation (R), follows the X, L and M creation and it is presented at the end of the next section.
2.4 XRML matrix co-creation
2.4.1 Performance metrics (M)
As the performance metrics are defined as valuable assets for the different stakeholders, we started the workshops and meetings with the open question of what was desirable to save, maintain, or improve in the basin, given the context of living in a semi-arid coastal basin. Some of the performance measures that emerged from the workshops had a well-defined character in terms of their measurability and verifiability (yearly agriculture production, drinkable water costs, water availability, etc.). In other cases, these elements were more complex idealizations in which multiple indicators are aggregated and require narrow definitions to agree on their status (e.g., land use planning, agro-ecological systems, incentives to improve consumption habits, protection and support of rural communities, healthy ecosystems and general wellbeing, etc.). After analyzing the participatory activities, the performance metrics were divided into third categories (water availability, agronomy, drinking water) and a fourth cross-cutting category of socio-economic metrics.
The first category explains the behavior of the basin based on natural variables such as streamflow in rivers, groundwater levels and salinity in coastal extraction wells. Some of the metrics defined in this item are the mean annual streamflow value at the outlet of the Quilimarí river, the total groundwater storage in the aquifer of the basin and the mean salinity of the coastal basins. These kinds of metrics were of interest mostly by people linked to local environmental groups and residents in the coastal urban areas.
The agronomic category is composed of metrics related to the irrigation of the different crops in the basin, their water demands and annual production. The Unmet demand by crop was defined as the water needed by each crop minus the actual water supplied in a year and the annual production, as the amount of crops produced in a season, as it is directly linked to the direct revenues of farmers and agro-business companies.
The drinking water category shows the metrics associated with demand and supply of drinkable water of the different towns and localities. An important factor to maintain or improve was the per capita water supply. The initial value of 150 L per person per day proposed by the team was challenged as people in rural areas use some drinkable water for their domestic animals and livestock and needed an extra 50 L. The metric used to account for this desire of having a permanent supply of 200 L/d per person was transformed into the unmet demand metric, that arises when in a given period, the water supply falls short of demand, where its best value is zero. A metric linked to the concept of ‘permanent supply’, or its continuity, was the time that a community is having unmet demand, so the unmet demand time was also discussed and considered as a metric.
Finally, a cross-cutting category is the socio-economic, as some metrics related to agronomic and drinking water groups are part also of socio-economic variables. Related to the annual crop production are two important assets for farmers and farm owners: the value of agriculture production, calculated as the annual production times the market value of each crop and the agricultural employment or the labor needed to produce the crops, calculated as the production of each crop times a crop-employment rate. Finally, the drinking water supply costs, that are related to the water supplied by different sources and their unity costs were also discussed and set as a metric in this category.
Table 3 presents the list of every metric calculated, grouped in their respective categories described above.
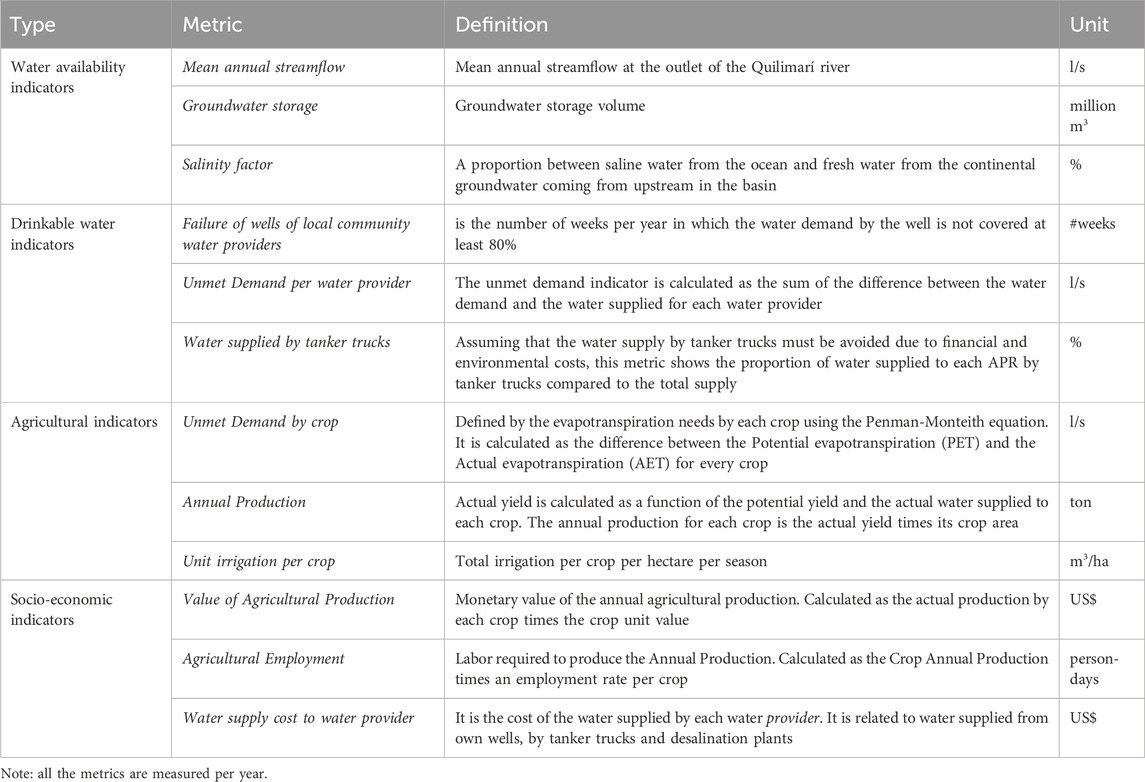
Table 3. Metrics discussed during the participatory process. The first concepts and ideas were discussed in the workshop while the final version and quantification of the metrics was defined in an expert panel using the input from the workshops.
2.4.2 Uncertainties (X)
After more than 10 years of Mega Drought, most participants in the workshops and interviews were well aware of the climatic conditions and their impacts on water availability for both agriculture and domestic use. Additionally, concerns were raised about the water demand for intensive irrigated agriculture and for formal and informal real state urbanization connected mostly to tourism flow in the summertime. Other kinds of uncertainties were related to updates to environmental regulations (e.g., Water Law No. 21435, which was enacted on 25 March 2022). Finally, issues like the costs of alternative sources of water such as desalination and drilling wells were also discussed, but the costs were decided to be presented as metrics.
In terms of the future of the climate, participants had a notion about climate change but in general were not aware of the technical terminology climate projections (GCM and RCPs) and the different possibilities that involved future climate scenarios. It was defined as an important source of uncertainty. The project team then selected five General Circulation Models (GCMs) based on their ability to adequately represent the climatic conditions in the basin. These GCMs are part of Phase 6 of the Coupled Model Inter-comparison Project (CMIP6), which is associated with the Sixth Assessment Report (AR6) of the Intergovernmental Panel on Climate Change (IPCC).
During the meetings, some participants suggested that agricultural land use could remain stable if climatic conditions improve following the drought. However, most anticipated a reduction in cultivated areas relative to current levels and regarded future expansion as highly unlikely. In response, the project team proposed two scenarios: one maintaining the current agricultural area, and another involving a linear reduction to 85% of the current land use over a 5-year period; a third and more extreme scenario was added after the workshops, involving a 50% reduction in the irrigated lands in order to try to avoid the use of desalination plants. The values associated with the decreases of agricultural areas were defined by a group of experts, considering plausible futures in the context of different conditions of water availability and the irrigation needs by crops.
In terms of population water demand, participants of the workshops raised concern about possible increases in domestic demand with an increasing population, immigration and tourism, among the water use culture from local population. Considering a relatively high level of awareness of water scarcity, the team finally considered two uncertain water demand scenarios related to population, where in the first scenario population growth remains similar to the historical trend, with a 2% annual growth rate. The second scenario assumes an important increment of the population growth to a 5% annual growth rate, related to higher rates of immigration and tourism, part of the concerns of part of the participants in the workshops.
2.4.3 Levers (L)
Considering the ideas proposed in the participatory workshops and in the framework of discussions with the technical counterparts of this project, a set of policy levers were evaluated. Some of the policy levers were part of the SPWRM, but others came directly from the meetings.
A policy lever mentioned in every workshop was the implementation of a desalination plant for drinking water. A desalination plant designed to supply 100 L per second continuously, primarily serving coastal communities, was proposed to be tested. The study team proposed also to test a larger desalination plant with an expanded distribution system, capable of producing up to 300 L per second to supply water to every water provider in the basin, at a higher investment cost. It is important to mention that the hydrological model assess water demand, but does not support the economic, social and environmental evaluation of potential impacts of large-scale desalination plants in the coastal cities in Chile, concerns that have been raised in previous studies (Campero et al., 2021; Fragkou and Budds, 2020; Odell, 2021; Vicuña et al., 2022).
The third policy lever defined was based on a legal instrument available in the Chilean Water Code (DFL1122, 2022), known as the Pro-Rata or proportional reallocation of water extraction rights, that the authority can apply during specific events. According to its article N°62, if available water is insufficient to meet all granted rights, the resource must be distributed proportionally among right holders, with each receiving a share corresponding to the proportion of their entitlement relative to the total recognized rights from the source. In this study, we proposed restricting all agricultural water rights to 70% of their nominal value if at least 30% of drinkable water extraction wells in an administrative hydrogeological sector, as defined by Chilean authorities, become dry. While the exact idea of using this legal instrument and the specific values was not discussed during the workshops, many participants expressed concerns about the continuous use of water for irrigating avocado and other fruit trees. They identified this practice as a key contributor to the drop in groundwater levels and suggested imposing limits on its usage. Importantly, this article has never been applied in Chile and would mean a regional restriction of water rights linked to irrigation to benefit the extraction of water for human consumption.
The fourth policy level selected was the construction of a new set of extraction wells, located approximately 5 km from the coastal zone, as some representatives from regional government as well as APR administrators wanted to know if it was possible to pump farther away from the coastal zone to avoid salinity problems. These new wells were intended to supply communities whose existing wells had become brackish in recent years. At the time of this study, no formal project for these wells existed, but the idea had been discussed by the community and local authorities. We set up this source for 100 L/s.
Some other discussions were held. An important one was about improvements in irrigation efficiency as a policy lever or in other words, replacing old infrastructure and irrigation technics by more efficient technology. However, this idea was ultimately discarded since most of the cultivated areas already use drip irrigation or similar advanced technologies, making this policy lever ineffective and costly.
2.4.4 Model (R) development
To quantify the metrics defined under the different uncertainties and evaluate the policy levers proposed, we used a computation tool that links a hydrological and allocation model with a hydrogeological model as the Relation item in the XRLM matrix. This tool was originally developed and calibrated for the SPWRM. It couples the WEAP and MODFLOW models: WEAP (Yates et al., 2005; Yates and Purkey, 2005) is a tool used for water resources planning, flexible planning system for assessing the sustainability of current water demand and supply patterns using rules of operation of water systems; MODFLOW (Harbaugh et al., 2000), a groundwater simulation model which allows estimation of fully distributed water head variations, as well as incorporating withdrawals, drains, and river-aquifer interaction. When linked, data and results generated flow between WEAP and MODFLOW at each time step: WEAP calculates recharge from the surface to the aquifer but also commands the groundwater demands simulating extraction wells; MODFLOW calculates the water head at every cell in the model, the water drained to the surface in lowlands and the water storage in the aquifer, among other (see Huber (2012) for information on the WEAP-MODFLOW link). Figure 2 shows the schematic view of the model.
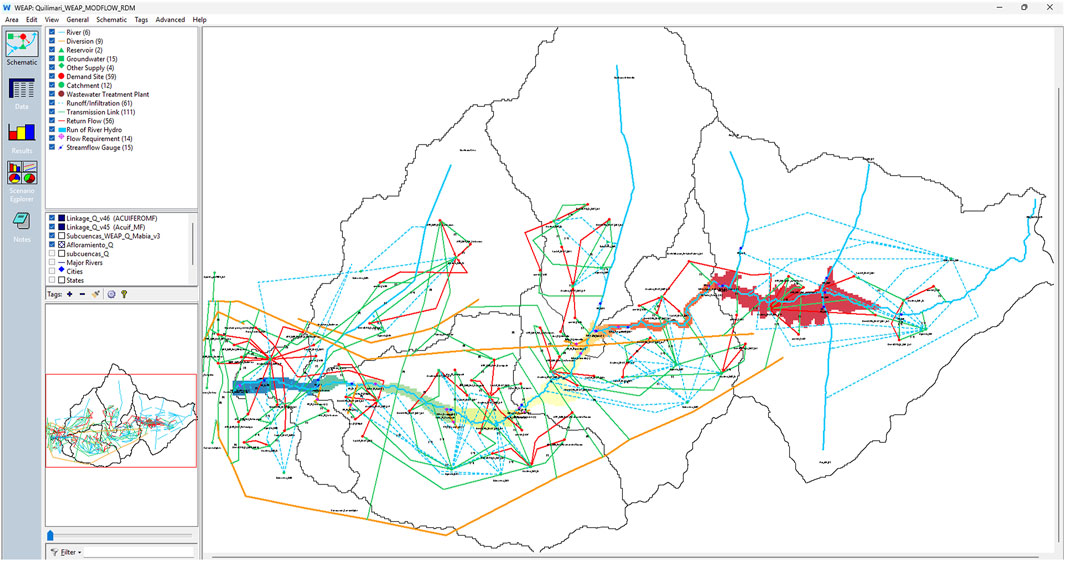
Figure 2. Schematic view of the coupled WEAP-MODFLOW model of the Quilimarí river basin. The WEAP elements are the dots and lines that connect the different hydrology nodes, the river and tributaries and the demand sites; the active cells from the MODFLOW model are colored following the central valley and the colors represent administrative hydrogeological sectors defined by the water authorities.
To achieve a more comprehensive representation of the system and to quantify the metrics defined in Table 1, we improved the WEAP-MODFLOW coupled model through four key modifications: (i) We updated the classification of historic agricultural land use with satellite imagery to determine annual time series of the maximum irrigable area; (ii) Utilizing the MABIA module (Chengot et al., 2024; Jabloun and Sahli, 2004; 2008; 2012), we incorporated detailed agronomic modelling of crops to capture daily water demands per crop, irrigation practices by different technologies and annual crop productivity estimates; (iii) Using the MODFLOW-SWI2 module, we represented the seawater intrusion process and located the salt-groundwater interface or boundary between fresh and brackish water and (iv) enhancements were implemented to simulate the water supply for human consumption and agriculture, which now encompasses various sources and their costs, including the predominant use of self-owned pumping wells, transportation of water via tanker trucks and/or desalination plants. The following paragraphs explain the main characteristics of the developed model.
2.4.4.1 Updated classification of historic agricultural land use
The use of indicators as the Normalized Vegetation Index (NDVI), has been shown effective in the monitoring of crops and in yield estimates (Huang et al., 2014), in calculations of gross primary productivity of grasslands (Zhou et al., 2014) and as an indicator of the temporal evolution of vegetation in general (Novillo et al., 2019). In this study, to determine productive zones within the modeling area, a threshold NDVI value was considered: a pixel was considered part of agricultural land use under irrigation when its NDVI value exceeded the threshold of 0.4 within the analyzed period, while lower values were considered as natural vegetation in poor or senescing conditions (Kourouma et al., 2021).
Mosaics of Landsat 5, 7 and 8 images from Google Earth Engine were used and images available were selected for the period from January 1 to February 15 to identify irrigated crop areas in spring-summer (austral) months. The analysis was carried out between 1997 and 2021. Finally, a review of the selected areas was carried out and polygons were added or removed by photointerpretation.
2.4.4.2 Detailed agronomic modelling of crops using the MABIA module
For the crop modelling, we used MABIA, a daily module inserted in WEAP, able to simulate the behavior of crops, irrigation schemes and agricultural yields. This method allows a simulation of the water balance of each unit at a daily time step, which allows a more detailed agronomical characterization. The MABIA algorithm also stands out for a detailed characterization of water use by agriculture, by considering improvements in the representation of water losses by vegetation cover, and also allows the implementation of irrigation regimes of various types (such as drip irrigation, micro-sprinkler, gravity furrow irrigation, among others) by defining parameters such as wet soil fraction, irrigation scheme (frequency and quantity) and irrigation system efficiency. See Jabloun and Sahli (2004), Jabloun and Sahli (2008) for more details on MABIA and Jabloun and Sahli (2012) for technical information on MABIA on WEAP.
Using this module, WEAP calculates key agricultural variables. Annual crop production is calculated using a relation between the potential yield of each crop and the amount of water supplied. The value of agricultural production and agricultural employment can be estimated using a linear relationship with production. For example, avocados, one of the main crops in the basin (and used hereafter as an example of the agriculture activity in the basin), have a potential yield of 10 tons per hectare, the labor requirement is 2.5 person-days per ton per year, and the annual revenue is estimated at 2,255 US$ per ton.
2.4.4.3 MODFLOW model and the incorporation of the SWI2 module
The groundwater extraction is represented in extraction nodes in WEAP linked to the MODFLOW active cells. Using WEAP, we set up over 250 extraction wells associated by their location on the legal registry. These nodes use information of each well, as the water right granted, well depth and surface elevation to calculate in each time step the extraction volume. The water head in the model is compared to the depth of each well every time step, using a parameter named pumping reduction threshold, to calculate the extraction reduction factor (see Figure 3A): when the water head is above the threshold, the extraction factor is 1; when the water head is below the threshold, the extraction factor decays linearly from 1 to 0 until the water head is equal to the well depth and no more water can be extracted, although the cell is not necessarily dry. This improvement of the model is relevant to simulate the problems of water extraction by shallow wells owned by most of the water providers in the basin.
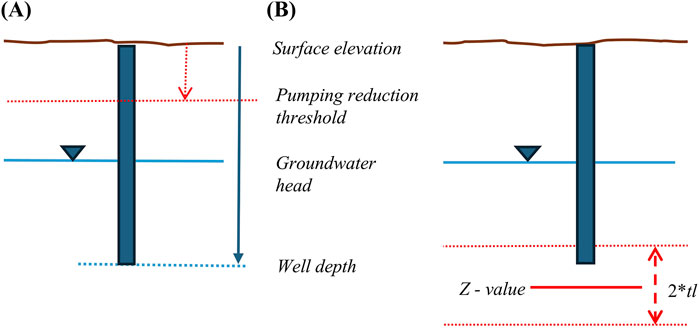
Figure 3. Schematic representation of a well in the WEAP-MODFLOW coupled model. (A) Shows the extraction reduction factor in terms of the groundwater head and its relation to the well depth and a parameter called pumping reduction threshold; (B) ‘Transition length’ (tl) parameter is used to calculate the Salinity factor as a function of the Z-value and the well depth.
Another improvement made in the model was the use of the Seawater Intrusion (SWI2) package for MODFLOW, to represent the seawater intrusion process as a WEAP result. SWI2 allows three-dimensional vertically integrated variable-density groundwater flow and seawater intrusion in coastal aquifer systems to be simulated using MODFLOW-NWT and is designed such that a single-density model may be converted to a seawater intrusion model (see Bakker et al. (2013) for technical information). In the cells with brine interaction, each time step the module calculates the Z-value, a simplified threshold that divides fresh from saline waters.
To use this module, we assume a smooth transition between brackish and fresh groundwater using a parameter called transition length (tl) to calculate a Salinity Factor (SF) (see Figure 3B). When the intake depth lies above Z-value + tl, the water extracted is considered fresh (SF = 0); when it is below Z-value - tl, it is fully saline and SF = 1. For intake depths between these two thresholds, the salinity factor (SF) is linearly calculated.
The salinity factor is calculated as follows:
The extracted volume for each well (represented as a cell in the MODFLOW model) is calculated by multiplying the granted water right by the extraction factor. For coastal wells, an additional term, (1−SF), is included. This setup accounts for the reduction in groundwater availability and its impact on the extracted volume, as well as the limiting factor caused by high salinity.
2.4.4.4 Modelling the water supply for human water demand and its related costs
In WEAP, demand sites for human consumption are defined based on the population of each village, town or city. In the model, we prioritize supplying demand nodes linked to human consumption over the agriculture elements. This change aligns with the modifications to the Chilean Water Code made in 2022, which established this requirement for water supply. These human consumption demand nodes are configured to return 70% of the supplied water as wastewater to the aquifers, as in this area there are no water treatment facilities and generally, houses have septic tanks that drain into the soil. This represents return flows from household activities, including showers, toilets, washing machines, and other domestic uses, although in this case, we did not simulate the water quality nor its environmental impact on the aquifers.
These demand nodes can be supplied from multiple sources, with priority given to wells operated by water providers, as this is the cheapest water source. If these wells fail (wells drying out or saline intrusion), nodes can be supplied from alternative sources, when available in specific modeling scenarios. Elements called Other Sources, were created to account for tanker trucks and desalination plants and connected to all demand sites associated with human water consumption. When water supply was insufficient to meet the total demand, allocation was distributed proportionally based on each node’s demand. This followed a hierarchical order, with wells as the primary source, followed by desalination plants when available, and finally tanker trucks as the last resort.
Although we do not have information about the amount of water delivered by tanker trucks, we assumed a maximum capacity of 50 L/s available from this source in the modeling. As noted in Section 2.4.3, the desalination plants simulated in this study were assigned source capacities of 100 and 300 L/s, while the new well was set at 100 L/s.
Operational costs are calculated at each time step as the volume of water supplied times a unit cost given by each source. The energy cost from a well is calculated as a function of the groundwater head, the well ground elevation, the extracted volume and the unit energy costs. Operational costs of desalination consider potabilization and a proper return of the brine to the sea using dilution, a common practice in the industry (Vicuña et al., 2022). These operational costs per source are presented in Table 4 and they also consider the transport of water to their demand sites. In term of investment costs, we assumed an investment cost of 19.0 and 41.5 million US$ for each of the desalination plants, according to values of 2,200 and 1,600 US$/m3/d of installed capacity for plants of similar size in Chile (Vicuña et al., 2022). The new well projected at 5 km from the coast was assumed to have 4 million US$ in investment costs and similar operational costs as from existing wells. Finally, the total operational supply cost is calculated annually and the present value of the investment plus the operational costs is determined using a 10% discount rate over the 25-year period of simulation, categorized by source.
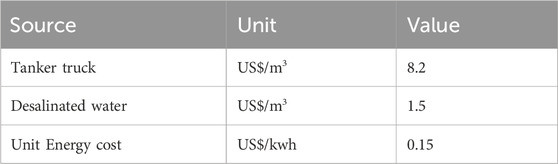
Table 4. Operational unit costs of three water sources used in the modelling: tanker trucks, desalinated water and the electricity unit cost used in the cost of the wells owned by the local community water providers.
No consideration of other environmental costs was done in this assessment, as CO2 emissions due to large energy consumption or salinity impacts in the seashore from the concentrated brine as a byproduct of the desalination plants. To make a fair comparison, tanker trucks impacts would also have to be included as they generate traffic problems, considerable CO2 emissions and other socio-environmental problems (e.g., traffic accidents, noise, dust, oil spills).
Despite these modifications, the model’s performance remained largely unchanged from the efficiency coefficient reported in the SPWRM (Dirección General de Aguas, 2020).
2.5 RDM experimental design and model set up
The experimental design describes the set of simulations run to perform the stress tests of this study. In particular, the experimental design employed in this study evaluates the performance metrics of the water system of the Quilimarí basin under a wide range of plausible futures, that include changes in precipitation and temperature conditions in the watersheds, agriculture land use and population. This experimental design allows the evaluation of the baseline vulnerability conditions of the system, as well as all the stipulated demand and climate change futures, and the effect that the different proposed actions have on the reduction of these vulnerability conditions.
We first defined a set of plausible futures for the current system that reflects the uncertainties described previously (uncertainty about water resource availability and uncertainty in water demand). This experimental design is constructed by combining each of the water demand scenarios with the hydroclimatic projections to obtain the combination of uncertainty scenarios. Then, for each of these projections, the performances of the system are evaluated under each policy lever to obtain the complete experimental design that varies the hydrology, the demands and the actions implemented.
A two steps process is applied to get the climate time series used in the model: a monthly statistical downscaling process followed by the conversion to daily values. The Unbiased Quantile Mapping (UQM) method (Chadwick et al., 2023) was applied using observed data from 21 meteorological stations located in or near the basin, based on a 20-year reference period, from 1995 to 2014. The UQM method is a technique that corrects biases present in the climate projections from GCMs at a monthly timescale to obtain more accurate estimates of various climatic variables at a finer spatial scale (Gudmundsson et al., 2012). The method calculates empirical quantiles from the observed data in the region of interest and compares them with the quantiles from the GCM projections. A linear or nonlinear function is then used to adjust the projected values so that the GCM’s quantiles align with the observed quantiles. In the second step, to convert from a monthly to a daily timescale, the k-nearest neighbors (k-NN) method (Gangopadhyay et al., 2005) is used. This method identifies the future series with the smallest Euclidean distance for each monthly time series and selects one series to perform the disaggregation, preserving both historical variability and the future signal from the GCM.
This methodology generates daily values of rainfall and min/max temperatures, the basic climatic input in the WEAP model. These time series were generated and used from 2025 to 2050, the time window used to compare the future with the 2000–2023 baseline period. Five GCM and two SSP were selected plus an eleventh climatic scenario that is a replica of the baseline climate (no change in temperature nor precipitation).
In this case, the model was run in a weekly time-step from the year 2000–2050 using the combination of levers and uncertainties to assess the impact of the levers over the metrics. Each result for the metrics was stored with an ID that identifies the simulation run linked to the climate projections, the land use scenario and the population growth scenario and the policy lever applied.
3 Results and discussion: exploration of vulnerabilities
With the XRLM matrix defined and the WEAP-MODFLOW coupled model improved, we engaged again with stakeholders to present the model’s current state and share preliminary results, including the historical simulation of the basin and potential impacts under future climate projections. Particular interest was given to the process of saline intrusion in coastal wells, its impacts on water quality, water supply and its associated costs.
Then we conducted the RDM experimental design using the model. The first section presents the results of the modeling for the last 4 decades (1985–2023), focusing on the exploration of vulnerability through observed variables such as climate, water rights, and irrigated area, as well as the modeled metrics. Next, we analyze the impact of climate projections on these metrics within the time window from 2025 to 2050. Finally, we examine the combined impacts of uncertainties and levers when running the full RDM experimental design across 330 scenarios.
3.1 Historical period: 1985–2023
In this section, we explore the historical transition of the basin from an initially unexploited state with a small population and primarily annual crops cultivated by the local population, to a more intensive use of water for orchard agriculture, such as avocados, citrus, and nuts. The model allowed us to quantify the different metrics during the historical period, defined from 1985 to 2023, considering the changes in population, crop types, irrigation area and the recent climatic trends.
Figure 4 illustrates the behavior of key variables and metrics over time, segmented into decades to aid visualization and analysis. We present the mean annual values of observed rainfall and key hydroclimatic model outputs, including mean annual streamflow at the basin outlet, groundwater storage, and the salinity factor of coastal wells. Additionally, we include data on the annual number of water rights granted by DGA and the crop area as recorded in agricultural censuses and for fruit crops registries (with segmented lines representing linear projections between recorded values). Below these indicators, we illustrate the modeled productivity of avocado crops and the associated employment metrics tied to avocado production. Lastly, we provide the trends of drinking water demand and supply. This includes the evolution of water supply, which is linearly linked to population growth, as well as the mean annual unmet demand. Closely related to this demand are the supply sources associated costs. Here, we highlight the proportion of water supplied by tanker trucks, supplementing the supply from local providers wells, and the corresponding annual supply costs.
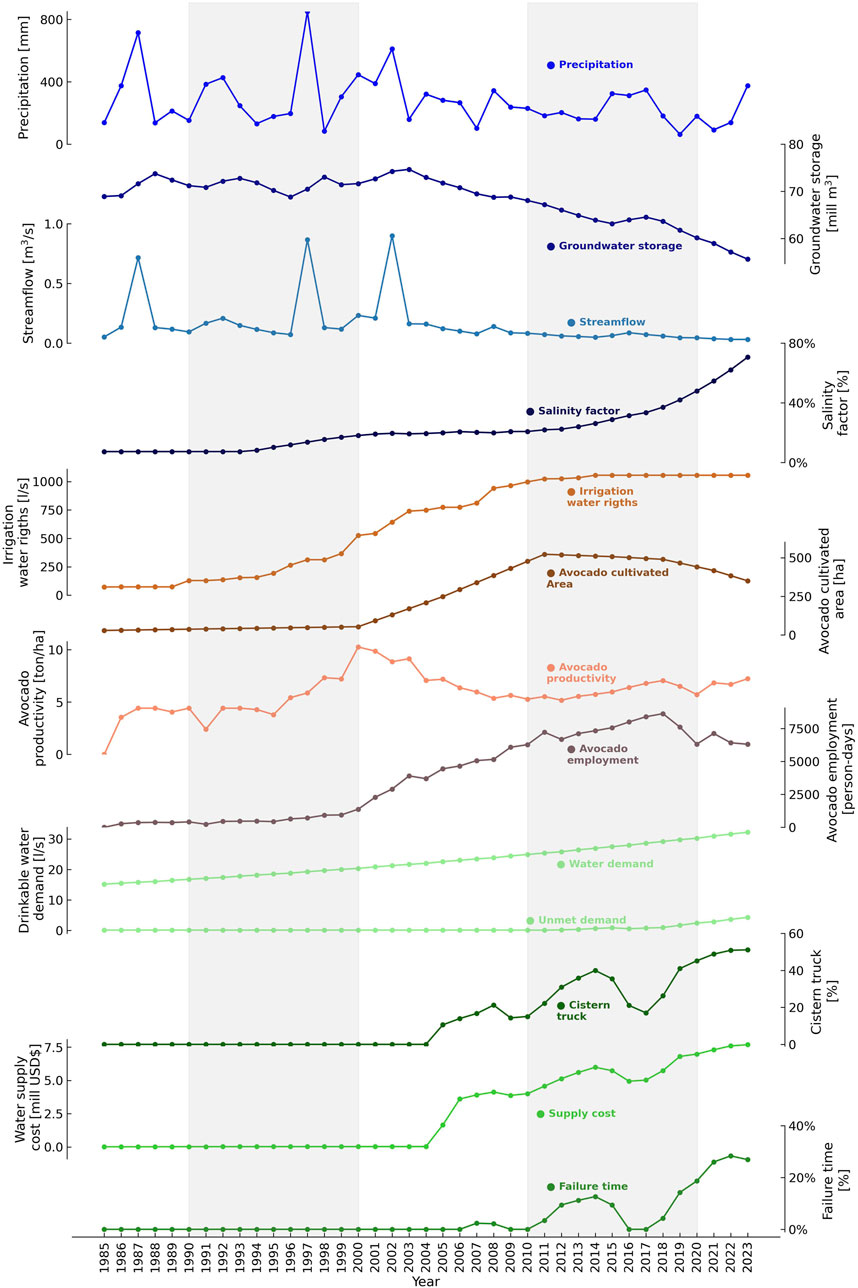
Figure 4. Metrics of vulnerability calculated for the Quilimarí river basin. Lines colors represent different families of metrics: blueish lines represent hydroclimatic variables; brownish lines represent agriculture related metrics; and greenish lines represent drinkable water metrics.
During the first 15 years of analysis, the basin exhibits the typical climatic and hydrologic variability of a semi-arid region, with wet and dry years, and extreme values of precipitation recorded at 850 mm (hydrologic year 1997) and 84 mm (hydrologic year 1998). The basin’s hydrologic response demonstrates greater variability of the outlet streamflow (ranging from 73 to 899 L/s of annual average streamflow) compared to groundwater storage, which remains relatively constant.
The salinity factor of most of the coastal wells also stays nearly constant and close to zero. This stability is likely due to the stable groundwater levels, indicating fair to good water quality in these wells. While water rights granted begin to increase, the agricultural area dedicated to fruit trees remains low to nonexistent. The apparent improvement in avocado productivity during this period is more attributable to incomplete historical data on avocado-cultivated land than to a sudden change in irrigation technology, that starts to happen during the 2000s. Meanwhile, the demand for drinkable water steadily increases, growing from 15 to 20 L/s as the population expands. During this period, there are no apparent issues with water supply.
During the 2000s decade, the cultivated land expanded significantly, driven by the steady increase in water rights approved. By the end of this decade, granted water rights totaled 964 L/s, supporting the irrigation of 430 ha of avocados, 230 ha of other orchards, and 550 ha of annual crops. While average rainfall declined slightly compared to the previous period, it remained within normal ranges. However, groundwater storage and mean annual streamflow began to show declines.
Agricultural expansion fueled economic growth in the region, with jobs in agriculture reaching 6,075 person-days and the sector’s value growing to $5.35 million US$ by 2009. However, the cost of water supplied by local community water providers soared due to the increasing reliance on tanker trucks, as some wells began to fail (dry up) or exhibit slight salinity.
The 2010–2019 decade reveals the impacts of the Mega-Drought and the expansion of water demand. Groundwater extractions peaked at 1,056 L/s, while river streamflow dwindled to nearly zero for most of the basin (see also Table 1). Water quality at the coast also deteriorated, with the Salinity factor rising to 40%, rendering some coastal wells undrinkable. Despite these challenges, employment in avocado production continued to increase, peaking at 8,600 person-days in 2018. However, the cultivated area reached its maximum in 2012 before starting to decline due to irrigation constraints. Productivity appeared to improve, but this was primarily a result of the reduced cultivated area.
Water supply became increasingly unreliable, with water providers ‘wells failing more frequently. In 2019, wells remained dry for approximately 14% of the year, increasing reliance on water delivery by tanker trucks at an estimated annual cost of US$6.6 million. This result aligned with cost estimates shared by local government representatives, as discussed during the workshops.
In the most recent years, from 2020 to date, precipitation has dropped further, averaging just 197 mm annually. Groundwater levels reached their lowest points, and rivers have been dried for years. Coastal wells turned brackish, forcing water providers to either invest in desalination technologies or shut them down entirely. Tanker trucks, though initially as an emergency and temporary response to crisis, could no longer meet all water demands, resulting in unmet demand for the first time. Annual water supply costs peaked at $7.5 million US$ during this period. Agricultural activity also suffered, with avocado cultivation shrinking to 350 ha and agricultural labor declining to 6,300 person-days. This last period underscores the basin’s increasing vulnerability to climatic and hydrological stress, with significant economic, social, and environmental consequences.
3.2 Exploration of uncertain future vulnerability
Figure 5 illustrates the relative changes in rainfall and absolute changes in temperature for each of the 10 GCM-scenario combinations (blue triangles represent SSP2-4.5, and red triangles represent SSP5-8.5) compared to the 2000–2023 period. Additionally, the figure highlights deviations in climate (shown as black squares) for specific historical periods referenced in the text, relative to the mean baseline climate. This result is in concordance with other studies that project future climate for central Chile with increases trends in temperatures and decreases in precipitation, although with high dispersion and especially towards the end of the century (Boisier et al., 2018; Demaria et al., 2013; Garreaud et al., 2021; Vicuña et al., 2021).
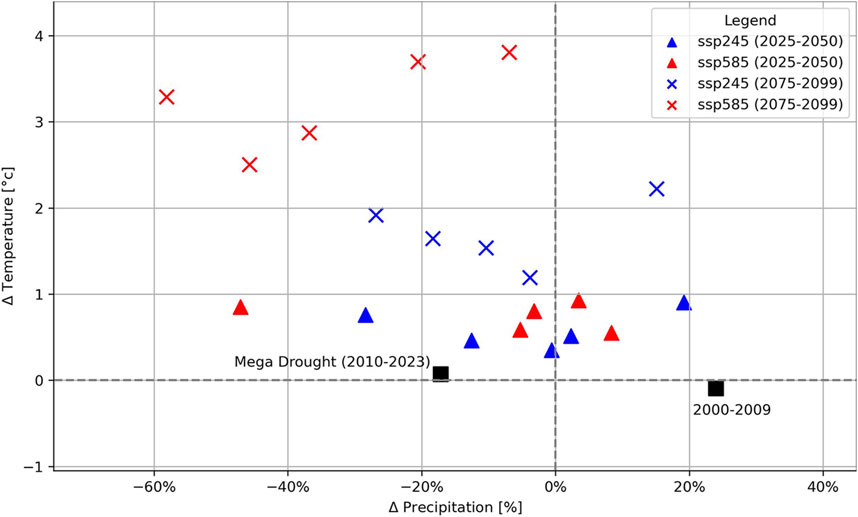
Figure 5. Climate change scenarios (by GCM and emission scenarios) for two time periods compared to baseline years (2000–2023). Included (in black squares) also are two historical periods: a wet (2000–2009) and a dry (2010–2023) period showing climate variability effects in the basin. The list of the GCM used is included in the Supplementary Material.
All GCM/SSP scenarios in the 2025–2050 years range indicate higher mean temperatures compared to the base period, with increases ranging from +0.35°C to +0.93°C. Regarding precipitation, six of the eleven scenarios fall within a range of ±10% compared to the base period. One scenario projected an increase of +19.2%, while three scenarios anticipated reductions of −13.9%, −28.4%, and −47.1% relative to the 2000–2023 period. Notably, the mean rainfall during the Mega-Drought aligns closely with the third worst precipitation scenario in the near future. Figure 5 also includes projections for a more distant future (2075–2099), illustrated with red and blue crosses representing the same GCM/SSP scenarios. For these projections, temperatures are expected to rise by more than 1°C in all cases, with mean increases of 1.7°C and 3.2°C for SSP2-4.5 and SSP5-8.5, respectively. In terms of precipitation, only one future scenario under SSP2-4.5 suggests an increase above the historical average (+15%). On average, however, projected precipitation changes are −9% for SSP2-4.5% and −34% for SSP5-8.5, indicating a more constrained future in terms of water availability.
We ran the model for each of the 10 future projections for the 2025–2050 period, as shown in Figure 5 and also an eleventh scenario replicating the historical period (no change in mean annual rainfall and temperatures), to compare the impacts on different metrics independently of changes in climate conditions. Figure 6 presents the mean values for this period plotted against changes in precipitation and temperature. Overall, the relationship is more evident with precipitation than temperature, with most metrics showing improvements as rainfall increases. Most metrics exhibit a roughly linear response to changes in precipitation, indicating the sensitivity of the basin’s metrics to this variable. The salinity factor is the only metric that remains consistently near 100%, an indication that under all future scenarios, coastal wells are expected to remain contaminated by saltwater.
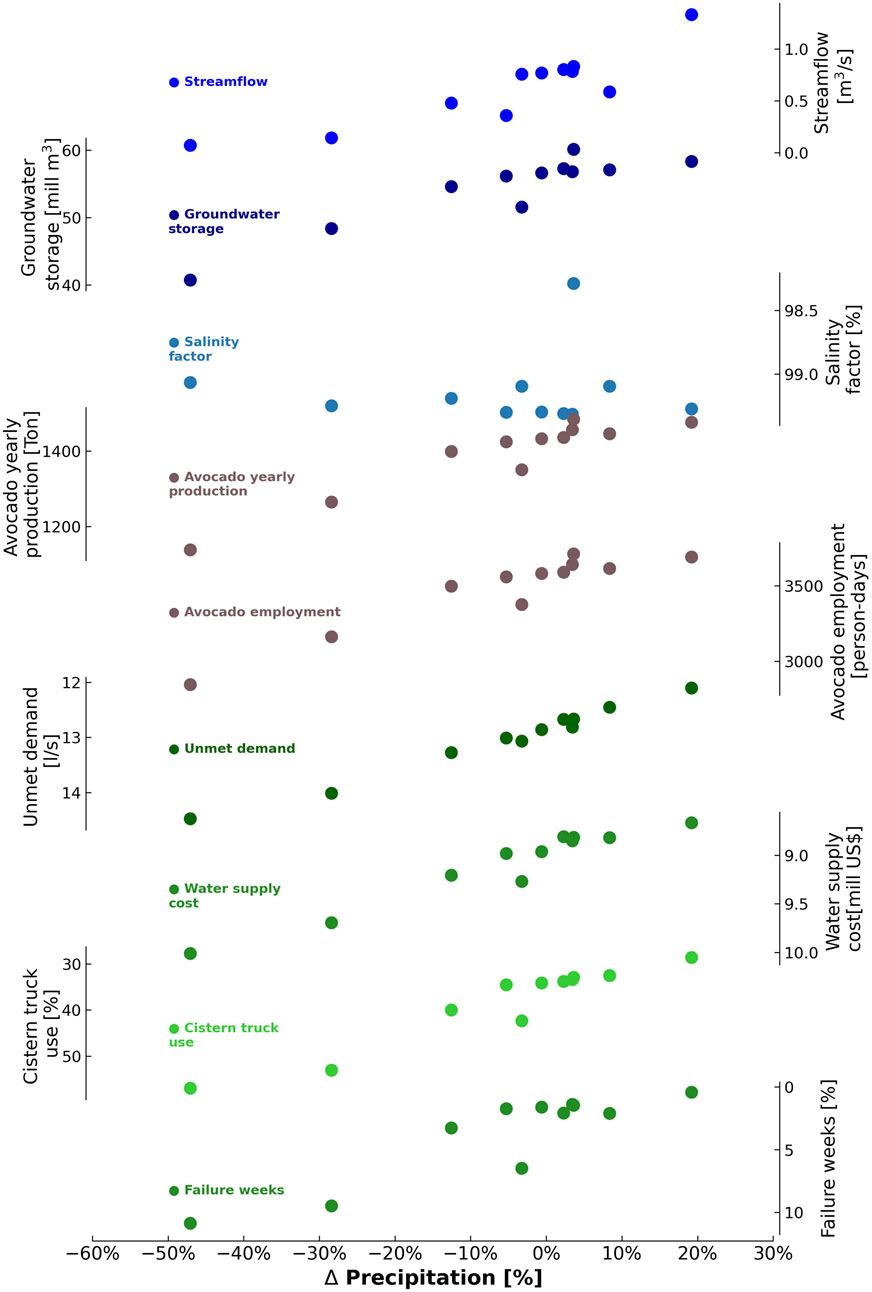
Figure 6. Impacts on metrics based on mean precipitation changes. For some variables, the Y-axis is inverted to visually represent that upward trends indicate improvement with respect to positive changes in precipitation.
3.3 Evaluation of the impact of levers on performance metrics
The next step involved running the model under the projected climate conditions but also incorporating the two additional uncertainties defined previously: the reduction in the agricultural crop areas and changes in the annual population growth rate. The modeling also included every policy lever presented in section 2.4.3. Here we present the results of the combination of 11 climatic projections, three agriculture land use alternatives, two population growth futures and five policy levers (including No Action), rendering 330 scenarios.
Figure 7 presents the results for five metrics using grouped boxplots by policy lever. These include two environmental metrics, salinity factor and groundwater storage; one drinking water metric, the mean annual unmet demand; and two socio-economic metrics, annual avocado-related employment and the total cost of drinking water supply. The first four plots display annual averages from 2025 to 2050, while the last shows investment costs combined with the present value of operational expenses. For each policy lever, results are disaggregated by demand-side uncertainties (population growth and irrigated area), while the spread of the boxplots reflects climate projection uncertainty. In some plots, the Y-axis is inverted so that higher values indicate better performance, consistent with the format used in Figure 6.
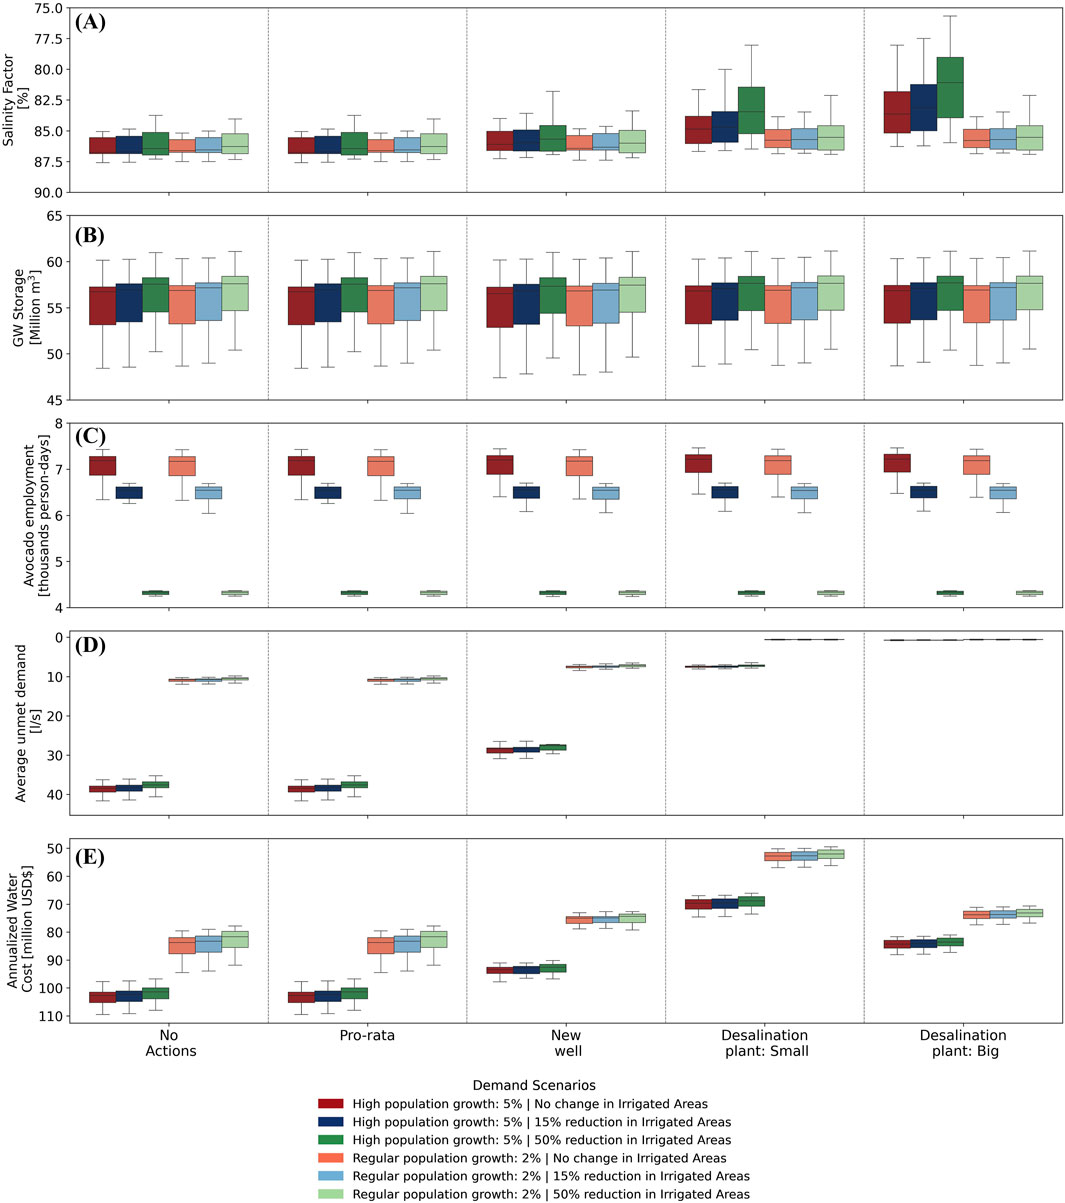
Figure 7. Effect of Uncertainties and Levers (including No action) on five Metrics: (A) the Salinity factor and (B) the Groundwater storage, representing both environmental and hydro-climatic type of metric, (C) Annual avocado employment, representing agriculture metric and two population drinking water metrics, (D) Unmet demand and (E) Supply cost. Metrics (C) and (E) are also related to the socio-economic group. The X-axis shows the different policy levers simulated.
Figure 7A illustrates the average salinity factor of wells from El Esfuerzo village, which suffered from salinization. Only the implementation of desalination plants leads to a slight improvement in water quality, and mostly under scenarios with reductions in rainfall. Contrary to expectations, the salinity factor improves under higher population growth, although this is due to WEAP’s configuration, as population-related water nodes return untreated wastewater to the aquifer. Since water quality is not modeled, MODFLOW interprets this return flow as fresh water, displacing brackish water. Although in the best-case scenario the average salinity factor improves from 85% to 74%, the overall projections suggest that without the implementation of desalination processes, the coastal wells will remain unsuitable for potable water supply due to the salinity of the extracted groundwater.
Figure 7B presents the groundwater storage in the aquifer. This metric shows low sensitivity to variations in population growth and reductions in irrigated areas, with increases up to 5% even when the agricultural surface is reduced by 50%. Groundwater storage remained largely unchanged across the different policy scenarios, suggesting limited responsiveness to management interventions. The metric is more sensitive to climate projections, with storage values ranging from 47.5 to 61.0 million m3.
Regarding avocado employment as an example of the agriculture activities in the basin, Figure 7C shows that the metric is not sensitive to population growth changes nor to any policy levers applied. However, it is predictably influenced by reductions in agricultural areas. When the agricultural area is reduced by 15%, the avocado-related employment decreased between 9.8% and 3.5% (from a median value of 7.19 thousand person-day), depending on the projected precipitation scenario. Conversely, when the irrigated area decreased by 50%, the employment decreased between 28.4% and 41.2%. Although the labor drops when the irrigated area is reduced, this reduction is a fraction of the area reduction, especially in the driest scenarios. Calculations not shown in the figure indicate that the avocado productivity (production and area ratio) increases between 12.0% and 40.9% in the driest scenarios and between 5.9% and 17.5% in the wettest, depending on the extent of irrigated area reduction. This outcome is explained by the MABIA modeling approach: when the irrigated area is reduced, the same amount of available water is distributed over a smaller surface, improving the productivity, hence the labor efficiency.
Figure 7D reveals that the unmet demand for human consumption metric shows minimal sensitivity to reductions of agricultural crop area, even with a decrease of 50% in irrigated areas. These counter-intuitive results are explained by the decline in groundwater levels across all future climate scenarios, making the existing shallow wells unable to meet the water demands of domestic supply nodes, indicating that the issue stems not from a lack of connection between intensive irrigated agriculture and water availability, but rather from the physical limitations of many wells imposed by groundwater depletion. On the other hand, this metric is highly sensitive to changes in population growth rates. For instance, in scenarios with higher population growth and no action taken, the average unmet demand is 38.9 L/s, almost four times higher than the 11.0 L/s observed in scenarios with no changes in population growth. The metric’s sensitivity also varies significantly depending on the policy levers applied. For example, activating the pro-rata lever has no impact on unmet demand. This is because pro-rata limits agricultural wells’ water rights to a maximum of 70% of their nominal value; however, in future scenarios, the agriculture wells’ extraction capacities are already diminished due to declining groundwater levels. In contrast, other policy levers, such as adding new wells or desalination plants, reduce unmet demand considerably. Regardless of the reduction in agricultural areas, in the scenarios with the coastal well (which does not suffer from saline contamination), the local water providers in the upper and intermediate zones present no unmet demand and it decreases the total unmet demand, showing improvements of 30% and 22% depending on population growth scenarios. The small desalination plant almost eliminates the unmet demand under a 2% population growth rate scenario, even in scenarios with adverse climate conditions, and for higher population growth rates, unmet demand is reduced to 7.5 L/s, an improvement of 80% compared to the no-action scenario. In scenarios with a large desalination plant, all unmet demand is practically eliminated across every scenario.
Figure 7E shows that the supply cost metric behaves similarly to the unmet demand metric. The results also indicate that supply costs are more sensitive to rapid population growth than to reductions in agricultural areas. Both desalination plants perform better than the other alternatives, however the smaller desalination plant shows more variable outcomes compared to the larger plant. When population growth follows historical trends (2% per year) and in the best climate scenario is used, the small plant has the lowest costs among all policy levers (50.1 million US$). When the population grows with a rate of 5% and the climate projection is the driest, the total costs of the small plant increase by nearly 50% to 74.9 million US$ and the unmet demand changes from 0.48 L/s to 12.4 L/s. This increase in total costs is explained by the greater use of tanker trucks, a cost avoided almost completely by using the larger desalination plant. In this worst climatic plus population scenario, the present value of the total supply cost from the Big Desalination plant is 18% higher than from the smaller plant, but the larger plant eliminates the unmet demand entirely. The pro-rata policy lever, on the other hand, shows very little improvement in unmet demand and leads to similar supply costs as the No Action policy lever. Adding new wells reduces both unmet demand and total supply costs in both population growth scenarios, but its effectiveness is lower compared to the desalination plant options.
The parallel plot in Figure 8 compares all 330 scenarios based on the same metrics. It provides the same information as Figure 7 but with no distinction between the three types of uncertainties. Each metric is displayed along the vertical axes, while the scenarios are depicted by a line intersecting the axes at their corresponding values. The different levers are coded by color, allowing for visual differentiation. This type of graph allows for the visualization of the distribution of each metric and composition of each policy lever’s performance.
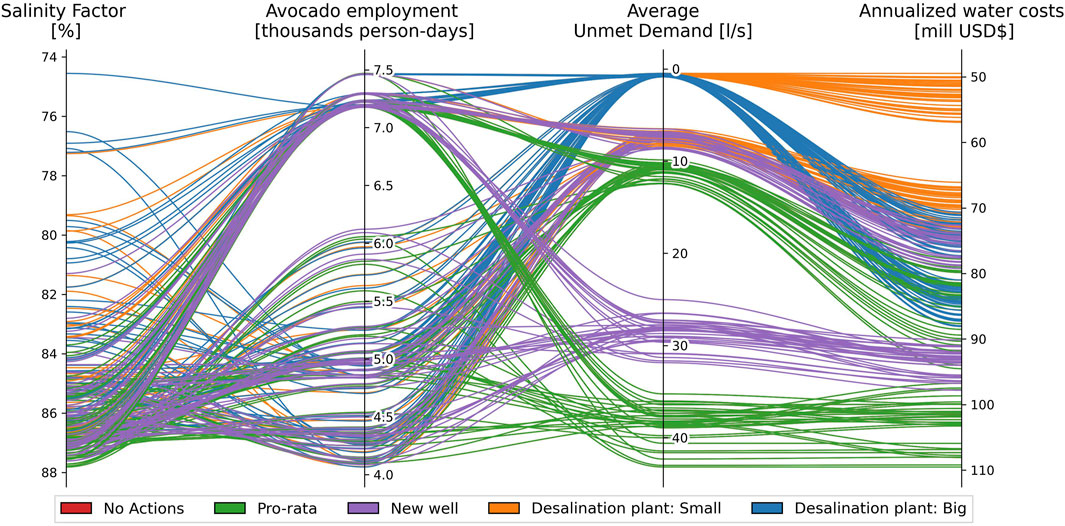
Figure 8. Parallel plot of four metrics results from the 330 scenarios. The colored lines represent the five levers used (including No Action).
For instance, the salinity factor is predominantly concentrated above 82%, with all policy levers having scenarios surpassing this threshold. This indicates that in most futures, the salinity of coastal wells will remain close to saline levels, regardless of the scenario. Avocado employment shows a dispersed distribution that is relatively even across all levers, explained mostly by the combined effect on the climatic and land use coverage uncertainties. However, the present value of the drinking water supply cost and unmet demand exhibit concentrations of values depending on the policy lever applied. In these cases, the desalination plants consistently yield the best scenarios. Among them, the larger desalination plant stands out for the lower metrics variability, making it a reliable option, even in scenarios with a reduction by half the irrigated lands. Although it represents a more costly alternative in half of the scenarios, primarily influenced by uncertainties in population growth, it delivers the best outcomes for unmet drinking water demand. The No Actions and Pro-rata levers mostly overlap, displaying the worst values among the options, being the least favorable alternatives for future planning. The New Well shows a slight improvement from some metrics, making it a preferable option only if challenges arise in constructing and operating desalination plants, or if delays in these projects necessitate using the new well as an emergency measure.
4 Conclusion
This study presents the exploration of vulnerabilities in the Quilimarí river basin based in a RDM approach. This basin serves as a representative case of coastal semi-arid basins vulnerable to climate change and other stressors. As in other similar basins, the Quilimarí river basin is undergoing significant changes, including more than a 30% reduction in rainfall comparing to the historical annual averages, agricultural land use has expanded, while water demand from households and tourism continues to rise. Salinity in coastal wells has increased, with critical incidents such as the complete failure of wells supplying coastal communities during the austral summer of 2023. Future climate projections indicate potential precipitation reductions of up to 40%, alongside further increases in water demand from households and tourism, as in other basins located in drylands. These trends highlight the critical need to incorporate stakeholder participation in defining the structure of hydrological models and prioritizing key research questions.
Engagement instances based on the RDM framework allowed stakeholders to discuss the uncertainties of a future world, the metrics to quantify their vulnerabilities and the actions that could improve the condition of the basin and, that give robustness to the decision-making analysis. The XLRM matrix was co-constructed with stakeholders of different interest groups: farmers, water providers, government agencies professionals and environmental groups in several workshops during the years 2022 and 2023, held in different locations of the Quilimarí basin. These meetings allowed the research team to better understand adaptation actions under consideration in both the agriculture and water sector, refine the model accordingly and present preliminary results of the simulations. The final elaboration of the matrix was done by the team experts to translate the ideas and discussions into quantifiable metrics. Stakeholders identified agriculture and drinking water as the primary drivers of water scarcity, while emphasizing the need for adaptation strategies at regional and national levels.
Three main groups of metrics were defined in these participatory workshops. Hydro-climatological metrics focus on the physical environment, including streamflow, groundwater storage and a salinity factor developed to estimate saline contamination. Agricultural metrics encompassed irrigation needs and the annual crop production within the basin, while the drinking water metrics addressed the supply and demand of water across communities. A fourth group, socio-economic metrics, was also included and considered a cross-cutting group as these metrics overlap with the other groups by incorporating factors such as the cost of supplying drinking water and employment associated with avocado production. These metrics were well-received by participants, as they reflected diverse dimensions of water security relevant to the concerns of each stakeholder group.
Regarding the Relation item, an existing WEAP-MODFLOW model was improved to quantify the metrics: an update of the agricultural land use area using satellite imagines; the use of the MABIA module to calculate crop production and the impacts on agricultural employment; the incorporation of a detailed schematic of the water supply from different sources as tanker trucks, desalination plants and new wells; and lastly, the incorporation of the SWI2 module for groundwater saline intrusion modelling within MODFLOW, to estimate the position of the groundwater salty wedge and the salinity in wells associated to coastal communities. It is important to note that the coupled model may not fully capture some hydrological and management processes: the aggregation of agricultural areas into demand nodes, the influence of MODFLOW parameters and configuration on groundwater storage and extraction, and the simplified representation of policy levers, among other simplifications, can all affect the accuracy of the quantified metrics. Although despite the inherent limitations in modeling the complexity of surface–groundwater interactions, the modifications implemented in the model enabled to capture the recent historic trend of the basin under drier climatic conditions, including the decline in water availability for both agriculture and human consumption, issues discussed with stakeholders during the workshops. The results of 330 modeled scenarios, which combined 11 projections of climate, three land use change and two population growth scenarios, offer insights into future vulnerabilities in the basin. The Bussiness as Usual simulations (or No Action) present the higher reliance on tanker trucks, triggered by wells failure, led to significantly higher supply costs and unmet demand. Pro-rata policy did not reduce unmet human water demand, as most of agriculture wells were already with extraction restrictions due to low groundwater levels. The evaluation of other alternatives of the Pro-rata policy variants remains an open direction for further research in basins with similar problems.
Both desalination plants emerged as robust options, consistently meeting water demand and reducing supply costs across a wide range of future scenarios as they generally achieved the best performance metrics with low variability. A trade-off analysis between the two robust policy levers shows that under high population growth, the smaller desalination plant results in some unmet demand and slightly lower, yet comparable, supply costs relative to the larger plant. Under regular population growth, however, the smaller plant performs better across most metrics as the larger plant offers greater stability in terms of reliability and variance, it does so at a higher cost. It is important to note that this study does not include a social or environmental assessment of the potential impacts of desalination plants, focusing solely on their evaluation within the RDM framework.
Although the improvements in water for human consumption, the agricultural sector showed no notable changes when the different policy levers were applied. But in the extreme scenario where 50% of agriculture was reduced, the productivity per hectare tended to increase, specifically in the drier scenarios. Additional actions aimed at enhancing agricultural productivity and its socio-economic dimensions not covered in this study should be tested in further studies.
Another relevant result was that most of the coastal wells were found to be nearly as saline as seawater, rendering them unsuitable for drinking purposes, in all the scenarios simulated. This shows the importance of modelling groundwater coupled with surface waters and allocations processes for similar basins in semi-arid regions. As in the Quilimarí basin and other areas of central Chile, an important problem is not necessarily the water availability or water rights, but rather the limited access to deep groundwater, either due to reliance on shallow wells or the proximity to the coastal salinity wedge, which affects several wells in the basin.
Future research on RDM processes in coastal semi-arid basins should incorporate additional environmental variables and modeling approaches. In particular, two key coastal ecosystems, wetlands and fog-dependent vegetation, can be assessed for their roles in the local hydrological cycle. On one hand, protected wetlands nearby Quilimarí basin have been impacted by reduced freshwater inflows and marine overtopping, leading to ecological changes (Soto-Rivas et al., 2024). On the other, in some steep coastal regions in arid regions present low cloud formation that enables fog interception by vegetation, which can enhance local water availability or sustain unique ecosystems. Although fog has been recognized as a critical water source in arid and semi-arid zones of northern and central Chile (Barbosa et al., 2010; Gutiérrez et al., 2008; Lobos-Roco et al., 2024). However, for both wetlands and fog interception, their eco-hydrological mechanisms and implications for water management in RDM-similar process remain less studied.
Another area for improvement is the use of faster simulation tools. Simplified surrogate models, capable of running thousands of simulations efficiently, could incorporate key processes such as saline intrusion, groundwater extraction limits, and surface–groundwater interactions. For example, Fletcher et al. (2019) trained an artificial neural network on MODFLOW outputs, enabling 1,000 simulations to assess development plans under groundwater uncertainty. Such approaches offer computational efficiency and the ability to approximate complex models, supporting rapid scenario analysis, a broader range of uncertain estimates that would further enhance the depth of the analysis for robust planning in arid and semi-arid basins, representing a key area for future improvement.
Finally, the RDM framework presented in this study could be instrumental in supporting decision-making processes. For example, Chile’s Climate Change Framework Law mandates the revision of Water Management Plans periodically for the country’s basins, including several coastal basins in the semi-arid region of the country.
Author contributions
DP: Conceptualization, Data curation, Formal Analysis, Investigation, Methodology, Resources, Software, Validation, Visualization, Writing – original draft, Writing – review and editing. SV: Conceptualization, Data curation, Formal Analysis, Funding acquisition, Investigation, Methodology, Project administration, Resources, Supervision, Writing – original draft, Writing – review and editing. SA: Conceptualization, Methodology, Software, Writing – original draft. EM-P: Conceptualization, Methodology, Writing – review and editing. HC: Software, Writing – review and editing. OM: Conceptualization, Investigation, Methodology, Writing – review and editing, Formal Analysis. AO-M: Formal Analysis, Methodology, Writing – original draft, Writing – review and editing, Conceptualization. KT: Investigation, Methodology, Software, Writing – review and editing. FS: Conceptualization, Methodology, Writing – review and editing. JH: Data curation, Investigation, Methodology, Writing – review and editing. FM: Conceptualization, Supervision, Writing – review and editing, Formal Analysis, Methodology. KD: Data curation, Investigation, Methodology, Writing – review and editing. DG: Data curation, Methodology, Software, Writing – review and editing. SL: Writing – review and editing. MW: Writing – review and editing. AG: Writing – review and editing. GA: Investigation, Writing – review and editing. DM-M: Data curation, Formal Analysis, Writing – review and editing.
Funding
The author(s) declare that financial support was received for the research and/or publication of this article. FONDECYT 1211846: Exploration of robust water security pathways in a semi-arid coastal basin: A transdisciplinary perspective. ATE220055: Semi-arid coastal basins as indicators of climate crisis adaptation (SACBAD).
Acknowledgments
We extend our gratitude to all individuals and institutions that participated in the workshops. Special thanks go to the General Water Directorate (DGA, by its Spanish acronym), the Chilean water management agency, for sharing their valuable insights on the model and dedicating their time to the development of this study. We’d like to thank Rodolfo Gómez for his valuable help on the design of some of the figures of this document.
Conflict of interest
The authors declare that the research was conducted in the absence of any commercial or financial relationships that could be construed as a potential conflict of interest.
The handling editor GC is currently organizing a Research Topic with the author AO-M.
Generative AI statement
The author(s) declare that Generative AI was used in the creation of this manuscript. ChatGPT for writing preparation. All the generated text was based on our original writing and was used to enhance clarity and readability. We carefully reviewed it to ensure that the meaning and coherence were maintained.
Publisher’s note
All claims expressed in this article are solely those of the authors and do not necessarily represent those of their affiliated organizations, or those of the publisher, the editors and the reviewers. Any product that may be evaluated in this article, or claim that may be made by its manufacturer, is not guaranteed or endorsed by the publisher.
Supplementary material
The Supplementary Material for this article can be found online at: https://www.frontiersin.org/articles/10.3389/fenvs.2025.1553675/full#supplementary-material
References
Arabadzhyan, A., Figini, P., García, C., González, M. M., Lam-González, Y. E., and León, C. J. (2021). Climate change, coastal tourism, and impact Chains–A literature review. Curr. Issues Tour. 24 (16), 2233–2268. doi:10.1080/13683500.2020.1825351
Bakker, M., Schaars, F., Hughes, J. D., Langevin, C. D., and Dausman, A. M. (2013). “Documentation of the seawater intrusion (SWI2) package for MODFLOW,” in Techniques and methods. doi:10.3133/tm6A46
Barbosa, O., Marquet, P. A., Bacigalupe, L. D., Christie, D. A., del-Val, E., Gutierrez, A. G., et al. (2010). Interactions among patch area, forest structure and water fluxes in a fog-inundated forest ecosystem in semi-arid Chile. Funct. Ecol. 24 (4), 909–917. doi:10.1111/j.1365-2435.2010.01697.x
Barría, P., Chadwick, C., Ocampo-Melgar, A., Galleguillos, M., Garreaud, R., Díaz-Vasconcellos, R., et al. (2021). Water management or megadrought: what caused the Chilean aculeo Lake drying? Reg. Environ. Change. doi:10.1007/s10113-021-01750-w/
Blair, P., and Buytaert, W. (2016). Socio-hydrological modelling: a review asking why, what and how? Hydrology Earth Syst. Sci. 20 (1), 443–478. doi:10.5194/hess-20-443-2016
Boisier, J. P., Alvarez-Garreton, C., Cordero, R. R., Damiani, A., Gallardo, L., Garreaud, R. D., et al. (2018). Anthropogenic drying in central-southern Chile evidenced by long-term observations and climate model simulations. Elementa 6. doi:10.1525/elementa.328
Boisier, J. P., Rondanelli, R., Garreaud, R., and Muñoz, F. (2016). Anthropogenic and natural contributions to the southeast Pacific precipitation decline and recent megadrought in central Chile. Geophys. Res. Lett. 43 (1), 413–421. doi:10.1002/2015GL067265
Butler, A. H., Deser, C., and Polvani, L. M. (2014). Separating the stratospheric and tropospheric pathways of El niño–southern oscillation teleconnections. Environ. Res. Lett. 9, 024014. doi:10.1088/1748-9326/9/2/024014
Campero, C., Harris, L. M., and Kunz, N. C. (2021). De-politicising seawater desalination: environmental impact assessments in the atacama mining region, Chile. Environ. Sci. Policy 120, 187–194. doi:10.1016/j.envsci.2021.03.004
Chadwick, C., Gironás, J., González-Leiva, F., and Aedo, S. (2023). Bias adjustment to preserve changes in variability: the unbiased mapping of GCM changes. Hydrological Sci. J. 68 (8), 1184–1201. doi:10.1080/02626667.2023.2201450
Chengot, R., Zylberman, R., Momblanch, A., Salazar, O. V., Hess, T., Knox, J. W., et al. (2024). Evaluating the impacts of agricultural development and climate change on the water-energy nexus in Santa elena (ecuador). Environ. Sci. Policy 152, 103656. doi:10.1016/j.envsci.2023.103656
Dalin, C., Wada, Y., Kastner, T., and Puma, M. J. (2017). Groundwater depletion embedded in international food trade. Nature 543 (7647), 700–704. doi:10.1038/nature21403
Demaria, E. M. C., Maurer, E. P., Thrasher, B., Vicuña, S., and Meza, F. J. (2013). Climate change impacts on an alpine watershed in Chile: do new model projections change the story? J. Hydrology 502, 128–138. doi:10.1016/j.jhydrol.2013.08.027
DFL1122 (2022). Código de Aguas. Available online at: https://www.bcn.cl/leychile/navegar?idNorma=5605.
Dirección General de Aguas (2020). Plan estratégico de gestión hídrica en las cuencas Ligua Petorca y Quilimarí. Available online at: https://snia.mop.gob.cl/repositoriodga/handle/20.500.13000/125659.
Donatti, C. I., Harvey, C. A., Hole, D., Panfil, S. N., and Schurman, H. (2020). Indicators to measure the climate change adaptation outcomes of ecosystem-based adaptation. Clim. Change 158 (3–4), 413–433. doi:10.1007/S10584-019-02565-9
Earll, M. M., Henson, W. R., Lockwood, B., and Boyce, S. E. (2024). Evaluating seawater intrusion forecast uncertainty under climate change in the pajaro valley, California. J. Hydrology 636, 131226. doi:10.1016/j.jhydrol.2024.131226
Fletcher, S., Strzepek, K., Alsaati, A., and De Weck, O. (2019). Learning and flexibility for water supply infrastructure planning under groundwater resource uncertainty. Environ. Res. Lett. 14 (11), 114022. doi:10.1088/1748-9326/ab4664
Fragkou, M. C., and Budds, J. (2020). Desalination and the disarticulation of water resources: stabilising the neoliberal model in Chile. Trans. Inst. Br. Geogr. 45 (2), 448–463. doi:10.1111/tran.12351
Gangopadhyay, S., Clark, M., and Rajagopalan, B. (2005). Statistical downscaling using K -nearest neighbors. Water Resour. Res. 41 (2). doi:10.1029/2004WR003444
Garcia, C., and Servera, J. (2003). Impacts of tourism development on water demand and beach degradation on the island of mallorca (spain). Geogr. Ann. 85, 287–300. doi:10.1111/j.0435-3676.2003.00206.x
Garreaud, R. D., Boisier, J. P., Rondanelli, R., Montecinos, A., Sepúlveda, H. H., and Veloso-Aguila, D. (2020). The central Chile mega drought (2010–2018): a climate dynamics perspective. Int. J. Climatol. 40 (1), 421–439. doi:10.1002/joc.6219
Garreaud, R. D., Boisier, J. P., Rondanelli, R., Montecinos, A., Sepúlveda, H. H., and Veloso-Aguila, D. (2021). “Climate and weather in Chile,” in Water resources of Chile. doi:10.1007/978-3-030-56901-3_2
Groves, D. G., and Lempert, R. J. (2007). A new analytic method for finding policy-relevant scenarios. Glob. Environ. Change 17 (1), 73–85. doi:10.1016/j.gloenvcha.2006.11.006
Gudmundsson, L., Bremnes, J. B., Haugen, J. E., and Engen-Skaugen, T. (2012). Technical note: downscaling RCM precipitation to the station scale using statistical transformations – a comparison of methods. Hydrol. Earth Syst. Sci. 16, 3383–3390. doi:10.5194/hess-16-3383-2012
Gutiérrez, Á. G., Barbosa, O., Christie, D. A., Del-Val, E. K., Ewing, H. A., Jones, C. G., et al. (2008). Regeneration patterns and persistence of the fog-dependent fray jorge forest in semiarid Chile during the past two centuries. Glob. Change Biol., 14(1), 161–176. doi:10.1111/j.1365-2486.2007.01482.x
Haasnoot, M., Schellekens, J., Beersma, J. J., Middelkoop, H., and J Kwadijk, J. C. (2015). Transient scenarios for robust climate change adaptation illustrated for water management in the Netherlands. Environ. Res. Lett. 10, 105008. doi:10.1088/1748-9326/10/10/105008
Haasnoot, M., Warren, A., and Kwakkel, J. H. (2019). “Dynamic adaptive policy pathways (DAPP),” in Decision making under deep uncertainty: from theory to practice (Springer International Publishing), 71–92. doi:10.1007/978-3-030-05252-2_4
Hall, J. W., Lempert, R. J., Keller, K., Hackbarth, A., Mijere, C., and Mcinerney, D. J. (2012). Robust climate policies under uncertainty: a comparison of robust decision making and info-gap methods. Risk Anal. 32 (10), 1657–1672. doi:10.1111/j.1539-6924.2012.01802.x
Harbaugh, A. W., Banta, E. R., Hill, M. C., and Mcdonald, M. G. (2000). “MODFLOW-2000, the U.S. geological survey modular ground-water model user guide to modularization concepts and the ground-water flow process,” in Geological survey. CO 4 McDonald morrissey associates. Available online at: http://water.usgs.gov/software/ground_water.html/.
Hidalgo, R., Camus, P., Paulsen, A., Olea, J., and Alvarado, V. (2016). “Extractivismo inmobiliario, expoliación de losbienes comunes y esquilmación del medio natural.El borde costero en la macrozona central de Chile enlas postrimerías del neoliberalismo,” in Die Welt verstehen – eine geographische Herausforderung (Innsbruck, Austria: Innsbrucker Studienkreis für Geographie), 473.
Huang, J., Wang, H., Dai, Q., and Han, D. (2014). Analysis of NDVI data for crop identification and yield estimation. IEEE J. Sel. Top. Appl. Earth Observations Remote Sens. 7 (11), 4374–4384. doi:10.1109/JSTARS.2014.2334332
Huang, J., Yu, H., Dai, A., Wei, Y., and Kang, L. (2017). Drylands face potential threat under 2 °C global warming target. Nat. Clim. Change 7 (6), 417–422. doi:10.1038/nclimate3275
Huber, M. (2012). Management, protection and sustainable use of groundwater and soil resources in the Arab region WEAP-MODFLOW tutorial. Available online at: http://www.bgr.bund.de/IWRM-DSS.
IPCC (2023). “Annex I: glossary,” in Climate change 2023: synthesis report. Contribution of working groups I, II and III to the sixth assessment report of the intergovernmental panel on climate change core writing team. doi:10.59327/IPCC/AR6-9789291691647
IP CC (2022). in Climate change 2022: impacts, adaptation, and vulnerability. Contribution of working group II to the sixth assessment report of the intergovernmental panel on climate change. Editors H.-O. Pörtner, D. C. Roberts, M. Tignor, E. S. Poloczanska, K. Mintenbeck, and A. Alegría (Cambridge University Press). doi:10.1017/9781009325844
Jabloun, M., and Sahli, A. (2004). “MABIA-ETo’ Un logiciel pour l’estimation de l’évapotranspiration de référence,” in 11ème Journées Scientifiques Sur Les Résultats de La Recherche Agronomique.
Jabloun, M., and Sahli, A. (2008). Evaluation of FAO-56 methodology for estimating reference evapotranspiration using limited climatic data: application to Tunisia. Agric. Water Manag. 95 (6), 707–715. doi:10.1016/J.AGWAT.2008.01.009
Jabloun, M., and Sahli, A. (2012). WEAP-MABIA tutorial, A collection of stand-alone chapters to aid in learning the WEAP-MABIA module. Available online at: https://www.bgr.bund.de/EN/Themen/Wasser/Projekte/abgeschlossen/TZ/Acsad_dss/tutorial_weap-mabia.pdf?__blob=publicationFile&v=2.
Kourouma, J. M., Eze, E., Negash, E., Phiri, D., Vinya, R., Girma, A., et al. (2021). Assessing the spatio-temporal variability of NDVI and VCI as indices of crops productivity in Ethiopia: a remote sensing approach. Geomatics, Nat. Hazards Risk 12 (1), 2880–2903. doi:10.1080/19475705.2021.1976849
Kundzewicz, Z. W., and Gerten, D. (2015). Grand challenges related to the assessment of climate change impacts on freshwater resources. J. Hydrol. Eng. 4014011 (10), 1–10. doi:10.1061/(ASCE)HE.1943-5584.0001012
Kundzewicz, Z. W., Krysanova, V., Benestad, R. E., Piniewski, M., and Otto, I. M. (2018). Uncertainty in climate change impacts on water resources. Environ. Sci. Policy 79, 1–8. doi:10.1016/j.envsci.2017.10.008
Kwakkel, J. H., Eker, S., and Pruyt, E. (2016). “How robust is a robust policy? Comparing alternative robustness metrics for robust decision-making,”. Robustness analysis in decision aiding, optimization, and analytics. Editors M. Doumpos, C. Zopounidis, and E. Grigoroudis (Springer International Publishing), 241, 221–237. doi:10.1007/978-3-319-33121-8_10
Kwakkel, J. H., Haasnoot, M., Walker, W. E., Lourenço, C., Rovisco, A., Dessai, S., et al. (2015). Developing dynamic adaptive policy pathways: a computer-assisted approach for developing adaptive strategies for a deeply uncertain world. Clim. Change 132, 373–386. doi:10.1007/s10584-014-1210-4
Lempert, R. J., and Collins, M. T. (2007). Managing the risk of uncertain threshold responses: comparison of robust, optimum, and precautionary approaches. Risk Anal. 27 (4), 1009–1026. doi:10.1111/j.1539-6924.2007.00940.x
Lempert, R. J., Lawrence, J., Kopp, R. E., Haasnoot, M., Reisinger, A., Grubb, M., et al. (2024). The use of decision making under deep uncertainty in the IPCC. Front. Clim. 6. doi:10.3389/fclim.2024.1380054
Lempert, R. J., Popper, S. W., and Bankes, S. C. (2003). Shaping the next one hundred years: new methods for quantitative, long-term policy analysis. Santa Clara, United States: RAND.
Lobos-Roco, F., Suárez, F., Aguirre-Correa, F., Keim, K., Aguirre, I., Vargas, C., et al. (2024). Understanding inland fog and dew dynamics for assessing potential non-rainfall water use in the atacama. J. Arid Environ. 221, 105125. doi:10.1016/j.jaridenv.2024.105125
Marchau, V. A. W. J., Walker, W. E., Bloemen, P. J. T. M., and Popper Editors, S. W. (2019). Decision making under deep uncertainty (1st ed). Springer. doi:10.1007/978-3-030-05252-2
Mendoza, G. F.Unesco., International Center for Integrated Water Resources Management, and International Hydrological Programme. (2018). Climate risk informed decision analysis (CRIDA): collaborative water resources planning for an uncertain future.
Meza, F. J., Oertel, M., Meza, F. J., Vicuña, S., Gironás, J., and Poblete, D. (2015). Water – food – energy nexus in Chile: the challenges due to global change in different regional contexts. Water Int., 8060. doi:10.1080/02508060.2015.1087797
Mirzabaev, A., Stringer, L. C., Benjaminsen, T. A., Gonzalez, P., Harris, R., Jafari, M., et al. (2022). “Cross-chapter paper 3: deserts, semiarid areas and desertification,” in Climate change 2022: impacts, adaptation and vulnerability. Contribution of working group II to the sixth assessment report of the intergovernmental panel on climate change. Editors H. O. Pörtner, D. C. Roberts, M. Tignor, E. S. Poloczanska, K. Mintenbeck, A. Alegríaet al. (Cambridge University Press), 2195–2231. doi:10.1017/9781009325844.020.2195
Neumann, B., Vafeidis, A. T., Zimmermann, J., and Nicholls, R. J. (2015). Future coastal population growth and exposure to sea-level rise and coastal flooding - a global assessment. PLoS ONE 10 (3), e0118571. doi:10.1371/journal.pone.0118571
Nicolas-Artero, C., and Blanco-Wells, G. (2024). Tanker trucks in Chile: from the normalization of an emergency to the commodification of water. Int. J. Water Resour. Dev. 41, 667–687. doi:10.1080/07900627.2024.2423734
Novillo, C., Arrogante-Funes, P., and Romero-Calcerrada, R. (2019). Recent NDVI trends in mainland Spain: land-cover and Phytoclimatic-Type implications. ISPRS Int. J. Geo-Information 8 (1), 43. doi:10.3390/ijgi8010043
Ocampo-Melgar, A., Vicuña, S., Gironás, J., Varady, R. G., and Scott, C. A. (2016). Scientists, policymakers, and stakeholders plan for climate change: a promising approach in chile’s Maipo basin. Environment 58 (5), 24–37. doi:10.1080/00139157.2016.1209004
Odell, S. D. (2021). Desalination in Chile’s mining regions: global drivers and local impacts of a technological fix to hydrosocial conflict. J. Clean. Prod. 323, 129104. doi:10.1016/j.jclepro.2021.129104
Sadoff, C., and Muller, M. (2009). Water management, water security and climate change adaptation: early impacts and essential responses.
Sivapalan, M., Konar, M., Srinivasan, V., Chhatre, A., Wutich, A., Scott, C. A., et al. (2014). Socio-hydrology: use-inspired water sustainability science for the anthropocene. Earth’s Future 2 (4), 225–230. doi:10.1002/2013ef000164
Sivapalan, M., Savenije, H. H. G., and Blöschl, G. (2012). Socio-hydrology: a new science of people and water. Hydrol. Process. 26 (8), 1270–1276. doi:10.1002/hyp.8426
Soto-Rivas, K., Flores, R. P., Williams, M., and Escauriaza, C. (2024). Understanding salinity intrusion and residence times in a small-scale bar-built Estuary under drought scenarios: the Maipo river Estuary, central Chile. J. Mar. Sci. Eng. 12 (7), 1162. doi:10.3390/jmse12071162
Suárez, F., Leray, S., and Sanzana, P. (2021). “Groundwater resources,” in Water resources of Chile (Cham: Springer), 93–127. doi:10.1007/978-3-030-56901-3_5
Taucare, M., Viguier, B., Figueroa, R., and Daniele, L. (2024). The alarming state of central Chile’s groundwater resources: a paradigmatic case of a lasting overexploitation. Sci. Total Environ. 906, 167723. doi:10.1016/j.scitotenv.2023.167723
Vanelli, F. M., Kobiyama, M., and De Brito, M. M. (2022). “To which extent are socio-hydrology studies truly integrative? The case of natural hazards and disaster research,” Hydrology Earth Syst. Sci. Göttingen, Germany: Copernicus Publications. 26. 2301–2317. doi:10.5194/hess-26-2301-2022
Van Oel, P., Sivapalan, M., Di Baldassarre, G., Tian, F., Nakamura, S., and Marks, S. (2024). Editorial: scale issues in human-water systems. Front. Water 6 (3–4), 251–290. doi:10.3389/frwa.2024.1413800
Verbist, K. M. J., Maureira-Cortés, H., Rojas, P., and Vicuña, S. (2020). A stress test for climate change impacts on water security: a CRIDA case study. Clim. Risk Manag. 28, 100222. doi:10.1016/j.crm.2020.100222
Vicuña, S., Daniele, L., Farías, L., González, H., Marquet, P. A., Palma-Behnke, R., et al. (2022). Desalinización: oportunidades y desafíos para abordar la inseguridad hídrica en Chile.
Vicuña, S., Vargas, X., Boisier, J. P., Mendoza, P. A., Gómez, T., Vásquez, N., et al. (2021). “Impacts of climate change on water resources in Chile,” in Water resources of Chile (Cham: Springer), 347–363. doi:10.1007/978-3-030-56901-3_19
Wise, R. M., Fazey, I., Stafford Smith, M., Park, S. E., Eakin, H. C., Archer Van Garderen, E. R. M., et al. (2014). Reconceptualising adaptation to climate change as part of pathways of change and response. Glob. Environ. Change 28, 325–336. doi:10.1016/J.GLOENVCHA.2013.12.002
Yates, D., Purkey, D., Sieber, J., Huber-Lee, A., and Galbraith, H. (2005). International water resources association WEAP21-A demand-priority-and preference-driven water planning model part 1: model characteristics. Water Int. 30 (Issue 4), 501–512. doi:10.1080/02508060508691894
Yates, D., Sieber, J., Purkey, D., and Huber-Lee, A. (2005). 21 - a demand-priority-and preference-driven water planning model. Part 1: model characteristics. Water Int. 30, 487–500. doi:10.1080/02508060508691893
Yu, X., Wu, L., Yu, X., and Xin, P. (2022). Tidal fluctuations relieve coastal seawater intrusion caused by groundwater pumping. Mar. Pollut. Bull. 184, 114231. doi:10.1016/j.marpolbul.2022.114231
Keywords: vulnerability exploration, WEAP-MODFLOW modelling, global change impacts, water resources, robust decision making, semi-arid coastal basins
Citation: Poblete D, Vicuña S, Aedo S, Molina-Perez E, Cortés H, Melo O, Ocampo-Melgar A, Tesen K, Suárez F, Herane JP, Meza F, Duarte K, González D, Leray S, Williams M, Gaxiola A, Alfaro G and Morales-Moraga D (2025) Using a robust decision making (RDM) approach to explore current and future vulnerabilities of a semi-arid coastal basin: a case study of the Quilimarí basin in Chile. Front. Environ. Sci. 13:1553675. doi: 10.3389/fenvs.2025.1553675
Received: 31 December 2024; Accepted: 18 July 2025;
Published: 30 July 2025.
Edited by:
Giulio Castelli, University of Florence, ItalyReviewed by:
Lorenzo Villani, Università di Firenze, ItalyLeon M. Hermans, IHE Delft Institute for Water Education, Netherlands
Copyright © 2025 Poblete, Vicuña, Aedo, Molina-Perez, Cortés, Melo, Ocampo-Melgar, Tesen, Suárez, Herane, Meza, Duarte, González, Leray, Williams, Gaxiola, Alfaro and Morales-Moraga. This is an open-access article distributed under the terms of the Creative Commons Attribution License (CC BY). The use, distribution or reproduction in other forums is permitted, provided the original author(s) and the copyright owner(s) are credited and that the original publication in this journal is cited, in accordance with accepted academic practice. No use, distribution or reproduction is permitted which does not comply with these terms.
*Correspondence: David Poblete, ZGF2aWQucG9ibGV0ZUB1di5jbA==