- 1Energy and Water Conservancy Planning Institute, Power China Huadong Engineering Corporation Limited, Hangzhou, China
- 2School of Civil Engineering, Zhejiang University of Technology, Hangzhou, China
Introduction: Upstream damming significantly changes the flow and sediment conditions entering downstream reaches, resulting in remarkable channel adjustments. Several response models were applied to analyze the channel adjustments in response to flow and sediment conditions. However, the influence of water surface slope has been underexplored, and there is a lack of comparative analysis between various flow and sediment factors (FSF) and response models.
Methods: To address these gaps, this study compares the effects of different FSFs (water surface slope included) on the dynamic adjustments of the Lower Jingjiang Reach (LJR) by applying two response models.
Results: The results show that, for the LJR, the combinations of fluvial erosion intensity (the square of the discharge divided by sediment concentration) during the flood season and water surface slope agree well with measured data. Moreover, the factors incorporating the water surface slope consistently outperformed those without it.
Discussion: This study provides valuable insights into selecting flow and sediment factors for response models, enhancing the simulation and prediction of channel adjustments.
1 Introduction
The construction of large dams can significantly change the incoming flow and sediment conditions of downstream rivers, leading to dynamic channel adjustments (Williams and Wolman, 1984). Analyzing dynamic channel adjustments in response to the new flow and sediment conditions is essential for addressing various engineering problems such as navigation, bank protection, and water intake (Xia et al., 2016a; Li et al., 2018; Burgan, 2022; Yang et al., 2023).
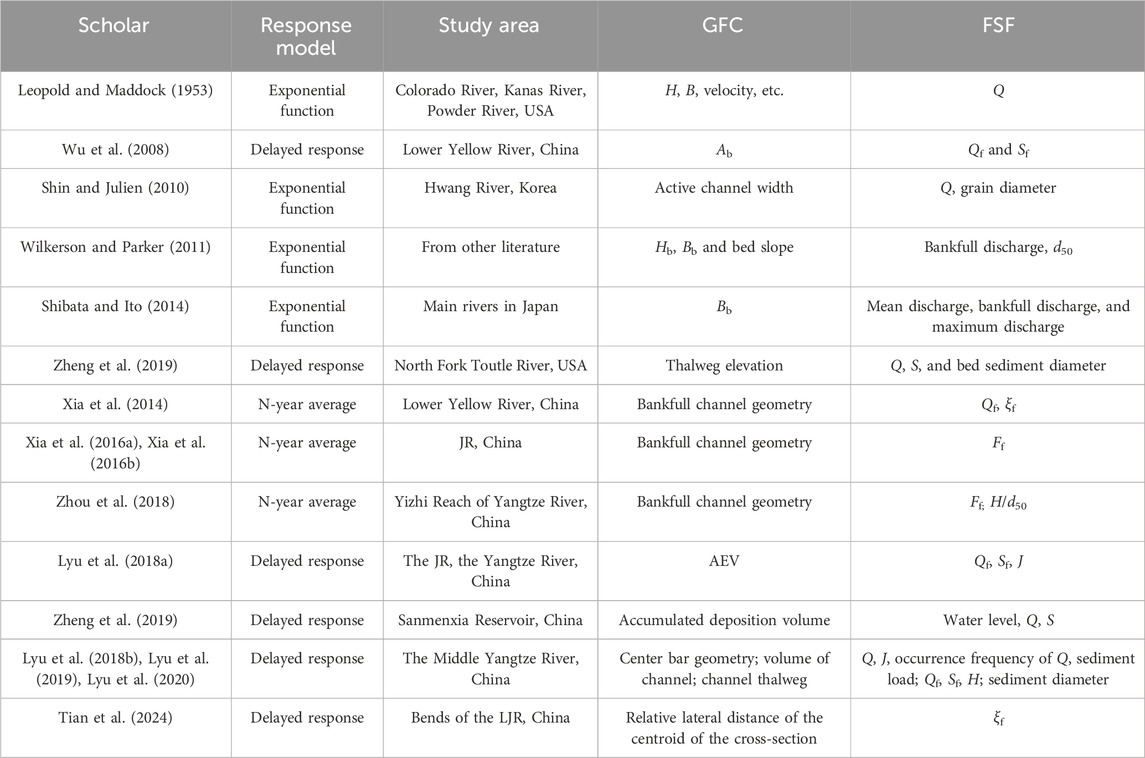
The Three Gorges Dam (TGD) has been impounding water since 2003, and many researchers have studied its effects on downstream channel adjustments. Xia et al. (2016a), Xia et al. (2016b) studied changes in bankfull channel geometry in the Jingjiang Reach (JR) after the construction of the TGD. Zhou et al. (2018) analyzed the channel adjustments in a gravel–sand bed reach (the Yizhi Reach) immediately downstream of the TGD. Li et al. (2018) revealed the mechanisms underlying the altered adjustment patterns of the Jingjiang Reach. Lyu et al. (2018a) studied the accumulated erosion volume (AEV) along the JR. Lyu et al. (2020) investigated the center bar geometry in the Middle Yangtze River. Yang et al. (2023) investigated the relationship between the river evolution process and the potential for waterway depth. Tian et al. (2024) analyzed bend evolution in the LJR. Most of these studies have attempted to determine the relationship between the geometric features of channels (GFC, such as area, water depth, scouring and deposition volume, centroid of the cross-section, and center bar geometry) and FSF (flow and sediment factors, such as discharge, sediment concentration, water slope, and combinations of these factors). Table 1 summarizes the response models, study areas, GFC, and FSF, where H is channel depth, B is the channel width, Q is discharge, S is the sediment concentration, d50 is the median diameter of the bed material, ξ is the sediment coefficient (=S/Q), F is fluvial erosion intensity (=Q2/S/108), J is the water surface slope, and subscript “f” refers to the flood season.
There are three types of response model. The exponential function is where the GFC is an exponential function of FSF. The response of the GFC to FSF shows minimal delay, or the lag time is within a year. This model is commonly applied in small rivers, such as those in Japan (Shibata and Ito, 2014). The N-year average model was presented by Xia et al. (2014); they argued that the current GFC is closely related to the average value of the previous N-year FSF. This model has been widely applied and demonstrates considerable potential in establishing the relationship between GFC and FSF. The delayed response mode was introduced by Wu et al. (2008), but the concept dates back to Graf (1977). The rate law was applied to describe geomorphic adjustments in the development of gullies over time. He demonstrated that the rate of gully expansion was initially high following human disturbance but decreased rapidly after a few years. Therefore, the current GFC is influenced by the FSF of previous years, with the impact increasing as the time becomes more recent. The N-year average and delayed response models are commonly applied to large rivers, such as the Yangtze and Yellow Rivers.
The majority of studies have directly selected specific FSFs without providing detailed explanation or comparison with other FSFs. Notably, while flood-season FSFs are commonly applied, their validity against annual averages remains unexamined in the literature. The water surface slope (J) can directly impact the flow, such as velocity, shear stress, and sediment transport; however, J has received limited attention in current research. The water surface slope has a considerable impact on channel adjustments when there is a large inflow at the lower boundary of the channel, such as the LJR of the Middle Yangtze River (Lyu et al., 2018a). In summary, current studies lack systematic comparisons among different FSFs and analysis of their applicability. Moreover, most existing studies rely solely on the coefficient of determination (R2) to evaluate model performance, despite its inability to fully capture performance.
To address these gaps, we conducted a comparative analysis of commonly used FSFs along the LJR using both N-year average and delayed response model. Model performances were evaluated using both the coefficient of variation (Cv) and R2. Additionally, we investigated whether incorporating J improves model performance. The methodology and findings of this study can be employed to better quantify the relationship between GFC and FSFs, providing support for predicting evolutionary trends and guiding river regulation projects.
2 Materials and methods
2.1 Study area
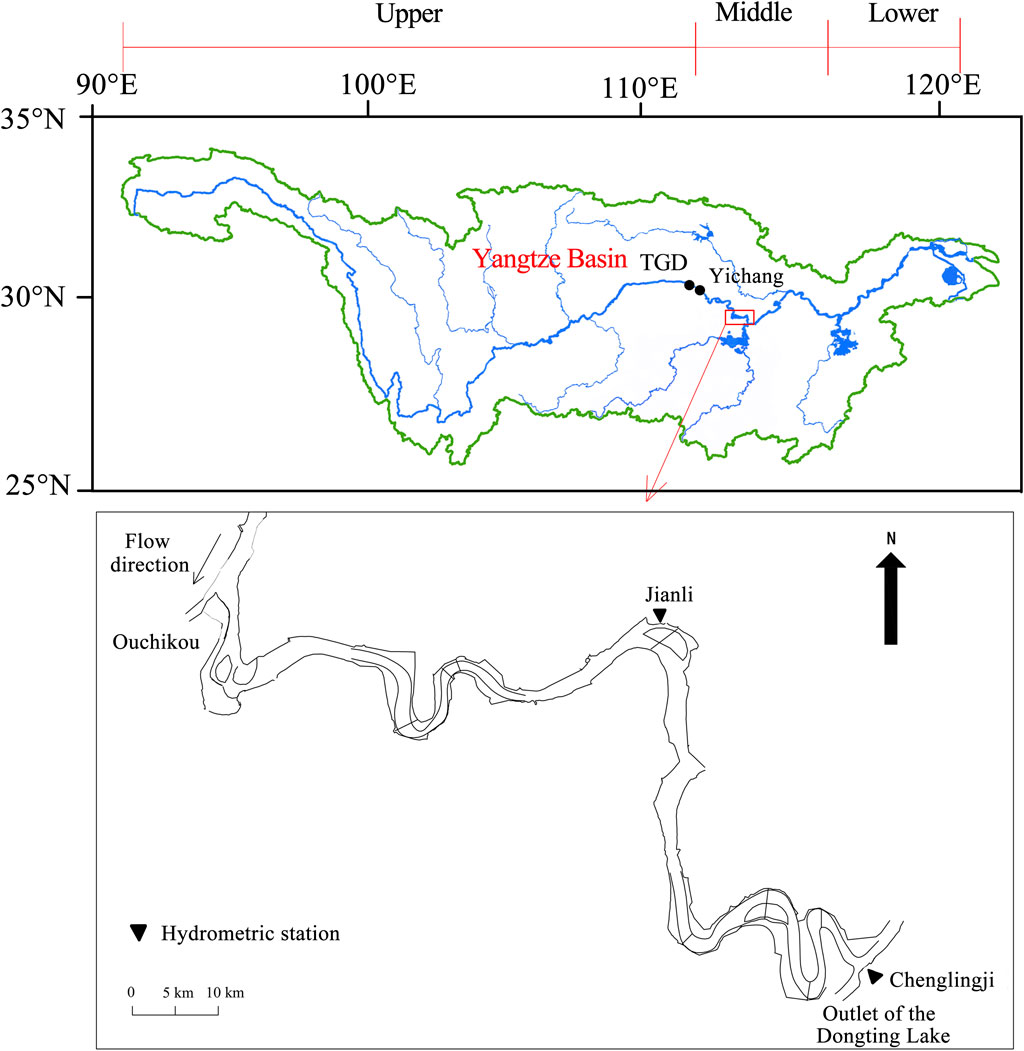
The Yangtze River, with a total length of approximately 6,300 km, is conventionally divided into upper, middle, and lower reaches based on geological conditions and hydrological characteristics. The Middle Yangtze River goes from Yichang to Hukou, covering a reach length of 955 km. The TGD is located approximately 38 km upstream of Yichang. The study area is the LJR of the Middle Yangtze River, which goes from Ouchikou (approximately 274 km downstream of the TGD) to Chenglingji, with a length of 175 km. Dongting Lake discharges into the Yangtze River through Chenglingji (Figure 1).
2.2 Data collection
Daily hydrological data were collected at the hydrometric stations of Jianli and Chenglingji covering daily discharge, sediment concentration, and water level from 1998 to 2020. Bankfull area data were obtained from Xia et al. (2016a) and the AEV of the LJR from the Yangtze River Sediment Bulletin (Changjiang Water Resources Commission of the Ministry of Water Resources, 2003-2020).
2.3 Response model
We applied two response models to examine the relation between GFC and FSF. The N-year average model assumes that the GFC is closely related to the previous years’ incoming discharge and sediment (Equation 1).
where GFCs are AEV of the channel and bankfull area in this paper, Xs are the flow and sediment factors, subscripts 1, 2, and 3 are the number of factors—it should be noted that the number is not necessarily three—K, a, b, and c are coefficients to be determined by measured data, and N is the number of years.
The other response model is the delayed response model, which can be expressed as Equation 2 (Wu et al., 2008).
where GFCn is the value for the nth time step for the GFC, n is the number of time steps, GFCei is the equilibrium value for the ith time step, GFC0 is the initial value of GFC, and β is the rate at which the equilibrium state is being approached. Time step means the time scale of GFC if the data of GFC are annual time step is one year; if the data of GFC are monthly, the time step is 1 month.
The equilibrium value of GFC can be expressed as Equation 3 (Wu et al., 2008).
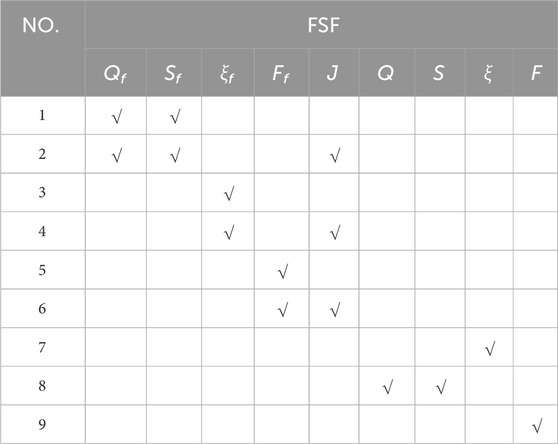
However, neither of these response models incorporates the water surface slope as a factor. In this study, we explored the response of two GFCs to various combinations of FSFs (including J), apply the two response models, and conduct a detailed comparative analysis of the results. The FSFs are listed in Table 2. It should be noted that the flood season in the LJR is May to October, during which the majority of runoff and sediment load are transported (Xia et al., 2016b).
2.4 Calculation procedure
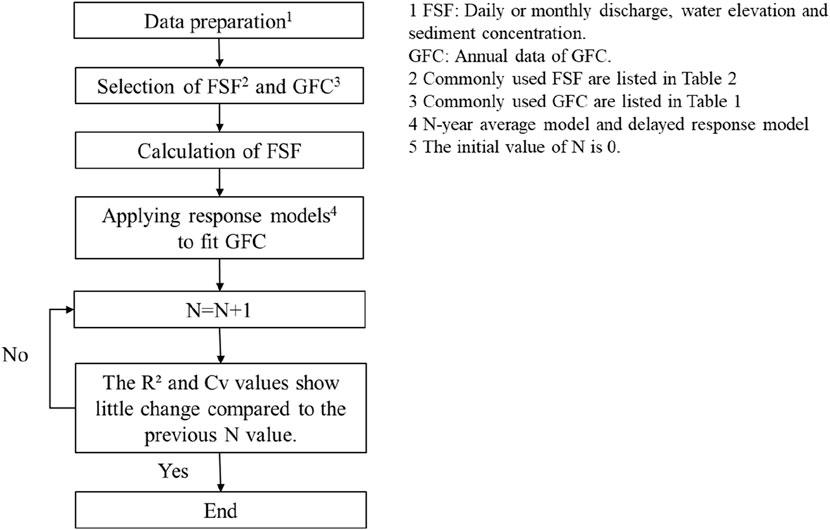
Figure 2 illustrates the procedure of applying the response models.
Here, we present the calculation method for FSFs and the computational steps of the two response models. Q is the annual average discharge, calculated as the arithmetic mean of daily discharge values at the Jianli Station for a certain year (Equation 4).
where Qi is the daily discharge of the Jianli Station, NY represents the number of days in a year, and i represents the cumulative day count beginning 1 January.
S is the annual average sediment concentration; it can be calculated as
where Si is the daily sediment concentration of the Jianli Station.
ξ is the annual average sediment coefficient, which can be derived by
F is the fluvial erosion intensity, which can be calculated as
For the FSFs during the flood season, Equations 4–7 remain applicable with the following modifications: (a) the initial value for i is adjusted to 120 (121 for leap years); (b) NY is replaced by 184, which represents the flood season duration (1 May to 31 October).
Herein, we use No. 8 in Table 2 (i.e., Q and S) as an example to illustrate the fitting steps of response models. The annual values of Q and S can be calculated by Equations 4 and 5. We take AEV along the LJR (V) as a GFC; Equation 1 (N-year average model) then becomes Equation 8
When N = 1, the Q and S values correspond to data from the same year as the measured value of AEV. When N = 2, Q and S represent the average values from the current and the previous year, respectively. This pattern continues, where N indicates that Q and S are calculated as the average values from the current year to the previous N-1 years. Subsequently, computational tools such as SPSS/MATLAB/Excel were used to fit the result with the measured AEV for each N value, obtaining parameters a, b, and K, as well as the R2 and Cv.
Like the steps of the N-year average model, the delayed response model can be expressed as Equation 9
When n = 1, AEV is only related to the FSFs of the current year (Equation 10):
When n = 2, the AEV value depends not only on the current year’s FSFs but also on the previous year’s. Unlike the N-year average model, the AEV value shows the strongest relationship with the current year’s FSF, while the influence of earlier years decreases exponentially with time (Equation 11).
The subsequent steps follow the same procedure as the N-year average model.
3 Results
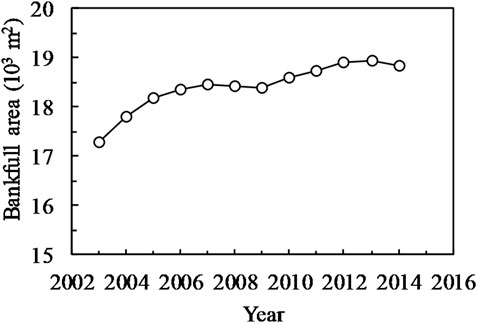
Figure 3 illustrates the temporal variations of the bankfull area along the LJR. Except for a slight deposition in 2007–2009, the bankfull area has been increasing since 2003, rising from 17,300 m3 in 2003 to 18,800 m3 in 2014—an increase of approximately 8.7% after the operation of the TGD.
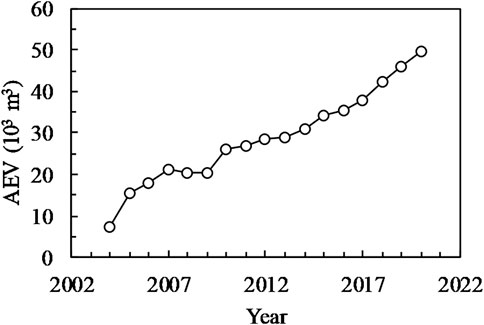
Figure 4 shows AEV along the LJR. Similar to the bankfull area, except for a slight deposition in 2007–2009, AEV has also been increasing over time since 2003. By 2020, the total AEV of the whole LJR reached nearly 50,000 m3.
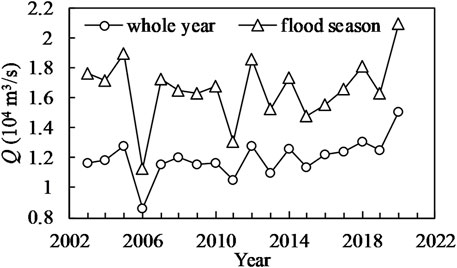
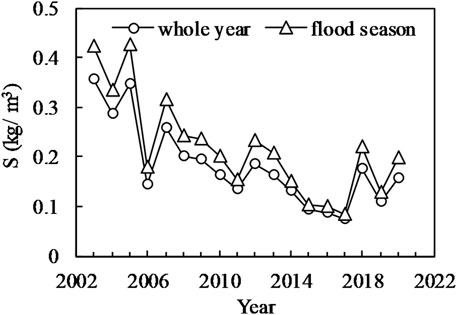
Figures 5, 6 respectively, show the annual variations in the flood season and annual average discharge and sediment concentration at the Jianli Station after the construction of the TGD (the other statistical properties of FSFs can be seen in Supplementary Tables S1–S8). The trends of annual and flood season averages for both discharge and sediment concentration are highly consistent. The discharge during the flood season is approximately 1.38 times the annual average discharge. There is a slight increasing trend in discharge after the construction of the TGD. The sediment concentration during the flood season is approximately 1.2 times the annual average sediment concentration. There is a significant decreasing trend in the sediment concentration after the construction of the TGD.
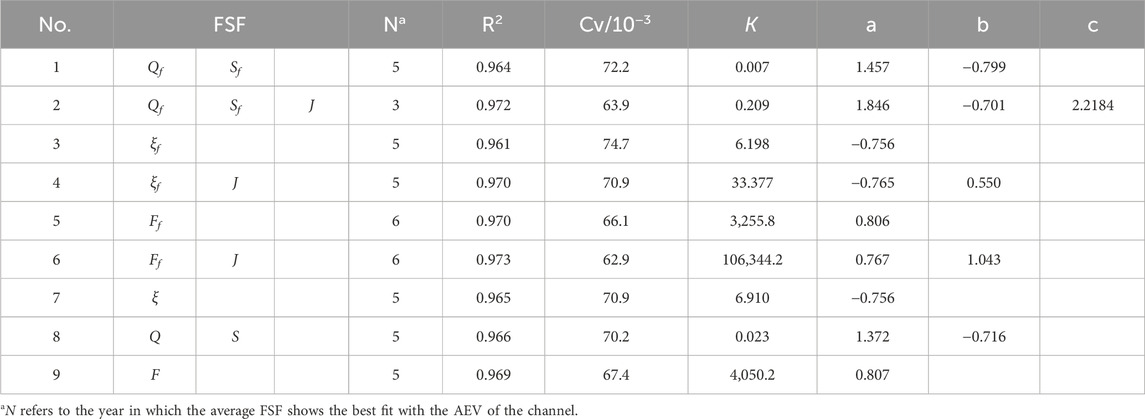
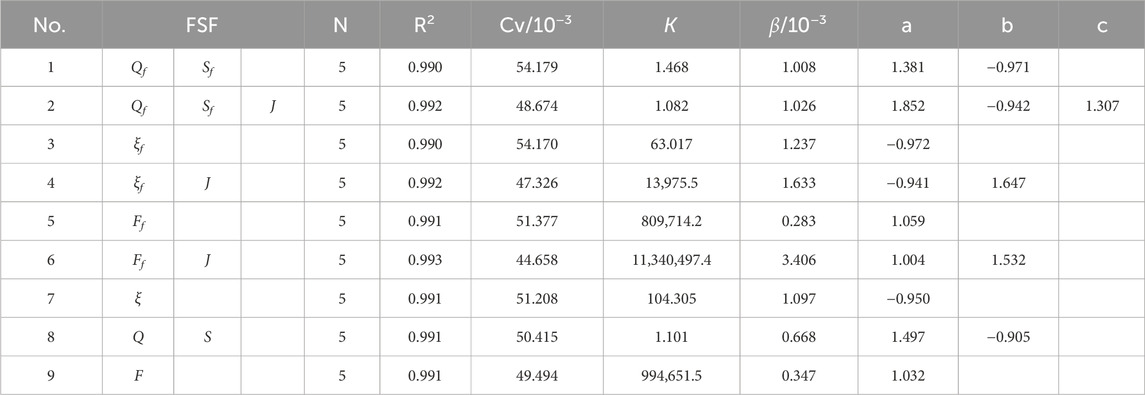
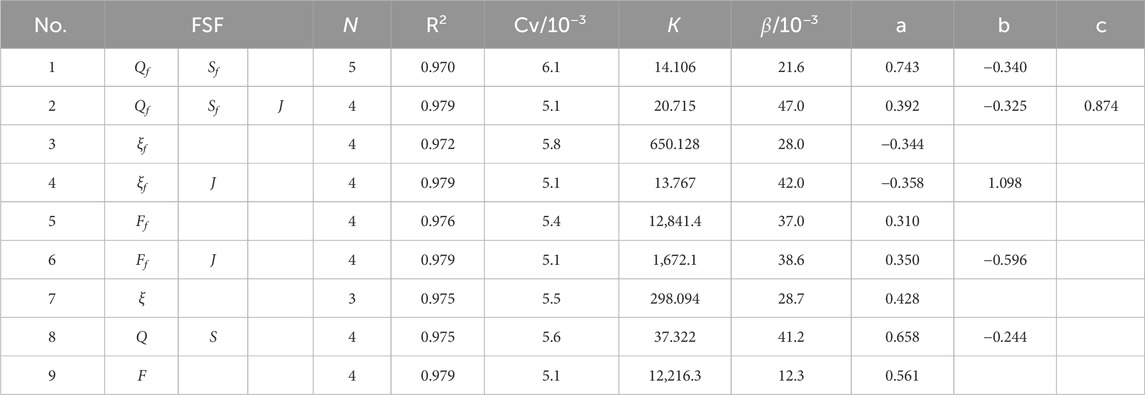
The relations between GFC and FSFs have been explored using two response models. Tables 3–6 show the results of various response models and FSFs, including R2, Cv, and the values of several computed parameters (K, a, b, and c are for the N-year average model; β, K, a, b, and c are for delayed response model).
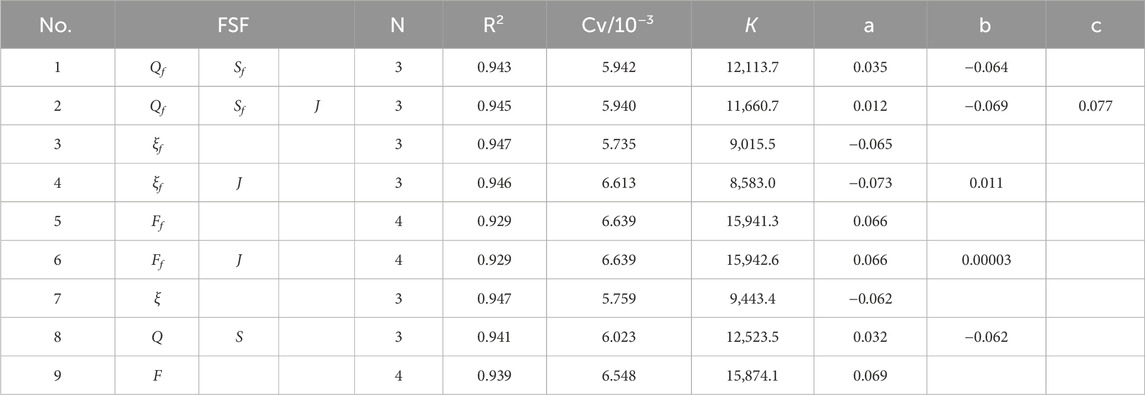
Table 4. Fitting the FSFs and reach-average bankfull area of the LJR using the N-year average model.
Table 3 shows the results of fitting the FSFs and AEV of the LJR using the N-year average model. From Nos. 1 and 2, 3 and 4, and 5 and 6 in Table 3, it is evident that the FSFs with J fit better than the FSFs without J. No. 6 provides the best fit, with the values of R2 and Cv being 0.973 and 62.9 × 10⁻³, respectively. The value of N ranges from 3 to 6, with the majority being 5. It should be noted that flood season-averaged results do not necessarily outperform annual averaged results; in some cases, the latter demonstrate superior performance (e.g., comparing No. 1 with No. 8 and No. 3 with No. 7).
Table 4 shows the results of fitting the FSFs and reach-average bankfull area of the LJR using the N-year average model. From Nos. 1 and 2, it is evident that the FSFs with J fit better than those without J. From Nos. 3 and 4 and 5 and 6, the fitting results of FSFs with J are similar to those without J, with the latter even being slightly better. The FSF of best fit is No. 3. Comparing Nos. 1 and 8, and 3 and 7, the FSFs selected from the flood season fit slightly better than those from entire year. The value of N ranges from 3 to 4; the values of N selected in analyzing the bankfull area are slightly larger than those for the AEV.
Table 5 illustrates the results of fitting the FSF and AEV of the LJR using the delayed response model. From cases 1 and 2, 3 and 4, and 5 and 6, it is evident that the FSFs with J fit better than those without J. No. 6 provides the best fit, with values of R2 and Cv being 0.993 and 44.658 × 10⁻³, respectively. Comparing Nos. 1 and 8, 3 and 7, and 5 and 9, the fitting results of the FSFs from the entire year yield better than those during the flood season. The N values are 5. The value of β ranges from 0.283 × 10⁻³-3.4 × 10⁻³.
Table 6 illustrates the results of fitting the FSF and bankfull area of the LJR using the delayed response model. From cases 1 and 2, 3 and 4, and 5 and 6, it is evident that the FSFs with J fit better than those without J. Nos. 2 and 6 provide the best fit. Comparing Nos. 1 and 8, 3 and 7, and 5 and 9, the fitting results of the FSFs from the whole year are better than those from the flood season. The values of N vary from 3 to 5, with most being 4. The value of β ranges from 12.3 × 10⁻³-47.0 × 10⁻³. In addition, the values of β used in analyzing the bankfull area are significantly larger than those for the AEV. This indicates that the AEV is more affected by the FSFs over a longer period. The rate at which the AEV reaches equilibrium is slower than that of the bankfull area.
4 Discussion
In general, the fitting results of both response models performed well for all FSF combinations in this study. Good results are achieved when the factors included water and sediment combinations (Q and S) or integrated parameters (such as ξ and F). However, differences still exist among different combinations. The inclusion of J in the FSFs leads to only minor improvement in R2 values compared to FSF combinations without J but significantly reduces Cv values. This demonstrates that although the trends are similar, incorporating J renders the fitted values more stable to measured values than without J. This is attributed to the confluence with Dongting Lake at the lower boundary of the LJR, where significant variations in water surface slope exert a considerable influence on channel evolution. Even under identical water and sediment inflow conditions, differing degrees of backwater effects from Dongting Lake may lead to distinct evolutionary processes (Lyu et al., 2018b).
The exponents of sediment-related factors (e.g., S and ξ) are negative, whereas those for hydrodynamic factors (e.g., Q, F and J) are positive. This aligns with the physical processes of channel erosion, where stronger hydrodynamics increase erosion and expand bankfull cross-sectional areas, whereas higher sediment loads reduce erosion and lead to smaller bankfull areas.
The fitting results of the two response models are similar when simulating the same GFC’s response to identical FSFs (Table 3 vs. Table 5 and Table 4 vs. Table 6), with the delayed response model performing slightly better. This is because the delayed response model assumes that the influence of flow and sediment conditions on channel morphology decreases with time, whereas the N-year average model considers past conditions to be equally significant. After the construction of the TGD, the inter-annual flow and sediment conditions have relatively small variation, so the results of the two response models are similar. Nevertheless, in natural rivers exhibiting substantial inter-annual hydrological variations, application of the delayed response model is preferable.
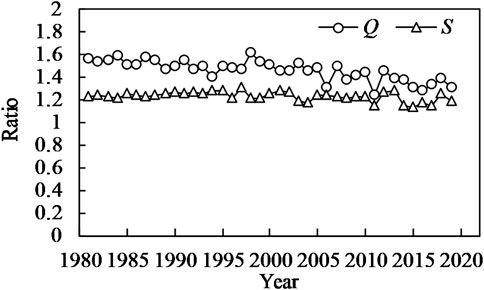
The FSFs from the flood season fit similarly to those from the whole year, and they do not necessarily fit better; in some cases, annual average FSFs perform better. This is because, due to the operation of the TGD, the relations between the flow and sediment conditions during flood season are closely related to the entire year. Figure 7 illustrates the ratio of discharge and sediment concentration during the flood season to their respective annual average before and after the construction of the TGD. The ratio of the flow exhibits a declining trend over the years. Before the construction of the TGD, the average ratio was 1.509, decreasing to 1.383 after construction—an 8.3% reduction. As for the ratio of sediment concentration, the change is relatively small compared to that of the flow ratio. The average sediment concentration ratio was 1.246 before the construction of the TGD, and it decreased to 1.199 after its construction—a reduction is approximately 3.7%. Therefore, unless the proportion of flood season water and sediment transport to the annual total is sufficiently large, flood season average FSFs may not necessarily produce better fitting results than annual averaged FSFs.
This method can be applied to different GFCs in different river channels. It can summarize the applicability of various FSF combinations and their underlying mechanisms as well as the reasonable ranges of fitting parameters. Based on the above procedures, an “application database” can be progressively established, including which response models, FSF combinations, and approximate parameter ranges are more suitable for specific channels and GFCs. Therefore, the practical engineering applications of this study include: 1) establishing quantitative FSF–GFC relationships that both reconstruct historical GFC evolution processes and predict future trends (e.g., when GFCs may reach relative equilibrium states); 2) guiding channel regulation strategies, such as modifying intra-annual or inter-annual (if possible) flow-sediment distribution through reservoir operations to achieve adjustment of the GFCs evolution processes.
The methodology in this paper is valid for most areas. As shown in Table 1, many researchers have applied response models to study the response of GFCs to the FSFs of many rivers. However, it may not be applicable when the GFC itself is directly affected by human activities. Examples are when studying changes in the bankfull area (GFC) in river reaches with intensive and frequent sand mining operations, and abrupt changes in channel evolution, such as chute cutoff, neck cutoff, and large-scale bank collapse.
5 Conclusion
To investigate the applicability of the FSF combinations in characterizing the response of the GFC, this study examines the LJR of the Yangtze River, analyzing the response mechanisms of AEV and bankfull area to altered flow-sediment regimes after the construction of the TGD, by employing an N-year average model and a delayed response model. Key findings include the following.
In the LJR, both individual flow and sediment parameter combinations (e.g., Q and S, or Qf and Sf) and integrated flow–sediment factors (e.g., ξ and F) show good fitting results for the GFC, with the R2 larger than 0.9. However, the results varied across different FSF combinations. In most cases, FSF incorporating J demonstrates better fitting results than those without J. The inclusion of J yields a modest improvement in R2 but leads to a significant reduction in Cv values.
For the LJR, flood season averaged FSFs do not necessarily yield significantly better fitting results than annual averaged FSFs. In some cases, annual averaged FSFs may even yield superior performance. Therefore, when applying response models, the intra-annual distribution of flow and sediment should be analyzed to identify optimal FSF combinations rather than directly applying flood season averages as adopted in most previous studies.
The fitting results of the N-year average and delayed response models produce similar accurate results in this study, with the latter model being slightly better. This is because the delayed response model assumes that the influence of flow and sediment conditions on channel morphology decreases with time, whereas the N-year average model considers past conditions to be equally significant. After the construction of the TGD, the inter-annual flow and sediment conditions vary relatively little, so the results of two response models are similar.
The method can theoretically be applied to any river reach and any GFCs when sufficient data are available, unless the GFC itself is caused by human activities such as large-scale sand mining. By analyzing FSF applicability in different rivers, we can determine suitable FSF combinations for different rivers and establish parameter ranges for response models. In engineering practice, this method provides technical support to the following: 1) quantitatively analyze FSF–GFC responses; 2) reproduce GFC variation processes; 3) predict when GFC will reach relative equilibrium; 4) adjust GFC evolution through reservoir operations.
Data availability statement
The original contributions presented in the study are included in the article/Supplementary Material; further inquiries can be directed to the corresponding author.
Author contributions
HT: Conceptualization, Data curation, Formal Analysis, Investigation, Methodology, Writing – original draft, Writing – review and editing. ZR: Formal Analysis, Investigation, Methodology, Writing – original draft. CY: Data curation, Formal Analysis, Writing – original draft. NZ: Investigation, Supervision, Validation, Writing – review and editing. CX: Funding acquisition, Methodology, Writing – original draft.
Funding
The author(s) declare that financial support was received for the research and/or publication of this article. Joint Funds of the Zhejiang Provincial Natural Science Foundation of China (Grant No. LZJWZ23E090010).
Acknowledgments
CX acknowledges support from the Joint Funds of the Zhejiang Provincial Natural Science Foundation of China (Grant No. LZJWZ23E090010). The authors are appreciative of Power China Huadong Engineering Corporation for the support of the postdoctoral project.
Conflict of interest
Authors HT, ZR, CY, and NZ were employed by Power China Huadong Engineering Corporation Limited.
The remaining author declares that the research was conducted in the absence of any commercial or financial relationships that could be construed as a potential conflict of interest.
Generative AI statement
The authors declare that no Generative AI was used in the creation of this manuscript.
Publisher’s note
All claims expressed in this article are solely those of the authors and do not necessarily represent those of their affiliated organizations, or those of the publisher, the editors and the reviewers. Any product that may be evaluated in this article, or claim that may be made by its manufacturer, is not guaranteed or endorsed by the publisher.
Supplementary material
The Supplementary Material for this article can be found online at: https://www.frontiersin.org/articles/10.3389/fenvs.2025.1554900/full#supplementary-material
References
Burgan, H. (2022). The short-term and seasonal trend detection of sediment discharges in Turkish Rivers. Rocz. Ochr. Środowiska 24, 214–230. doi:10.54740/ros.2022.016
Changjiang Water Resources Commission of the Ministry of Water Resources (2003-2020). The Yangtze River Sediment Bulletin. Available online at: http://www.cjw.gov.cn/zwzc/zdgk/swgl/cjns/.
Graf, W. (1977). The rate law in fluvial geomorphology. Am. J. Sci. 277, 178–191. doi:10.2475/ajs.277.2.178
Leopold, L. B., and Maddock, T. (1953). The hydraulic geometry of stream channels and some physiographic implications. Washington, DC: US Geological Survey. Professional Paper 252.
Li, S., Li, Y., Yuan, J., Zhang, W., Chai, Y., and Ren, J. (2018). The impacts of the Three Gorges Dam upon dynamic adjustment mode alterations in the Jingjiang reach of the Yangtze River, China. Geomorphology 318, 230–239. doi:10.1016/j.geomorph.2018.06.020
Lyu, Y., Fagherazzi, S., Tan, G., Zheng, S., Feng, Z., Han, S., et al. (2020). Hydrodynamic and geomorphic adjustments of channel bars in the yichang-chenglingji reach of the middle Yangtze River in response to the three Gorges dam operation. Catena 193, 104628. doi:10.1016/j.catena.2020.104628
Lyu, Y., Tan, G., Zheng, S., and Shu, C. (2018a). Improvement of river evolution delay response model in the Jingjiang Reach. J. Sediment Res. 43 (01), 9–14. (in Chinese). doi:10.16239/j.cnki.0468-155x.2018.01.002
Lyu, Y., Zheng, S., Tan, G., and Shu, C. (2018b). Effects of three Gorges dam operation on spatial distribution and evolution of channel thalweg in the yichang-chenglingji reach of the middle Yangtze River, China. J. Hydrology 565, 429–442. doi:10.1016/j.jhydrol.2018.08.042
Lyu, Y., Zheng, S., Tan, G., Shu, C., and Han, Q. (2019). Morphodynamic adjustments in the yichang-chenglingji reach of the middle Yangtze River since the operation of the three Gorges project. Catena 172, 274–284. doi:10.1016/j.catena.2018.08.040
Shibata, K., and Ito, M. (2014). Relationships of bankfull channel width and discharge parameters for modern fluvial systems in the Japanese Islands. Geomorphology 214 (2), 97–113. doi:10.1016/j.geomorph.2014.03.022
Shin, Y., and Julien, P. (2010). Changes in hydraulic geometry of the hwang river below the hapcheon reregulation dam, South Korea. Int. J. River Basin Manag. 8 (2), 139–150. doi:10.1080/15715121003651252
Tian, H., Ren, Z., Yao, C., Zeng, Z., Guo, J., Yu, M., et al. (2024). Cross-sectional geometrical characteristic for the bends along the lower Jingjiang reach. Proc. Institution Civ. Eng. – Water Manag. 178, 18–27. doi:10.1680/jwama.23.00062
Wilkerson, G., and Parker, G. (2011). Physical basis for quasi-universal relationships describing bankfull hydraulic geometry of sand-bed rivers. J. Hydraulic Eng. 137 (7), 739–753. doi:10.1061/(ASCE)HY.1943-7900.0000352
Williams, G., and Wolman, M. (1984). Downstream effects of dams on alluvial rivers, Professional Paper 1286. Washington DC: US Geological Survey.
Wu, B., Xia, J., Fu, X., Zhang, Y., and Wang, G. (2008). Effect of altered flow regime on bankfull area of the Lower Yellow River, China. Earth Surf. Process. Landforms 33 (10), 1585–1601. doi:10.1002/esp.1679
Xia, J., Deng, S., Lu, J., Xu, Q., Zong, Q., and Tan, G. (2016b). Dynamic channel adjustments in the Jingjiang reach of the middle Yangtze River. Sci. Rep. 6, 22802. doi:10.1038/srep22802
Xia, J., Deng, S., Zhou, M., Lu, J., and Xu, Q. (2016a). Geomorphic response of the Jingjiang reach to the three Gorges project operation. Earth Surf. Process. landforms 42, 866–876. doi:10.1002/esp.4043
Xia, J., Li, X., Li, T., Zhang, X., and Zong, Q. (2014). Response of reach-scale bankfull channel geometry to the altered flow and sediment regime in the lower Yellow River. Geomorphology 213, 255–265. doi:10.1016/j.geomorph.2014.01.017
Yang, Y., Li, M., Liu, W., Chai, Y., Zhang, J., and Yu, W. (2023). Relationship between potential waterway depth improvement and evolution of the Jingjiang Reach of the Yangtze River in China. J. Geogr. Sci. 33 (3), 547–575. doi:10.1007/s11442-023-2096-8
Zheng, S., Wu, B., Hou, S., and Lyu, Y. (2019). Spatial and temporal erosion and deposition processes and the delayed response of the Sanmenxia reservoir. J. Hydraulic Eng. 50 (12), 1433–1445. (in Chinese). doi:10.13243/j.cnki.slxb.20190289
Zheng, S., Wu, B., Thorne, C., and Simon, A. (2014). Morphological evolution of the north fork toutle river following the eruption of mount st. Helens, Washington. Geomorphology 208, 102–116. doi:10.1016/j.geomorph.2013.11.018
Keywords: response model, channel adjustments, water surface slope, the Lower Jingjiang Reach, flow and sediment factors
Citation: Tian H, Ren Z, Yao C, Zhong N and Xia C (2025) Impact of flow and sediment factor selection on downstream channel adjustments in the Lower Jingjiang Reach of the Yangtze River. Front. Environ. Sci. 13:1554900. doi: 10.3389/fenvs.2025.1554900
Received: 03 January 2025; Accepted: 08 April 2025;
Published: 01 May 2025.
Edited by:
Buddhi Wijesiri, Queensland University of Technology, AustraliaCopyright © 2025 Tian, Ren, Yao, Zhong and Xia. This is an open-access article distributed under the terms of the Creative Commons Attribution License (CC BY). The use, distribution or reproduction in other forums is permitted, provided the original author(s) and the copyright owner(s) are credited and that the original publication in this journal is cited, in accordance with accepted academic practice. No use, distribution or reproduction is permitted which does not comply with these terms.
*Correspondence: Haoyong Tian, dGlhbl9oeUBoZGVjLmNvbQ==
 Haoyong Tian
 Zaimin Ren1
 Chunchen Xia