 Stephanie Schollaert Uz1*
 Katharine C. Stover1,2
 Samantha L. Smith1,3
 Debra M. Collier4Jacob Riley4Evelyn H. Hoban4
- 1Earth Science Division, Goddard Space Flight Center, National Aeronautics and Space Administration, Greenbelt, MD, United States
- 2Earth System Science Interdisciplinary Center, University of Maryland, College Park, MD, United States
- 3Science Systems and Applications, Inc., Lanham, MD, United States
- 4Prince George’s County Health Department, Largo, MD, United States
As demand grows for high-quality public information around the increasing societal impacts of extreme weather, making scientific data products more actionable for practitioners has become a top priority for NASA. In early 2024, several of us from NASA Goddard Space Flight Center began collaborating with Prince George’s County, Maryland staff to apply space-based observations to help inform local decisions around building resilience to environmental stressors. Prince George’s County is home to Goddard Space Flight Center hosting a comprehensive array of Earth observing satellite and modeling products and expertise to advance understanding of Earth as a system, providing critical long-term data records over space and time. Scientific and academic communities have primarily used these global data products to advance fundamental understanding of Earth processes and their changes, rather than informing practical decisions. Here we describe a demonstration to bridge that gap, initially around reducing exposure of humans to extreme heat. Working with agency staff from the Prince George’s County Department of Environment and the Prince George’s County Health Department, NASA shared satellite-derived land surface temperatures from Aqua-MODIS and Landsat as well as land cover classifications to analyze seasonal temperature trends with land use changes over the past few decades. Prior to partnering with NASA, the county was using sparse in situ temperature records, extremely valuable and essential for ground-truthing satellite data, but limited spatially and temporally. The addition of space-based data augments these few ground-based measurements with a broad view of spatial and temporal temperature trends that can be layered with additional county data to help identify areas of increased heat with land use change patterns. We also compared the temperature trends to records of annual heat-related emergency room visits. By combining environmental data with local health impacts, the County plans to pinpoint heat-related vulnerability patterns over time. This unique combination of global and local data serves to pilot science-based criteria to inform and prioritize projects and programs to reduce heat exposure of Prince George’s County’s workers and residents.
Introduction
Local governments around the United States have been responding to increasing heat and extreme weather threats to public health and safety by creating climate action plans. According to the National Aeronautics and Space Administration (NASA) and the National Oceanic and Atmospheric Administration (NOAA), 2023 was the warmest year on record worldwide (NASA, 2024b) until 2024 broke that record (NASA, 2025). To plan and prepare to build resilience, communities require an analysis of past climatological conditions as well as information about probable future change within the range of possible socioeconomic pathways or emissions scenarios (Tebaldi et al., 2021; Thrasher et al., 2022). This is information that federal science agencies such as NASA and NOAA have. Traditionally, NASA Earth observing satellites and models have advanced our understanding of fundamental Earth system processes and how they vary over space and time, e.g., Earth’s energy cycle, water cycle, and carbon cycle. While fundamental awareness of Earth’s climate is critical for understanding what makes our planet habitable, these science products have largely been limited to technical users such as academic and federal government research scientists some of whom apply these data for food security and health applications (e.g., Anyamba et al., 2019; Johnson et al., 2021; Amos et al., 2023). Additionally, private sector companies use NASA data as the foundation of value-added services. Increasing impacts on people around the world from heat waves, rising sea level, and severe storms motivated the NASA Earth Science to Action strategy for the next decade to better coordinate the transformation of its data into actionable information and accelerate delivery to meet the urgency of societal needs (NASA, 2024a). In order to unlock the potential of NASA data and increase access by non-research organizations, we partner with county practitioners to learn which NASA data products are relevant to their needs and to facilitate their application to close any information gaps.
NASA Goddard Space Flight Center (GSFC) is located in Prince George’s County, Maryland (Figure 1) where we engaged local practitioners in a community science study through an iterative approach to understand existing data, needs and gaps.

Figure 1. Prince George's County Maryland, east of Washington, DC, demarcated here (—), includes 27 municipalities and NASA Goddard Space Flight Center (pinned) just outside of the Capital Beltway (I-495).
Prince George’s County adopted its own Climate Action Plan in 2022, making it an ideal case study to learn which NASA data could inform decisions to help build resilience. In 2024, NASA members began meeting with relevant state and county agencies, as well as academic researchers from universities within Prince George’s County to gain practical knowledge of the day-to-day challenges of turning their plan into action. The project evolved by gaining multiple perspectives through discussion, reviewing existing community plans, and learning about local environmental vulnerabilities and data gaps where NASA data and expertise might augment existing information. In reviewing the Prince George’s County Climate Action Plan (CAP) and its Priority Recommendations (Prince George’s County, 2022), we converged on collaborating with the County’s Department of Environment, the primary agency tasked with implementing the County CAP. Given the impact of extreme heat upon many health outcomes, the Prince George’s County Health Department joined our discussions as well. Increased heat and flooding are the top vulnerabilities for this county. In particular, the projected increased frequency and severity of extreme heat events in Prince George’s County are expected to cause at least 22% more hospitalizations by 2040 from heat-related illness, including cardiopulmonary distress, water-borne illness, and vector-borne diseases (MIAEH, 2016).
Working with geographic information system (GIS) specialists, planning professionals, and health experts, the project team prioritized downscaling NASA’s land surface temperature data to analyze spatial patterns and trends to inform their implementation of adaptation priority recommendations around reducing exposure of vulnerable populations to extreme heat. Additionally, the County’s recently drafted Climate Action Implementation Strategy Plan recommends heat assessments as the critical first step and advised partnering with institutional experts such as NASA and the University of Maryland to support the heat vulnerability study. The implementation strategy also recommends the use of remote sensing, such as land surface temperature data available through NASA, and ground-level monitoring of air temperatures to highlight hot spots across the County to inform actionable heat mitigation strategies in the hottest neighborhoods.
In urban areas, the material used in buildings, roads, and other built infrastructure absorbs more heat than large areas of undisturbed vegetation. Urban heat islands are defined using air temperature differences between urban areas compared to surrounding ex-urban areas while the surface urban heat island has been defined using satellite-derived land surface temperatures (Voogt and Oke, 2003; Clinton and Gong, 2013; Hulley et al., 2019; Sangiorgio et al., 2020). A suburban area such as Prince George’s County does not have obvious urban centers and ex-urban areas, although the area within the Capital Beltway is generally more urban and developed.
Motivated by this framework, our collaboration between NASA Goddard and Prince George’s County undertook an initial study of temperature trends across the County along with changes in land use and land cover. While NASA global data and models are spatially coarse and cannot be the only source of information used in a local-scale assessment, these science products provide a consistent space-based record of the entire county over many years. Through regular discussions, technical exchanges, and clarification of the appropriate uses and limitations of satellite-derived information, we analyzed surface temperature patterns to help the County prioritize areas for reducing heat exposure. Loss of natural resource areas such as wooded areas with an increase of impervious land cover such as buildings and roads can increase radiative heating of the land surface. Monitoring these patterns and other changes is important to protect human health because extreme heat from temperature and humidity increases heat-related illnesses. Thus a longer term goal of this work is to combine spatial and temporal patterns of heat and land use with corresponding heat-related illness patterns to inform the County’s efforts to mitigate heat-related disease and inform its health programs.
Materials and methods
Environmental data derived from satellites as well as in situ data were selected to support the County plan to conduct thermal mapping that could then be used in a heat vulnerability assessment in comparison with initial health data on heat-related emergency department visits (Table 1).
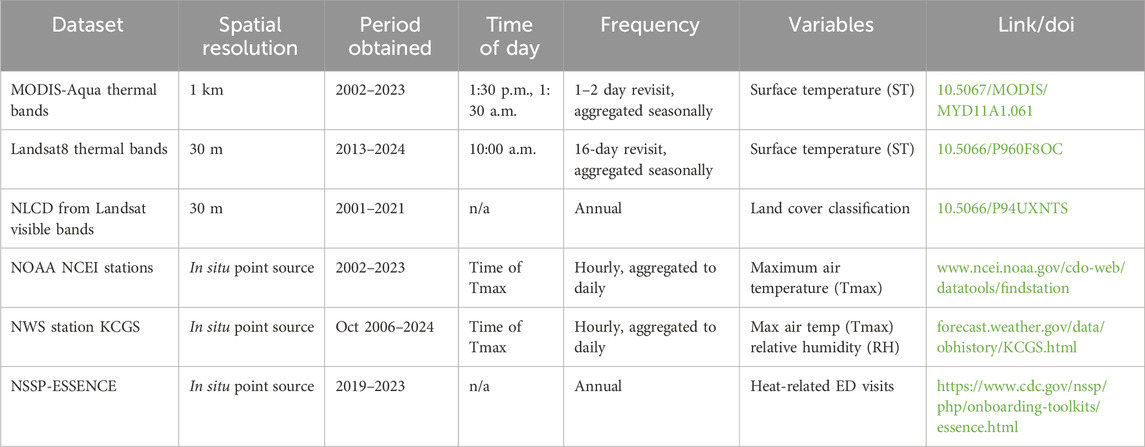
Table 1. Datasets used in this study with their attributes, variables, and sources.
Satellite-derived measurements
Geophysical measurements taken from space-based sensors can be obscured or biased by intervening atmospheric clouds, particles, or gases. While care must be taken to verify the absolute values of the measurements, there is greater confidence in their relative values for comparison over space and time. Thus our remote sensing analysis focused on changes in temperature and land cover more than absolute values.
Low-Earth orbiting satellites measure thermal infrared emissivity from which land surface temperature is derived. We use two different satellite-derived surface temperature records to calculate seasonal averages and anomalies to study spatial patterns and trends: MODIS-Aqua having spatially coarser 1 km bins with more frequent nearly daily revisit; Landsat8 having spatially finer resolution 30 m bins with less frequent 16 days revisit.
The NASA Moderate Imaging Spectroradiometer (MODIS) is an instrument on the sun-synchronous, polar-orbiting Aqua and Terra satellites, in operation for over 2 decades, with 36 spectral bands ranging in wavelength from 0.4 µm to 14.4 µm. Two bands are at a nominal resolution of 250-m at nadir, with five bands at 500-m, and the remaining 29 bands at 1 km. Terra launched in late 1999 with overflight at 10:30 a.m./p.m. local while Aqua launched in late 2002 with overflight at 1:30 a.m./p.m. local. For this study, we use MODIS-Aqua for its closer temporal proximity to maximum daytime heating and nighttime cooling. The MODIS-Aqua land surface temperature (LST) and emissivity daily level 3 1 km gridded data for 21 years between late 2002 and 2023 were retrieved from the Land Processes Distributed Active Archive Center (LP DAAC, 2014) Collection 6.1. We excluded pixels flagged as clouds by the atmospheric correction algorithm. LST values cooler than two standard deviations from the scene’s average LST were flagged as likely contaminated by thin clouds that were undetected and thus removed.
Over 22 years of MODIS-Aqua LST, 2002–2023, we calculated seasonal averages using standard definitions for the seasons: winter (December, January, February), spring (March, April, May), summer (June, July, August), fall (September, October, November). The summer average maps for both daytime and nighttime (Figure 2) show significantly warmer temperatures within the I-495 Capital Beltway portion of the County and along the I-95 corridor to the north during both daytime and nighttime. Average summer surface temperatures in urban areas are greater than 90°F during daytime and more than 10°F warmer than undeveloped areas. At night, urban areas are still 5–10°F warmer than undeveloped areas.
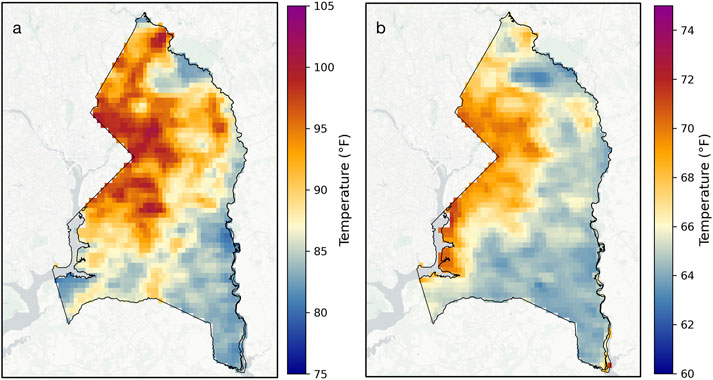
Figure 2. MODIS-Aqua daily surface temperature average for 1 km bins over 22 summers (JJA 2002–2023) for (a) daytime at 1:30 p.m. ET near diurnal maximum; (b) nighttime at 1:30 a.m. ET near diurnal minimum. Note different temperature scales between daytime, nighttime averages. Temperatures below 80°F are considered safe; heat stress caution at 80–90°F; extreme caution at 90–105°F; danger above 105°F. CARTO background.
The NASA/USGS Landsat thermal infrared (TIR) sensor has higher spatial resolution with a trade-off of less frequent revisits, at 100 m spatial resolution which is pansharpened to 30 m overpassing our region every 16 days (EROS, 2021). Radiance measurements of emissivity at two spectral bands between 10.60 and 12.51 µm are used to derive land surface temperatures in the absence of clouds. We downloaded, processed, and analyzed Landsat 8 Collection 2 Analysis Ready Data between 2014 and 2024 for cloud-free areas. Cloud-contaminated scenes were masked out or later detected by anomalously cool temperatures, defined as cooler than two-standard deviations, which were excluded. We analyzed the Landsat 30 m resolution land surface temperature during summer months (June, July, August) using the GIS methodology developed by the Prince George’s County staff, detailed in the Guide to Spatiotemporal Heat Analysis GIS Package (County GIS Guide, 2025). Landsat analyses were done by the County staff to explore summertime warming patterns within this region and the relation to land use changes. Summer surface temperature patterns were analyzed and mapped over 11 years between 2014 and 2024 following the process described in the County GIS Guide (2025). Data were first checked for missing data or outliers. Missing data are primarily caused by cloud-cover, approximately 25% of the time during summer, although 2020 had no cloud-free scenes.
Additionally, we removed anomalously cool data (<2 standard deviations of LST) as likely contaminated by thin, wispy clouds that were not detected by the cloud mask. All missing data for all years were filled through interpolation in space and time, adapted from Bennett et al. (2017) over the Prince George’s County for our analysis.
Annual National Land Cover Database (NLCD) Collection one is derived from Landsat visible wavelengths at 30 m spatial resolution between 1985 and 2023 (USGS, 2024), categorizing 19 land cover types including water, wetlands, forest, cultivated, and developed areas. For a quick assessment of changes, this study used annual NLCD maps from 2001 to 2021 to document land use changes over 20 years, grouping classifications as simply urban or non-urban. The four developed classifications (high intensity, medium intensity, low intensity, open space) were categorized as urban while all others were considered non-urban for the purpose of this analysis. We compared areas that changed to urban or non-urban over the 2 decades in comparison to their corresponding land surface temperature anomaly trends. For example, an area in Lanham became more urban between 2001 and 2021 while Patuxent Park and Piscataway Park were consistently non-urban over the study period.
In situ data for ground-truth and comparison with remote sensing
Without satellite data, the County is limited to using in situ air temperature data for its thermal assessment. To understand how the satellite-derived land surface temperatures compare to the in situ air temperatures, we compared daytime LST to the maximum daily air temperature (Tmax) at ground-stations. Within the NOAA weather station database, there are four temperature sensing sites across the County. The four stations locations are superimposed over MODIS LST at 1 km (Figure 3a). Not all months and years are available for the entire period of comparison (2002–2023): Beltsville data are available the entire time, College Park airport record began in 2006, Oxon Hill record ended in 2021, Marlboro record ended in 2016. For the satellite record, only days with a valid, cloud-free scene were used. Days with valid data for both records were used in the monthly averages: daily Tmax were averaged for each month and plotted with the monthly averaged MODIS daytime LST for the corresponding 1 km × 1 km bin (Figure 3b). Note that our method excludes cloudy days from the monthly averages that tend to be cooler for both records. In general, the MODIS daytime LST has warmer maxima, as land heats faster than air on clear days. A comparison of daily match-ups shows MODIS LST 12%–17% warmer, on average, than Tmax with significant correlation between the two (Supplementary Figure S1). For Beltsville match-ups, 2002–2023, N = 2,870, r = 0.88. For College Park, 2006–2023, N = 2,334, r = 0.95. For Oxon Hill, 2002–2021, N = 2,840, r = 0.89. For Marlboro, 2002–2016, N = 1867, r = 0.89.
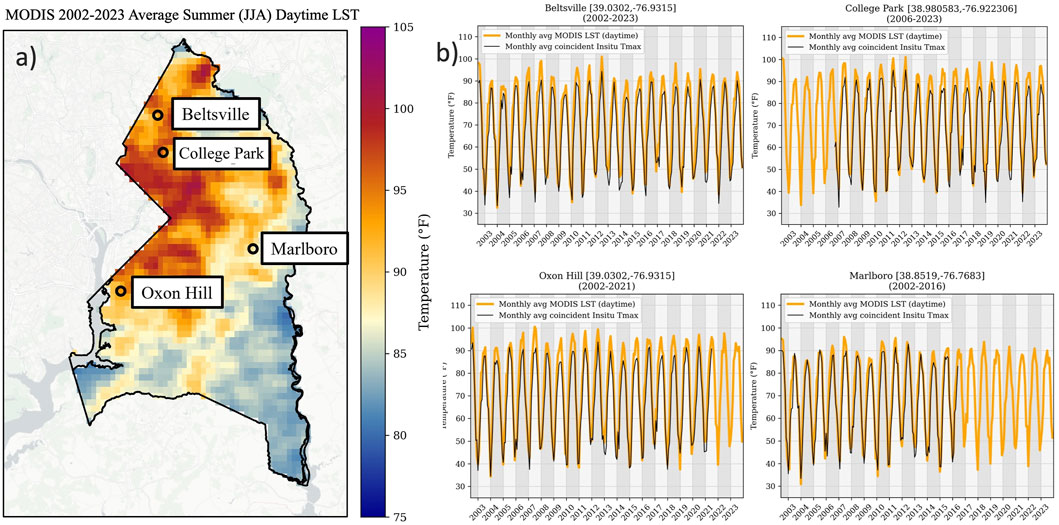
Figure 3. Comparison of MODIS LST with in situ station data: (a) in situ station locations superimposed on the 22-year average summer daytime LST; (b) monthly averaged MODIS LST compared to monthly average of daily Tmax at each in situ station: Beltsville (top left), College Park (top right), Oxon Hill (bottom left), Marlboro (bottom right). Only Beltsville had data during the entire timeseries. The College Park record began in 2006, while the Oxon Hill and Marlboro records ended in 2021 and 2016, respectively.
Heat stress guidelines are based upon absolute values of nose-level air temperature and humidity which we obtained here for comparison from ground-based measurements. The longest continuous ground station air temperature and relative humidity record in Prince George’s County is at the College Park Airport National Weather Service station KCGS (NOAA NCEI DSI 3505), with data available from October 2006 through the present. To calculate the daily maximum heat index for this location, we selected the maximum temperature from hourly readings and accompanying humidity. In cases where there were multiple humidity values for the same maximum temperature value, we took the median humidity value. We then applied the NOAA Heat Index Calculation (Rothfusz, 1990) for comparison to county health data, such as heat-related illness emergency department visits.
Rising temperatures pose risks to human health, especially for vulnerable populations such as young children and elderly adults. Heat-related illness includes heat stroke, heat exhaustion, rhabdomyolysis, heat syncope, heat cramps, and heat rash. These conditions occur when the body is exposed to extremely high temperatures and unable to sufficiently cool itself. The Centers for Disease Control and Prevention National Syndromic Surveillance Program-Electronic Surveillance System for Early Notification of Community-based Epidemics (ESSENCE) is a disease surveillance system for healthcare professionals developed by the Johns Hopkins University Applied Physics Laboratory. ESSENCE collects and monitors data from local health departments, pooling healthcare facility data from patient encounters, including emergency department (ED) and urgent care visits. Syndromic surveillance is utilized to identify trends to detect potential public health threats and national trends. For this study, the County Health Department accessed the Maryland ESSENCE, NOAA, 2024 system to analyze heat-related illness patient chief complaints to healthcare facilities in Prince George’s County. ESSENCE data prior to 2009 does not include all County ED visits; prior to 2017 is missing many urgent care facilities. Thus, annual heat-related patient chief complaint counts used in this study were limited to 2017–2024.
Results and discussion
Changes in temperature and land cover patterns
By studying where heat impacts are increasing most over the past decades, Prince George’s County can prioritize areas for mitigation. Through comparison of the MODIS seasonal land surface temperature anomalies at 1 km spatial resolution with NLCD land cover changes, several patterns emerge (Figure 4). For example, the area around Lanham became more urban between 2001 and 2021 and shows overall faster increased warming in the timeseries between late 2002 and 2023 than the two undeveloped nature preserve areas: Patuxent Park in the County’s north and Piscataway Park in its southwest corner, near the Potomac River.
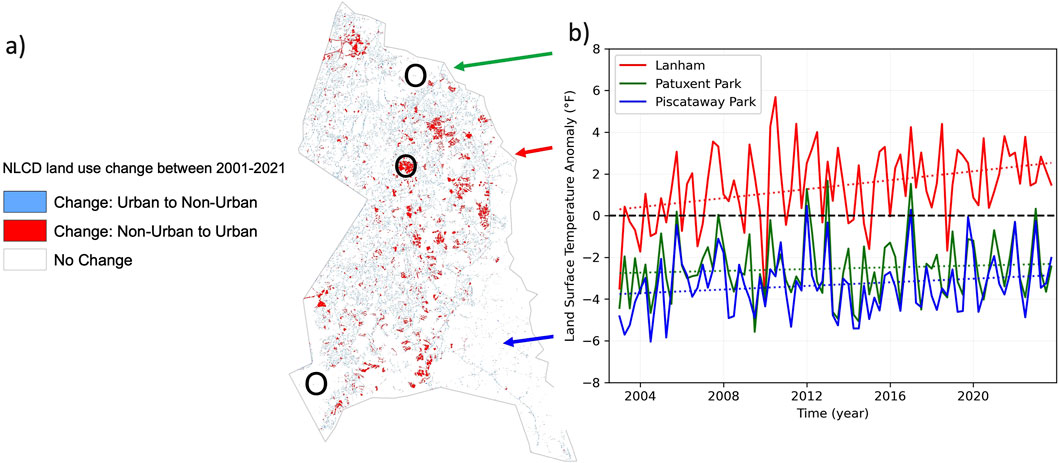
Figure 4. (a) National Land Cover Database (NLCD) land use change over 20 years (2001–2021) where red areas became more urban. Patuxent Park (←), Piscataway Park (←), and Lanham (←) are marked with O. Note that this map only shows changes, i.e., an urban area in 2001 that was still urban in 2021 would not be red; (b) seasonal land surface temperature anomalies from the 21-year average (2002–2023) over time calculated for the three areas annotated.
Emerging hot spot analysis
Analyzing the summertime average Landsat LST changes between 2014 and 2024, County staff identified areas by their warming patterns or hot spot type (Figure 5). These are further categorized by the duration of problematic criteria per the ArcGIS Emerging Hotspot Analysis Tool based upon the temporal trends associated with the hot spot (Esri, 2024; Prince George's County, 2025)
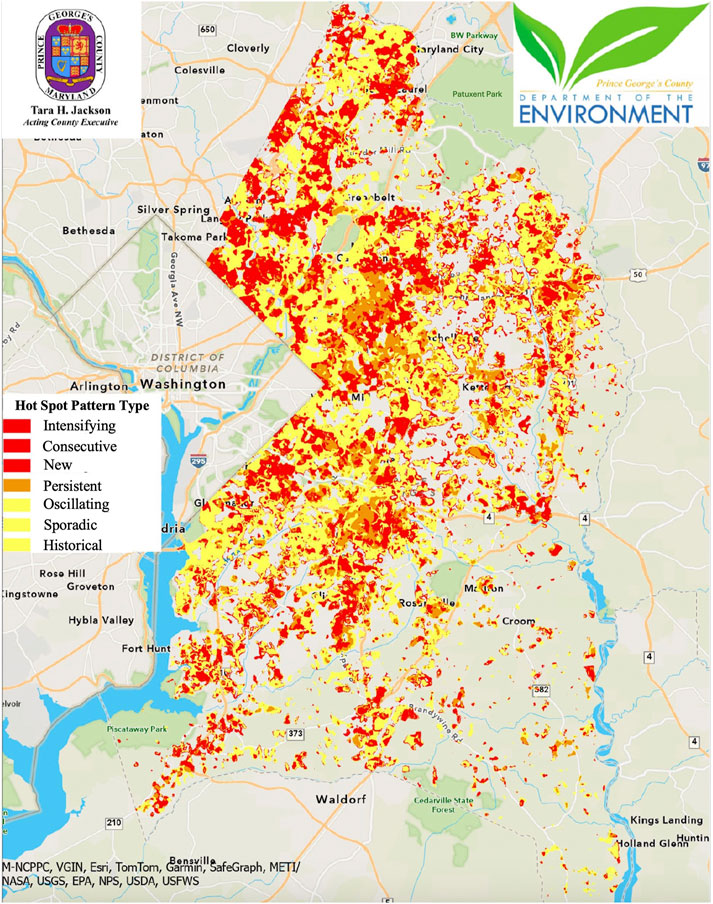
Figure 5. Warming areas within Prince George’s County from Landsat8 summertime surface temperatures between 2014 and 2024. Warming ‘hot spot’ trends as defined in the legend and Table 2. The background map is visible within Prince George’s County for areas that did not experience significant warming and for all areas outside the county.
The eight warming patterns, defined in Table 2, were classified into two subcategories. First tier consists of worsening warming patterns: intensifying, new, consecutive, and persistent hot spots. Second tier consists of sporadic, oscillating, historical, and diminishing hot spots which are patterns that warrant further monitoring to determine whether they are improving or worsening. Tracking the total acreage designated within these categories and any changes provides an indication of surface temperature trends and areas to prioritize for remediation efforts. Through this analysis, County staff identified first tier hot spots or problematic areas totaling 63,369 acres or approximately 20% of the county (Table 2), mapped in red and orange in Figure 5.
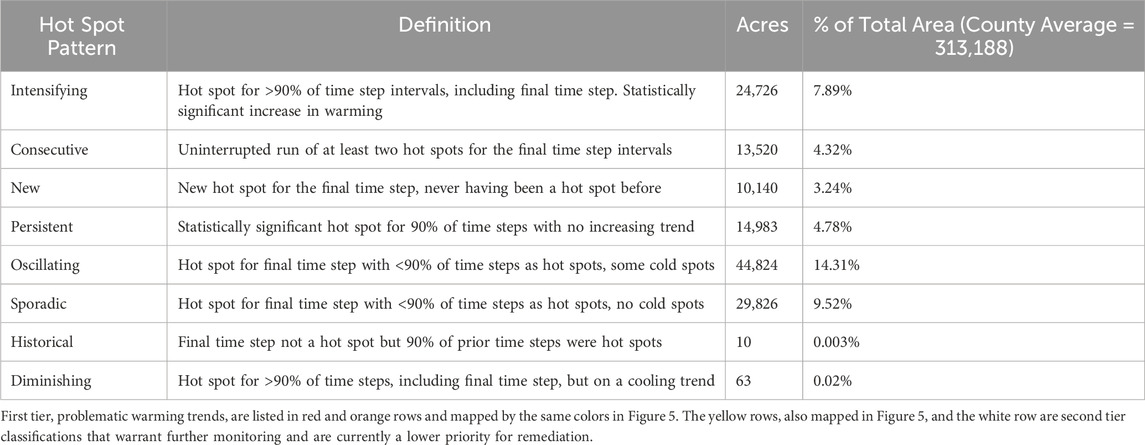
Table 2. Emerging hot spot pattern type (mapped in Figure 5), its definition, size in acres, and percentage of total area of Prince George’s County.
Of land owned by the County, where regulations mandate the use of best management practices, 4,647 acres (1.5% of total county area) were classified as first tier problematic areas that will be prioritized for nature-based solutions through land cover conversion to mitigate increasing heat in tandem with fulfilling existing stormwater management requirements. For example, our analysis identified the County landfill as a large area of intensifying heat (Figure 6). The landfill facility is a prime candidate for measures to remediate heat as well as stormwater runoff from its industrial activities.
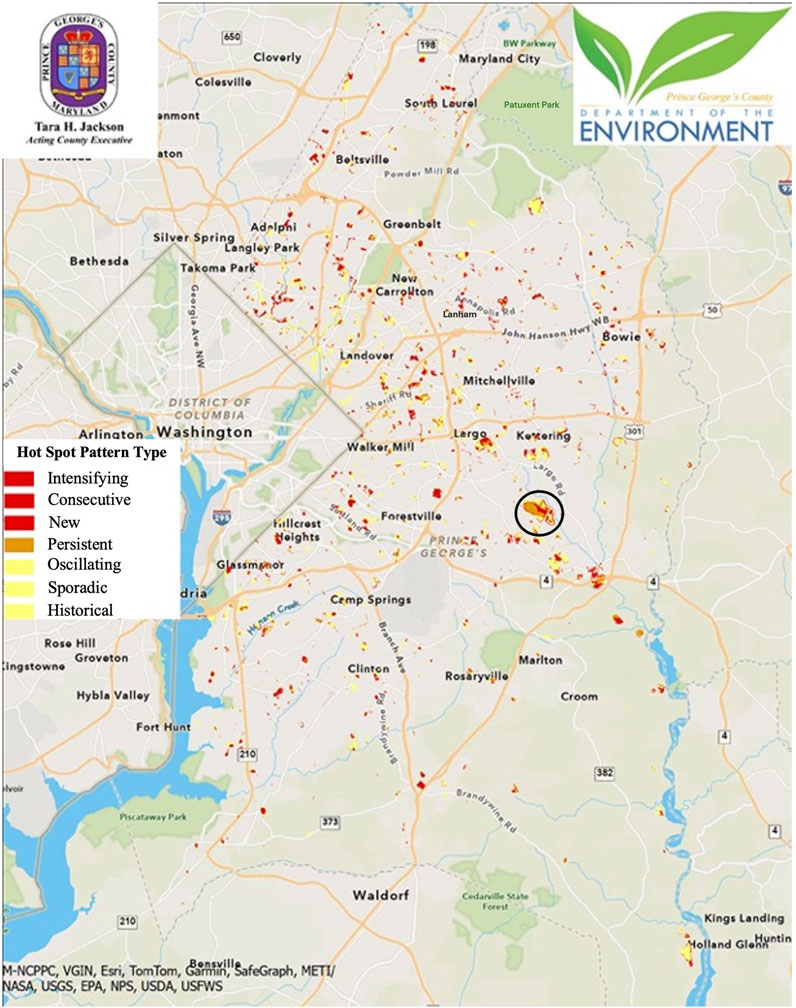
Figure 6. Warming areas (red shades) on county-owned land within Prince George’s County from Landsat8 summertime surface temperatures between 2014 and 2024. Warming ‘hot spot’ trends as defined in the legend and Table 2. Background map is visible outside of Prince George’s County and within the county for privately owned land or county-owned land that did not experience significant warming. The largest area of intensifying/persistent/historical warming on county-owned land over this timeframe is the landfill, the oblong red/orange/yellow shape circled near the center of the map.
This analysis is leveraged to help implement the County goals of building community-wide resilience to heat while also addressing stormwater management required by the state of Maryland and help fulfill the County’s National Pollution Discharge Elimination System permit requirements as regulated by the EPA. To do this, County staff will layer the thermal mapping analysis with additional data such as nuisance flooding areas to provide a way to rank problematic locations in order to prioritize areas for mitigation. Areas identified as having both a warming trend (hot spot) and flooding are considered more vulnerable. The key to building resilience to heat while simultaneously fulfilling existing stormwater management permits is understanding the connection between highly impervious areas, the incidence of urban heat islands, and polluted runoff. Replacing impervious land cover with natural cover, such as tree canopy or meadow, is increasingly recognized as a practical and cost-effective best management practice to reduce heat island temperature by reflecting more incoming radiation and cooling the air through evapotranspiration from vegetation. The conversion of impervious areas to natural cover will also create habitat, sequester carbon, reduce stormwater flooding, and reduce pollutant loads to downstream waterways.
Heat index calculations using College Park Airport maximum daily air temperatures and relative humidity measurements indicate variability in the number of days exceeding 90°F (heat stress caution), with recent summers having more days with extreme heat exceeding 105°F (Supplementary Table S1). Notably, 2022–2024 had 17°days with the heat index reaching 105°F or greater (heat stress danger level) compared with the prior 15°years having a cumulative total over all years of 18°days reaching the danger level. Annual heat-related illness chief complaints from both ED and urgent care visits in Prince George’s County reported to the Maryland ESSENCE-Syndromic Surveillance System 2017–2024, were compared to the annual number of days exceeding the heat stress threshold. Prince George’s County experienced more days above 90°F during 2021–2024: 45, 49, 43, 54, respectively, compared to ∼40°days per year 2017–2020 (Figure 7a); correspondingly, heat-related illness visits have been markedly higher since 2021 (Figure 7b).
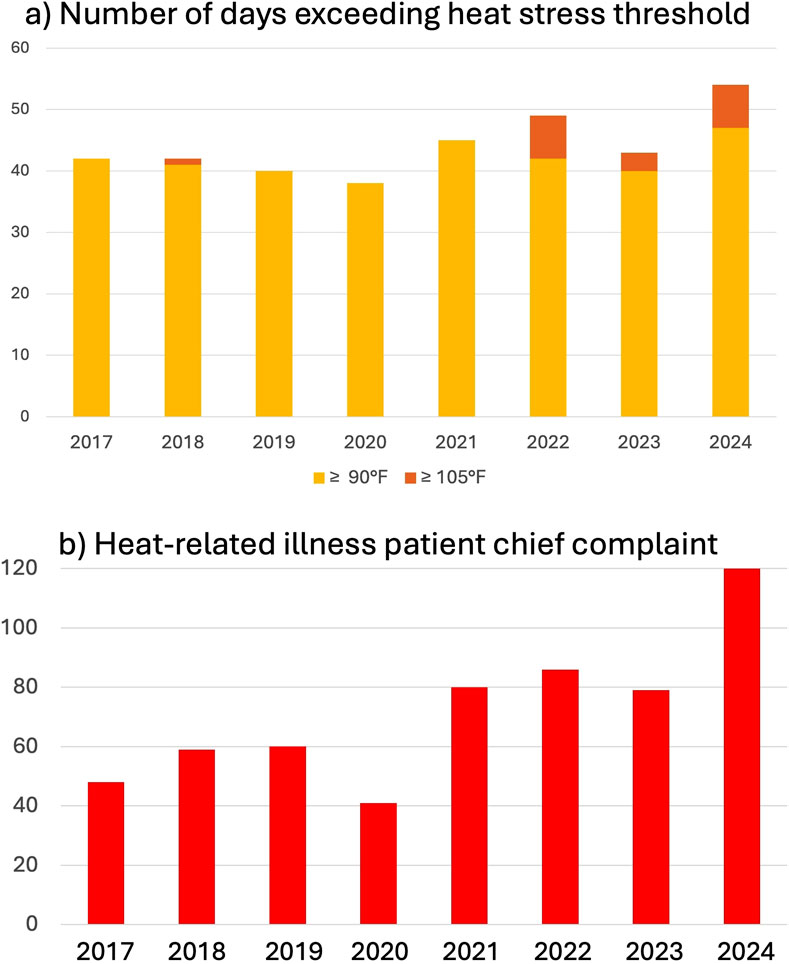
Figure 7. (a) Number of days each year exceeding heat stress thresholds for extreme caution (≥90°F) and danger (≥105°F) from heat index calculations using maximum air temperature and corresponding relative humidity from ground station measurements taken in College Park; (b) Heat-related illness patient chief complaints for Prince Goerge’s County ED and urgent care facilities from the Maryland-ESSENCE database for healthcare professionals, accessed by staff for this study.
The relationship between heat-related illness and emergency department hospital visits for heat stress is complex and varies by geographic region. Even with the close association between increased temperature, heat index, and heat-related illness, it can be difficult to determine causality, i.e., whether these factors alone contributed to chronic disease exacerbation, severity of heat-related illness, or death. Heat-related illness and exposure can also be influenced by demographic and preexisting determinants. However, mapping temperature trends will enable Prince George’s County staff to identify areas where hot spots overlap with higher proportions of specific health conditions or other vulnerabilities, for example, athletic fields or playgrounds. This allows the County to implement targeted interventions to reduce morbidity and mortality from extreme heat. Heat stress warnings are especially important to monitor for mitigating impacts upon outdoor workers and vulnerable populations, such as young children and elderly adults. If more dangerous heat is expected, the County can plan ways to reduce population exposure, e.g., provide cooling centers, schedule sports team practices or garbage collection earlier in the day before the heat index exceeds safe thresholds. With a better understanding of environmental stressors and their spatial distribution and trends through this study, strategies are being developed to reduce exposure to extreme heat, starting with the worsening hotspot areas identified on County-owned property.
Conclusion
The Prince George’s County Department of Environment and Health Department have begun to utilize temperature and other NASA environmental data to enhance spatial surveillance across the county. In addition, heat mapping data will be used to help track negative health impacts from the conversion of natural cover to impervious areas from land development activities. As part of the County’s overall planning process, significant land development projects are submitted to the Health Department for review and comment before evaluation and approval by the Prince George’s County Planning Board. The Health Department reviews projects to foster a healthy community. Locations of unmitigated heat or potential hot spots in the County could be incorporated into the agency’s development proposal reviews. With awareness of existing heat vulnerabilities, the Health Department can proactively provide recommendations to reduce impervious surfaces or conditions that may exacerbate heat islands. The Planning Board can then factor heat vulnerability with other recommendations when evaluating a project for approval. In addition to reducing exposure to heat stress, protecting the community from communicable and vector borne disease is another priority. Identifying areas with sustained high temperatures and standing water may indicate potential mosquito breeding sites. Targeted surveillance and sampling can inform early intervention before mosquito populations increase. Together with community outreach and education efforts, proactive mitigation guided by temperature patterns and trends along with other federal data, can aid the County in its effort to reduce the incidence of communicable and vector borne diseases.
NASA has a broad portfolio of observations and models that can be used by local governments as they build resilience against warming, flooding, and other environmental stressors. The planned Surface Biology and Geology mission (Stavros et al., 2022), launching in the next 5 years as part of the Earth System Observatory, will ADD includes a thermal sensor at moderate spatial resolution and more frequent revisit, important for monitoring diurnal variation of extreme heat. Accessible data relevant to the climate vulnerabilities of a particular location is key to developing solutions. Providing federal data for county government use has not historically been a focus of NASA, where we study our planet to understand global systems, forcing mechanisms, and changes. Yet much of our coarse, global data has the potential to be useful for local practitioners. What we have learned from assessing local community needs and limitations is shared so that other jurisdictions can similarly access publicly available NASA data to inform their decisions around heating patterns and trends.
Data availability statement
Data sources are listed in Table 1. Additionally, the following resources were created to help others replicate these results or adapt them to different communities: NASA Heat Product Guide for data background and access: https://doi.org/10.5281/zenodo.14994075 MODIS processing and comparison of satellite and in situ data: https://github.com/ssmith8503/MODISLST_anomalies Landsat processing via Prince George’s County Guide to Spatiotemporal Heat Analysis GIS Package: http://doi.org/10.5281/zenodo.14582590.
Author contributions
SSU: Writing – original draft, Writing – review and editing, Conceptualization, Data curation, Investigation, Methodology, Funding acquisition, Resources, Supervision. KCS: Writing – original draft, Writing – review and editing, Data curation, Formal Analysis, Visualization, Validation. SLS: Writing – original draft, Writing – review and editing, Data curation, Formal Analysis, Visualization, Software, Validation. DMC: Writing – original draft, Writing – review and editing, Data curation, Formal Analysis. JR: Writing – original draft, Writing – review and editing, Data curation, Formal Analysis. EHH: Writing – original draft, Writing – review and editing, Data curation, Formal Analysis.
Funding
The author(s) declare that financial support was received for the research and/or publication of this article. This project was supported by the NASA Climate Resilience program. Prince George’s County Department of Environment staff Charles Braese and consultant Cortney Gustafson contributed graphics, analysis, and write-up to this manuscript along with Mary Abe who oversaw their effort and contributed to the analysis and write-up. The findings and conclusions in this report are those of the authors and do not represent the official position of the National Aeronautics and Space Administration or Prince George’s County, Maryland.
Acknowledgments
We are grateful to two reviewers whose comments and suggestions improved this paper.
Conflict of interest
Author SaS was employed by Science Systems and Applications, Inc. as a contractor to NASA GSFC.
The remaining authors declare that the research was conducted in the absence of any commercial or financial relationships that could be construed as a potential conflict of interest.
Generative AI statement
The author(s) declare that no Generative AI was used in the creation of this manuscript.
Publisher’s note
All claims expressed in this article are solely those of the authors and do not necessarily represent those of their affiliated organizations, or those of the publisher, the editors and the reviewers. Any product that may be evaluated in this article, or claim that may be made by its manufacturer, is not guaranteed or endorsed by the publisher.
Supplementary material
The Supplementary Material for this article can be found online at: https://www.frontiersin.org/articles/10.3389/fenvs.2025.1561526/full#supplementary-material
References
Amos, H. M., Skaff, N. K., Schollaert Uz, S., Policelli, F. S., Slayback, D., Macorps, E., et al. (2023). Public health data applications using the CDC tracking network: augmenting environmental hazard information with lower-latency NASA data. GeoHealth 7, e2023GH000971. doi:10.1029/2023GH000971
Anyamba, A., Chretien, J.-P., Britch, S., Soebiyanto, R. P., Small, J. L., Jepsen, R., et al. (2019). Global disease outbreaks associated with the 2015–2016 El niño event. Nat. Sci. Rep. 9, 1930. doi:10.1038/s41598-018-38034-z
Bennett, L., Dacosta, J., and Vale, F. (2017). Esri events, spatial data mining II: a deep-dive into space-time analysis. Available online at: https://www.youtube.com/watch?v=0aV6HHwJuo4&t=1612s.
Clinton, N., and Gong, P. (2013). MODIS detected surface urban heat islands and sinks: global locations and controls. Sens. Env. 134, 294–304. doi:10.1016/j.rse.2013.03.008
Earth Resources Observation and Science (EROS) Center (2021). Landsat 8 U.S. analysis ready data, collection 2 surface temperature. U.S. Geol. Surv. doi:10.5066/P960F8OC
Esri (2024). ArcGIS pro 3.4, how emerging hot spot analysis works. Available online at: https://pro.arcgis.com/en/pro-app/latest/tool-reference/space-time-pattern-mining/learnmoreemerging.htm (Accessed 1 November 2024).
Hulley, G., Shivers, S., Wetherley, E., and Cudd, R. (2019). New ECOSTRESS and MODIS land surface temperature data reveal fine-scale heat vulnerability in cities: a case study for Los Angeles county, California. Remote Sens. 11, 2136. doi:10.3390/rs11182136
Johnson, D. M., Rosales, A., Mueller, R., Reynolds, C., Frantz, R., Anyamba, A., et al. (2021). USA crop yield estimation with MODIS NDVI: are remotely sensed models better than simple trend analyses? Remote Sens. 13 (21), 4227. doi:10.3390/rs13214227
LP DAAC. (2024). Land processes distributed active archive center (LP DAAC) collection 6.1 MODIS-aqua land surface temperature/emissivity daily (MYD11A1) version 6.1. doi:10.5067/MODIS/MYD11A1.061
Maryland ESSENCE. Office of preparedness and response. Maryland Department of Health. Available online at: https://essence.health.maryland.gov/.
Maryland Institute for Applied Environmental Health University of Maryland, College Park (MIAEH) (2016). Maryland climate and health profile report. Available online at: https://mde.maryland.gov/programs/Marylander/Documents/MCCC/Publications/Reports/MarylandClimateandHealthProfileReport.pdf (Accessed 6 December 2024).
NASA (2024a). Earth science to action strategy. Available online at: https://science.nasa.gov/earth-science/earth-science-to-action/ (Accessed 1 November 2024).
NASA (2024b). NASA analysis confirms 2023 as warmest year on record. Available online at: https://www.nasa.gov/news-release/nasa-analysis-confirms-2023-as-warmest-year-on-record/ (Accessed 1 November 2024).
NASA (2025). Temperatures rising: NASA confirms 2024 warmest year on record. Available online at: https://www.nasa.gov/news-release/temperatures-rising-nasa-confirms-2024-warmest-year-on-record/ (Accessed 10 January 2025).
NOAA (2024). “NOAA climate data online, station details,” in College park airport, MD US. Available online at: https://www.ncdc.noaa.gov/cdo-web/datasets/LCD/stations/WBAN:00358/detail (Accessed 10 May 2024).
Prince George’s County (2022). Maryland draft climate action plan. Available online at: https://issuu.com/environment.mypgc.us/docs/draft_climate_action_plan_01-15-2022 (Accessed 6 December 2024).
Prince George’s County (2025). Guide to spatiotemporal heat analysis GIS package (county GIS guide). doi:10.5281/zenodo.14582590
Sangiorgio, V., Fiorito, F., and Santamouris, M. (2020). Development of a holistic urban heat island evaluation methodology. Sci. Rep. 10, 17913. doi:10.1038/s41598-020-75018-4
Stavros, E. N., Chrone, J., Cawse-Nicholson, K., Freeman, A., Glenn, N. F., Guild, L., et al. (2022). Designing an observing system to study the surface biology and geology (SBG) of the Earth in the 2020s. J. Geophys. Res. Biogeosciences 128. doi:10.1029/2021JG006471
Tebaldi, C., Debeire, K., Eyring, V., Fischer, E., Fyfe, J., Friedlingstein, P., et al. (2021). Climate model projections from the scenario model intercomparison project (ScenarioMIP) of CMIP6. Earth Syst. Dynam. 12, 253–293. doi:10.5194/esd-12-253-2021
Thrasher, B., Wang, W., Michaelis, A., Melton, F., Lee, T., and Nemani, R. (2022). NASA global daily downscaled projections, CMIP6. Sci. Data 9, 262. doi:10.1038/s41597-022-01393-4
U.S. Geological Survey (USGS) (2024). Annual NLCD collection 1 science products: U.S. geological survey data release. doi:10.5066/P94UXNTS
Keywords: heat, land surface temperature (LST), land use, land cover change, heat stress, satellite remote sensing, thermal map analysis
Citation: Schollaert Uz S, Stover KC, Smith SL, Collier DM, Riley J and Hoban EH (2025) Applying global NASA data to local planning for extreme heat in Prince George’s County, Maryland. Front. Environ. Sci. 13:1561526. doi: 10.3389/fenvs.2025.1561526
Received: 16 January 2025; Accepted: 16 June 2025;
Published: 09 July 2025.
Edited by:
Jill Brandenberger, Pacific Northwest National Laboratory (DOE), United StatesReviewed by:
Jill A. Engel-Cox, University of Colorado Denver, United StatesAmy Mueller, Northeastern University, United States
Copyright © 2025 Schollaert Uz, Stover, Smith, Collier, Riley and Hoban. This is an open-access article distributed under the terms of the Creative Commons Attribution License (CC BY). The use, distribution or reproduction in other forums is permitted, provided the original author(s) and the copyright owner(s) are credited and that the original publication in this journal is cited, in accordance with accepted academic practice. No use, distribution or reproduction is permitted which does not comply with these terms.
*Correspondence: Stephanie Schollaert Uz, c3RlcGhhbmllLnV6QG5hc2EuZ292