 Amy E. Solana*
 Andrea R. Mott
 David M. Anderson
 Christopher R. Niebylski
 Paelina J. DeStephanoMark R. Weimar
- Pacific Northwest National Laboratory, Richland, WA, United States
While strategies to achieve net-zero emissions at an individual site are well understood, new analysis methods are required for organizations seeking to achieve net-zero across multiple facilities, each with concurrent priority goals. At a portfolio level, distinct locations present varied challenges that cannot be addressed through singular solutions, and competing goals can take precedence with the assumption that net-zero emissions strategies deter from energy resilience and cost savings, therefore negatively impacting nearby communities. This study tests these assumptions by analyzing 16 diverse sites (varying in size, climate, and energy use) to identify strategies that reduce emissions and assess the impact these strategies have on life cycle costs, resilience, and communities with environmental justice concerns. Methods were developed to approximate missing information essential to net-zero evaluation. Established methods were augmented to evaluate life cycle costs, resilience, and environmental justice impacts across a set of strategies and accommodate the multi-criteria analyses. Potential benefits from identified strategies were quantified using site characteristics and a set of corresponding metrics. The net-zero analysis found that 11 sites could use on-site strategies to eliminate all but 2% of emissions generated. The remaining emissions can be offset, for instance through sequestration, executed at the portfolio scale. On-site carbon-free energy was found to reduce 51% of emissions across all sites; efficiency reduced 19% of emissions; sequestration 16%; procured carbon-free energy 15%; fuel switching 1.6%; and fleet electrification 1.3%. Building electrification, however, increased emissions by 4.4%. Different strategies also provide cost, resilience, and/or environmental justice benefits—the degree to which varies with individual site conditions. The findings indicate an advantage to considering the strategies as a comprehensive set, which leads to co-benefits, both in the ability to achieve net-zero goals and in advancing other goals. The results present the case for comprehensive advanced planning at the portfolio level to prioritize investments that will balance the minimization of emissions and life cycle cost with the maximization of resilience and environmental justice benefits. The novel methods for evaluation and integration, valuation of benefits, and consideration at the portfolio scale allow organizations to select investments that simultaneously address multiple key priorities.
1 Introduction
Global emissions are causing increasingly destructive extreme weather events that can devastate lives and livelihoods (Ebi et al., 2021; Yang et al., 2021). One response to this issue by the United States government was Executive Order (EO) 14,057, Catalyzing Clean Energy Industries and Jobs Through Federal Sustainability, which required the federal government to meet net-zero emissions by 2050 (2021). Federal agencies, which often have large portfolios of buildings, were directed to work toward this goal while executing their mission and meeting other goals and requirements. The ability and impact of sites achieving net-zero status must be understood within the context of these other objectives to enable agencies to optimize opportunities and minimize negative consequences.
Federal agencies face unique challenges in developing and implementing emissions reduction plans. While decarbonization studies often focus on decarbonizing a sector or a geographic unit, such as a nation, state, or city, federal agencies must contend with reducing emissions at geographically diverse sites operating in distinct state and local policy environments (Linton et al., 2022). Each site has unique characteristics, including grid emission factors, utility costs, electric and thermal energy needs, renewable energy potential, and state policies. While some research has investigated decarbonization of individual buildings, dispersed building portfolios, and large regions or countries, there is a distinct lack of literature on site-wide decarbonization, which includes buildings, fleet, fugitive emissions, and other sources within a defined geographical boundary (Ruparathna et al., 2017; Betz et al., 2024; Azevedo et al., 2021). Other research has investigated the life cycle costs of multiple project benefits, including emissions reduction and occupant impacts; however, non-monetary benefits have not been quantified (Bleyl et al., 2019; Weerasinghe et al., 2024). Further, community reactions and environmental justice (EJ) are topics that have been considered, but not in the context of impacts of specific actions by a site or organization on its surrounding community (Nwadiaru et al., 2025; Kainiemi et al., 2025). Research on the impacts of net-zero actions on energy and water resilience of a site is lacking.
This research by Pacific Northwest National Laboratory addressed three of the research gaps indicated by Weerasinghe, et al. (2024). First, this research studied different methods to reduce emissions and achieve net-zero status at sites with diverse characteristics and vague details. The selected strategies, combined with the site characteristics, were used as the basis from which to examine the relationship between net-zero goals and other goals, including resilience, EJ, and life cycle cost reduction. The methods developed to establish baselines and calculate strategy outcomes for sites with unknown variables, as well as to assess the corresponding impacts of strategies, were tailored and developed to be repeatable. The results of this research can improve organizations’ understanding of working toward net-zero goals and also help them determine where and how net-zero strategies can be implemented to achieve various goals and requirements.
It is well established in the literature that energy efficiency is a useful first step in reducing emissions, as it can inform other strategies like on-site carbon-free energy (CFE) sizing (Levesque et al., 2023). Electrification is also a well understood priority in emissions reduction pathways because it is a necessary precursor to reducing emissions through CFE (Steinberg et al., 2017; Nam and Jin, 2021). These strategies, for example, have been shown to be important in reducing emissions; however, their combined impacts on resilience and EJ are not well documented. This research shows how a variety of established net-zero emissions strategies can be used together to achieve net-zero emissions while also reducing cost and negative impacts on local communities and simultaneously improving energy and water resilience while evaluating a method for quantifying these benefits.
To accomplish these objectives, this paper presents the methodologies and findings of net-zero emissions feasibility assessments for 16 diverse federal sites in the United States, including the life cycle costs and the impacts on resilience and communities with EJ concerns. While this paper focuses on U.S. federal sites, the analysis may be applicable to any organization with multiple sites and operational goals.
2 Materials and methods
First, the term “net-zero emissions” was defined for federal sites and study sites were identified. Then, the team developed an emissions baseline for each site to evaluate and select solutions that reduce emissions to zero. Finally, the impacts of the selected solutions were measured according to appropriate metrics for resilience and EJ. These measurements informed estimated costs, providing a suite of information to facilitate informed decision-making by agency leadership.
2.1 Baseline
This study leveraged the EO 14057 net-zero definitions and characterizes net-zero emissions as “zero greenhouse gas (GHG) emissions based on an annual accounting of Scope 1 and 2 GHG emissions and in accordance with the Federal Greenhouse Gas Accounting and Reporting Guidance” (FR 70935, 2021). GHG emissions include CO2, CH4, N2O, and F-gases.
The research team selected 16 campus-scale locations across six U.S. climate zones, ranging from hot-humid to cold-dry, with a range of existing energy profiles. The energy use intensity (EUI) of the sites ranged from 22 to 234 kBtu/sq. ft. and fuel types included grid electricity, natural gas, fuel oil, propane, coal, electricity from biomass, landfill gas, solar photovoltaics (PV), and hydropower in varying sizes (3 million to 24 million sq, ft. of building floor area and 800 to 974,000 acres of land area). These sites represent a cross section of portfolio attributes; some appear to have characteristics suitable for net-zero status (e.g., high resource potential for CFE generation, supportive regulatory environment) and others have characteristics that likely will make net-zero status challenging (e.g., fossil fuel production on site). With this wide range of properties represented, the assessment provides a broad set of conditions that could apply to other sites and could provide an understanding of how to implement net-zero emissions strategies for an agency’s entire portfolio.
Net GHG emissions baselines were calculated for each site (Equation 1) to determine the amount of emissions that must be eliminated to achieve net-zero status, and from which sources. The net-zero boundary was defined as the physical border of the site, and fiscal year (FY) 2022 was used as the baseline year.
CFE energy generation (on-site or procured from off-site) must retain energy attribute certificates to count toward emissions reduction, in accordance with the EO 14057 implementing instructions (FR 70935, 2021). Environmental attribute credits can reduce Scope 2 emissions but not Scope 1 emissions.
Each site’s Scope 1 and 2 emissions baseline was calculated from summing building emissions, vehicle fleet emissions, and fugitive emissions. The sections below describe the baseline calculations for buildings and fleet energy. Fugitive emissions from the unintentional release (often leaks) of GHGs from within a site’s boundary were assumed to be equal to 2% of each site’s emissions from buildings and fleet, based on assumptions from previous Federal Energy Management Program (FEMP) data (DOE, 2025c). Emissions were calculated following the U.S. Environmental Protection Agency (EPA) Federal Automotive Statistical Tool (FAST) and GHG protocol baselining methodology using EPA’s stationary combustion emission factor and eGRID subregional emission factor tools (EPA, 2022b; EPA, 2022a). All emissions were calculated in metric tons of carbon dioxide equivalent (CO2e) according to the EPA’s 2022 emission factors (EPA, 2022b). Although the emissions baseline year is FY22, fleet data was only available for FY21. The methodology used follows the “Federal Greenhouse Gas Accounting and Reporting Guidance” (Council on Environmental Quality, 2016).
2.1.1 Building emissions baseline
The building energy emissions calculation is based on FY22 FEMP data, which includes annual consumption by fuel type (DOE, 2025c). Emissions were calculated by multiplying the energy use, by fuel type, by the corresponding emission factor (Equation 2).
where i = Fuel type. Ei = Energy consumed of fuel type i; and EFi = Emission factor for fuel type i, in units of metric tons CO2e/energy unit.
Combustion emission factors for building energy use were calculated using the EPA’s 2022 stationary combustion emission factors and combined to form metric tons of CO2e (EPA, 2022b). Electricity emissions are calculated using eGRID subregional data, using the output emissions rates for CO2e. Sites are mapped to an eGRID subregion, based on their zip code (EPA, 2022a). The emission factors used a range from 0.31 to 0.72 metric tons of carbon dioxide equivalent (MTCO2e) per megawatt-hour.
For most sites, reported fuel use was assumed to be primarily for building-level heating. Four sites have fuel-fired combined heat and power (CHP); details from site-specific information were used to make assumptions regarding the amount of reported fuel used for CHP and each plant’s relative electrical output. Most sites prioritized electric over thermal CHP output.
2.1.2 Fleet emissions baseline
Fleet emissions were calculated by multiplying vehicle energy consumption by the fuel’s corresponding emission factor. Baseline asset-level fleet energy data was obtained from FAST. One site’s fleet data was not provided, so the research team imputed data based on the relationship between fossil fuel fleet energy use and total site energy use based on similar sites. Site energy use was found to be the best predictor of fossil fuel fleet energy use based on the data from the other sites in this study. All FAST data is from FY21 except for one site, in which the most recent available data was from FY19.
Mileage, volume (in gasoline gallon equivalent or GGE), and fuel type were provided for each vehicle. The FAST data had discrepancies between mileage and volume, with apparent inconsistencies in recording both data points, which could be caused by a variety of reporting issues (e.g., response or non-response errors or processing errors). Given the direct link between fuel volume and emissions, this analysis assumed the reported volume to calculate emissions.
The FAST data reports fuel type based on the type of fuel accepted rather than the type of fuel used. The data includes bi-fuel vehicles, which can use gasoline or another fuel, such as compressed natural gas, electricity, or liquified petroleum gas, and flex fuel vehicles, which can use either gasoline or E85—a high-level ethanol-gasoline blend containing 51%–83% ethanol. This analysis assumed that both vehicle types use gasoline. Despite having a lower emission factor, E85 has lower energy density, making the emissions per GGE roughly equivalent to gasoline.
The volume reported in GGE was converted to liquid volume using federal fuel conversion factors and the corresponding CO2 emission factor was used to calculate emissions for non-electric vehicles (DOE, 2025a; EPA, 2022b). Energy and resulting emissions from electric vehicles were captured in the buildings baseline since they charge from the same meter that provides building electricity. CO2 comprises the majority of GHG emissions from vehicles. Based on the literature, a 3% adder was applied to fossil fuel CO2 emissions to represent CH4 and N2O emissions to calculate CO2e (Nam et al., 2004; Hoekman, 2020).
2.2 Net-zero strategies
Five key strategies were investigated to reduce emissions for each site, including energy efficiency, on-site CFE generation, building electrification, fleet electrification, and CFE procurement. Fugitive emissions strategies were considered but not quantified due to a lack of data. Emissions offsets and sequestration were not considered at the site level due to agency priorities.
2.2.1 Energy efficiency
Lacking a full building energy assessment, the energy reduction that may be achieved from energy efficiency measures in buildings was estimated based on a benchmark analysis of each site’s FY22 EUI and any other available information on efficiency efforts at the site. The benchmark analysis compared the site’s EUI (using federal portfolio-wide energy and square footage reporting to calculate a kBtu/sq. Ft. value) to EUI data collected by ENERGY STAR® Portfolio Manager1. The comparison was done using building types because the amount of energy use varies significantly by building type.
ENERGY STAR® Portfolio Manager compiles self-reported energy use information, including 25th, 50th, 75th, and 95th percentile EUIs by building type and climate zone (ENERGY STAR, 2025). Each building for every site was assigned an ENERGY STAR® building type to evaluate its expected energy use at each EUI percentile. Then, the total square footage of each building type was multiplied by the various EUIs to estimate energy use for all buildings at each percentile. These totals were compared to the total energy consumption reported in FY22, allowing an understanding of how efficient the buildings across a site may be (Equation 3). Estimates had to be made if a building type did not precisely align with existing ENERGY STAR® categories, and energy use not associated with a building could not be estimated.
where i = Building type (matching ENERGY STAR® building types); EUIi = Assumed EUI (kBtu/sq. ft.) of building type i, based on ENERGY STAR® EUI percentiles and adjusted so the equation equals the site’s total building energy consumption; SFi = Square footage of building type i; and E = Site energy consumption.
The FY22 site EUIs were compared to the ENERGY STAR® proxy site EUI percentiles. Comparing these values, the site’s EUI rank can be estimated. This indicates whether the site is generally efficient given its climate and mix of building types. A lower percentile rank indicates the site is more efficient than a higher percentile rank. The relative efficiencies of the 16 sites appear to be evenly spread, with 2 – 5 sites falling within each percentile range.
Sites with higher energy use rankings likely have more potential for energy reduction, while sites with lower energy use rankings currently perform near the top of their peer locations and may have limited opportunities. The difference between the site’s current EUI and the 25% EUI was used as a starting point for estimating energy savings potential from efficiency measures (25% was considered a reasonable target for high efficiency). For instance, one site had an EUI of 45 kBtu/sq. ft. in FY22, but the top 25% of sites with similar building mixes and climate would have an EUI of 14 kBtu/sq. ft. To reach this 25% ranking, this site would need to reduce energy use by 69%.
Rather than assume every site can achieve the 25th percentile, factors, including recently completed efficiency projects and historical energy trends, were considered to determine a more realistic energy efficiency potential.
Appropriate building energy efficiency measures for each site were selected from a list of commonly implemented projects for building systems, such as lighting, heating and cooling, envelope, hot water, and plug and process loads. (Energy savings from electrification is elaborated on in the Electrification section of this paper. A savings of 10% was assumed for all process loads. Maximizing efficiency is critical for reaching net-zero status; however, site-specific information is required to determine all appropriate measures, including common and unique opportunities.
The estimated energy reduction amount was then multiplied by the relevant emission factor to calculate emissions savings.
2.2.2 On-site CFE generation
The emissions reduction from on-site CFE was calculated by multiplying the potential energy generation (by fuel type) by the corresponding eGRID emission factors. This study evaluated each site’s potential for using various resources to generate electricity or thermal energy, including solar, wind, geothermal, nuclear, hydroelectric, and marine energy; used resource availability and land availability; and factored in regulatory support for nuclear reactors to determine potential. Because the authors of this study aimed to evaluate a range of realistic net-zero solutions, on-site CFE strategies for each site were selected through the following criteria:
• At least one site was selected for each possible CFE source.
• No more than two CFE resources will serve a site.
CFE resource screenings were conducted for solar PV, wind turbines, binary cycle power plants, enhanced geothermal systems, advanced microreactors (AMRs), hydroelectric dams, wave energy converters, and tidal energy converters. The assumptions regarding the specific technology used with each resource, minimum resource requirements, and space requirements align with standard values found in literature and databases used by renewable energy installers. These are documented in the supplemental table.
To determine the amount of land that might be available for CFE development at each location in this study, land cover across sites was evaluated based on raster files from the U.S. Geological Survey National Land Cover Database (USGS, 2024). Each land cover type in the database was categorized according to development potential, with only a certain percent of each type assumed to be available for development. The total area of each identified land cover type within the boundaries of each site was summed, and then the availability factor for each type was applied to determine the total developable area for CFE. Operational and land use conflicts were not considered due to lack of information.
The percent availability assumptions varied by CFE type, as shown in Table 1. Some land cover types were assumed to be 100% available, and parcel shapes that may not be conducive to development of certain CFE systems were ignored. For instance, a wind turbine needs undeveloped space in a circular area around the base; these calculations do not differentiate between thin rectangular parcels that may not have the required clearance and circular parcels that do. Smaller percents of land availability were assumed for other land cover types due to the ability to clear land (e.g., forests or crops) and conflicting land use. For example, some developed open space, like a landfill, may be suitable for PV panels; however, other developed open space, like a golf course, may not be. These assumptions were not informed by other land use conflicts, such as operational activities, or other development restrictions like environmentally protected land. Furthermore, identification of available land was not optimized based on factors such as proximity to transmission lines.
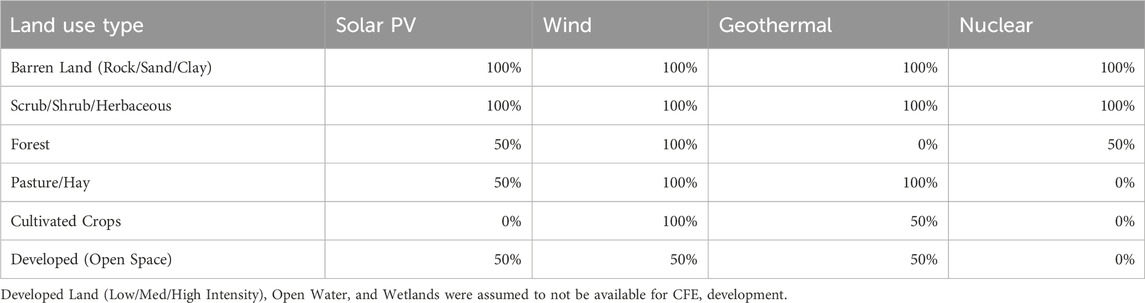
Table 1. Assumed % of land cover type available for CFE development.
The calculated quantities of potentially available land for each site, coupled with the CFE resource generation potential (i.e., kWh/acre), resulted in a total amount of generation that may be possible at each site. In many cases, this amount was well over the site’s FY22 consumption. CFE types were selected for each site’s net-zero plan by evaluating the analysis results with the selection criteria outlined at the beginning of this section. The resulting CFE types that were selected for net-zero emissions analysis at each site were dominated by solar PV (12 sites), followed by three AMR sites, a combination of wind and solar PV at two sites, and geothermal, used for both thermal and electric energy generation, at one site.
2.2.3 Electrification and fuel switching
Electrification and other forms of fuel switching were applied to three main energy end uses in this analysis, including buildings, fleet, and industrial processes.
Three main types of building electrification strategies were assessed for feasibility: (1) switching from individual boilers to heat pumps, including air source or ground source heat pumps; (2) switching from centralized steam/hot water to heat pumps; and (3) switching fuel-fired warehouse heating to electric radiant heating. Domestic hot water heating comprised a small amount of site gas consumption compared to heating; this was accounted for in intentionally conservative electric equipment efficiency estimates. An average air source heat pump has a coefficient of performance (COP) of 2.6; this study assumed a COP of 2.0 to account for various climates and the variety of energy systems being converted to heat pumps. Ground source heat pumps tend to have higher efficiencies, with COPs closer to 4.0. This analysis assumed a COP of a more inefficient air source heat pump to be conservative, meaning actual energy savings may be much greater (DOE, 2025b).
This study did not have site-specific building energy systems data, and so the current heating systems across all sites were assumed. For each site, the team assumed all fossil fuel energy could be converted to electricity, except process loads and CHP systems because electrification of those loads could negatively impact the operation. Converting fossil fuel use to electricity includes an efficiency gain, which is outlined below for the three main electrification strategies.
1. Convert individual boilers to heat pumps.
• Assumed 40% thermal energy reduction—a conservative estimate of COP = 2.0.
2. Decentralize centralized steam/hot water systems and convert to heat pumps.
• Assumed 60% thermal energy reduction—a conservative estimate to capture both heat pump and steam/hot water distribution loss savings.
3. Convert warehouse heating to electric radiant heating.
• Assumed percentage of heating energy used for warehouses based on square footage of warehouses as a percent of the total square footage assumed to be heated by that heating type.
• Assumed 20% thermal energy reduction.
A 10% efficiency gain was assumed for both process loads and the CHP thermal output due to energy conservation measures. However, since these fuel-fired loads will not be removed, they resulted in remaining emissions. For process loads that are reliant on coal, fuel switching from coal to natural gas was applied to reduce emissions.
Vehicle electrification is the replacement of internal-combustion engines for electric vehicles, which converts emissions from Scope 1 to Scope 2 and increases efficiency. Vehicle electrification also requires on-site charging infrastructure (assumed to be one charger for every 2.18 vehicles), which increases site electricity consumption. Ideally, chargers would be coupled with solar PV to offset the additional energy requirement. Vehicle electrification generally realizes substantial efficiency gains that offset the increase in emissions from purchased electricity use.
To quantify emissions and energy use from vehicle fleets, this analysis made a simplifying assumption that the strategy to reduce fleet emissions would be to convert to a fully electric fleet rather than employing other zero-emission vehicles, such as hydrogen fuel cell vehicles. This analysis also assumed a constant level of service; for example, the fleet mileage derived from baseline energy use would be maintained after the transition to electric vehicles.
Because the volume and mileage data in FAST do not correspond well and volume data was necessary for baselining, this analysis derived mileage from volume data rather than using the reported mileage data in FAST. Vehicle classes, such as sedans and medium-duty trucks, have different fuel efficiencies. Therefore, data on the composition of fleet vehicles by class was obtained from the 2021 Federal Fleet Open Data Set, which provides the share of mileage by vehicle class and agency (GSA, 2022). Average fuel efficiency values by vehicle class, as found in the Transportation Energy Data Book, were used to convert the energy consumption data (in GGE) for the fossil fuel fleet to mileage data as seen in Equation 4 (Davis and Boundy, 2022).
The fuel efficiency values are not fuel-specific but are likely dominated by liquid fuels. Assuming the fuel composition of the sites’ fleets roughly matches national averages, fuel-specific efficiency values were not required for this calculation. Efficiency data for battery electric vehicles by vehicle class was sourced from the Electrification Futures Study: End-Use Electric Technology Cost and Performance Projections through 2050 (Jadun et al., 2017). Equation 5 shows the calculation of electricity consumption using mileage and the fuel efficiency of electric vehicles, converted using a constant that relates miles-per-gallon-equivalent to kWh (0.031 kWh/mpge).
2.2.4 Remaining emissions
Sites that cannot meet their electricity load using on-site CFE can use off-site CFE options. Procurement can also be used as a temporary strategy to meet net-zero emissions if on-site CFE will not be operational by the net-zero emissions target date. Procurement of electricity from CFE sources (e.g., off-site solar PV or wind farms) could occur through power purchase agreements (PPAs) directly with the CFE generator or through green tariffs provided by the utility. Procured CFE must be accompanied by environmental attribute credits that are certified to meet environmental standards by the third-party certifier, Green-e2. This allows the site to exclusively claim the renewable attribute of the renewable energy generated offsite and use the emission factor associated with the off-site generation, even though the energy physically supplied by the grid. The process to purchase environmental attribute credits varies by market.
The amount of CFE procurement required to reach net-zero goals was calculated by multiplying any remaining electricity use after the net-zero energy strategies are applied by the corresponding eGRID electricity emission factor. It was assumed that all remaining emissions from purchased electricity could be offset by CFE procurement. However, CFE procurement cannot offset the emissions from non-electric on-site energy use. The appropriate CFE procurement mechanism for an individual site depends on the local utility market. This study did not analyze the specific market type of each site or the corresponding available procurement strategies, but instead analyzed the overall impact of using CFE procurement as a strategy to achieve net-zero emissions.
Fugitive emissions were estimated in the baseline, but quantification requires detailed GHG accounting using data that was unavailable for this study, such as refrigerant capacity, type, and disposals and wastewater treatment protocols. Without this data, reduction strategies also could not be accurately quantified and fugitive emissions were assumed to remain unabated. Broadly, strategies to reduce fugitive emissions include using refrigerants with lower global warming potential through retrofitting or replacing existing equipment, ensuring proper disposal of refrigerants and regularly inspecting equipment for refrigerant leaks. Strategies also included using low-hydrofluorocarbons products when possible and minimizing any on-site wastewater treatment plant emissions by improving controls over the sludge system and ensuring tanks are properly covered. Assessing opportunities for fugitive emissions reduction is an area for future research.
After implementing the above strategies, there may still be remaining Scope 1 emissions that are too expensive or impossible to remove. Currently, there is no federal guidance on what measures should be considered for emissions removal and sequestration. This realm is rapidly evolving with new technologies, like carbon capture and sequestration through direct air capture. Refined quantification strategies, such as calculating emissions sequestration from on-site land use and evolving carbon offset markets, are other possibilities (Kazemifar, 2021). Some degree of negative emissions will likely be required to fully achieve net-zero emissions, even under the most aggressive emissions reduction scenarios. The federal accounting of GHGs occurs at the agency branch level, not the site level; therefore, negative emissions techniques were considered at the portfolio level.
2.3 Impacts of net-zero strategies
Achievement of net-zero emissions through these strategies was considered within the context of other federal goals and priorities, including reducing costs across project life cycles, ensuring resilience, and reducing impacts to communities with EJ concerns.
2.3.1 Net-zero life cycle cost analysis
Life cycle cost analysis (LCCA) methodology for energy and water projects is discussed at length in the National Institute of Standards and Technology Handbook 135, Life Cycle Costing Manual for FEMP, and is required for use by all federal agencies (Kneifel and Webb, 2022b). The net-zero LCCA differs from a standard LCCA in several ways. A standard LCCA evaluates a single strategy compared with a baseline. To evaluate a net-zero plan in its entirety, the research team developed a method to apply LCCA to a set of net-zero strategies using life cycle costs to evaluate the cost effectiveness of achieving the goal. The net-zero LCCA calculates the present value of life cycle costs of all net-zero emissions strategies, bundled into a single case (Equation 6). The present value of the bundled strategies was compared with the baseline to determine if the cost was lower. Additionally, the net-zero LCCA stretches all the investments across a multi-year time horizon while trying to level the expenditures over the years. Comparatively, a standard LCCA evaluates investment at time zero, including the time value of multiple years of construction. The net-zero method also assumes that when the maximum lifetime of a technology is reached, re-investment occurs in the year prior to maintain net-zero status over time. A standard LCCA uses an evaluation period equal to the technology lifetime. The net-zero study period is based on the longest-lived asset but can be no more than 40 years according to the National Institute of Standards and Technology Handbook 135 (Kneifel and Webb, 2022b). Expenses 40 years from today have very little impact on the present value.
where Cost = present value cost of each strategy i including all costs j associated with the strategy (capital and annual) over time t; i = ith strategy; j = jth cost, benefit or residual value; t = number of years of the longest asset life; d = discount rate; Benefit = present value of monetized benefits j of each strategy i over time t; Residual Value = present value of residual value j of each strategy i at time t (not all strategies will have the same life so some will have residual value at time t); and Life Cycle Cost = cost of operating as a net-zero emissions site over time t.
Discount rates are determined by the Office of Management and Budget’s (OMB’s) Circular A-94 Handbook and are updated every year (OMB, 2023). The FEMP constant dollar discount rate of 3% was used for energy and water projects. The handbook includes the National Institute of Standards and Technology’s Energy Price Indices and Discount Factors for Life Cycle Cost Analysis, which are also updated every year (Kneifel and Webb, 2022a). The energy price indices provide a forecast for different types of energy, which can be used to predict outyear energy prices. The prices are in constant dollar terms or inflated at different rates of inflation. The approach in this paper used constant dollars across the LCCA timeframe.
The costs are discounted to the base date, which is the beginning of the net-zero program. In the approach used, the base date was the year before operation began. An LCCA uses a single discount rate and does not discount certain technologies with one discount rate and another set with a different discount rate. For this study, separate analyses using (1) FEMP and (2) OMB discount rates were used to show how the resulting present values differ. The constant dollar value of costs was also shown to indicate how much funding was required to implement the program.
Several LCCA evaluation criteria can be used to determine if a set of strategies is cost effective. The least cost criterion compares the present value of the baseline with another scenario. This is the simplest and most appropriate method for net-zero LCCAs due to the high cost of net-zero strategies.
The high-level analysis used in this study had uncertainty in investment costs, project lives, repair costs, residual value, decommissioning, and disposal costs. These uncertainties would have variable impacts on the discounted present value. For example, a large uncertainty about decontamination and decommissioning costs in year 40 was not likely to have a large impact on the discounted present value. However, large uncertainty in up-front investment costs could have significant impacts on the discounted present value of the strategies.
This study demonstrated this methodology for emissions reduction at a single sample site. Multiple sites and negative emissions could be included in a net-zero LCCA conducted across a portfolio when remaining emissions at individual sites are offset at the portfolio level. This study did not attempt to apply the LCCA method beyond the sample site due to a lack of data across sites.
Rough orders of magnitude for initial investments, operations and maintenance (O&M) costs, and lifetime of assets were assumed based on literature, as no detailed project information was available to determine actual cost estimates.
The baseline calculation included the costs associated with energy consumption, reinvestment (non-annual reoccurring costs), and O&M. Energy costs were forecasted based on energy price forecasts by each energy type, including electricity, distillate oil, natural gas, and propane (Kneifel and Webb, 2022a).
Each net-zero strategy was evaluated according to the initial investment, including years to operation from initial investment and lifetime of the asset. The lifetime of the asset is an important factor used to determine when reinvestment needs to occur. Costs were estimated for O&M, repair and replacement, residual value of investment, and benefits. The costs were added annually to the LCCA through the time horizon associated with the asset’s lifetime.
Where appropriate, supervision, inspection, and overhead costs and design costs were added as a multiplier to base costs.
The selected funding approach for each strategy impacts the cost over time and ultimately impacts the present value and LCCA results. Funding approaches can generally be categorized into federally funded and third-party funded categories. The selection of appropriate funding approaches for each project depends on cost effectiveness, project investment amount, desired ownership, and other factors. Given the size of some net-zero projects, multi-year funding authorities may be required to reduce annual requirements.
Third-party funding was assumed for projects that are likely to be cost-effective, such as energy efficiency projects and CFE projects with strong resource availability, and therefore may provide a financial or other benefit to the third party. Funding options may include PPAs, leases, and other mechanisms. Implementation of large cost-effective project bundles was spread over multiple contracts spanning 3–6 years to maintain a single contract size of less than $20 M. The project investment was represented as an annual contract payment rather than an up-front investment cost, with annual O&M and non-annual reoccurring replacement costs to smooth out annual expenses.
Federal funds were assumed to be available for other projects that were not suitable for third-party funding and that were a priority for the agency. Government funds are limited for federal projects; however, these projects may not need to be as economically attractive as third-party funded projects. They have up-front investment and annual costs from thereon over the project operating horizon.
Three types of benefits were considered: direct, indirect, and external. Direct benefits directly impacted the LCCA and were subtracted from the costs. Other than the social cost of carbon, non-monetary direct benefits were not monetarily quantified in this study due to lack of data. The reduction of emissions was calculated using a 2021 White House value of GHG (the social cost of carbon from Table A-1, using the 2.5% discount rate, in 2021) to provide a value for the reduction in emissions from reduced use of fossil fuels (Interagency Working Group on the Social Cost of Carbon, 2021).
Indirect benefits result from a project but may or may not be quantifiable, such as improved productivity and collaboration from better space allocation resulting from efficiency improvements. Indirect benefits were not included in this study due to limited data availability.
External benefits occur when society benefits due to the project. External benefits, such as beneficial impacts flowing to underserved communities, generally do not directly enter into the calculation of cost effectiveness, but they could be used to justify a project. External benefits, such as improved environmental conditions—especially when those benefits flow to communities with EJ concerns—are discussed qualitatively in this study. Local economic impacts were calculated for solar PV and wind development using the National Renewable Energy Laboratory Jobs and Economic Development Impact (JEDI) models3. Values for quantifying beneficial impacts flowing to communities with EJ concerns were ascertained from JEDI using information about the number of unskilled laborers hired.
Other benefits were not monetarily quantified in this study due to lack of data or scope. Example benefits that could be monetized with the right data include reduced pollutant loads/improved air quality and improved resilience, as documented in (Kneifel and Webb, 2022b).
2.3.2 Resilience
For this study, resilience was defined as the ability of a site to prepare for and recover from utility supply disruptions to ensure operational continuity for the site. The assessment approach consisted of the following elements:
1. Define a set of resilience metrics to characterize resilience impacts of net-zero strategies.
2. Characterize the current resilience posture for each site according to the defined metrics.
3. Describe the impacts to resilience that the proposed net-zero emissions strategies would have on the site. Remote strategies including CFE procurement, offsets, and sequestration have no site resilience impacts.
4. Explore site-specific resilience impacts of proposed net-zero strategies, including considerations for what additional elements would be necessary for a proposed net-zero strategy to positively impact resilience—for example, adding energy storage and microgrid controls to an on-site CFE generation project.
The resilience metrics used in this study (shown in Figure 1) represent a subjective assessment of the relative strengths and deficiencies of each site’s ability to prepare for and recover from disruptions. For each category, deficiencies are shown on top in dark grey and strengths are on bottom in light grey. For recovery, the metric considered the presence of on-site resources capable of operating independently during a disruption of the primary utility supplies, such as a microgrid with islandable generation or on-site wells, treatment, and distribution networks capable of supplying potable water. The ability to prepare for a disruption considered redundancy in supplies and distribution networks, along with adequate storage.
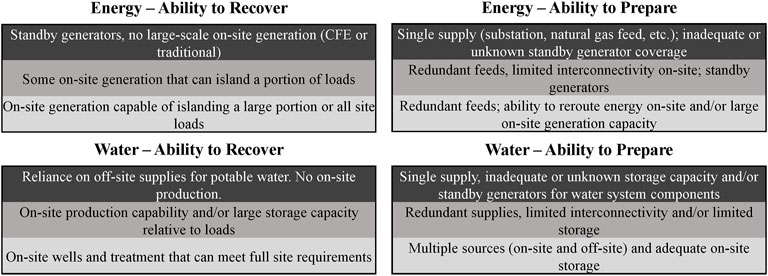
Figure 1. Energy and water resilience metrics.
The evaluation of resilience impacts focused on energy resilience (electric and thermal). The impacts to a site’s water resilience would likely only be as a second-order effect of the addition of on-site CFE generation, such as more resilient power to produce, treat, and distribute water on site. A site’s water resilience could also be affected by reduced water requirements, such as if building or equipment efficiency measures reduced heating or cooling loads and associated makeup water needs for heating, ventilation, and air conditioning equipment.
2.3.3 Environmental justice
Federal agency consideration of EJ concerns in facility siting and environmental impact analysis has been historically driven by regulatory requirements and regulations implemented under the National Environmental Policy Act and driven by EOs. Implementation guidance for EO 14096 indicates that EJ considerations begin with concerns identified based on “income, race, color, national origin, Tribal affiliation, or disability status in the development, implementation, and enforcement of environmental laws, regulations and policies” (FR 25251, 2023). The guidance further indicates that beyond the above-mentioned characteristics, EJ concerns may also consider other economic or social factors associated with increased vulnerability to environmental exposure, such as linguistic isolation, occupation, and employment status, procedural justice—which is the degree to which affected communities are able to make or influence decisions—among several other factors (EPA, 2024). Several studies have documented the adverse effects of local emissions on vulnerable populations (EPA, 2021; IEA, 2021). The EO implementation guidance provides much of the currently recommended approaches to incorporate EJ considerations into local net-zero emissions strategies.
The EJ assessment was organized chronologically based on the diagram in Figure 2. For each location, the local community was defined as the area within which physical and economic impacts of a project typically would be felt. For example, a large site may have hundreds or thousands of local employees and contractors who access the site regularly. The radius of the local community may extend to the limit of typical commuting distance of 20 miles or more. This presumed commuting distance established the distance to which the local economic linkages to the site typically would be noticeable. The team then conducted a demographic analysis using established datasets, including the now defunct Council on Environmental Quality Climate and Economic Justice Screening Tool, the American Community Survey 5-year Estimates data, and EPA’s EJScreen tool, to explicitly identify EJ populations based on race and ethnicity, poverty status, and several other indicators of socioeconomic disadvantage. These approaches relied on the use of various thresholds to identify whether a local population of people with EJ concerns is greater in proportion to the general population.
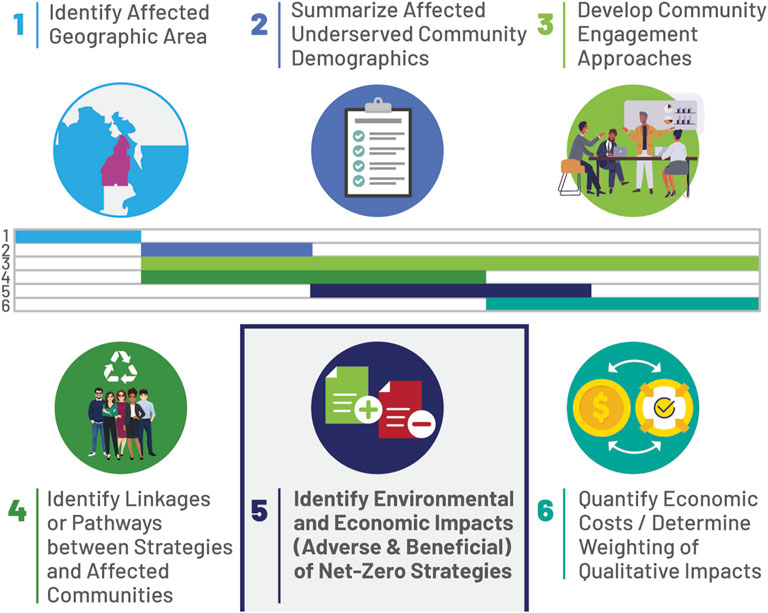
Figure 2. Sequential EJ assessment process.
The Council on Environmental Quality Climate and Economic Justice Screening Tool data were used to identify those census tracts the federal government considers to be economically or climatically “disadvantaged” (colloquially termed DAC). Additionally, census block groups were identified in which the proportion of the population made up of people of color (nonwhite race or ethnicity) is in the 65th or higher percentile nationally.
Each net-zero strategy assessed was examined in general terms to determine whether implementation would impact an identified community with EJ concerns. The team developed a set of guided questions to identify potential linkages between the net-zero strategy implementation and any identified community with EJ concerns. These identified impact linkages are shown by the example in Figure 3. The logical progression reflects the technical team’s determination of the expected or potential environmental or economic impacts based on the team’s individual net-zero strategy assessments—whether adverse or beneficial—that may result if the strategy were pursued.
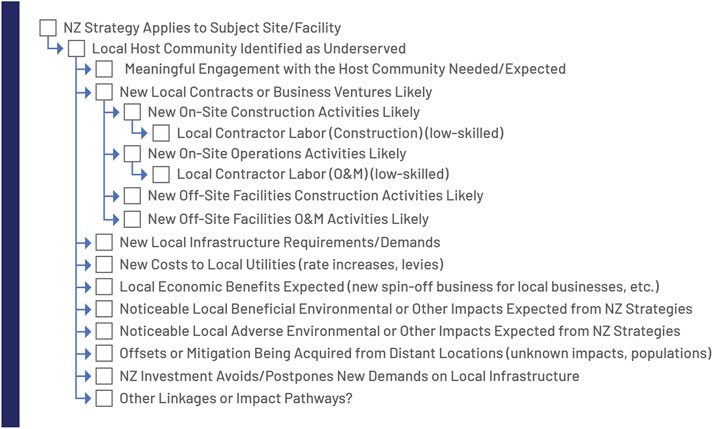
Figure 3. Example linkage mapping of net-zero strategy to EJ community.
For this analysis, the research team determined plausible cases in which identified communities with EJ concerns potentially could be affected by the net-zero strategy implementation. In practice, community engagement also would solicit the input of the affected local communities to learn their views on the degree to which they might be affected by net-zero strategies implemented at any one site.
A set of questions based on Figure 3 could be tailored for any net-zero strategy applicable at a site where a community with EJ concerns is found, with the exception of CFE procurement, offsets, and sequestration, which are remote strategies.
This assessment identified the potential for EJ impacts to occur as a result of implementing net-zero strategies. Community engagement could be helpful in identifying other linkages that may be site-specific or have not been previously considered.
2.4 Multi-objective comparative framework
To facilitate prioritization of strategies and sites, the team summarized the impacts of each strategy by identifying the potential benefits and drawbacks to cost, resilience, and EJ. For potential benefits to apply or be maximized for a site, certain site conditions must be present. The potential to realize substantial benefits from each net-zero strategy was quantified by counting the total number of potential cost, resilience, and EJ benefits that may be achieved by each strategy. A set of metrics was then established based on the analysis results to determine whether a condition exists at a site. Meeting or exceeding a metric threshold indicated that a benefit may be achievable. For benefits with multiple associated conditions, the percent of metric thresholds that were met was used to scale the amount of benefit that could be achievable.
Example metric thresholds were generated to demonstrate the methodology at two study sites. Specific thresholds were not recommended in this paper because they should be site- and organization-specific. For instance, an evaluation across a portfolio may use a value equal to the average of all sites or may use a value that results in more selective prioritization (e.g., top 20% of electricity costs).
3 Results
As demonstrated by the evaluations at the 16 sites, emissions reduction solutions and impacts vary widely from site to site—although common trends emerge. None of the sites were found to be able to fully eliminate Scopes 1 and 2 emissions at the site level, but most sites could get close to achieving net-zero emissions. This may not be cost-effective, although it was determined that resilience benefits were likely to be realized and project benefits were likely to flow to communities with EJ concerns. Portfolio-level negative emissions strategies were not found to provide cost, resilience, or EJ benefits.
3.1 Net-zero baselines and strategies
The emissions baselines in this study were the totals of Scopes 1 and 2 emissions for each site. The emissions baselines shown in Figure 4 include building, fleet, and fugitive GHG emissions, broken down by fuel for all 16 sites. The baselines included CO2, CH4, N2O, and F-gases. The predominant sources of emissions are off-site electricity generation and natural gas consumption, where gas heating is a higher percentage of the emissions in colder climates. The fugitive and fleet emissions were a small percentage of each site’s emissions. Two sites still used coal, as of FY22.
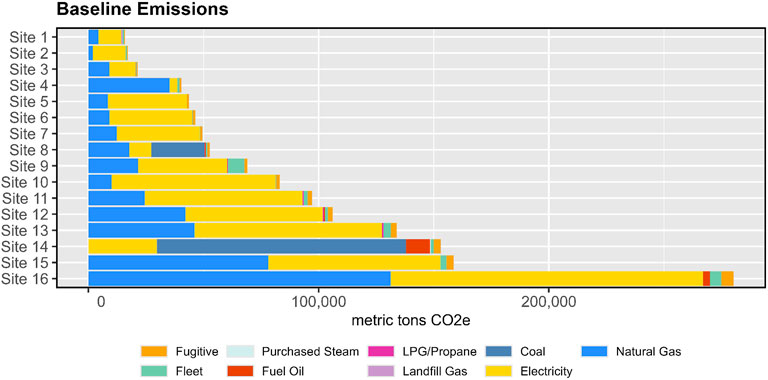
Figure 4. Site net-zero emissions baselines.
Using the methods, tools, and assumptions described in the Materials and Methods section, the research team selected a variety of the strategies described above that would allow each site in this study to achieve net-zero emissions to the extent possible. Eleven of the 16 sites could get close to achieving net-zero emissions, with approximately 2% remaining from fugitive emissions, through energy efficiency, building electrification, fleet electrification, fuel switching, on-site CFE, and procured CFE measures. Three of the 11 sites would need to rely on procured CFE due to limited land and roof availability for CFE. No site could completely meet net-zero emissions goals on its own and the remaining five sites had significant emissions from on-site energy generation (including CHP) and process loads that are deemed critical to operations and unable to be feasibly removed. Figure 5 depicts the strategies required to achieve significant emissions reduction.
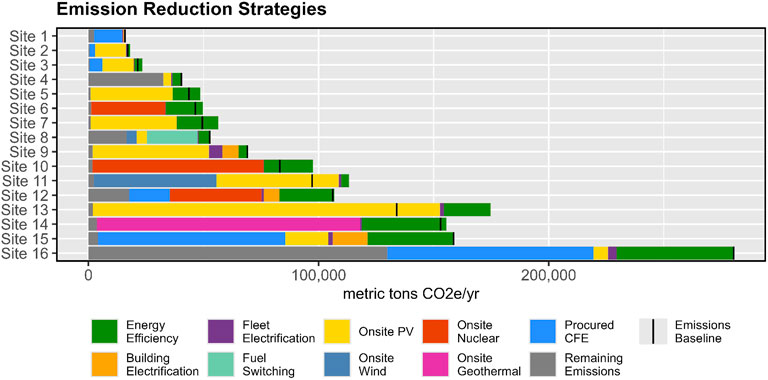
Figure 5. Summary of net-zero emissions potential for 16 selected sites.
This analysis found that energy efficiency can reduce 258,327 MTCO2e across the analyzed sites. In this study, twelve of the sites’ space heating-related emissions increased due to electrification since their electricity was supplied from a higher-carbon grid mix, increasing 90,590 MTCO2e. Four of the sites’ space heating-related emissions decreased due to efficiency gains achieved through electrification, decreasing 29,566 MTCO2e. Western sites on cleaner grids saw emissions reductions; however, some sites on relatively carbon-intensive grids also saw reductions if they were transitioning from higher carbon-intensive heating fuels, such as propane or fuel oil. Fleet electrification led to a reduction of 18,252 MTCO2e across all sites because of the efficiency gains of electric vehicles. Fuel switching led to a decrease of 22,000 MTCO2e, while CFE (on-site and procured) reduced emissions by 914,481 MTCO2e. In total, a remainder of approximately 220,000 MTCO2e/year must be addressed by sequestration or other offsets.
Solar PV can provide benefits at almost any site, but a limiting factor is the large amount of space required to generate enough electricity to meet consumption. Wind also requires a large amount of space, although most of that is buffer area, and the resource is more site-specific. Geothermal resources are even more location-dependent, although newer technologies allow the use of lower temperature resources and potentially increase the number of viable locations. AMR has a much smaller footprint with a buffer zone, making it more suitable for sites with unoccupied land that cannot be developed. Wave and tidal systems are immature and have limited impact for the evaluated sites.
3.2 LCCA example
Net-zero emissions for the LCCA demonstration site required energy efficiency projects, including heat pumps, building electrical efficiency, and radiant heating, as well as fleet electrification, on-site CFE (rooftop PV and ground-mount PV), and procurement of off-site CFE—which was met with a wind PPA. Efficiency projects were assumed to be implemented when they were more cost effective than other emissions reduction strategies (Dranka et al., 2020). Sequestration of an equivalent of 4,178 metric tons/yr. of CO2e, or about 2% of total current emissions, was required to offset fugitive emissions. The analysis aimed to minimize the amount of sequestration required because it does not provide cost savings (Dranka et al., 2020).
Table 2 lists the projects required to maximize emissions reduction, the assumed costs and years that operations begin, and the respective chosen funding approach—along with any notes or assumptions.
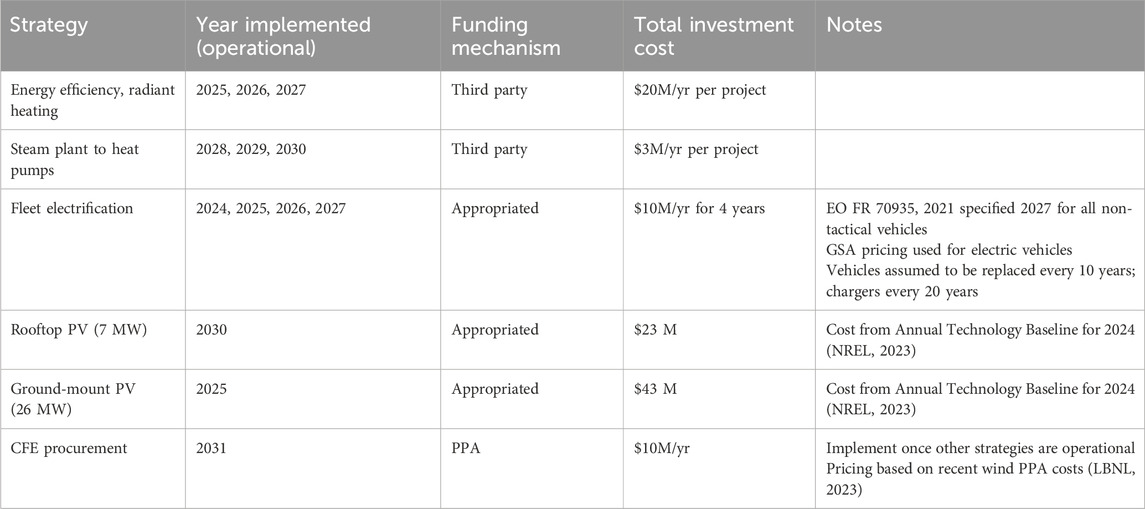
Table 2. Example site net-zero costs and implementation methods.
Figure 6 shows the implementation of the net-zero projects with two graphics. The top graphic indicates when the site will nearly reach net-zero emissions status when funded in this manner. The bottom graphic shows how the baseline and the net-zero strategies impact costs to the point when near-net-zero emissions is achieved in 2031.
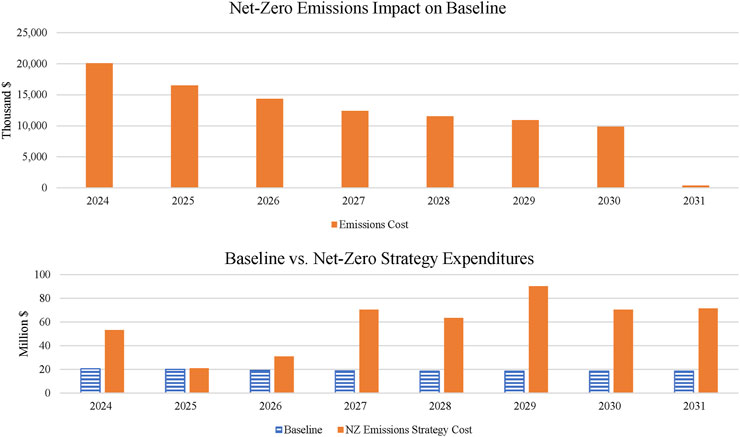
Figure 6. Progress toward net-zero emissions (top) and comparison of baseline and net-zero costs (bottom).
Energy efficiency contract costs remain constant over the 40-year time horizon. However, as the projects are implemented over time, the costs increase. Electrification and ground-mount PV investments result in higher 2024 costs. Implementing energy efficiency and steam decentralization over the next 6 years results in increasing costs until 2030. The year with the highest cost, 2029, is due to the investment in rooftop PV. The CFE procurement begins in 2031.
Table 3 shows the annual costs and the present value at constant dollar (no discount rate applied), the OMB discount rate, and the FEMP discount rate for the baseline and net-zero scenarios. The difference between the baseline and net-zero status at each discount rate is also shown. Net-zero status is not less costly on a discounted or constant dollar basis in this case, primarily driven by high-cost electrification of the fleet. Further, emissions benefits do not come close to offsetting the differential between the baseline and net-zero strategies. The differentials are in the billions of dollars while the value of emissions reductions is on the order of $200 million. This LCCA is simply an example with assumed values and should not be used to represent the cost-effectiveness of net-zero emissions, but rather how it can be calculated.
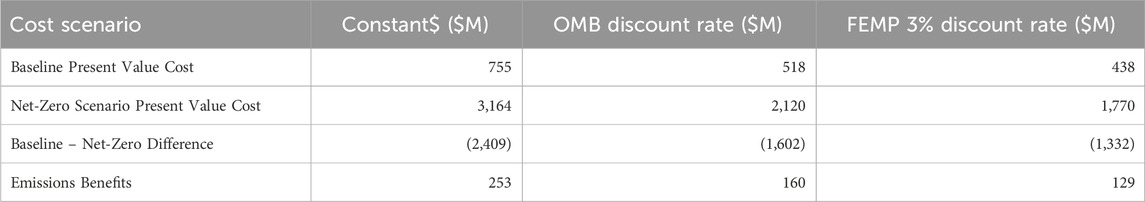
Table 3. Example life cycle analysis of baseline, net-zero strategies and emissions.
Using the default values in the JEDI model for Utah—the state in which the example site is located—along with the National Renewable Energy Laboratory’s PV investment and operation costs, economic impacts were estimated for the solar PV projects (Table 4). The output from modeling the 7-MW rooftop PV project indicated that it would create 194 construction jobs and 2.7 ongoing jobs—some of which could be non-skilled, such as for cleaning the modules. Construction provides earnings (worker salaries) of $10.5 million, an output (sum of all related economic activity) of $28 million, and a total market value added of $17 million. Operations provide earnings of $155 thousand/year, $300 thousand/year in output, and $200 thousand/year in added value. More information would be required from an actual project to accurately model the impact.
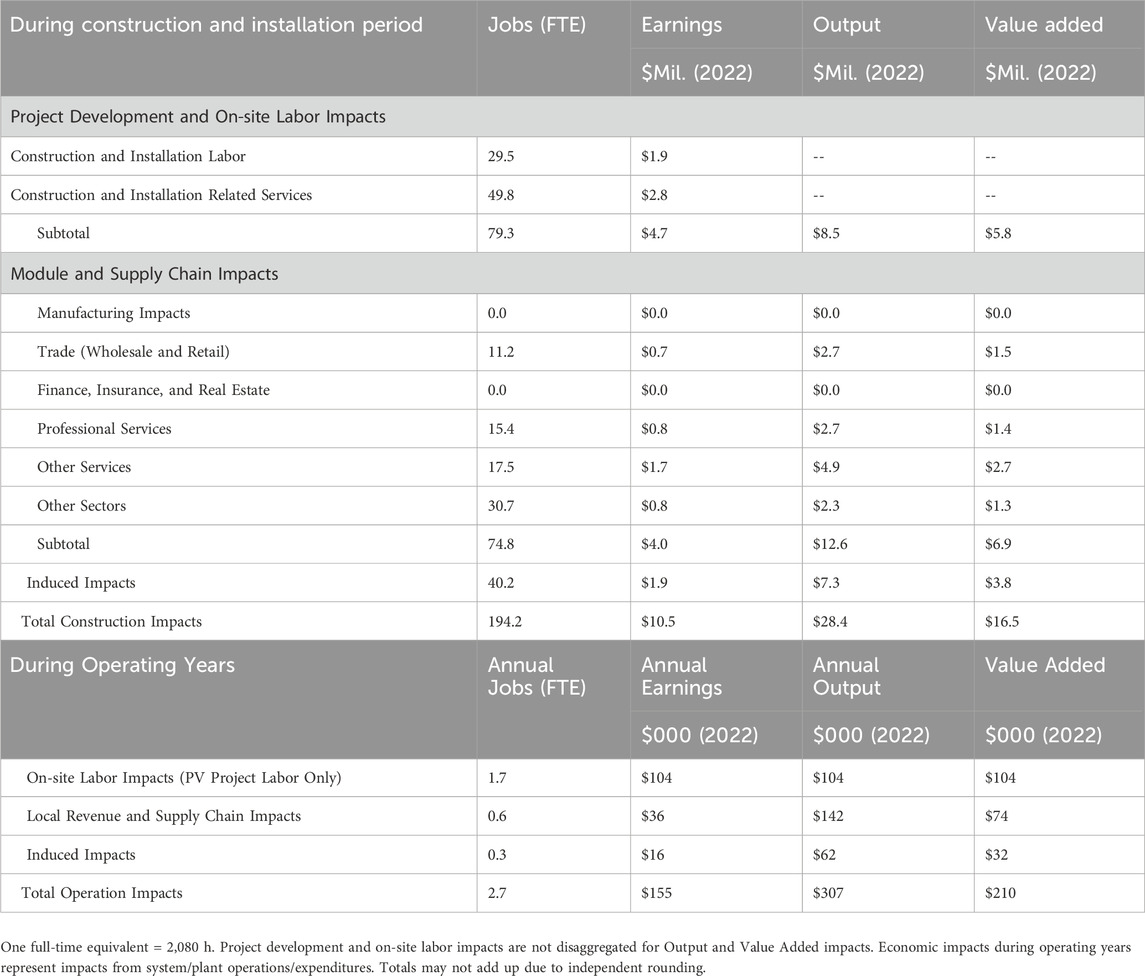
Table 4. Example: local economic impacts of implementing 7 MW of PV.
The 26-MW ground-mounted PV system was also analyzed using JEDI. The impact of construction of this system was similar to the 7-MW system, but the impact of ongoing operations was more than double the smaller system.
3.3 Impacts of net-zero strategies on resilience
The identified net-zero strategies were evaluated for their potential to impact the energy resilience of each site; both positive and negative impacts were considered, as well as possible impediments or conditions that could limit the potential of strategies to achieve resilience improvements. Of the five types of strategies that were identified for all sites, on-site CFE generation and building electrification (including steam decentralization) were evaluated for their impacts to site resilience. The other strategies (energy efficiency, fleet electrification, and CFE procurement) have the potential to indirectly impact site resilience but were not considered as part of the site-level analysis because of the lack of direct impacts based on available data.
The on-site CFE generation strategies identified had the potential to improve a site’s ability to avoid utility disruptions and recover when they do occur, although additional infrastructure was needed in certain scenarios. Power generation that is islandable and can operate independently without requiring an energized connection to the utility grid can improve a site’s ability to recover from a disruption to primary electricity supplies. In addition to the ability to island, generation equipment must be configured as—or be connected to—a dispatchable resource capable of producing on-demand energy. Resources including nuclear and geothermal are fully islandable and dispatchable, meaning they are capable of supplying power under all conditions. The four sites where these resources were identified as being feasible had increased resilience benefits.
Other proposed CFE generation technologies do not, by themselves, contribute to a site’s ability to recover from a primary utility disruption. For the 12 sites where intermittent CFE sources (e.g., solar PV, wind) were identified as the viable CFE generation options, direct resilience improvements would require complementary dispatchable and islandable resources in the form of energy storage, fuel cells, or other dispatchable CFE sources to sustain the steady voltage and frequency requirements necessary to deliver reliable power to site loads.
The location of generation resources relative to energy loads also impacted the viability of a resilience benefit. If critical loads were centrally located but CFE could only be deployed on remote areas of the site, then the additional infrastructure and costs required to deliver the power to the loads reduced the feasibility of the strategy to provide resilience. In addition, greater distance between generation and loads provides more opportunity for supply disruption. Five of the sites evaluated for this study did not have space available to install the proposed CFE generation near existing infrastructure and energy loads. In addition to complementary dispatchable and islandable generation resources, they were likely to require additional investments in electricity transmission and/or distribution infrastructure to enable CFE resources to provide resilience benefits.
For three sites, distributed rooftop solar PV was the most viable CFE option. Rooftop systems can be readily configured to provide localized (facility-level) resilience benefits. To contribute to larger-scale resilience, they will likely require sophisticated controls and high-capacity dispatchable resources, including storage and generators, to maintain a stable microgrid.
By transitioning thermal energy requirements from fossil-fuel sources to electricity, building electrification resulted in a net increase in site electric loads. Where heating was a considered a critical requirement, existing standby systems, such as backup generators or resilient on-site CFE generation, could be used to support electrified heating loads; however, the capacity may need to be augmented to meet the additional electric demands. Often, the transition to newer electric heating equipment is implemented in combination with improved equipment or building controls; this can result in finer-tuned load control and may improve the site’s ability to respond to disruptions. Replacement of building-level, fuel-fired thermal equipment with heat pumps was identified for nine of the evaluated sites.
For decentralization and simultaneous electrification of centralized steam systems, the impacts to energy resilience are likely to be mixed. Decentralization can reduce the risks associated with distributing thermal energy (steam, high-temperature hot water, etc.) to various facilities by placing the generation at the point of use (i.e., at the building). At the same time, decentralization can spread the redundancy requirement across a larger number of users. For example, N+1 redundancy without a centralized system can require two heating units at each building with each unit sized to meet the full building load (100% extra capacity). A centralized plant serving a system with diverse thermal loads, configured with a mix of equipment with different sizes, could achieve the same system redundancy with far less extra capacity. Therefore, without the added redundancy built into electrification projects, resilience postures may diminish at the four sites where decentralization was identified as a strategy.
This work identified several general impacts of the net-zero strategies on resilience that could be characterized with the right data. Reduced energy consumption resulting from efficiency measures could extend the runtime of resilient systems, such as standby generators that rely on stored fuel. This resilience benefit could be quantified with fuel storage capacity and energy savings information.
Decreased power demand achieved through efficiency measures can have both positive and negative impacts. Lower power demands can mean that new systems being designed or procured can be configured with lower capacities, reducing costs and other requirements. At the same time, lower power demands can negatively impact existing fuel-fired standby systems in cases where they result in oversized equipment that must operate at inefficient levels of output, producing adverse effects. At the site level, the set of net-zero emissions strategies includes CFE sizing that accounts for consumption reduction due to efficiency improvements. Therefore, resilience benefits are expected for the wholistic approach.
Similarly, electric vehicles have charging loads that may be deferable, which can complement energy efficiency strategies; if efficiency measures result in part loading of generators, vehicle charging can mitigate this issue.
On a smaller scale, using stored energy in electric vehicle batteries, such as vehicle-to-grid power, can improve resilience but may only provide a very localized benefit, like vehicle-to-building power. Electric vehicle battery storage may require highly sophisticated controls for greater impact.
3.4 EJ impacts of emissions strategies
Most sites were found to be surrounded by communities with EJ concerns; local communities included 22%–87% (average 49%) disadvantaged populations, and 1%–55% (average 29%) people of color (CEQ, 2024; U.S. Census Bureau, 2023b). The ability to accurately determine the impacts of net-zero strategies on these communities requires community engagement and detailed data that was unavailable for this study. However, this study assessed 11 potential impact pathways or linkages between each strategy and each community of EJ concern (Figure 7). Impacts were determined based on the potential for beneficial effects. Beneficial EJ impacts may result if net-zero strategy implementation would lead to hiring low-skill laborers from the local community for construction and operations activities if that community is historically underserved or disadvantaged. Low-skill workers are likely to fit the income characteristics of being disadvantaged. Adverse EJ impacts could result if net-zero strategy implementation results in new economic costs being passed on to the local community or if construction impacts extended beyond site boundaries in such communities. To the degree that the strategies would postpone the needs for new local infrastructure, the avoided costs of these needs would become an EJ benefit to the local community by delaying new rate increases.
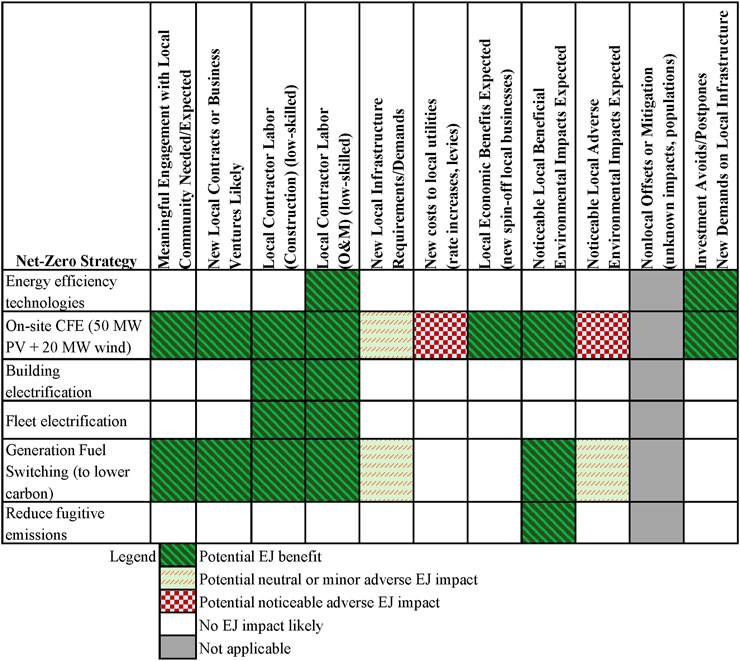
Figure 7. Example Anticipated EJ impacts of net-zero strategy implementation.
Most net-zero strategies were found to have minimal community impact because they are implemented within the site boundaries, but most impacts are likely to be beneficial, as shown in the example qualitative analysis for one site in Figure 7. For sites with large-scale CFE strategies, there is potential concern for environmental or cost impacts to negatively affect the local community. It should be noted that while localized improvement in air quality and toxic contamination would arise at all sites from eliminating fossil fuel combustion (stationary and mobile) in areas historically overburdened; these current adverse impacts are not significant and the localized improvement benefits would be negligible (Shindell et al., 2018; Bloomberg and Aggarwala, 2008). However, emissions reduction would contribute to a wider strategy to improve atmospheric effects globally.
3.5 Synthesis of strategy impacts
Synthesizing the findings for how emissions reduction strategies impact other goals illuminated potential approaches for pursuing net-zero emissions across a portfolio of sites.
This study found that benefits gained from net-zero strategies vary with the characteristics of each site. For instance, on-site CFE reduced site energy costs; however, the benefits were more substantial when rates were high. Similarly, the likelihood of a CFE project helping to avoid rate increases in the community, which can be caused by utility investments in additional generating capacity, is greater in locations where grid capacity is currently constrained. Site conditions were identified that directly correlate with enhancement of associated benefits. Table 5 identifies these and other potential benefits, as well as the necessary conditions to achieve substantial benefits for each net-zero strategy.
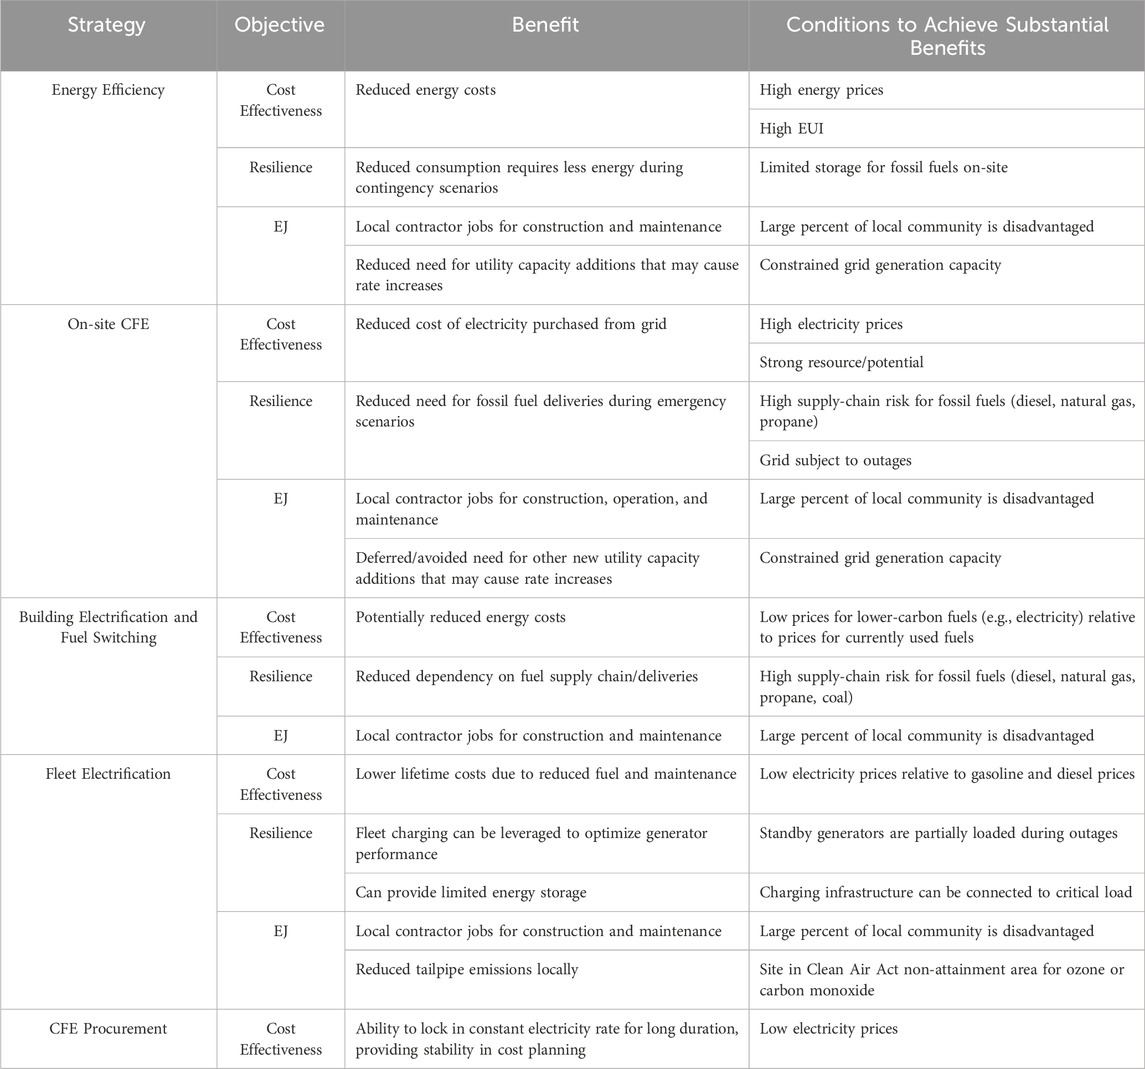
Table 5. Characterization of energy strategies identified for net-zero.
Quantification of this information revealed that, when counting the potential substantial benefits for strategy comparison purposes only, the strategy with the most potential to provide benefits across all categories is fleet electrification—assuming all associated conditions exist at a site (Table 6). The strategy with the least potential to provide substantial benefits was CFE procurement.
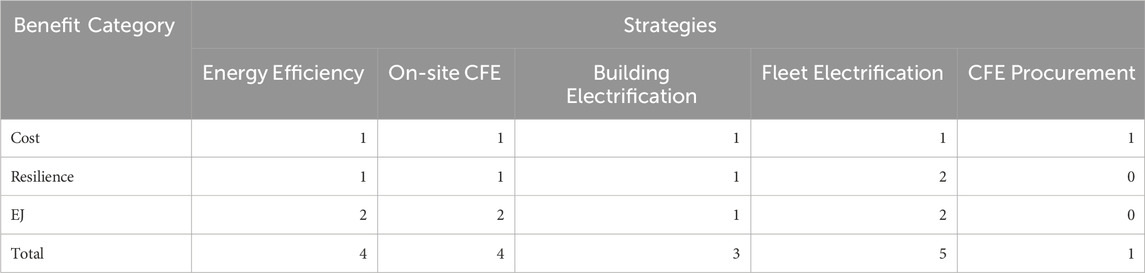
Table 6. Count of potential benefits resulting from strategies used to achieve net-zero emissions.
Two sites were evaluated according to the rubric that combines the count of benefits with the presence of conditions to identify priority strategies. Each conditions metric was quantified using available information, or informed estimations were made where no information was available for this study. Tables 7, 8 present the results of the quantified benefits analysis for Sites 11 and 13, respectively.
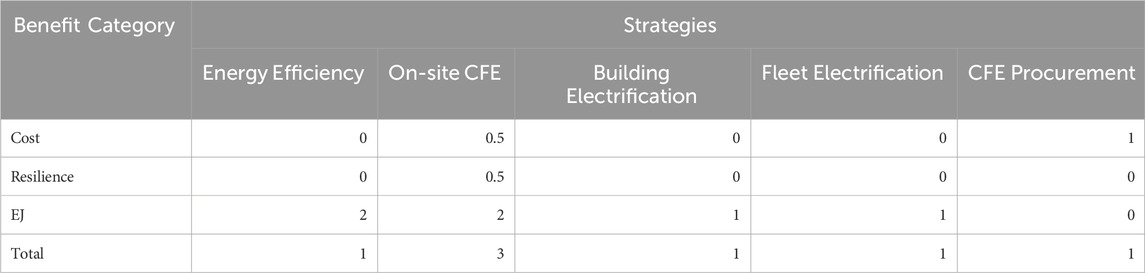
Table 7. Site 11 prioritization of strategies based on benefits quantification.
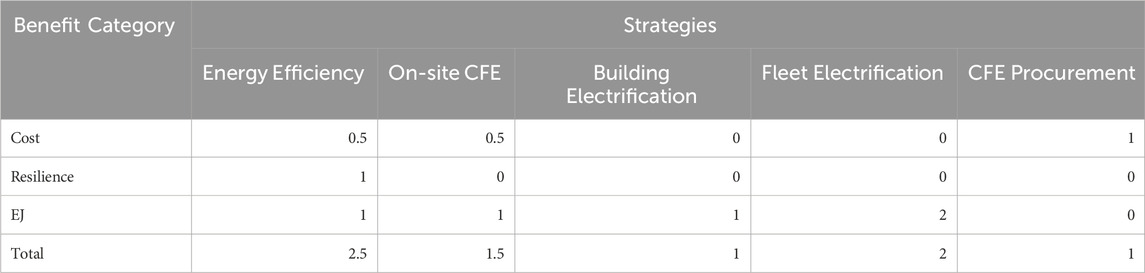
Table 8. Site 13 prioritization of strategies based on benefits quantification.
As shown, Site 13 would incur more benefits from energy efficiency because of its high EUI and limited on-site fossil fuel storage. Site 11 would see more benefits from on-site CFE because it suffers from local grid constraints and frequent outages. For both sites, building electrification and CFE procurement provide limited substantial benefits aside from emissions reduction. Fleet electrification, although having the highest potential for providing substantial benefits, is unlikely to provide as much benefit as other strategies because of conditions at these sites.
4 Discussion
This research provides insights on analysis methods and decision-making frameworks for stakeholders managing competing priorities.
4.1 Research contribution
Net-zero emissions, life cycle cost, resilience, and community impacts have all been analyzed independently and documented thoroughly (Kneifel and Webb, 2022b; The White House, 2021; NEPA, 1969; Zeise and Blumenfeld, 2022; IEA, 2021). The novelty of this research includes 1) the innovative methodologies developed to evaluate ambiguous and incomplete information and to integrate various efforts into a single analysis, such as multiple projects in a net-zero LCCA; 2) the assessment of near-term impacts of longer-term goals through valuation of benefits, such as resilience impacts of fossil fuel use reduction; and 3) consideration at the portfolio scale to allow for comprehensive planning and portfolio-wide solutions, such as sequestration, to address remaining site emissions at locations that are unable to achieve net-zero emissions by themselves. These developments allow for optimization of investments that will balance emissions reduction, life cycle costs, resilience, and EJ benefits.
While it is always preferrable to have actual data, when data is not available researchers must rely on approximations and assumptions (Arioli et al., 2020; Rodríguez et al., 2024). The methods described here identify available data sources, such as proxy EUIs and land cover data, that may be extrapolated to understand site conditions and evaluate the net-zero strategies discussed in this study. They build upon established methods, such as the benchmark analyses performed by Budde and Kidschun (2023), with calculations targeted for broader scopes, such as multiple complex sites, multiple strategies, and multiple objectives.
For instance, the strategies required to reduce site emissions range from building-level equipment improvements to large-scale generation both on-site and off-site, a range which encompasses different LCCA inputs and assumptions. This research developed a modified analysis approach to account for these as a set of solutions; the net-zero LCCA accommodates analysis differences and includes methods to account for non-monetary benefits. The LCCA method described applies widely accepted standards to novel scenarios, resulting in a defendable and repeatable process that builds upon established methods. The method leverages cross-project advantages and quantifies external benefits, such as reduced emissions, improved electrical and thermal resilience, reduced pollutant loads, and economic impact on the community. The multi-strategy LCCA also revealed the benefits of intentional timing of project execution–deliberately sequenced project timing resulted in reduced life cycle costs. Example efficiencies include decreasing load and therefore annual expenditures and subsequent project costs by implementing energy efficiency first (as the literature revealed), replacing existing technologies (such as heating, energy generation, vehicles, or refrigerant-containing equipment) at end-of-life, and delaying more costly strategies such as fleet electrification and CFE procurement to reduce life cycle costs over the net-zero period. It has been shown that on a life cycle cost basis only, CFE procurement is favored over energy efficiency and on-site CFE (Marszal et al., 2012). This aligns with the findings of this research, but this research indicates a preference for on-site solutions to achieve other types of benefits.
Organizations often struggle with competing priorities and no clear understanding of or analysis method for multi-objective prioritization, because previous research has not considered this set of objectives (Weerasinghe et al., 2024). The identification and documentation of emissions reduction strategy impacts on other, near-term objectives lays the groundwork for advanced planning that can achieve substantial, multi-faceted benefits. Tying the benefits to measurable site conditions assists with application of this research to a broader scope.
In contrast with research that focuses on life cycle costs (Weerasinghe et al., 2024), decarbonization (Reeder, 2016), or societal (Gao et al., 2018) benefits individually, this analysis identified opportunities for advanced prioritization techniques, providing information about site characteristics associated with the value of other benefits, particularly resilience, that may lead decision-makers to select one option over another. For example, from an emissions perspective, on-site CFE and procured CFE offer the same benefit, but other benefits they provide vary depending on site conditions. The method developed through this research integrates site characteristics, organization priorities, and potential strategy benefits to inform comprehensive planning and optimization of benefits at the portfolio scale. Higher-cost on-site CFE, for example, may be implemented at sites with higher disadvantaged populations who can support construction and project operations, and/or where grid energy supply is unstable. Procured CFE may be selected to reduce emissions for sites with lower electricity costs and/or sites that have potential for CFE technologies still under development. The demonstrated methods also support decisions to deprioritize sites or strategies where benefits are shown to be limited, leveraging the assumption methods when data is limited to screen out poor investments.
Analysis across a portfolio reveals the distinction in suitable emissions reduction strategies at sites with different characteristics. Traditionally, net-zero emissions status is achieved through GHG emissions reduction and remaining emissions are balanced with negative emissions through natural carbon sequestration or carbon dioxide removal technology to reach net-zero status (Azevedo et al., 2021). This research focused on site-specific strategies to reduce GHG emissions to the maximum extent possible while offsetting or sequestering any remaining emissions to reach net-zero emissions at a portfolio scale.
Emerging technologies, such as certain CFE technologies and carbon capture and storage, can be assessed at the portfolio level to reduce remaining emissions in the future as technology develops. Some remaining emissions identified in the study prevent sites from achieving net-zero emissions and may be best addressed from a portfolio level.
4.2 Study limitations and future work
The research was limited by site-specific data availability and engagement. The methodologies would benefit from validation using a larger group of pilot sites to accurately formulate net-zero strategies and understand community and resilience impacts, as well as to appropriately quantify benefits for prioritization purposes.
For example, the magnitude and scope of strategies were approximated, such that realistic costs could not be estimated and a determination of resilience impacts could not be fully understood. Similar energy efficiency measures can be implemented at most sites (e.g., lighting, high-efficiency heating and cooling equipment), but others may not be appropriate in certain climates or at sites with certain activities (e.g., where there is a requirement for high-temperature heat). Site-specific analyses are required to determine the potential savings impact from efficiency measures and to identify opportunities (including for process loads and CHP electrification, which were not assessed in detail here) that achieve as much savings as possible. Conducting a thorough LCCA at each site can provide more understanding of opportunities and a more accurate comparison of the economics of the net-zero strategies. Similarly, detailed site information is needed to understand the extent to which land may be available for CFE development, and existing distribution system configurations need to be known to understand the resilience impact of on-site CFE and other net-zero strategies. Given the demonstrated need to leverage multiple resources to address portfolio requirements, an effort to advance newer technologies (including wave, tidal, AMR, clean hydrogen, and others) appears to be necessary.
Outreach activities are key to receiving community input as to what aspects of site modification activities might impact local communities, and what types of impacts such activities may cause. Further, census data and related EJ screening tools developed by various agencies require the ground truthing that results from engaging with the affected communities. While there are accepted analytical approaches for identifying the demographic makeup of local communities, such as those used in this study, engagement via intentional outreach validates that the full extent of impacts to any disadvantaged communities has been identified.
As noted, strategy and site prioritization via the multi-objective analysis was based on a simple count of benefits identified across the impact categories in this study; no weighting was applied and other considerations that impact project planning were not addressed here. Further, drawbacks to strategies were not accounted for—for example, when a strategy may increase emissions. They were simply disregarded as no benefit. By assigning weights to this scoring method, certain benefit categories can be prioritized and different strategies become more attractive. A more robust quantification method used with site-specific data would likely reveal additional insights into portfolio-wide net-zero efforts. Future work can also include creating or applying a standardized method to quantify natural sequestration’s impact on emissions and improve data collection of fugitive emissions at the portfolio level.
4.3 Applications of study findings
Understanding the benefits achieved by each strategy or bundle of strategies allows stakeholders managing competing priorities to conduct long-term planning across sites. Depending on organization goals, quantified benefits can be compared across strategies and/or across sites; or, they can be extrapolated to other sites using a comparison of existing site characteristics and conditions. Organizations can conduct a multi-criteria decision analysis to quantitatively prioritize strategies. This research developed a flexible methodology with applications across sectors and organization types.
Alternatively, rather than a comprehensive plan centered on net-zero, existing site development and/or energy plans could be evaluated for their ability to contribute to net-zero objectives based on the impacts outlined in this study. For instance, many resilience projects are intended to improve a site’s ability to recover from a disruption of primary supplies and are therefore designed to be standby in nature—or designed with a mix of primary and standby resources. Project selection and design criteria could prioritize solutions with other benefits in addition to resilience, including primary resources that can contribute to net-zero objectives.
With the urgency to address climate change, intentionally deploying net-zero emissions strategies while also considering other competing priorities, such as resilience, economics, and surrounding communities, can help achieve multiple targets simultaneously. Deploying various strategies described here, such as multi-objective analyses, integral planning, and application to multiple sites, provides a framework that many other organizations can apply outside the federal space. This general research strategy can be applied across portfolios of buildings, organizations, sectors, or countries with net-zero emissions ambitions while facing competing objectives.
5 Conclusion
This research provides an early understanding of and baseline for the potential to achieve net-zero emissions and the impacts of doing so across a portfolio of sites with various policy objectives. Using the strategies identified here, and considering their feasibility across federal sites, decision-makers can determine how net-zero emissions can be met. When selecting the net-zero sites and appropriate strategies, the methodologies developed to assess costs and impacts on resilience, communities, and emissions goals can be leveraged to minimize negative impacts and prioritize sites where benefits can be optimized.
This research concludes that achieving net-zero emissions can be integrated into other competing objectives across a portfolio. It brings awareness to balancing long-term climate goals with near-term cost, resilience, and EJ impacts; emissions reduction does not necessarily compromise other priorities, and, with proper planning, they can be simultaneously achieved. The results of these evaluations allow federal agencies and other organizations to make informed decisions about where, when, and how net-zero goals can be most beneficial across a portfolio.
Data availability statement
The data analyzed in this study is subject to the following licenses/restrictions: Most datasets presented in this study can be found in online repositories. The names of the repositories and accession numbers can be found in the article. Data used from the FEMP workbook and FAST data are Controlled Unclassified Information and cannot be released to the public in the format in which the research team used them. Summaries of this information are in the Annual Energy Performance, Resilience, and Readiness Report (https://www.acq.osd.mil/eie/ero/ier/docs/aeprr/FY23-AEPRR-Report.pdf) and in the Federal Fleet Report (FFR) Open Data Set Library (https://www.gsa.gov/policy-regulations/policy/vehicle-management-policy/ffr-open-data-set-library), respectively. Requests to access these datasets should be directed to Amy E. Solana, YW15LnNvbGFuYUBwbm5sLmdvdg==.
Author contributions
AS: Funding acquisition, Methodology, Project administration, Supervision, Writing – original draft, Writing – review and editing. AM: Formal Analysis, Methodology, Writing – original draft. DA: Formal Analysis, Methodology, Writing – original draft. CN: Formal Analysis, Funding acquisition, Methodology, Writing – original draft. PD: Formal Analysis, Visualization, Writing – original draft, Writing – review and editing. MW: Formal Analysis, Methodology, Writing – original draft.
Funding
The author(s) declare that financial support was received for the research and/or publication of this article. Funding for this research was made possible under the Fiscal Year 2022 National Defense Authorization Act.
Acknowledgments
The authors would like to thank the Department of Defense and participating military departments for providing guidance, direction, and data for this research. The authors would also like to thank Alisha Piazza of Vestas (previously at Pacific Northwest National Laboratory) and Malcolm Moncheur de Rieudotte of Pacific Northwest National Laboratory for their contributions to the energy analysis, and Jessica Wisse of Pacific Northwest National Laboratory for editorial support.
Conflict of interest
The authors declare that the research was conducted in the absence of any commercial or financial relationships that could be construed as a potential conflict of interest.
Generative AI statement
The author(s) declare that no Generative AI was used in the creation of this manuscript.
Publisher’s note
All claims expressed in this article are solely those of the authors and do not necessarily represent those of their affiliated organizations, or those of the publisher, the editors and the reviewers. Any product that may be evaluated in this article, or claim that may be made by its manufacturer, is not guaranteed or endorsed by the publisher.
Supplementary material
The Supplementary Material for this article can be found online at: https://www.frontiersin.org/articles/10.3389/fenvs.2025.1577078/full#supplementary-material
Abbreviations
AMR, advanced microreactor; CFE, carbon-free energy; CHP, combined heat and power; CO2e, carbon dioxide equivalent; COP, coefficient of performance; EJ, environmental justice; EO, Executive Order; EPA, Environmental Protection Agency; EUI, energy use intensity; FAST, Federal Automotive Statistical Tool; FEMP, Federal Energy Management Program; GGE, gasoline gallon equivalent; GHG, greenhouse gas; FY, fiscal year; JEDI, Jobs and Economic Development Impact; LCCA, life cycle cost analysis; MTCO2e, metric tons of carbon dioxide equivalent; O&M, operations and maintenance; OMB, Office of Management and Budget; PPA, power purchase agreement; PV, photovoltaics.
Footnotes
1https://portfoliomanager.energystar.gov/pm/login
3https://www.nrel.gov/analysis/jedi/models.html
References
Arioli, M. S., de Almeida D'Agosto, M., Amaral, F. G., and Bettella Cybis, H. B. (2020). The evolution of city-scale GHG emissions inventory methods: a systematic review. Environ. Impact Assess. Rev. 80, 106316. doi:10.1016/j.eiar.2019.106316
Azevedo, I., Bataille, C., Bistline, J., Clarke, L., and Davis, S. (2021). Net-zero emissions energy systems: what we know and do not know. Energy Clim. Change 2, 100049. doi:10.1016/j.egycc.2021.100049
Betz, T., El-Rayes, K., and Johnson, M. (2024). Optimizing the decarbonization of a geographically dispersed building portfolio. Build. Environ. 262, 111767. doi:10.1016/j.buildenv.2024.111767
Bleyl, J. W., Bareit, M., Casas, M. A., Chatterjee, S., Coolen, J., Hulshoff, A., et al. (2019). Office building deep energy retrofit: life cycle cost benefit analyses using cash flow analysis and multiple benefits on project level. Energy Effic. 12, 261–279. doi:10.1007/s12053-018-9707-8
Bloomberg, M. R., and Aggarwala, R. T. (2008). Think locally, act globally: how curbing global warming emissions can improve local public health. Am. J. Prev. Med. 35 (Issue 5), 414–423. doi:10.1016/j.amepre.2008.08.029
Budde, F., and Kidschun, F. (2023). “Explorative study on benchmarking approaches for the improvement of corporate greenhouse gas emissions 2023,” in IEEE international conference on technology and entrepreneurship (ICTE). New York, NY: IEEE Kaunas, Lithuania, 2023, 86–91. doi:10.1109/ICTE58739.2023.10488515
Council on Environmental Quality (2024). Climate and economic justice screening tool (CEJST) version 2.0. Available online at: https://edgi-govdata-archiving.github.io/j40-cejst-2/en/downloads.
Council on Environmental Quality (2016). Federal greenhouse gas accounting and reporting guidance. Available online at: https://www.sustainability.gov/pdfs/federal_ghg%20accounting_reporting-guidance.pdf.
Davis, S., and Boundy, R. G. (2022). Transportation energy data book. Edition 40. Oak Ridge, Tennessee: Oak Ridge National Laboratory. ORN/TM-2022/2376.
DOE (2025a). Fuel conversion factors to gasoline gallon equivalents. Washington, DC: Vehicle Technologies Office. Available online at: https://epact.energy.gov/fuel-conversion-factors (Accessed November, 2023).
DOE (2025b). Heat pump systems. Washington, DC: US Department of Energy. Available online at: https://www.energy.gov/energysaver/heat-pump-systems (Accessed November, 2023).
DOE (2025c). Annual energy management data report. Washington, DC: US Department of Energy. Available online at: https://www.energy.gov/femp/articles/annual-energy-management-data-report.
Dranka, G. G., Ferreira, P., and Vaz, A. I. F. (2020). Cost-effectiveness of energy efficiency investments for high renewable electricity systems. Energy 198, 117198. doi:10.1016/j.energy.2020.117198
Ebi, K. L., Vanos, J., Baldwin, J. W., Bell, J. E., Hondula, D. M., Errett, N. A., et al. (2021). Extreme weather and climate change: population health and health system implications. Annu. Rev. Public Health 42, 293–315. doi:10.1146/annurev-publhealth-012420-105026
ENERGY STAR (2025). Portfolio manager data explorer. Available online at: https://portfoliomanager.energystar.gov/dataExplorer/ (Accessed November, 2023).
EPA (2021). Climate change and social vulnerability in the United States: a focus on six impacts. Washington, DC: US Environmental Protection Agency. Available online at: https://www.epa.gov/system/files/documents/2021-09/climate-vulnerability_september-2021_508.pdf.
EPA (2022a). Data explorer: eGRID. Available online at: https://www.epa.gov/egrid/data-explorer (Accessed November, 2023).
EPA (2022b). Emission factors for greenhouse gas inventories. Available online at: https://www.epa.gov/system/files/documents/2022-04/ghg_emission_factors_hub.pdf (Accessed November, 2023).
EPA (2024). Technical guidance for assessing environmental justice in regulatory analysis. Washington, DC: US Environmental Protection Agency, U.S. Second Edition. Environmental Protection Agency. Available online at: https://www.epa.gov/system/files/documents/2024-12/ejtg_20241206_clean.pdf.
FR 25251 (2023). Revitalizing our nation’s commitment to environmental justice for all. Executive order of the president. Fed. Regist. Available online at: https://www.federalregister.gov/documents/2023/04/26/2023-08955/revitalizing-our-nations-commitment-to-environmental-justice-for-all.
FR 70935 (2021). Catalyzing clean energy industries and jobs through federal sustainability. Executive office of the president. Fed. Regist. Available online at: https://www.federalregister.gov/documents/2021/12/13/2021-27114/catalyzing-clean-energy-industries-and-jobs-through-federal-sustainability.
Gao, J., Kovats, S., Vardoulakis, S., Wilkinson, P., Woodward, A., Li, J., et al. (2018). Public health co-benefits of greenhouse gas emissions reduction: a systematic review. Sci. Total Environ. 627, 388–402. doi:10.1016/j.scitotenv.2018.01.193
GSA (2022). Federal fleet report (FFR) open data set library. General services administration. Available online at: https://www.gsa.gov/policy-regulations/policy/vehicle-management-policy/ffr-open-data-set-library.
Hoekman, S. (2020). Review of nitrous oxide (N2O) emissions from motor vehicles. SAE Int. J. Fuels Lubr. 13 (1), 79–98. doi:10.4271/04-13-01-0005
IEA—International Energy Agency (2021). Air quality. Available online at: https://www.iea.org/reports/multiple-benefits-of-energy-efficiency/air-quality.
Interagency Working Group on the Social Cost of Carbon (2021). Technical support document: social cost of carbon, methane, and nitrous oxide interim estimates under executive order 13990. Available online at: https://www.energy.gov/sites/default/files/2023-04/57.%20Social%20Cost%20of%20Carbon%202021.pdf.
Jadun, P., McMillan, C., Steinberg, D., Muratori, M., Vimmerstedt, L., and Mai, T. (2017). Electrification futures study: end-use electric technology cost and performance projections through 2050. Golden, CO. Available online at: https://www.nrel.gov/docs/fy18osti/70485.pdf.
Kainiemi, L., Laukkanen, M., and Levänen, J. (2025). Multi-sectoral interactions in energy transition: unveiling tensions between sustainability and justice. Appl. Energy 384, 125437. doi:10.1016/j.apenergy.2025.125437
Kazemifar, F. (2021). A review of technologies for carbon capture, sequestration, and utilization: cost, capacity, and technology readiness. Greenh. Gases Sci. Technol. 12 (1), 200–230. doi:10.1002/ghg.2131
Kneifel, J., and Webb, D. (2022a). Energy price indices and discount factors for life cycle cost analysis -2023: annual supplement to NIST handbook 135. doi:10.6028/NIST.IR.85-3273-38
Kneifel, J., and Webb, D. (2022b). Life cycle costing manual for the federal energy management program. Washington, DC: National Institute of Standards and Technology. doi:10.6028/NIST.HB.135e2022-upd1
LBNL (2023). Land-based wind market report. Berkeley, CA: Lawrence Berkeley National Laboratory. Available online at: https://emp.lbl.gov/publications/land-based-wind-market-report-2023.
Levesque, A., Osorio, S., Herkel, S., and Pahle, M. (2023). Rethinking the role of efficiency for the decarbonization of buildings is essential. Joule 7 (6), p1087–p1092. doi:10.1016/j.joule.2023.05.011
Linton, S., Clarke, A., and Tozer, L. (2022). Technical pathways to deep decarbonization in cities: eight best practice case studies of transformational climate mitigation. Energy Res. and Soc. Sci. 86, 102422. doi:10.1016/j.erss.2021.102422
Marszal, A. J., Heiselberg, P., Jensen, R. L., and Nørgaard, J. (2012). On-site or off-site renewable energy supply options? Life cycle cost analysis of a net zero energy building in Denmark. Renew. Energy 44, 154–165. doi:10.1016/j.renene.2012.01.079
Nam, E., and Jin, T. (2021). Mitigating carbon emissions by energy transition, energy efficiency, and electrification: difference between regulation indicators and empirical data. J. Clean. Prod. 300, 126962. doi:10.1016/j.jclepro.2021.126962
Nam, E. K., Jensen, T. E., and Wallington, T. J. (2004). Methane emissions from vehicles. Environ. Sci. Technol. 38 (Issue 7), 2005–2010. doi:10.1021/es034837g
NEPA (1969). National Environmental Policy Act. 42 U.S.C. §§ 4321 et seq. Available online at: https://www.energy.gov/sites/default/files/2023-08/NEPA%20reg%20amend%2006-2023.pdf.
NREL (2023). Annual technology baseline. Golden, CO: National Renewable Energy Laboratory. Available online at: https://atb.nrel.gov/electricity/2023/technologies.
Nwadiaru, O. V., Bates, A., Goldstein, A., Cantor, J., Cowan, M., Shokooh, M. P., et al. (2025). Imagining a future without fossil fuels: from mid-transition to net zero in a new England environmental justice city. Appl. Energy 389, 125664. doi:10.1016/j.apenergy.2025.125664
OMB (2023). Circular A-94: guidelines and discount rates for benefit-cost analysis of federal programs. Office Manag. Budg. Available online at: https://obamawhitehouse.archives.gov/sites/default/files/omb/assets/a94/a094.pdf.
Reeder, L. (2016). Net zero energy buildings: case studies and lessons learned. London, UK: Taylor and Francis, Routledge is the imprint. 1st ed. Routledge. doi:10.4324/9781315644769
Rodríguez, M. C., Schwentner, E., Falchi, E., Suchodolski, A., and Pizarro, R. (2024). National greenhouse gas emission inventories, filling the gaps in official data. OECD Environ. Work. Pap. No. 252. doi:10.1787/f19f1663-en
Ruparathna, R., Hewage, K., and Sadiq, R. (2017). Rethinking investment planning and optimizing net zero emission buildings. Clean. Techn Environ. Policy 19, 1711–1724. doi:10.1007/s10098-017-1359-4
Shindell, D., Faluvegi, G., Seltzer, K., and Shindel, C. (2018). Quantified, localized health benefits of accelerated carbon dioxide emissions reductions. Nat. Clim. Change 8, 291–295. doi:10.1038/s41558-018-0108-y
Steinberg, D., Bielen, D., Eichman, J., Eurek, K., Logan, J., Mai, T., et al. (2017). Electrification and decarbonization: exploring U.S. energy use and greenhouse gas emissions in scenarios with widespread electrification and power sector decarbonization. Golden, CO: National Renewable Energy Laboratory. doi:10.2172/1372620
The White House (2021). Federal sustainability plan: catalyzing america’s clean energy industries and jobs. Available online at: https://www.sustainability.gov/pdfs/federal-sustainability-plan.pdf.
U.S. Census Bureau (2023b). “Hispanic or Latino Origin by Race.” american community survey, ACS 5-Year estimates detailed tables, table B03002, 2022. Available online at: https://data.census.gov/table/ACSDT5Y2022.B03002?q=B03002:HISPANICORLATINOORIGINBYRACE&g=010XX00US$1500000&y=2022.
USGS (2024). Annual NLCD collection 1 science products. U.S. Geol. Surv. data release. U.S. Geol. Surv. doi:10.5066/P94UXNTS
Weerasinghe, L. N. K., Darko, A., Chan, A. P. C., Blay, K. B., and Edwards, D. J. (2024). Measures, benefits, and challenges to retrofitting existing buildings to net zero carbon: a comprehensive review. J. Build. Eng. 94, 109998. doi:10.1016/j.jobe.2024.109998
Yang, Z., Kagawa, S., and Li, J. (2021). Do greenhouse gas emissions drive extreme weather conditions at the city level in China? Evidence from spatial effects analysis. Urban Clim. 37 (2021), 100812. doi:10.1016/j.uclim.2021.100812
Zeise, L., and Blumenfeld, J. (2022). Impacts of Greenhouse Gas Emissions Limits within Disadvantaged Communities: Progress Toward Reducing Inequities. Office of Environmental Health Hazard Assessment. Available online at: https://oehha.ca.gov/media/downloads/environmental-justice/impactsofghgpoliciesreport020322.pdf.
Keywords: net-zero, emissions, resilience, environmental justice, life cycle cost analysis, carbon-free energy, electrification
Citation: Solana AE, Mott AR, Anderson DM, Niebylski CR, DeStephano PJ and Weimar MR (2025) Greenhouse gas emissions reduction strategies that maximize portfolio-wide life cycle cost reduction, resilience, and environmental justice benefits. Front. Environ. Sci. 13:1577078. doi: 10.3389/fenvs.2025.1577078
Received: 14 February 2025; Accepted: 23 June 2025;
Published: 17 July 2025.
Edited by:
Jill A. Engel-Cox, University of Colorado Denver, United StatesReviewed by:
Henrique A. Matos, University of Lisbon, PortugalMelanie McDermott, The College of New Jersey, United States
Janis Krumins, University of Latvia, Latvia
Copyright © 2025 Solana, Mott, Anderson, Niebylski, DeStephano and Weimar. This is an open-access article distributed under the terms of the Creative Commons Attribution License (CC BY). The use, distribution or reproduction in other forums is permitted, provided the original author(s) and the copyright owner(s) are credited and that the original publication in this journal is cited, in accordance with accepted academic practice. No use, distribution or reproduction is permitted which does not comply with these terms.
*Correspondence: Amy E. Solana, YW15LnNvbGFuYUBwbm5sLmdvdg==