 Ye Wang
 Zhong-cai Xue1,2
 Wei Ren
- 1College of Resources and Environmental Sciences, Hebei Minzu Normal University, Chengde, Hebei, China
- 2Hebei Key Laboratory of Mountain Geological Environment, Chengde, Hebei, China
- 3College of Beiyan Business, Hebei Minzu Normal University, Chengde, Hebei, China
Introduction: Understanding ecological vulnerability and its impact on ecosystem services is essential for promoting sustainable environmental management, particularly in ecologically fragile areas. This study focuses on the Zhangjiakou–Chengde area (ZC area), a representative ecologically sensitive area, and explores the mechanisms through which ecological vulnerability influences ecosystem service value.
Methods: Based on the evaluation results of the ecosystem service value (ESV) and the ecological vulnerability index (EVI), this study employs Geodetector and constraint line analysis methods to examine their interrelationships.
Results: The results indicate that: (1) from 2000 to 2020, there was a significant negative spatial correlation between ESV and EVI in the ZC area, with clusters of low ESV–high EVI in the west and high ESV–low EVI in the east; (2) among all the driving factors of EVI, fractional vegetation cover, land use intensity index, average annual precipitation, and population density were identified as the most influential factors on ESV. These variables exhibited clear threshold effects: ESV initially increased with the variable but began to decline after a certain threshold was exceeded; and (3) EVI itself also demonstrated threshold effects on ESV. In 2000 and 2010, ESV growth slowed and then turned negative once EVI exceeded 0.41 and 0.36, respectively. By 2020, EVI showed a consistently suppressive effect on ESV.
Discussion: These findings underscore the importance of identifying critical thresholds in ecosystem management to enhance the protection and sustainable improvement of ecosystem services in ecologically vulnerable areas.
1 Introduction
Ecosystem services are the benefits that ecosystems provide to humans, including functions such as water purification, carbon sequestration, soil conservation, and food supply (Elmqvist et al., 2015). Ecological vulnerability, on the other hand, refers to the sensitivity and adaptive capacity of ecosystems to external stressors, including both natural and human-induced factors (He et al., 2018). Ecological vulnerability is an important factor that limits the level of ecosystem services (Weisshuhn et al., 2018). Research on ecosystem services and ecological vulnerability is crucial for identifying the pressures on ecosystems and implementing strategies for conservation and restoration (Li, 2022). The ability to assess and predict ecosystem services and their vulnerability is increasingly important in light of climate change, land use changes, and growing human populations. Current studies have focused on exploring the spatial and temporal dynamics of ecosystem services and the driving factors behind ecological vulnerability (Bai et al., 2021; Liao et al., 2022). However, there is still a lack of consensus on how exactly ecological vulnerability impacts ecosystem services, particularly in ecologically fragile regions where these effects are more pronounced.
Ecosystem service value (ESV) is a widely used indicator that quantifies the economic value of the benefits provided by ecosystems. The use of ESV allows for an integrated evaluation of ecosystem services, facilitating decision-making processes related to land-use planning, conservation strategies, and resource allocation (Costanza et al., 2014). More recent studies have applied ESV in specific regions to assess the impact of land use changes or climate change on ecosystem services (Rahman and Szabó, 2021; Watson et al., 2020). Ecological vulnerability index (EVI) is a critical metric used to assess the degree of ecological vulnerability in a given area, reflecting both the inherent characteristics of the ecosystem and the pressures exerted by external factors (Fang et al., 2019). Models like the Sensitivity–Resilience–Pressure (SRP) model have been widely used to calculate EVI, due to their ability to integrate a wide range of environmental, social, and economic factors that influence ecological vulnerability (Ghosh et al., 2022). The SRP model has proven effective in assessing ecological vulnerability in different regions. For instance, it has been applied in ecologically fragile areas with poor ecological backgrounds and those where frequent human activities have led to increased ecological vulnerability (Li et al., 2021; Yang et al., 2021; Zou et al., 2021). These studies have demonstrated how the SRP model can be used to identify areas of high vulnerability and suggest appropriate management strategies.
Understanding the influence of ecological vulnerability on ecosystem service value is critical for developing strategies that balance conservation with human development (He et al., 2025). Several studies have investigated the relationship between EVI and ESV, often finding that increased vulnerability leads to a reduction in the value of ecosystem services (Xie et al., 2021). For example, in the case of grassland degradation, increased soil erosion and loss of biodiversity have been shown to decrease carbon sequestration and water retention capacity (Zhao et al., 2020). However, these relationships are not always linear, and small changes in driving factors can lead to significant shifts in the level of ecosystem service (Jantz and Manuel, 2013; Jiang et al., 2024; Martínez-Sastre et al., 2017). Ecological vulnerability does not always affect ecosystem services in a straightforward, linear fashion but rather exhibits threshold effects. This threshold effect is critical for understanding the delicate balance between maintaining ecosystem health and accommodating human activities. By employing constraint line analysis (Huang et al., 2024), this research aims to identify these thresholds and provide insights into where and how ecological management interventions should be targeted.
The Zhangjiakou-Chengde area (ZC area) is a key water conservation zone in northern China and serves as an important ecological barrier for Beijing and Tianjin. Despite its high ecosystem service value, the region remains ecologically fragile due to intensive human activities—such as overgrazing—and climate change impacts like rising temperatures and increasing precipitation variability. This study focuses on the spatiotemporal dynamics of ESV and EVI in the ZC area from 2000 to 2020, aiming to clarify how ecological vulnerability influences ecosystem services. Specifically, it (1) analyzes the spatial clustering patterns of ESV and EVI, (2) identifies dominant EVI-driven factors affecting ESV, (3) explores the threshold characteristics of these factors, and (4) proposes management strategies accordingly. By investigating the constraint and threshold effects of ecological vulnerability drivers on ESV, this study contributes to the theoretical understanding of the interactions between ecosystem services and ecological risks in fragile regions.
2 Materials and data acquisition
2.1 Study area overview
The ZC area, located in the northern part of Hebei Province (39°18′-42°37′N, 113°50′-119°15′E), serves as a critical water source and windward zone for Beijing and Tianjin. Covering an area of 7.63 × 10⁴ km2 (Figure 1), the area features a variety of landforms, including mountains, loess hills, and plateaus. It experiences a temperate continental monsoon climate, with annual precipitation ranging from 300 to 700 mm and average temperatures between −1°C and 9°C. Due to its substantial ecosystem service value, the ZC area plays an essential role in water conservation, soil erosion control, and carbon sequestration. However, according to the China Ecosystem Assessment and Ecological Security Database (http://www.ecosystem.csdb.cn/index.jsp), it is part of the agro-pastoral transition zone, making the region highly ecologically fragile. Water scarcity, overgrazing, and land degradation—further intensified by climate change and unsustainable land use—pose serious threats to the region’s ecological balance and compromise its ability to deliver essential ecosystem services. These mounting pressures underscore the urgent need for targeted restoration efforts and sustainable management strategies.
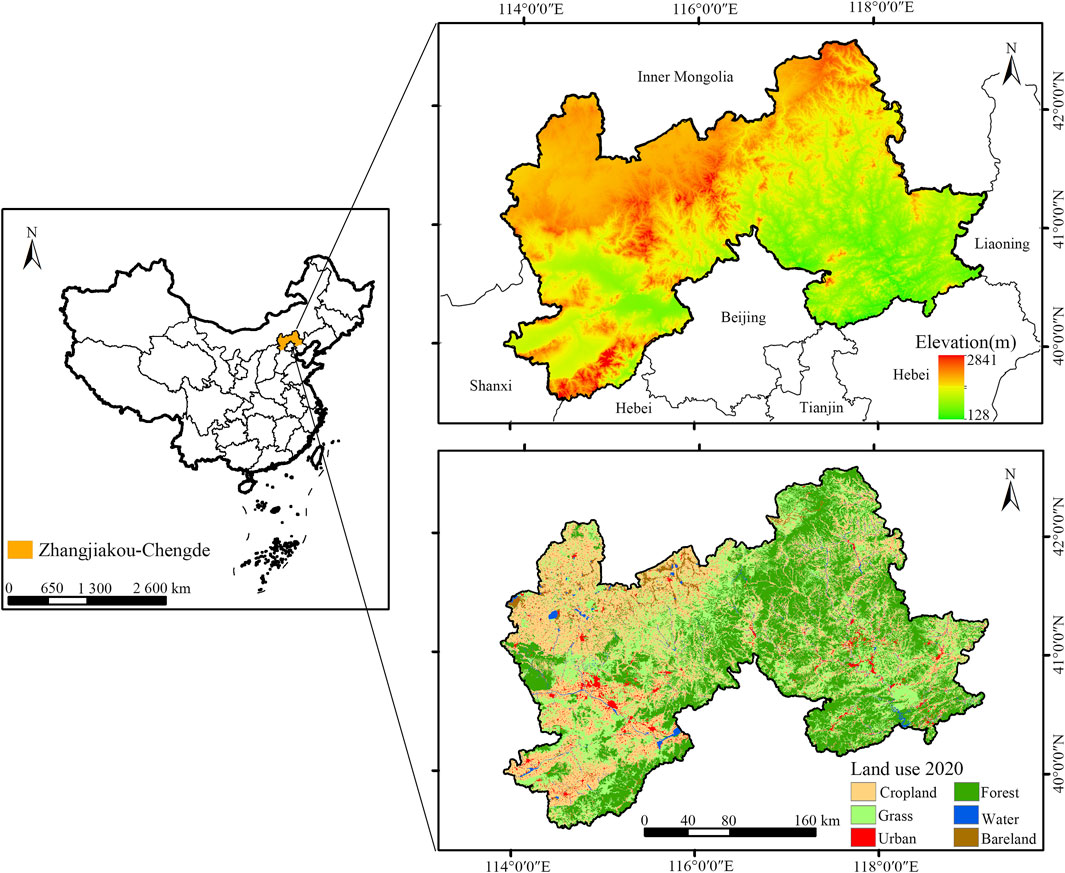
Figure 1. Location of the study site. The base map is from the standard map of China issued by the Ministry of Natural Resources, with the review number GS (2019)1822.
2.2 Data sources and preprocessing
This study utilized a wide range of datasets, including land use, meteorological, soil, vegetation index (NDVI), digital elevation model (DEM), and socio-economic data for the ZC area. Land use data were obtained from the Resource and Environment Science Data Center of the Chinese Academy of Sciences (https://www.resdc.cn/), providing raster datasets for the years 2000, 2010, and 2020 at a spatial resolution of 30 m. Land use was categorized into six types: cropland, forest, grassland, water bodies, built-up areas, and unused land. Meteorological data—including monthly precipitation and potential evapotranspiration—were collected from 30 meteorological stations near the study area through the China Meteorological Data Sharing Service (https://data.cma.cn/) for the period 2000–2020. Soil data were derived from the Harmonized World Soil Database (HWSD), using the “China Soil Dataset.” NDVI data were sourced from the National Ecological Science Data Center (http://www.nesdc.org.cn/), with a 30 m resolution. DEM data were acquired from the Geospatial Data Cloud (http://www.gscloud.cn/) at a spatial resolution of 90 m. Socio-economic data were gathered from multiple sources, including the “China Urban Statistical Yearbook,” “China County Statistical Yearbook,” “Hebei Statistical Yearbook,” and statistical yearbooks of relevant prefecture-level cities.
To eliminate the influence of data outliers and standardize different data scales, the study area was divided into 1 km × 1 km grid cells using the Fishnet tool in ArcGIS 10.8. The mean value of each grid cell was extracted, resulting in a total of 76,200 cells (7.62 × 10⁴), which were subsequently used for the calculation and assessment of ESV and EVI.
3 Methods
The theoretical framework of this study is grounded in the interaction between ESV and EVI, underpinned by the ecosystem service cascade theory and vulnerability assessment frameworks. This perspective posits that EVI, influenced by both natural and anthropogenic drivers, can significantly affect the capacity of ecosystems to deliver services. Accordingly, the workflow of this study involves several key steps. It begins with the collection and preprocessing of land use, climate, soil properties, and socio-economic data. ESV is then assessed across four categories: provisioning, regulating, supporting, and cultural services. To evaluate EVI, the SRP model is applied, considering indicators such as terrain, meteorological conditions, economic pressure, ecological vitality, and human activities. Based on the theoretical framework, the spatial coupling between ESV and EVI is analyzed to reveal potential trade-offs or synergies. Subsequently, Geodetector is used to identify the explanatory power and interactive effects of EVI driving factors on ESV. Finally, the constraint line method is applied to explore the thresholds and constraint effects of dominant EVI factors on ESV (Figure 2).
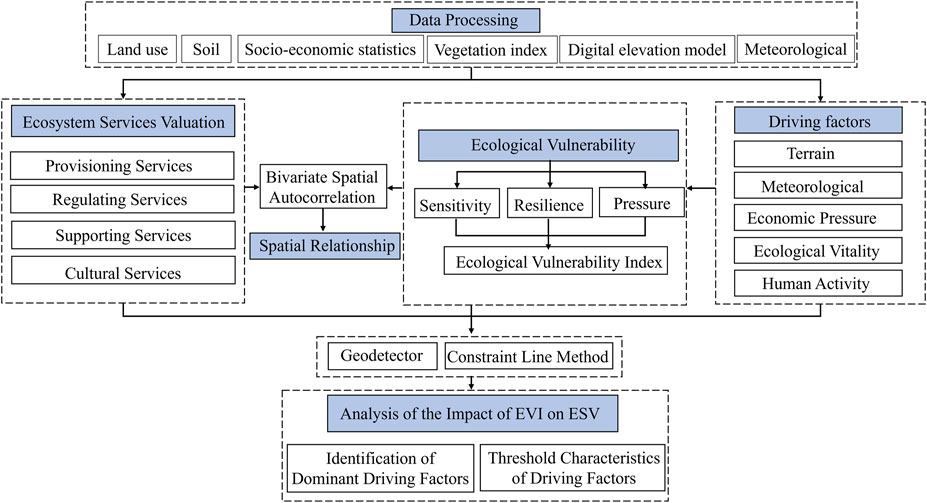
Figure 2. Methodological flowchart for the study on the impact of ecological vulnerability on ecosystem service values and threshold identification.
3.1 ESV assessment
The Equivalent Factor Method is used to estimate the ESV for the ZC area. The calculation formulas are Equations 1, 2 as follows (Costanza et al., 2014; Xie et al., 2017):
Where:
The average crop prices for wheat (2.66 CNY/kg), maize (2.24 CNY/kg), and rice (3.17 CNY/kg) in 2020 are used as the base prices for calculating food prices, based on the “China Agricultural Product Price Survey Yearbook.” After calculation, the average food price for the ZC area is determined to be 2.69 CNY/kg. The average local food yield for the years 2000, 2010, and 2020 in the study area is found to be 3547.55 kg/hm2, and the final calculated ecosystem service value equivalent factor for the ZC area is 1363.27 CNY/hm2.
Subsequently, the Net Primary Productivity (NPP) and precipitation are used to further adjust the equivalent factor. NPP is used to modify the coefficients for eight categories of ecosystem services, including food production, raw material production, gas regulation, climate regulation, environmental purification, nutrient cycling, biodiversity maintenance, and aesthetic landscape services. Precipitation is then used to revise the water resource supply and hydrological regulation service values. After calculations, the NPP mean values for 2000, 2010, and 2020 in the ZC area are found to be 1.27 times the national average, while the average precipitation is 0.64 times the national average. The final ESV coefficient table for the ZC area is shown in Table 1.
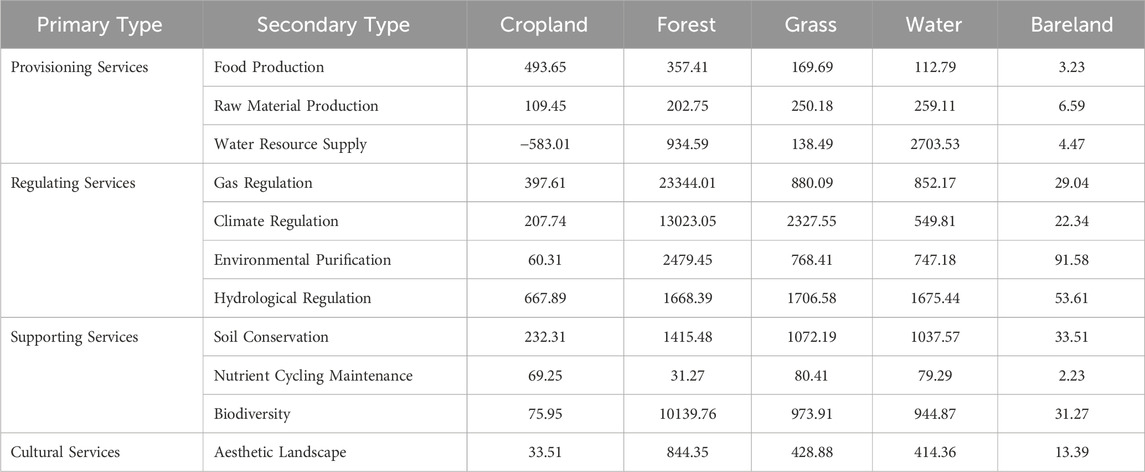
Table 1. Table of ESV coefficient per unit area in the middle reaches of the ZC area (CNY/hm2).
The sensitivity analysis was employed to assess the accuracy of ESV estimation (Kindu et al., 2016). The formula is Equation 3 as follows:
Where: CS is the sensitivity coefficient, VC is the value coefficient, ESV is the total ecosystem services value in the ZC area.
3.2 EVI assessment based on SRP model
The ecological vulnerability assessment is carried out in four key steps: developing the indicator system, normalizing the indicators, determining the weights of the indicators, and calculating the EVI.
First, based on the Sensitivity–Resilience–Pressure (SRP) model (Hong et al., 2016) and taking into account major ecological challenges in the ZC area, such as climate aridity and severe soil erosion, 13 relevant indicators were selected (Table 2), prioritizing the timeliness and availability of data. Sensitivity refers to the extent of an ecosystem’s instability when exposed to disturbances, both natural and human-induced. Terrain and climate-related indicators were used to capture this sensitivity. Resilience reflects the ability of the ecosystem to recover from internal disturbances, and vegetation cover and water system density were chosen as indicators of resilience. Pressure refers to the impacts of external disturbances, typically related to human activities and economic factors, and is quantified through indicators like population density, land use intensity index (Xu and Chi, 2019), and GDP.
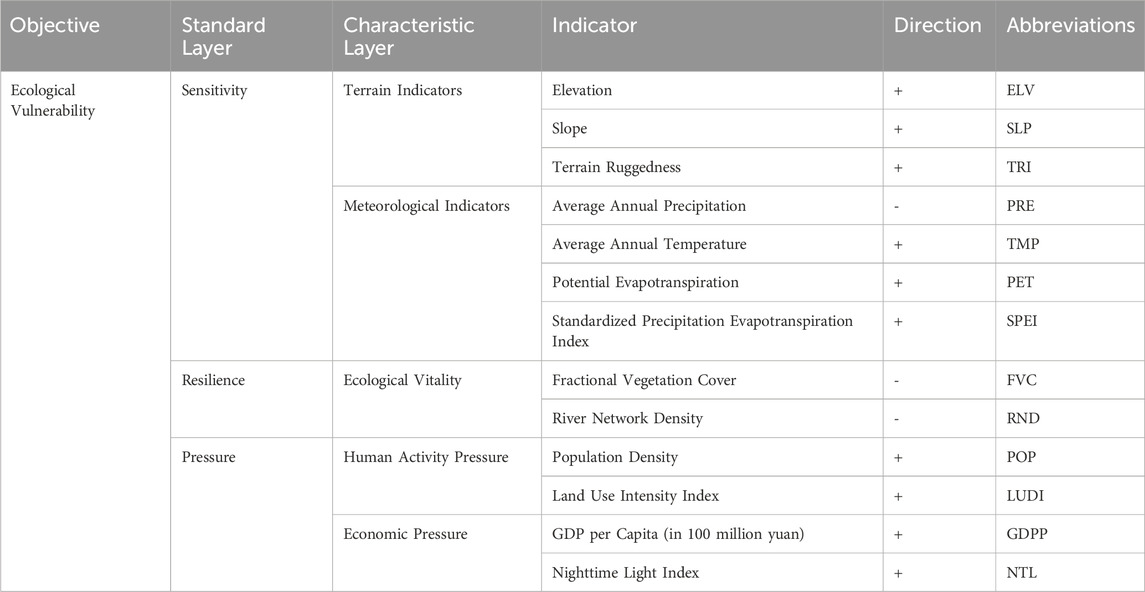
Table 2. Comprehensive ecological vulnerability evaluation indicator system for the ZC area.
To address discrepancies in the units and nature of the indicators, a range normalization method was applied, transforming all indicators into a uniform scale between 0 and 1. The normalization are calculated by Equations 4, 5 as follows (Hong et al., 2016):
Where
Finally, Principal Component Analysis (PCA) was used to select the main components contributing to more than 85% of the cumulative variance, which were then used to calculate the EVI (Abson et al., 2012). The weight of each indicator was determined through a mathematical model, and the formula for computing the EVI is is Equation 6 as follows:
Where
3.3 Spatial analysis
3.3.1 Cold and hot spot analysis
Cold and hot spot analysis is a local spatial autocorrelation method widely used to identify regions with high spatial conflict of a single factor (Li et al., 2019). The Getis-Ord Gi* (Gi*) statistic is typically employed to perform quantitative analysis of hotspots in a region, and the standardized value Z (Gi*) is used to test the statistical significance of the cold and hot spot areas (Han et al., 2020). If Z (Gi*) >0 and passes the significance test, the region is considered a high-value cluster (hot spot); if Z (Gi*) <0 and passes the significance test, the region is considered a low-value cluster (cold spot). In this study, ArcGIS 10.8 was used for cold and hot spot analysis to evaluate the spatial clustering of ESV and EVI. Based on significance testing results at the p = 0.01, p = 0.05, and p = 0.1 levels, the regions were classified into seven categories: Cold Spot - 99% Confidence, Cold Spot - 90% Confidence, Cold Spot - 95% Confidence, Hot Spot - 90% Confidence, Hot Spot - 95% Confidence, Hot Spot - 99% Confidence, and Not Significant.
3.3.2 Bivariate spatial autocorrelation analysis
Bivariate spatial autocorrelation is widely used to explore the spatial distribution relationship between two factors. In this study, the global Moran’s I index (Chen et al., 2023) and the local spatial association index (LISA) (Kowe et al., 2021) were calculated using GeoDa 1.20.0 to analyze the global and local spatial autocorrelation between ESV and EVI for the 76,200 grid cells in the ZC area. The range of Moran’s I is [-1, 1], where Moran’s I >0 indicates that ESV and EVI tend to spatially cluster, showing a positive correlation; Moran’s I <0 indicates that ESV and EVI exhibit a dispersed distribution, showing a negative correlation; and Moran’s I = 0 indicates that the two variables are spatially unrelated. If LISA >0, it indicates that high or low-value grids of ESV and EVI exhibit spatial clustering, resulting in the spatial distribution of High ESV-High EVI or Low ESV-Low EVI. If LISA <0, it indicates that high ESV and low EVI, or low ESV and high EVI, exhibit spatial clustering, resulting in the spatial distribution of High ESV-Low EVI or Low ESV-High EVI. If LISA = 0, it indicates that there is no significant relationship between ESV and EVI.
3.4 Driver impact analysis based on geodetector
This study utilizes the factor detector and interaction detector from Geodetector (Gan et al., 2024) to quantitatively analyze the impact of various driving factors of EVI on ESV. First, ESV was selected as the dependent variable, while the 13 indicators from the EVI evaluation system were considered as independent variables. Each independent variable was classified into five categories using the natural breaks classification method, converting continuous numerical values into categorical factors. The factor detector was then applied to calculate the explanatory power (q value) of the independent variables on the dependent variable. A higher q value indicates a stronger explanatory power of the independent variable, and vice versa. The interaction detector was used to detect whether the interaction between two independent variables increases or decreases their explanatory power on the dependent variable. The results were divided into five categories (Table 3).
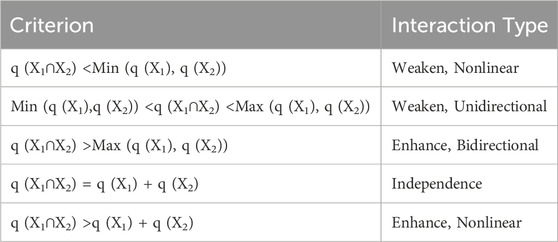
Table 3. Classification of interaction detector interaction types.
3.5 Constraint effects and threshold identification of influencing factors
The scatter data of ESV and its influencing factors do not always follow a linear distribution but instead exhibit a scatter cloud pattern with certain boundaries. This indicates that the explanatory variables impose constraints on the response variable, limiting its variation within a certain boundary range (i.e., the constraint line) (Li et al., 2022). By extracting the boundary points and fitting a constraint line equation, the relationship of constraint imposed by the influencing factors on ESV can be identified.
In this study, the top four dominant factors, which have the largest explanatory power based on the q values calculated by Geodetector, were selected as the x-axis variables, while ESV was chosen as the y-axis variable to construct a two-dimensional scatter plot. The x-axis data were then divided into 65 equal intervals, and the boundary points for each interval were identified. Based on these boundary points, local regression fitting was used to construct the constraint line between ESV and the dominant factors. The goodness of fit was tested using the coefficient of determination (R2) (Hao et al., 2019). Finally, the inflection points of the constraint line were used to identify the threshold values of the dominant factors.
4 Results
4.1 Spatiotemporal distribution characteristics of ESV and EVI
The total ESV of the ZC area was 1.75 × 10¹¹ CNY in 2000, 1.85 × 10¹¹ CNY in 2010, and 1.94 × 10¹¹ CNY in 2020. As shown in Figures 3a–c, the spatial distribution of ESV reveals a distinct pattern of higher values in the eastern part of the area and lower values in the west. High-value areas are primarily located in the Inner Mongolian Plateau and the Yanshan Mountain hills in the east, while low-value areas are concentrated in the western reclamation zones. To assess the reliability of the ESV estimates, the VC was adjusted by ±50% to calculate the CS for each land use type in the ZC area (Table 4). The CS values were all below one across the 3 years, indicating that the ESV estimates are inelastic to VC changes and thus considered robust. This supports the validity of the selected value coefficients.
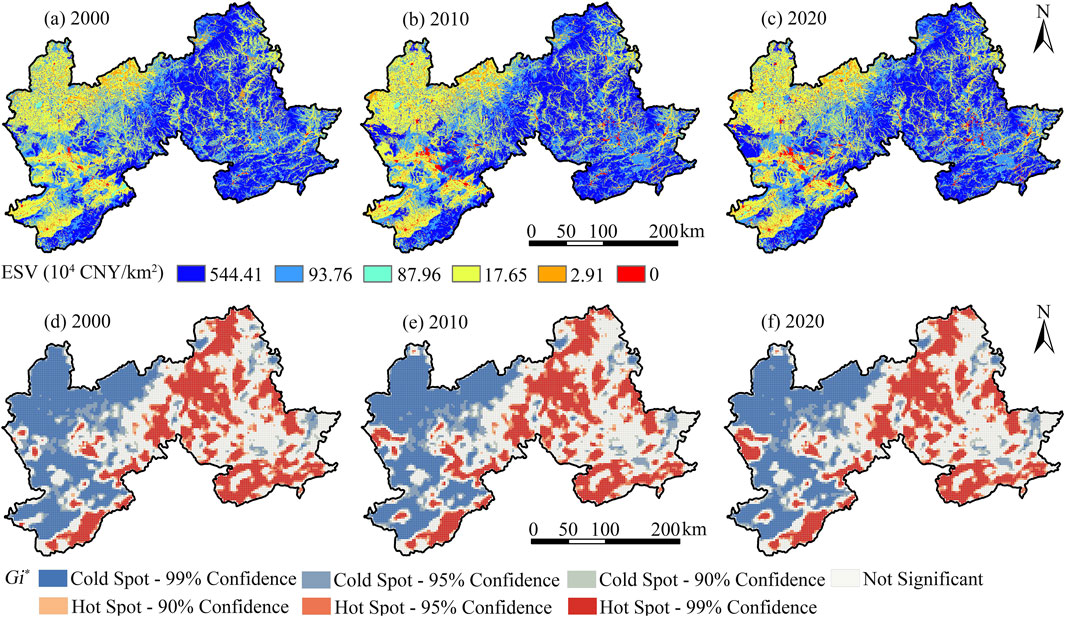
Figure 3. Spatial distribution and cold/hot spots distribution of ESV in the ZC area in 2000, 2010, and 2020. Note: (a–c) Spatial distribution of ESV; (d–f) Spatial distribution of ESV cold/hot spots.
Table 4. Coefficient sensitivity of ESV.
Figures 3d–f reveal significant cold spot clustering in the western part of the area, while hot spot clusters are predominantly found in the central and eastern areas. Notably, some cold spot areas transitioned into hot spots over the study period, with 12.75% of cold spot areas shifting to hot spots from 2000 to 2020. Hot spots in the western area have expanded considerably, while the distribution of hot and cold spots in the eastern area has remained relatively stable.
Figures 4a–c demonstrate that the EVI in the ZC area followed a spatial distribution pattern characterized by higher values in the west and lower values in the east. From 2000 to 2020, the overall EVI showed a significant decline. In the eastern area, ecological vulnerability decreased from a medium to a light level, and in the southeastern area, it dropped further to a slight level. In the west, vulnerability decreased from a heavy to a medium or light level, although certain areas still exhibited very high levels of vulnerability. Figures 4d–f reveal pronounced hot spot clustering in the western area, while cold spots were mainly concentrated in the southeastern and northeastern parts. Both hot spot areas in the west and cold spot areas in the east expanded during the study period. From 2000 to 2020, the cold spot area grew by 5,300 km2, while the hot spot area expanded by 3,100 km2. As shown in Figure 5, the average EVI in the ZC area was 0.59 in 2000, indicating a medium level of ecological vulnerability. The most frequent EVI values occurred around 0.5. In 2010 and 2020, the average EVI values declined to 0.42 and 0.41, respectively, corresponding to a light level of ecological vulnerability, with the highest frequency of values falling within the 0.3–0.4 range.
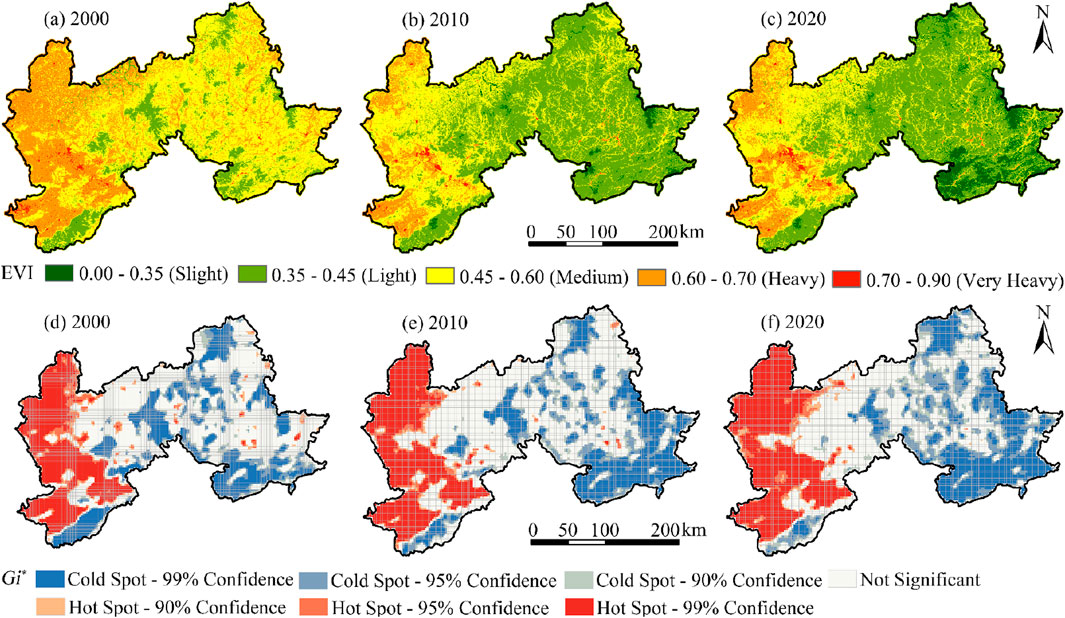
Figure 4. Spatial distribution and cold/hot spots distribution of EVI in the ZC area in 2000, 2010, and 2020. Note: (a–c) Spatial distribution of EVI; (d–f) Spatial distribution of EVI cold/hot spots.

Figure 5. Temporal changes of ESV and EVI in the ZC area. In 2000, 2010, and 2020.
Spatially, ESV and EVI exhibit contrasting distribution patterns across the ZC area. Temporally, ESV increased by 5.98% from 2000 to 2010, while EVI declined by 28.81%. From 2010 to 2020, ESV continued to rise by 4.88%, whereas EVI further declined by 2.38%. Overall, ESV and EVI display opposing trends in both spatial and temporal dimensions.
4.2 Spatial clustering characteristics of ESV and EVI
Figures 6a–c display the Moran’s I values for ESV and EVI in the ZC area for the years 2000, 2010, and 2020, which were −0.574, −0.534, and −0.602, respectively. These values indicate a significant negative spatial correlation between ESV and EVI. Figures 6d–f illustrate the spatial distribution of bivariate clustering types for ESV and EVI. The results show that the western area of the ZC area is predominantly characterized by the Low ESV–High EVI type, whereas the eastern area is mainly dominated by the High ESV–Low EVI type. Over time, the High ESV–High EVI cluster has expanded westward, while the Low ESV–Low EVI cluster has grown in the east. Concurrently, the area classified as ‘Not Significant’ in the central area has gradually diminished. Figures 6g–i further demonstrate that the spatial autocorrelation of ESV and EVI has become more pronounced over time in both the eastern and western areas, while remaining relatively weak in the central part.
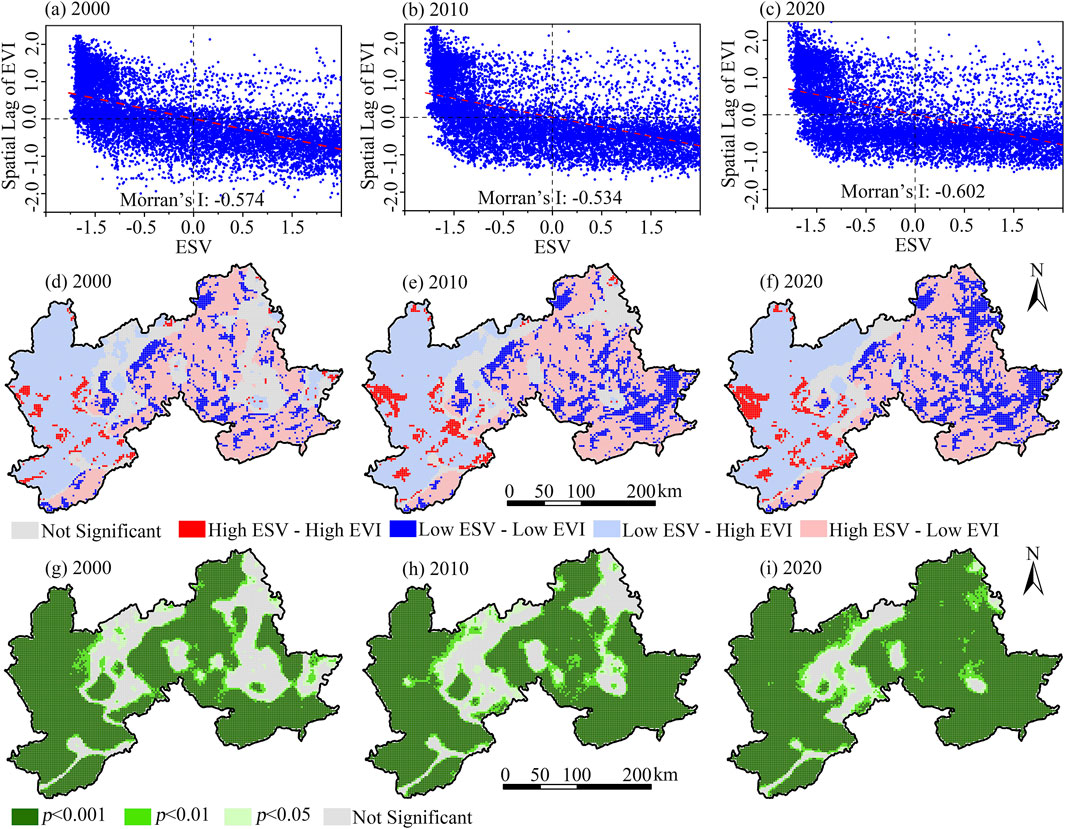
Figure 6. Bivariate spatial autocorrelation of ESV and EVI in the ZC area in 2000, 2010, and 2020. Note: (a–c) Morran scatter plots of bivariate spatial autocorrelation of ESV and EVI; (d–f) Spatial distribution of bivariate spatial autocorrelation of ESV and EVI; (g–i) Significant spatial distribution of bivariate spatial autocorrelation of ESV and EVI.
Figure 7 presents the transitions among different ESV and EVI clustering types during the years 2000, 2010, and 2020. The results reveal that the areas classified as High ESV–High EVI, Low ESV–Low EVI, and High ESV–Low EVI increased steadily over time. In contrast, the Low ESV–High EVI type first declined and later experienced a resurgence, while the ‘Not Significant’ type continuously decreased. From 2000 to 2010, the expansion of the High ESV–High EVI cluster was primarily attributed to the conversion from the Low ESV–High EVI type, accounting for 1,050 km2. During the same period, the growth of the Low ESV–Low EVI and High ESV–Low EVI clusters was largely due to the transformation from the Not Significant type, with conversion areas of 2,631.25 km2 and 2,293.75 km2, respectively. From 2010 to 2020, the High ESV–High EVI type continued to expand, again mainly due to conversion from the Low ESV–High EVI type, with a conversion area of 450.21 km2. The increase in Low ESV–Low EVI, Low ESV–High EVI, and High ESV–Low EVI types was primarily driven by transformation from the Not Significant type, with respective conversion areas of 2,550 km2, 2,462.5 km2, and 1,656.25 km2.
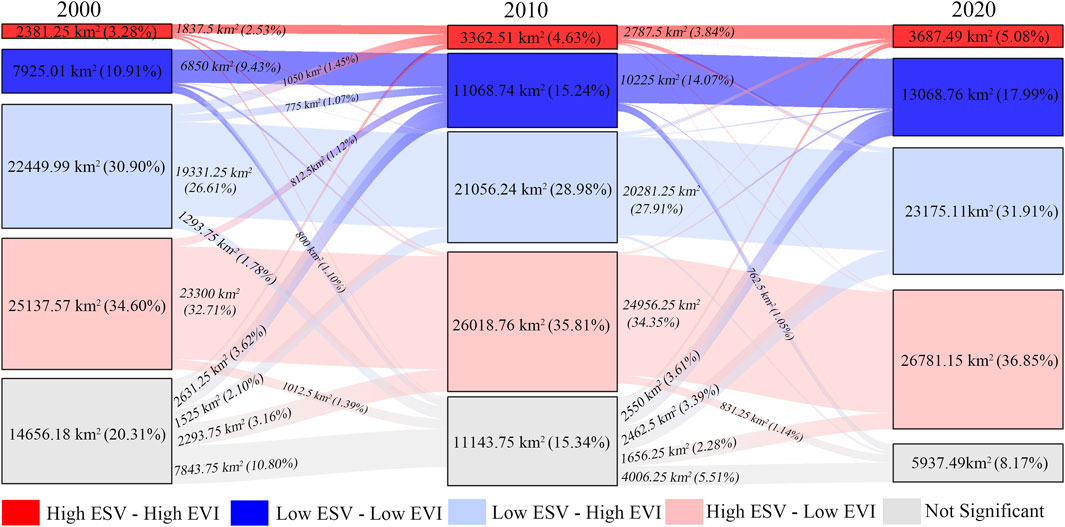
Figure 7. Transition of correlation types between ESV and EVI from 2000 to 2020.
4.3 The impact of EVI driving factors on ESV
Figure 8 presents the explanatory power of 13 EVI driving factors on the spatial differentiation of ESV. The results show that in 2000, 2010, and 2020, FVC consistently exhibited the highest explanatory power, with an average q value of 0.658. This was followed by LUDI (0.622), PRE (0.571), and POP (0.433). The remaining factors had average q values below 0.3, indicating relatively low explanatory power. Over time, the influence of FVC gradually declined, LUDI remained stable, PRE first decreased and then increased, while the explanatory power of POP steadily rose.
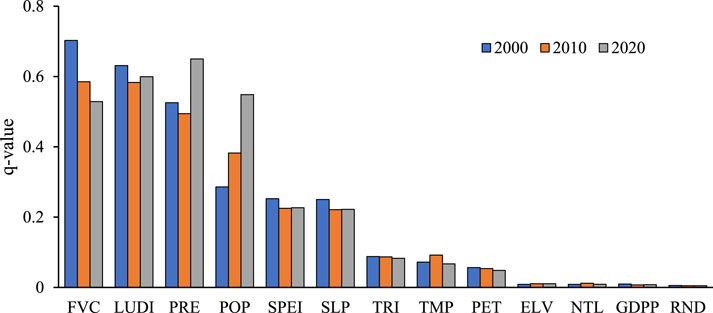
Figure 8. The impact of EVI driving factors on ESV from 2000 to 2020.
Figure 9 illustrates the interactive effects of the 13 EVI driving factors on the spatial differentiation of ESV. Figures 9a–c reveal three types of factor interactions: bidirectional enhancement, independent enhancement, and nonlinear enhancement. These results suggest that the interaction between two factors has a greater impact on the spatial differentiation of ESV than each factor acting independently. In 2000, the strongest interactions were observed between FVC and LUDI (q = 0.794), FVC and SPEI (q = 0.767), and FVC and slope (SLP) (q = 0.340). In 2010, the top interactions were FVC∩LUDI (q = 0.715), LUDI∩SPEI (q = 0.700), and LUDI∩SLP (q = 0.695). In 2020, the most significant interactions included PRE∩PET (q = 0.713), LUDI∩SPEI (q = 0.706), and PRE∩SPEI (q = 0.705). As shown in Figure 9d, bidirectional enhancement remained the predominant interaction type throughout the study period. However, the proportion of nonlinear enhancement interactions increased noticeably over time, while the share of independent enhancement interactions also rose slightly.
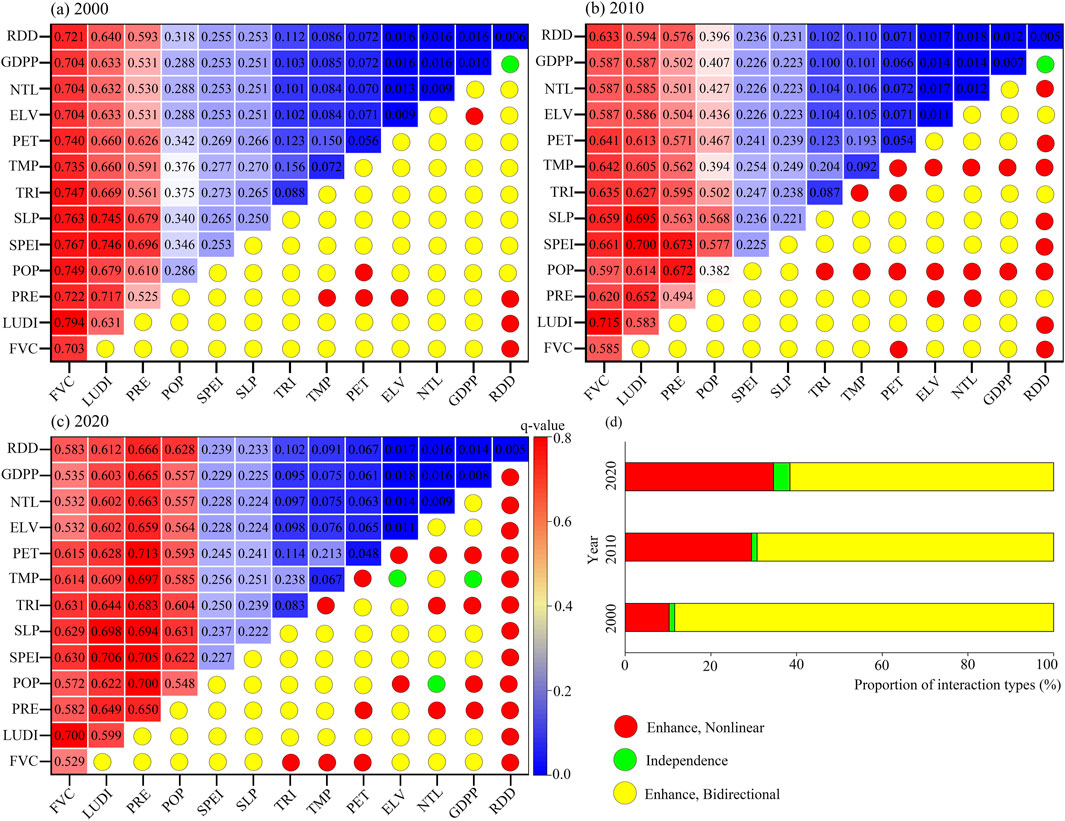
Figure 9. The impact of interactions between EVI driving factors on ESV from 2000 to 2020. Note: (a-c) Interactions between EVI driving factors and ESV from 2000 to 2020. (d) Proportion of interaction types.
4.4 The constrained relationship and thresholds of EVI driving factors on ESV
Based on the results of the factor detection analysis, this study selects FVC, LUDI, PRE, and POP as the dominant factors influencing ESV from among the 13 EVI driving factors, and further investigates their constraint effects and threshold characteristics, along with those of EVI, on ESV. Figures 10a–c show that FVC has an overall promoting effect on ESV, meaning that ESV increases with the increase of FVC. However, when FVC reaches 50%–60%, this promoting effect begins to weaken. Figures 10d–f demonstrate that LUDI shows a threshold effect on ESV, where ESV first increases with LUDI, but starts to decline once a certain threshold is exceeded. The threshold values of LUDI for 2000, 2010, and 2020 are 213.74, 215.75, and 218.49, respectively, with a slight increase over time. Figures 10g–i indicate that ESV increases with PRE initially, but then decreases. The threshold values for PRE in 2000, 2010, and 2020 are 412.05 mm, 515.79 mm, and 607.03 mm, respectively, with a noticeable increase over time. Figures 10j–l show that POP demonstrates a threshold effect on ESV in 2000 and 2010, with the threshold values being 77.03 people/km2 and 81.45 people/km2, respectively. In 2020, POP has a monotonous suppressive effect on ESV. Figures 10m–o show the constraint effects and threshold characteristics of EVI on ESV. The results indicate that EVI exhibited a threshold effect on ESV in 2000 and 2010, with threshold values of 0.41 and 0.36, respectively. In 2020, however, EVI showed a consistently suppressive effect on ESV without a clear threshold.
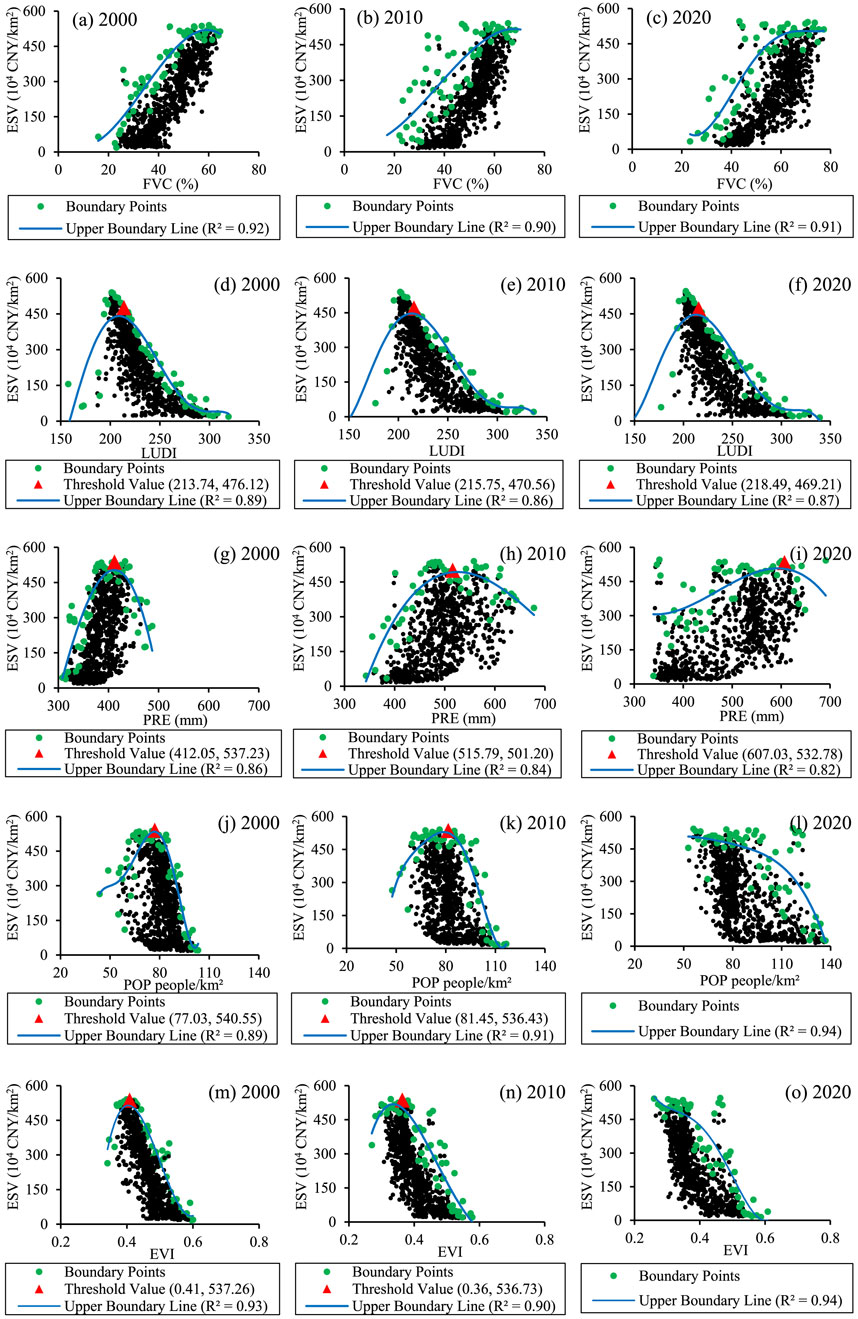
Figure 10. Constraint relationships between EVI and its dominant driving factors with ESV from 2000 to 2020. Note: (a–c) FVC and ESV; (d–f) LUDI and ESV; (g–i) PRE and ESV; (j–l) POP and ESV; (m–o) EVI and ESV.
5 Discussion
5.1 Temporal and spatial distribution characteristics of ESV and EVI
The temporal and spatial patterns of ESV and EVI in the ZC area from 2000 to 2020 reveal clear and significant trends. Over this period, ESV increased steadily, while EVI declined overall. These trends align with broader ecological improvements observed across the Beijing–Tianjin–Hebei area, as documented in previous research (Xie et al., 2018). The upward trend in ESV suggests that ecological restoration initiatives—such as afforestation and soil conservation programs—have positively influenced ecosystem functions, enhancing services like water retention, soil preservation, and carbon sequestration (Guo et al., 2022). Meanwhile, the downward trend in EVI reflects a reduction in ecological vulnerability, indicating that the area’s resilience to environmental stressors has improved (Fu and Liu, 2024).
Spatially, the ZC area exhibits a distinct east–west gradient in ESV, with higher values concentrated in the eastern areas and lower values in the west. This spatial disparity is primarily influenced by variations in land use patterns, population density, and the implementation effectiveness of ecological policies. The eastern area benefits from favorable climatic conditions, greater vegetation coverage, and more proactive ecological restoration efforts—such as the Grain-for-Green Program—which have contributed to improved ecosystem functions and increased ESV (Zhu et al., 2022). In contrast, the western region, characterized by arid and semi-arid conditions, experiences greater difficulty in sustaining ecosystem functions, leading to lower ESV and higher EVI. These spatial findings are consistent with previous research conducted in ecologically fragile regions of northern China, where similar east–west gradients in ESV and EVI have been observed (Hu et al., 2022; Tang et al., 2022). Furthermore, the growing prevalence of both High ESV–High EVI and Low ESV–Low EVI clusters over time reflects increasing spatial aggregation of ecological conditions. This pattern highlights the dual effects of ecological restoration and anthropogenic pressure: areas benefiting from effective ecological governance tend to improve in both service provision and resilience, while persistently vulnerable areas lacking adequate intervention remain ecologically degraded. These results underscore the necessity of tailoring restoration and management strategies to local ecological contexts in order to achieve more balanced and sustainable regional outcomes.
The observed pattern of rising ESV alongside declining EVI indicates a generally positive ecological trajectory in the ZC area. This trend is likely the result of effective land management interventions—particularly ecological restoration projects—combined with broader influences such as climate change, evolving land-use policies, and socio-economic development. These findings emphasize the importance of maintaining and strengthening sustainable land use practices and environmental governance to further enhance ecosystem service delivery and reduce ecological vulnerability in the area (Ahammad et al., 2021).
5.2 The impact of EVI driving factors on ESV and threshold identification
This study investigates how key driving factors—namely forest vegetation coverage (FVC), land use and development index (LUDI), precipitation (PRE), population density (POP), and the ecological vulnerability index (EVI)—influence ecosystem service value (ESV), with a particular emphasis on their threshold effects. Identifying and understanding these thresholds is crucial for informing ecological management strategies and policy interventions, particularly in ecologically sensitive areas such as the ZC area.
FVC is a primary driver of ESV, as higher vegetation cover is widely recognized to enhance ecosystem services such as carbon sequestration, water yield, and soil retention (De Carvalho and Szlafsztein, 2019). Although the relationship between FVC and ESV is generally positive (Ashournejad et al., 2019), it is nonlinear and exhibits a clear threshold effect. When FVC exceeds a certain level, further increases in vegetation cover contribute less significantly to ESV. This phenomenon can be attributed to the principle of diminishing returns, whereby forest ecosystems approaching maturity or saturation offer reduced incremental benefits (Yamaura et al., 2021). This phenomenon is largely due to ecological saturation, where nutrient uptake, water use efficiency, and light interception rates reach physiological limits, thereby constraining the marginal gains in ecosystem service outputs. This threshold effect is evident in the ZC area, where areas with high FVC no longer experience proportional increases in ESV. Such patterns are consistent with the outcomes of national ecological policies like the Grain-for-Green Program and the Three-North Shelterbelt Project (Mu et al., 2022), which have successfully expanded forest area but may yield diminishing marginal ecological returns in already reforested zones (Zhang et al., 2025). These findings underscore the importance of monitoring the long-term effectiveness of afforestation initiatives. Moreover, it is important to acknowledge that these threshold values are not static. They may shift over time due to changing climatic conditions, land-use dynamics, or socio-economic pressures. Therefore, the identified thresholds in this study should be interpreted in the context of current environmental settings and may require periodic reassessment to remain effective in other regions or under future scenarios.
LUDI is another critical factor influencing ESV, as land use changes have a direct and profound impact on ecosystem service provision (Chuai et al., 2016). Urbanization and intensive agricultural activities generally reduce ESV by diminishing natural habitats and accelerating land degradation (Yang et al., 2020). While the relationship between LUDI and ESV is typically negative, the effect is nonlinear. At low to moderate levels of land use intensity, ecosystem services can still be sustained. However, once a certain threshold is exceeded, ESV declines sharply due to habitat fragmentation, soil depletion, and loss of biodiversity (Jantz and Manuel, 2013). In the ZC area, areas with moderate land development tend to support higher ESV, while zones experiencing excessive exploitation exhibit significant ecological deterioration. As ecological zoning and sustainable land-use policies are further refined, identifying and respecting these thresholds will be vital to preventing irreversible ecological damage (Yang et al., 2024). While our current analysis focuses on single-factor thresholds, future research could benefit from integrated models capable of capturing complex interactions among multiple drivers (Hu et al., 2023). Agent-based models or complex systems models, for instance, could provide more dynamic simulations of human–environment interactions and better reflect nonlinear feedbacks across spatial and temporal scales.
PRE, as a key climatic factor, plays a significant role in shaping ESV by influencing water availability within ecosystems (Jiang et al., 2021). In the ZC area, increased precipitation generally enhances ecosystem services by promoting vegetation growth and increasing water yield. However, this relationship also exhibits a threshold effect: beyond a certain point, additional rainfall no longer yields proportional gains in ESV. In fact, excessive precipitation can lead to soil erosion, surface runoff, or flooding, thereby reducing the efficiency and sustainability of ecosystem functions. This nonlinearity reflects the ecological carrying capacity of local landscapes and regional climate variability (Feng et al., 2021). Given the intensifying impacts of climate change and altered precipitation regimes, it is crucial to incorporate threshold-sensitive planning into adaptive management strategies.
POP is another key driver that directly affects ESV, as higher human population concentrations often intensify pressures on natural resources such as water, soil, and biodiversity (Liu et al., 2024). The relationship between POP and ESV is generally negative, especially in ecologically sensitive areas. In the ZC area, lower population densities are associated with relatively high ESV, whereas areas experiencing rapid population growth tend to show notable declines in ESV due to resource overuse. This may be due to ecosystem overexploitation, where increased human activities surpass the regenerative capacity of natural resources, leading to sustained ecological degradation. Interestingly, this effect also demonstrates threshold behavior: beyond a certain density, further increases in population may not significantly deteriorate ESV, provided that effective environmental management and urban planning are implemented (Zhao et al., 2025). This nonlinear relationship highlights the importance of managing demographic expansion in fragile ecological zones (Jantz and Manuel, 2013). China’s policies on population control, ecological resettlement, and sustainable urbanization will be critical for mitigating these impacts and maintaining ecosystem service capacity. In 2020, both POP and EVI showed a monotonous suppressive effect on ESV, indicating that any increase in these variables corresponded with a continuous decline in ESV, without a detectable inflection point. This suggests a sustained negative pressure rather than a threshold-based shift, implying that strict controls on population growth and ecological stress are essential across the entire range, rather than only beyond certain levels.
The EVI itself plays a central role in determining the spatial distribution of ESV. Higher EVI values, indicative of greater ecological vulnerability, are generally associated with lower ecosystem service capacity (Xie et al., 2021). This inverse relationship is nonlinear and exhibits threshold effects, particularly in areas facing severe ecological degradation. In the ZC area, areas with elevated EVI often suffer from depleted natural resources, reducing their ability to maintain essential ecosystem services. This threshold phenomenon underscores the importance of implementing targeted land management and ecological restoration strategies aimed at lowering ecological vulnerability and, in turn, enhancing ecosystem service provision.
5.3 Theoretical contributions and practical implications
This study provides both theoretical insights and practical value for understanding ecosystem service dynamics and ecological vulnerability in ecologically fragile regions.
Theoretically, this study enhances the analytical framework for exploring the relationship between ecosystem service value (ESV) and ecological vulnerability index (EVI) by integrating spatial analysis, Geodetector modeling, and threshold effect identification. Whereas previous research has often examined ESV and EVI independently, this study advances the theoretical understanding by systematically analyzing their spatiotemporal coupling and mutual constraints. Moreover, the identification of nonlinear threshold effects among key driving factors—such as FVC, LUDI, PRE, POP, and EVI—introduces a new perspective for assessing ecosystem service dynamics, enriching existing literature on ecological response thresholds in fragile environments. Additionally, the quadrant-based classification system and spatial clustering approach using Z-score normalization offer a replicable and scalable method for identifying zones of synergy or mismatch between ESV and EVI, thereby contributing to spatially explicit ecosystem management theory.
From a policy and management standpoint, this study provides actionable guidance for ecological restoration and land-use planning in ecologically fragile areas. First, the identification of threshold effects reveals critical ecological limits, enabling policymakers to avoid exceeding tipping points in ecosystem degradation. Second, areas characterized by high EVI and low ESV require prioritized interventions, including targeted afforestation, soil stabilization, and population relocation or resettlement strategies. Third, the demonstrated effectiveness of national programs—such as the Grain-for-Green initiative and ecological zoning policies—offers empirical support for their continued implementation and refinement. Furthermore, this study shows that well-balanced restoration strategies, tailored to areaal ecological capacity and development intensity, can enhance ecosystem service delivery while mitigating ecological vulnerability. The insights derived from the ZC area offer a valuable reference model for similarly vulnerable areas in northern China and comparable global contexts challenged by land degradation and climate change.
5.4 Limitations and improvements
Although this study has effectively identified key driving factors—such as FVC, LUDI, and POP—and revealed their associated threshold effects, several limitations remain. To enhance the robustness and applicability of the findings, future research should address the following areas.
5.4.1 Temporal variability of thresholds
The identified thresholds may not be static over time. Ecosystems are inherently dynamic, and threshold values are likely to shift in response to changing environmental conditions (Xu et al., 2020). Future studies should incorporate longitudinal data to examine how these thresholds evolve across different temporal scales.
5.4.2 Context-specific thresholds
The thresholds identified in this study may not fully capture spatial heterogeneity. Ecological responses can vary significantly across regions due to local biophysical and socio-economic contexts (Jia et al., 2018). Future research should pursue area-specific analyses to refine threshold estimates that are more locally relevant.
5.4.3 Policy and climate sensitivity
Current thresholds have not yet accounted for long-term impacts of ecological policies or climate change. Investigating how thresholds respond to policy interventions and climate variability will deepen understanding of their stability and sensitivity under future scenarios.
5.4.4 Model complexity and integration
There is a need for advanced models that can integrate multiple driving factors and their interactions. Future models should move beyond single-factor thresholds and consider how multiple thresholds may interact or co-vary, thereby improving the explanatory and predictive power of ecosystem service assessments.
5.4.5 Inclusion of socio-ecological variables
Incorporating more nuanced variables—such as socio-economic development, governance, and land management practices—could help capture a more holistic picture of ecological vulnerability and ecosystem service dynamics.
By addressing these limitations, future studies can offer more accurate insights and support the design of adaptive and context-sensitive ecological management strategies, particularly in ecologically fragile regions.
6 Conclusion
This study examines the spatial distribution patterns of ESV and EVI in the ZC area, analyzing their temporal and spatial variations from 2000 to 2020. The results emphasize the relationship between ESV and EVI, as well as the key driving factors and threshold effects that influence ecosystem services in ecologically fragile regions. The main conclusions are as follows: (1) A significant negative spatial correlation exists between ESV and EVI in the ZC area, with prominent clusters of low ESV-high EVI in the western regions and high ESV-low EVI in the eastern regions. (2) The four primary driving factors, including fractional vegetation cover, land use intensity index, average annual precipitation, and population density, have the most significant impact on ESV. Their influence is nonlinear and shows threshold effects, with ESV initially increasing but starting to decline once certain limits are exceeded. (3) EVI exhibits threshold effects on ESV. In 2000 and 2010, EVI had a significant threshold effect, where ESV increased with EVI up to a certain point, after which the relationship became negative. By 2020, however, EVI showed a monotonous suppressive effect on ESV, indicating a stronger influence of ecological vulnerability on ecosystem services. (4) By identifying these critical thresholds, we can better design targeted interventions to enhance ecosystem services and reduce ecological vulnerability, particularly in ecologically fragile regions such as the ZC area. These findings underscore the importance of understanding threshold effects to inform ecological management strategies aimed at enhancing ecosystem services and mitigating ecological vulnerability in fragile regions.
Data availability statement
The original contributions presented in the study are included in the article/supplementary material, further inquiries can be directed to the corresponding author.
Author contributions
YW: Conceptualization, Data curation, Formal Analysis, Investigation, Methodology, Project administration, Resources, Software, Supervision, Validation, Visualization, Writing – original draft, Writing – review and editing. Z-cX: Conceptualization, Writing – original draft. YY: Data curation, Writing – original draft. WR: Data curation, Writing – original draft. A-qJ: Writing – original draft, Writing – review and editing.
Funding
The author(s) declare that financial support was received for the research and/or publication of this article. This work was supported by Hebei Key Laboratory of Mountain Geological Environment (grant numbers: HBKLMGE202403); Higher Education Science and Technology Research Project for Hebei Province (grant numbers: BJK2023105); Youth Fund Project for Hebei Minzu Normal University (grant numbers: QN2024002); Science and Technology Special Project for the Construction of the Chengde National Sustainable Development Agenda Innovation Demonstration Area (grant numbers: 202302F006); Team Development Fund Project for University-level Scientific Research, Hebei Minzu Normal University (grant numbers: TD2024002).
Acknowledgments
The authors are grateful to the editor and reviewers for their careful and valuable suggestions.
Conflict of interest
The authors declare that the research was conducted in the absence of any commercial or financial relationships that could be construed as a potential conflict of interest.
Generative AI statement
The author(s) declare that no Generative AI was used in the creation of this manuscript.
Publisher’s note
All claims expressed in this article are solely those of the authors and do not necessarily represent those of their affiliated organizations, or those of the publisher, the editors and the reviewers. Any product that may be evaluated in this article, or claim that may be made by its manufacturer, is not guaranteed or endorsed by the publisher.
References
Abson, D. J., Dougill, A. J., and Stringer, L. C. (2012). Using principal component analysis for information-rich socio-ecological vulnerability mapping in southern africa. Appl. Geogr. 35 (1-2), 515–524. doi:10.1016/j.apgeog.2012.08.004
Ahammad, R., Stacey, N., and Sunderland, T. (2021). Analysis of forest-related policies for supporting ecosystem services-based forest management in Bangladesh. Ecosyst. Serv. 48, 101235. doi:10.1016/j.ecoser.2020.101235
Ashournejad, Q., Amiraslani, F., Moghadam, M. K., and Toomanian, A. (2019). Assessing the changes of mangrove ecosystem services value in the pars special economic energy zone. Ocean and Coast. Manag. 179, 104838. doi:10.1016/j.ocecoaman.2019.104838
Bai, L., Tian, J. L., Peng, Y., Huang, Y. H., He, X., Bai, X. Y., et al. (2021). Effects of climate change on ecosystem services and their components in southern hills and northern grasslands in China. Environ. Sci. Pollut. Res. 28 (33), 44916–44935. doi:10.1007/s11356-021-13699-8
Chen, W. X., Wang, G. Z., Gu, T. C., Fang, C. L., Pan, S. P., Zeng, J., et al. (2023). Simulating the impact of urban expansion on ecosystem services in Chinese urban agglomerations: a multi-scenario perspective. Environ. Impact Assess. Rev. 103, 107275. doi:10.1016/j.eiar.2023.107275
Chuai, X. W., Huang, X. J., Wu, C. Y., Li, J. B., Lu, Q. L., Qi, X. X., et al. (2016). Land use and ecosystems services value changes and ecological land management in coastal Jiangsu, China. Habitat Int. 57, 164–174. doi:10.1016/j.habitatint.2016.07.004
Costanza, R., de Groot, R., Sutton, P., van der Ploeg, S., Anderson, S. J., Kubiszewski, I., et al. (2014). Changes in the global value of ecosystem services. Glob. Environ. Change-Human Policy Dimensions 26, 152–158. doi:10.1016/j.gloenvcha.2014.04.002
De Carvalho, R. M., and Szlafsztein, C. F. (2019). Urban vegetation loss and ecosystem services: the influence on climate regulation and noise and air pollution. Environ. Pollut. 245, 844–852. doi:10.1016/j.envpol.2018.10.114
Elmqvist, T., Setälä, H., Handel, S. N., van der Ploeg, S., Aronson, J., Blignaut, J. N., et al. (2015). Benefits of restoring ecosystem services in urban areas. Curr. Opin. Environ. Sustain. 14, 101–108. doi:10.1016/j.cosust.2015.05.001
Fang, W., Huang, S. Z., Huang, Q., Huang, G. H., Wang, H., Leng, G. Y., et al. (2019). Probabilistic assessment of remote sensing-based terrestrial vegetation vulnerability to drought stress of the Loess Plateau in China. Remote Sens. Environ. 232, 111290. doi:10.1016/j.rse.2019.111290
Feng, Q., Dong, S. Y., and Duan, B. L. (2021). The effects of land-use change/conversion on trade-offs of ecosystem services in three precipitation zones. Sustainability 13 (23), 13306. doi:10.3390/su132313306
Fu, X. Y., and Liu, Y. J. (2024). Ecological vulnerability assessment and spatiotemporal characteristics analysis of urban green-space systems in beijing-tianjin-hebei region. Sustainability 16 (6), 2289. doi:10.3390/su16062289
Gan, Q. C., Liao, L. Y., Kang, X., Xu, Z. D., Fu, T. Q., Cao, Y., et al. (2024). Cultural ecosystem services and disservices in protected areas: hotspots and influencing factors based on tourists' digital footprints. Ecosyst. Serv. 70, 101680. doi:10.1016/j.ecoser.2024.101680
Ghosh, S., Dinda, S., Das Chatterjee, N., Dutta, S., and Bera, D. (2022). Spatial-explicit carbon emission-sequestration balance estimation and evaluation of emission susceptible zones in an Eastern Himalayan city using Pressure-Sensitivity-Resilience framework: an approach towards achieving low carbon cities. J. Clean. Prod. 336, 130417. doi:10.1016/j.jclepro.2022.130417
Guo, X. M., Fang, C. L., Mu, X. F., and Chen, D. (2022). Coupling and coordination analysis of urbanization and ecosystem service value in Beijing-Tianjin-Hebei urban agglomeration. Ecol. Indic. 137, 108782. doi:10.1016/j.ecolind.2022.108782
Han, R., Feng, C. C. E., Xu, N. Y., and Guo, L. (2020). Spatial heterogeneous relationship between ecosystem services and human disturbances: a case study in Chuandong, China. Sci. Total Environ. 721, 137818. doi:10.1016/j.scitotenv.2020.137818
Hao, R. F., Yu, D. Y., Sun, Y., and Shi, M. C. (2019). The features and influential factors of interactions among ecosystem services. Ecol. Indic. 101, 770–779. doi:10.1016/j.ecolind.2019.01.080
He, J. X., Zhou, Y., Pandey, R., Stringer, L. C., Cao, Y. G., Bhatt, H., et al. (2025). Characteristics and framework for assessing supply and demand relationship for ecosystem services using a trade-off and synergy lens. Land Degrad. and Dev. 36 (6), 1771–1786. doi:10.1002/ldr.5484
He, L., Shen, J., and Zhang, Y. (2018). Ecological vulnerability assessment for ecological conservation and environmental management. J. Environ. Manag. 206, 1115–1125. doi:10.1016/j.jenvman.2017.11.059
Hong, W. Y., Jiang, R. R., Yang, C. Y., Zhang, F. F., Su, M., and Liao, Q. (2016). Establishing an ecological vulnerability assessment indicator system for spatial recognition and management of ecologically vulnerable areas in highly urbanized regions: a case study of Shenzhen, China. Ecol. Indic. 69, 540–547. doi:10.1016/j.ecolind.2016.05.028
Hu, B. F., Xie, M. D., He, R. B., Shi, Z., Zhou, Y., Ni, H. J., et al. (2023). Spatio-temporal evolution of cropland ecosystem services value and its spatially varying dominate over the past two decades: a case study in Jiangxi Province in southern China. J. Clean. Prod. 427, 139228. doi:10.1016/j.jclepro.2023.139228
Hu, S. W., Yang, Y. Y., Li, A., Liu, K., Mi, C. H., and Shi, R. G. (2022). Integrating ecosystem services into assessments of sustainable development goals: a case study of the beijing-tianjin-hebei region, China. Front. Environ. Sci. 10, 897792. doi:10.3389/fenvs.2022.897792
Huang, J. S., Xia, Z. Y., and Liu, L. M. (2024). Impacts of landscape configurations on ecosystem services and their trade-offs across different landscape compositions. Ecosyst. Serv. 70, 101666. doi:10.1016/j.ecoser.2024.101666
Jantz, C. A., and Manuel, J. J. (2013). Estimating impacts of population growth and land use policy on ecosystem services: a community-level case study in Virginia, USA. Ecosyst. Serv. 5, E110–E123. doi:10.1016/j.ecoser.2013.07.005
Jia, Z. M., Ma, B. R., Zhang, J., and Zeng, W. H. (2018). Simulating spatial-temporal changes of land-use based on ecological redline restrictions and landscape driving factors: a case study in beijing. Sustainability 10 (4), 1299. doi:10.3390/su10041299
Jiang, H. Q., Wu, W. J., Wang, J. N., Yang, W. S., Gao, Y. M., Duan, Y., et al. (2021). Mapping global value of terrestrial ecosystem services by countries. Ecosyst. Serv. 52, 101361. doi:10.1016/j.ecoser.2021.101361
Jiang, Y. C., Ouyang, B., and Yan, Z. G. (2024). Multiscale analysis for identifying the impact of human and natural factors on water-related ecosystem services. Sustainability 16 (5), 1738. doi:10.3390/su16051738
Kindu, M., Schneider, T., Teketay, D., and Knoke, T. (2016). Changes of ecosystem service values in response to land use/land cover dynamics in Munessa–Shashemene landscape of the Ethiopian highlands. Sci. Total Environ. 547, 137–147. doi:10.1016/j.scitotenv.2015.12.127
Kowe, P., Mutanga, O., Odindi, J., and Dube, T. (2021). Effect of landscape pattern and spatial configuration of vegetation patches on urban warming and cooling in Harare metropolitan city, Zimbabwe. Giscience and Remote Sens. 58 (2), 261–280. doi:10.1080/15481603.2021.1877008
Li, J. Y. (2022). An assessment of ecological protection importance based on ecosystems services and vulnerabilities in tibet, China. Sustainability 14 (19), 12902. doi:10.3390/su141912902
Li, Q., Shi, X. Y., and Wu, Q. Q. (2021). Effects of protection and restoration on reducing ecological vulnerability. Sci. Total Environ. 761, 143180. doi:10.1016/j.scitotenv.2020.143180
Li, Z. G., Sun, Z. S., Tian, Y. J., Zhong, J. L., and Yang, W. N. (2019). Impact of land use/cover change on yangtze river delta urban agglomeration ecosystem services value: temporal-spatial patterns and cold/hot spots ecosystem services value change brought by urbanization. Int. J. Environ. Res. Public Health 16 (1), 123. doi:10.3390/ijerph16010123
Li, Z. H., Guan, D. J., Zhou, L. L., and Zhang, Y. J. (2022). Constraint relationship of ecosystem services in the yangtze river economic belt, China. Environ. Sci. Pollut. Res. 29 (9), 12484–12505. doi:10.1007/s11356-021-13845-2
Liao, Z. H., Su, K., Jiang, X. B., Zhou, X. B., Yu, Z., Chen, Z. C., et al. (2022). Ecosystem and driving force evaluation of northeast forest belt. Land 11 (8), 1306. doi:10.3390/land11081306
Liu, C., Liu, Q., and Gao, X. C. (2024). Spatial and temporal evolution characteristics of ecosystem service value and population distribution in China's coastal areas. Sustainability 16 (23), 10212. doi:10.3390/su162310212
Martínez-Sastre, R., Ravera, F., González, J. A., Santiago, C. L., Bidegain, I., and Munda, G. (2017). Mediterranean landscapes under change: combining social multicriteria evaluation and the ecosystem services framework for land use planning. Land Use Policy 67, 472–486. doi:10.1016/j.landusepol.2017.06.001
Mu, H. W., Li, X. C., Ma, H. J., Du, X. P., Huang, J. X., Su, W., et al. (2022). Evaluation of the policy-driven ecological network in the Three-North Shelterbelt region of China. Landsc. Urban Plan. 218, 104305. doi:10.1016/j.landurbplan.2021.104305
Nahuelhual, L., Carmona, A., Lozada, P., Jaramillo, A., and Aguayo, M. (2013). Mapping recreation and ecotourism as a cultural ecosystem service: an application at the local level in Southern Chile. Appl. Geogr. 40, 71–82. doi:10.1016/j.apgeog.2012.12.004
Rahman, M. M., and Szabó, G. (2021). Impact of land use and land cover changes on urban ecosystem service value in dhaka, Bangladesh. Land 10 (8), 793. doi:10.3390/land10080793
Tang, X. M., Liu, Y., Ren, Y. M., and Feng, H. Y. (2022). A dynamic evaluation of ecosystem services value in the beijing-tianjin-hebei region based on scarcity modification of spatiotemporal supply-demand influence. Land 11 (9), 1545. doi:10.3390/land11091545
Watson, L., Straatsma, M. W., Wanders, N., Verstegen, J. A., de Jong, S. M., and Karssenberg, D. (2020). Global ecosystem service values in climate class transitions. Environ. Res. Lett. 15 (2), 024008. doi:10.1088/1748-9326/ab5aab
Weisshuhn, P., Müller, F., and Wiggering, H. (2018). Ecosystem vulnerability review: proposal of an interdisciplinary ecosystem assessment approach. Environ. Manag. 61 (6), 904–915. doi:10.1007/s00267-018-1023-8
Xie, G. D., Zhang, C. X., Zhen, L., and Zhang, L. M. (2017). Dynamic changes in the value of China's ecosystem services. Ecosyst. Serv. 26, 146–154. doi:10.1016/j.ecoser.2017.06.010
Xie, Z., Gao, Y., Li, C., Zhou, J., and Zhang, T. Z. (2018). Spatial heterogeneity of typical ecosystem services and their relationships in different ecological-functional zones in beijing-tianjin-hebei region, China. Sustainability 10 (1), 6. doi:10.3390/su10010006
Xie, Z. L., Li, X. Z., Chi, Y., Jiang, D. G., Zhang, Y. Q., Ma, Y. X., et al. (2021). Ecosystem service value decreases more rapidly under the dual pressures of land use change and ecological vulnerability: a case study in Zhujiajian Island. Ocean and Coast. Manag. 201, 105493. doi:10.1016/j.ocecoaman.2020.105493
Xu, F., and Chi, G. Q. (2019). Spatiotemporal variations of land use intensity and its driving forces in China, 2000-2010. Reg. Environ. Change 19 (8), 2583–2596. doi:10.1007/s10113-019-01574-9
Xu, J. Y., Chen, J. X., and Liu, Y. X. (2020). Partitioned responses of ecosystem services and their tradeoffs to human activities in the Belt and Road region. J. Clean. Prod. 276, 123205. doi:10.1016/j.jclepro.2020.123205
Yamaura, Y., Yamada, Y., Matsuura, T., Tamai, K., Taki, H., Sato, T., et al. (2021). Modeling impacts of broad-scale plantation forestry on ecosystem services in the past 60 years and for the future. Ecosyst. Serv. 49, 101271. doi:10.1016/j.ecoser.2021.101271
Yang, H. F., Zhai, G. F., and Zhang, Y. (2021). Ecological vulnerability assessment and spatial pattern optimization of resource-based cities: a case study of Huaibei City, China. Hum. Ecol. Risk Assess. 27 (3), 606–625. doi:10.1080/10807039.2020.1744426
Yang, Y., Yuan, X. F., An, J. J., Su, Q. J., and Chen, B. (2024). Drivers of ecosystem services and their trade-offs and synergies in different land use policy zones of Shaanxi Province, China. J. Clean. Prod. 452, 142077. doi:10.1016/j.jclepro.2024.142077
Yang, Y. J., Wang, K., Liu, D., Zhao, X. Q., and Fan, J. W. (2020). Effects of land-use conversions on the ecosystem services in the agro-pastoral ecotone of northern China. J. Clean. Prod. 249, 119360. doi:10.1016/j.jclepro.2019.119360
Zhang, Y., Chen, X. Y., Zhang, Y., and Wang, B. (2025). Quantitative contribution of climate change and vegetation restoration to ecosystem services in the Inner Mongolia under ecological restoration projects. Ecol. Indic. 171, 113240. doi:10.1016/j.ecolind.2025.113240
Zhao, Y., Chen, Y. P., Wu, W. Q., Tian, H. W., and Zhang, H. W. (2025). Township-level ecological management for enhanced ecosystem services in the qinling mountains. Remote Sens. 17 (2), 272. doi:10.3390/rs17020272
Zhao, Y. Y., Liu, Z. F., and Wu, J. G. (2020). Grassland ecosystem services: a systematic review of research advances and future directions. Landsc. Ecol. 35 (4), 793–814. doi:10.1007/s10980-020-00980-3
Zhu, S. N., Liu, J. L., Xu, H., Li, L. C., and Yang, W. T. (2022). Has China's new round of collective forest reforms reduced forest fragmentation? A case study of the beijing-tianjin-hebei region. Int. J. Environ. Res. Public Health 19 (10), 6183. doi:10.3390/ijerph19106183
Keywords: ecological vulnerability, ecosystem service value, threshold effect, driving factors, ecologically fragile area
Citation: Wang Y, Xue Z-c, Yang Y, Ren W and Ju A-q (2025) The impact of ecological vulnerability on ecosystem service value and threshold identification: a case study of the Zhangjiakou-Chengde area, China. Front. Environ. Sci. 13:1583841. doi: 10.3389/fenvs.2025.1583841
Received: 27 February 2025; Accepted: 04 June 2025;
Published: 13 June 2025.
Edited by:
Bifeng Hu, Jiangxi University of Finance and Economics, ChinaReviewed by:
Tiangui Lv, Jiangxi University of Finance and Economics, ChinaRaul Manuel Costa Alves, Camra Municipal de Machico, Portugal
Cai Chaoyue, Nankai University, China
Copyright © 2025 Wang, Xue, Yang, Ren and Ju. This is an open-access article distributed under the terms of the Creative Commons Attribution License (CC BY). The use, distribution or reproduction in other forums is permitted, provided the original author(s) and the copyright owner(s) are credited and that the original publication in this journal is cited, in accordance with accepted academic practice. No use, distribution or reproduction is permitted which does not comply with these terms.
*Correspondence: An-qi Ju, MTU0MzE0MDI4OUBxcS5jb20=