 Haojun Deng
 Zhuangpeng Zheng
 Qun Cai1*
- 1School of Tourism and Historical Culture, Zhaoqing University, Zhaoqing, Guangdong, China
- 2School of Environment and Tourism, West Anhui University, Lu’an, China
Phytoplankton primary production (PP) underpins the sustainability of aquatic ecosystems in reservoirs. However, national-scale studies of reservoir phytoplankton PP in China remain limited, typically subsumed within lake research, hindering mechanistic understanding of large-scale PP variations. To address this gap, we compiled a database of phytoplankton PP in Chinese reservoirs (1980–2023) based on an exhaustive literature review, incorporating only data measured using the light-dark bottle method. Utilizing this database, this study quantifies phytoplankton PP and carbon sequestration potential across 165 Chinese reservoirs. The result showed that phytoplankton PP ranged 0.13–10.22 g O2·m−2·d−1, with significantly higher values in the Yellow River (YR), Songhua River and Liaohe River (S/LR), and Haihe and Huaihe River (H/HR) basins versus the Pearl River (PR), Northwest Internal Rivers (NIR), and Southwest Rivers (SWR) basins. Temporally, phytoplankton PP peaked in the 1990s, declined thereafter, but rebounded in the 2020s (decadal sequence: 1990s > 2020s > 2000s > 1980s > 2010s). Seasonal variation followed summer > spring > autumn > winter. Sunshine hours, water depth, and rainfall emerged as dominant phytoplankton PP drivers. National phytoplankton PP extrapolation reached 22.08 Tg⋅O2⋅a−1 (1 Tg = 1012 g), equivalent to 6.62 Tg carbon sequestration capacity. Our analysis delineates spatio-temporal patterns of phytoplankton PP in Chinese reservoirs and underscores its significance for regional carbon budgets and aquatic ecosystem dynamics.
1 Introduction
Intensifying industrialization and urbanization underscore the global imperative to mitigate carbon emissions and enhance carbon sinks (Wang et al., 2024). Quantifying carbon sequestration capacities across terrestrial and aquatic ecosystems is critical for offsetting industrial greenhouse gases (Jia et al., 2023). Satellite data since 1980 reveal increasing phytoplankton bloom frequency in global lakes/reservoirs (Ho et al., 2019), signaling significant primary productivity shifts. Such alterations may disrupt aquatic ecosystem dynamics, impair service provision, and threaten system sustainability (Sun et al., 2023). Within the global aquatic carbon cycle, phytoplankton plays an instrumental role in primary production (PP) due to their ability to sequester carbon dioxide. Globally, recent studies estimate that phytoplankton sequester in global inland lakes approximately 1.77 Pg C annually (Gao et al., 2021), highlighting their pivotal role in carbon sink processes across aquatic.
Phytoplankton absorb essential nutrients and, through chlorophyll-driven photosynthesis, produce oxygen while transferring energy to other organisms (Zhang et al., 2016; Rusanov et al., 2022). Phytoplankton are sensitive indicators of physical and chemical changes in aquatic environments (Wei et al., 2024). Their diversity and community structure reflect alterations in water quality (Xiao et al., 2018) and directly influence ecologically and economically important species (Essa et al., 2024). Shifts in phytoplankton communities signal environmental disturbances within watersheds (Wei et al., 2022). Therefore, analyzing phytoplankton responses to physicochemical changes is essential for assessing reservoir water quality and understanding how community structure affects eutrophication (Wagner and Erickson, 2017; Yu et al., 2022; Ruan et al., 2024).
More than 16 million dams have been constructed globally, with over 50,000 standing taller than 15 m (Berga et al., 2006; Lehner et al., 2011). Primarily built for hydropower, these dams substantially disrupt river ecosystems and alter organic carbon fluxes to oceans (Yi et al., 2022). Such large-scale modifications complicate biogeochemical cycles, particularly organic carbon transport and fate (Carey and Fulweiler, 2012; Hughes et al., 2012; Grill et al., 2019). Driven by economic growth and rising energy/food demands since the 1980s, China’s rapid dam development added over 15,000 reservoirs (Ran et al., 2021). This expanded the water surface area from 14,772 km2 (1980s) to 25,616 km2 (2010s) and more than doubled total storage capacity (Ran et al., 2021).
Sun et al. (2023) developed the vertically generalized production model (VGPM) using long-term multi-site water quality data. This framework estimated annual phytoplankton carbon sequestration in Chinese lakes/reservoirs at 18.69 ± 10.7 Tg C (1 Tg = 1012 g), identifying chlorophyll, nitrogen, phosphorus, and turbidity as key determinants. Phytoplankton PP in inland waters is governed by community composition, biomass, and environmental variables (nutrients, light, temperature, Secchi depth) (Zhang et al., 2016; Hiroki et al., 2020; Rusanov et al., 2022; Jung et al., 2023). Reservoir PP exhibits distinct transitional characteristics between rivers and lakes, correlating strongly with seasonal discharge and anthropogenic regulation (Ran et al., 2016; Han et al., 2018). Nevertheless, national-scale studies of reservoir PP in China remain limited, typically subsumed within lake research (Ran et al., 2013b; Gao et al., 2018; Deng et al., 2020; Jia et al., 2020; Sun et al., 2023), hindering mechanistic understanding of large-scale PP variations.
Primary methods for estimating phytoplankton PP include: light-dark bottle incubation, VGPM, and carbon isotope techniques (Pratt and Berkson, 1959; Cox et al., 2015; Lan et al., 2020; Lu et al., 2023). Comprehensive spatiotemporal PP data remain limited by regional sampling constraints (Sun et al., 2023). Though often overlooked in carbon capture studies, the light-dark bottle method provides critical historical baselines for evaluating long-term PP trends (Hiroki et al., 2020). This study integrates public reservoir PP data obtained via this methodology to: (1) characterize fundamental phytoplankton PP features in Chinese reservoirs; (2) identify key influencing factors; and (3) estimate the sequestration of organic carbon by phytoplankton.
2 Materials and methods
2.1 Data sources
An exhaustive search and examination of all literature on phytoplankton PP in Chinese reservoirs from 1980 to 2023 was conducted using the China Knowledge Network Database and Web of Science. Information such as phytoplankton PP, geographical coordinates (latitude and longitude), sunshine hours, Secchi depth (SD), reservoir age, storage capacity, mean water depth, reservoir area, annual average temperature, annual average rainfall, total nitrogen (TN), and total phosphorus (TP) was extracted. In addition, the nitrogen-to-phosphorus ratio, water retention time and light limitation index were calculated. A comprehensive database comprising 165 reservoirs was ultimately established (Table 1 and Supplementary Material S1). Reservoir distributions and river basin divisions are shown in Figure 1.
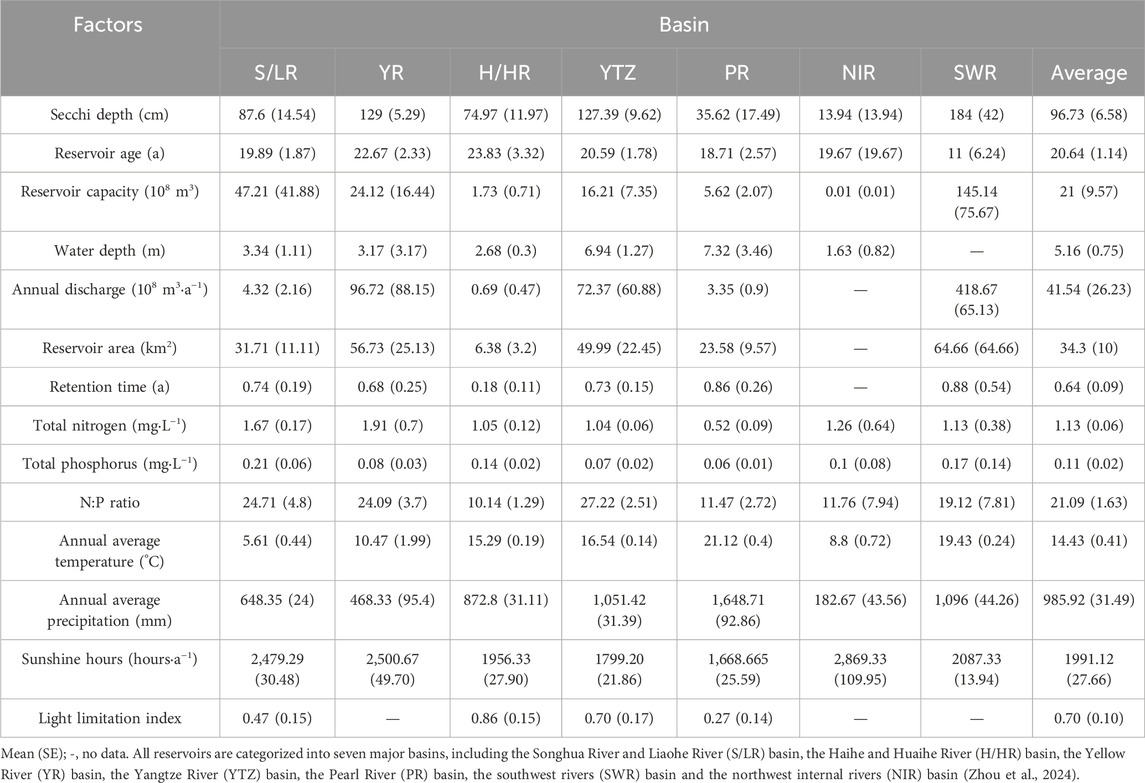
Table 1. Characteristics of Reservoir influence factors in different basin.
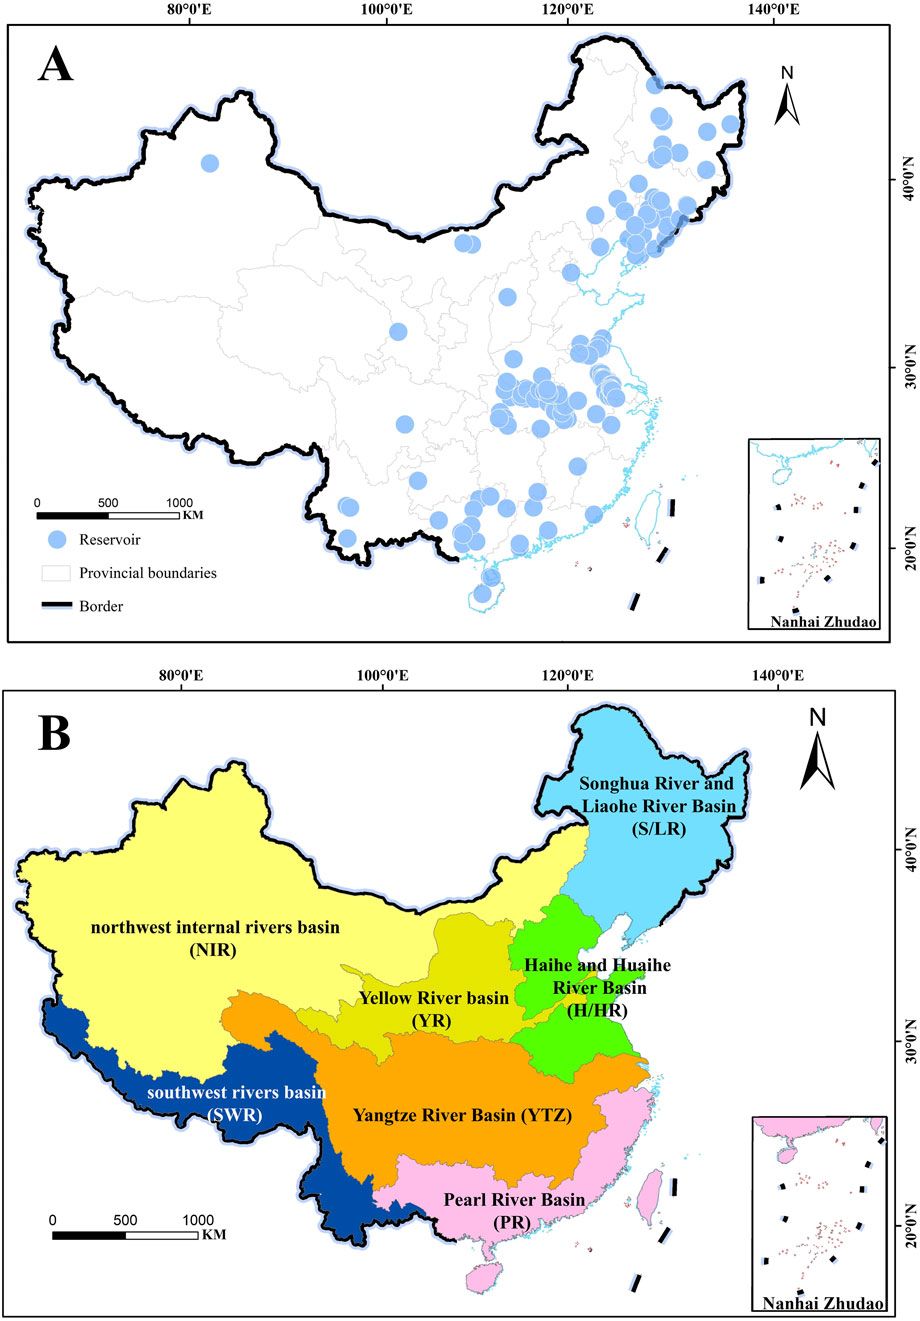
Figure 1. Reservoir distributions (A) and river basin divisions (B). All reservoirs are categorized into seven major basins, including the Songhua River and Liaohe River (S/LR) basin, the Haihe and Huaihe River (H/HR) basin, the Yellow River (YR) basin, the Yangtze River (YTZ) basin, the Pearl River (PR) basin, the southwest rivers (SWR) basin and the northwest internal rivers (NIR) basin (Zhou et al., 2024). The Pearl River Basin includes the watersheds of the Southeast Rivers.
2.2 Data calculation
The light limitation was derived from either photosynthetically active radiation or in situ light profile data. The light limitation index was calculated as the ratio of euphotic zone depth (Zeu) and mean water depth Formulas 1,2:
where SD was Secchi depth, the coefficient of 2.5 follows established practice for converting transparency measurements to euphotic depth (Kirk, 1994).
The total phytoplankton PP in Chinese reservoirs was calculated using a simple extrapolation method (Formulas 3,4). Using the photosynthetic principle that 1 mg of O2 release corresponds to 0.30 mg of organic carbon production, and the carbon sequestration capacity (CSC) formula is as follows (Shiying, 1981):
where
2.3 Statistical analysis
The statistical analyses and data plotting were performed using SPSS 18.0, Origin 2019, and ArcGIS 10.7, with a significance threshold of P < 0.05 for both difference and correlation evaluations. Descriptive statistics, presented as Mean ± SE, were employed to assess seasonal fluctuations in key indicators and discern differences across reservoirs within various basins. A one-way ANOVA, complemented by the Duncan test, was applied to evaluate variations in phytoplankton PP and seasons. Crucial indicators over distinct decades (1980s, 1990s, 2000s, 2010s, and 2020s) was used Mann-Kendall test. Pearson correlation analysis was conducted to clarify associations between phytoplankton PP and environmental factors. In addition, stepwise multiple regression analysis was utilized to identify the predominant factors influencing phytoplankton PP.
3 Results
3.1 Spatial differentiation of phytoplankton PP in Chinese reservoirs
Data on phytoplankton PP in Chinese reservoirs is predominantly concentrated in the eastern region, with limited observations from the northwest and southwest (Figures 1, 2). The mean phytoplankton PP in these reservoirs is 2.42 ± 1.65 g O2·m−2·d−1, ranging from 0.13 to 10.22 g O2·m−2·d−1, with a median of 2.15 g O2·m−2·d−1, indicating significant spatial variability. The YR basin exhibited the highest phytoplankton PP (3.54 ± 0.78 g O2·m−2·d−1), followed by the S/LR basin (3.25 ± 0.26 g O2·m−2·d−1) and the H/HR basin (3.07 ± 0.34 g O2·m−2·d−1) (Figure 3A). In contrast, the lowest phytoplankton PP values were observed in the NIR basin (0.45 ± 0. 16 g O2·m−2·d−1) and the SWR basin (0.99 ± 0.29 g O2·m−2·d−1). The YTZ basin and the PR basin recorded phytoplankton PP values of 2.18 ± 0.17 g O2·m−2·d−1 and 1.17 ± 0.28 g O2·m−2·d−1, respectively. The phytoplankton PP in the YR basin, S/LR basin, and H/HR basin was significantly higher than that in the PR basin, NIR basin, and SWR basin (P < 0.05).
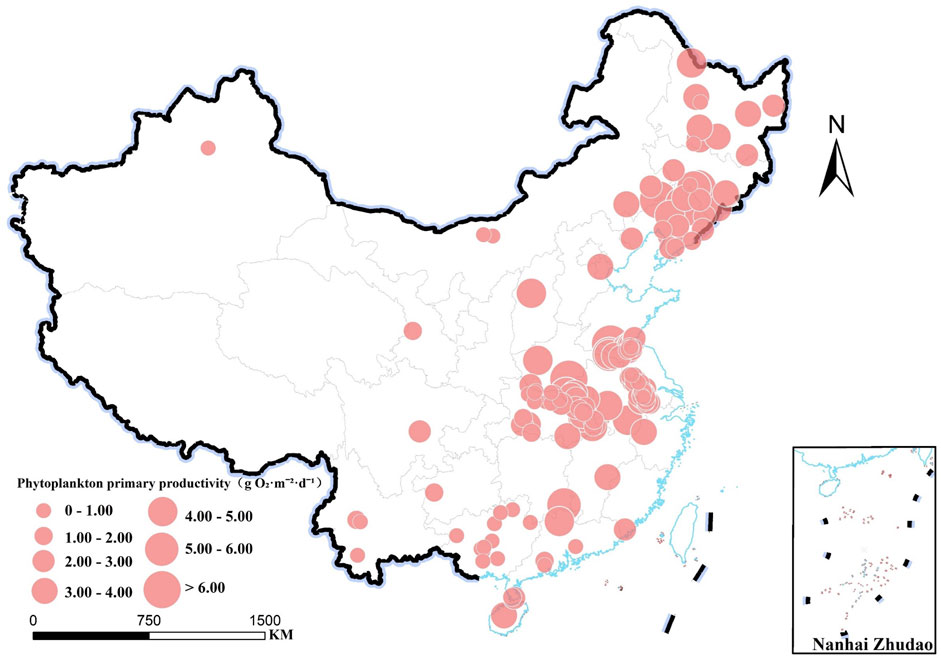
Figure 2. Spatial differentiation of phytoplankton PP in reservoirs across China.
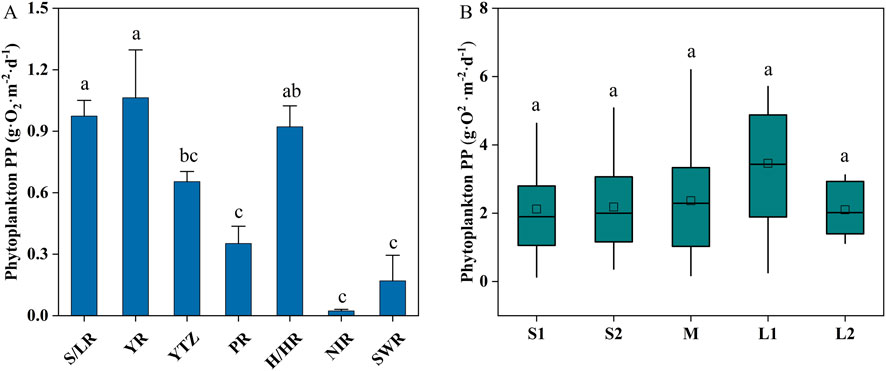
Figure 3. Spatial distribution characteristics of phytoplankton PP in reservoirs across China (A). Variations in phytoplankton PP among reservoirs of different sizes (B). S1 and S2 are small reservoirs with capacities less than 0.1 × 10⁸ m3, between 0.1 × 10⁸ m3 and 1.0 × 10⁸ m3, respectively (Zhou et al., 2024). M is medium reservoir capacities between 1.0 × 10⁸ m3 and 10 × 108 m3 (Zhou et al., 2024). L1 and L2 are large reservoirs with capacities ranging from 10 × 108 m3 to 100 × 108 m3 and exceeding 100 × 108 m3, respectively (Zhou et al., 2024). Different small letters indicate P < 0.05.
Phytoplankton PP increased from small I-type (S1) to large I-type (L1) reservoirs but decreased in large Ⅱ-type (L2) reservoirs (Figure 3B). The order of phytoplankton PP was as follows: L1 (3.46 ± 0.53 g O2·m−2·d−1) > M (2.36 ± 0.22 g O2·m−2·d−1) > S2 (2.18 ± 0.19 g O2·m−2·d−1) > S1 (2.12 ± 0.29 g O2·m−2·d−1) > L2 (2.10 ± 0.34 g O2·m−2·d−1). No significant difference in phytoplankton PP across reservoirs of various sizes.
3.2 Temporal variations of phytoplankton PP in Chinese reservoirs
The long-term series showed peak phytoplankton PP in the 1990s, subsequent decline, and recent recovery in the 2020s (Figure 4A). Mann-Kendall tests indicated no significant temporal trends (Figure 4B). The overall ranking of phytoplankton PP was as follows: 1990s (3.18 ± 0.33 g O2·m−2·d−1) >2020s (2.82 ± 0.54 g O2·m−2·d−1) >2000s (2.40 ± 0.16 g O2·m−2·d−1) >1980s (2.38 ± 0.20 g O2·m−2·d−1) >2010s (2.20 ± 0.61 g O2·m−2·d−1). Seasonally (Figure 4C), phytoplankton PP was significantly higher in summer (4.65 ± 0.52 g O2·m−2·d−1) compared to winter (1.41 ± 0.44 g O2·m−2·d−1) (P < 0.05), approximately 3.3 times that of winter. Phytoplankton PP slightly increased in spring (2.94 ± 0.50 g O2·m−2·d−1) compared to autumn (2.89 ± 0.66 g O2·m−2·d−1), but this difference was not statistically significant (P > 0.05).
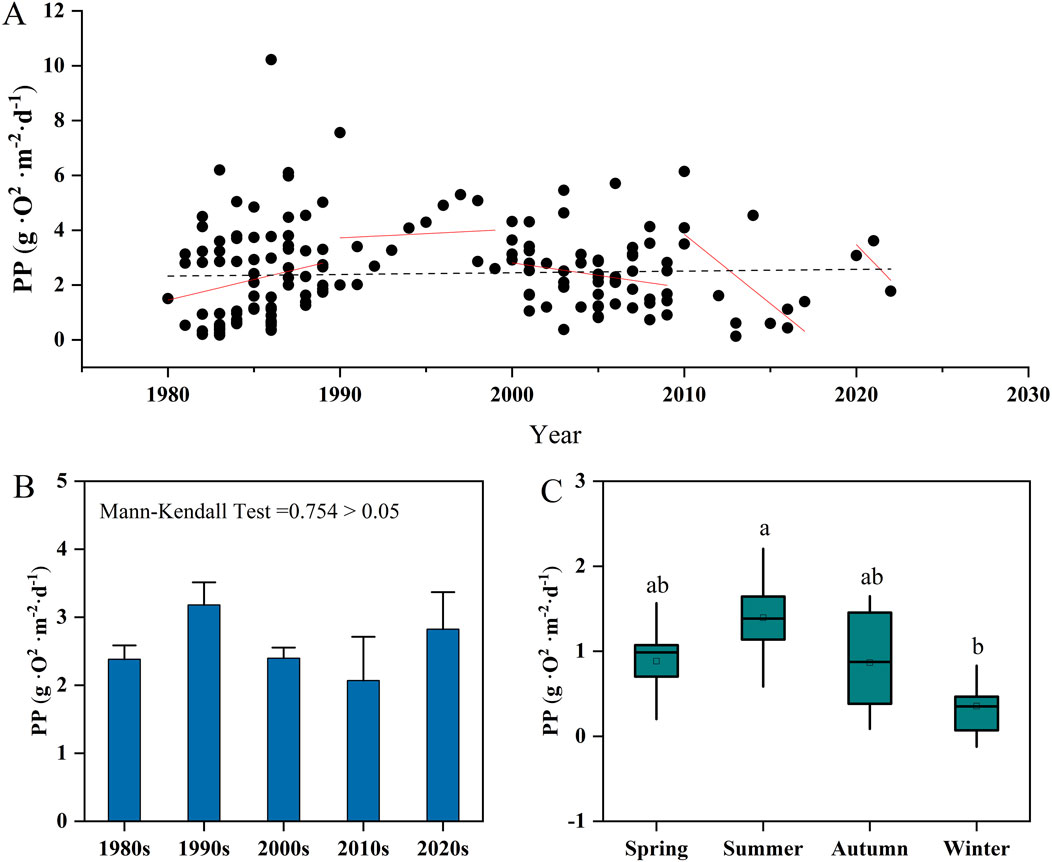
Figure 4. Temporal distribution characteristics of phytoplankton PP in reservoirs across China. (A) displays the distribution of PP data (1980–2023), with red and black trend lines representing decadal and full-period trends, respectively. (B) compares PP across time periods (mean ± SD; Mann-Kendall test). (C) shows seasonal variations in PP. Different small letters indicate significant differences at P < 0.05.
3.3 Influence of reservoir characteristics on phytoplankton PP in China
On the national scale, phytoplankton PP showed a weakly positive correlation with reservoir characteristics (Figure 5). None of the reservoir characteristics analyzed (including Secchi depth, total storage capacity, annual discharge, reservoir area, reservoir age, and retention time) were significantly correlated with phytoplankton PP (P > 0.05). Water depth was the only exception with a significant positive correlation with phytoplankton PP (R = 0.17, P < 0.05).
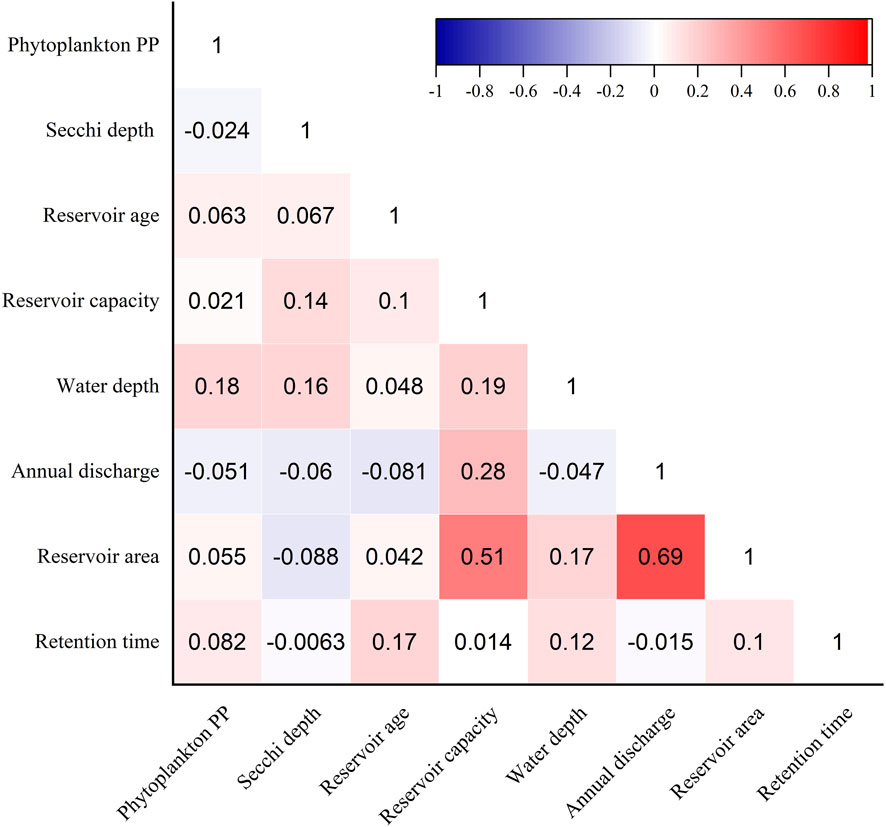
Figure 5. Correlation between phytoplankton PP and reservoir characteristics.
In basin-specific analyses (Table 2), phytoplankton PP demonstrated positive correlations with water depth in the PR basin (R = 0.90, P < 0.01) and the YTZ basin (R = 0.28, P < 0.01). Within the H/HR basin, there was a significant positive correlation between phytoplankton PP and reservoir area (R = 0.68, P < 0.01). However, no discernible correlations were observed between phytoplankton PP and parameters such as reservoir age, retention time, or annual discharge (P > 0.05).
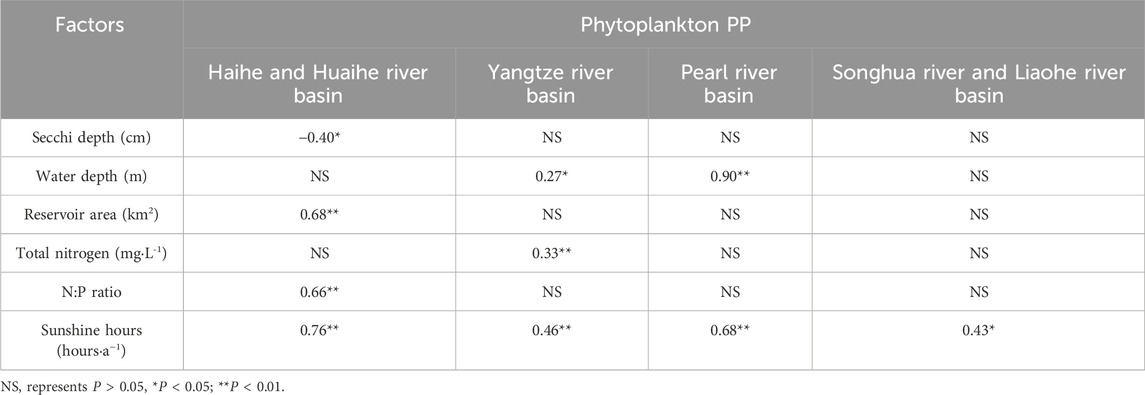
Table 2. Influence of reservoir characteristics on phytoplankton PP in different basin.
3.4 Impact of nutrient and other characteristics on phytoplankton PP in China
Correlation analysis (Figure 6) reveals a significant positive correlation between phytoplankton PP and latitude alongside a significant negative correlation with average annual temperature and average annual rainfall (P < 0.01). Phytoplankton PP increases significantly with longitude, decreasing gradually from the east coast to the interior.
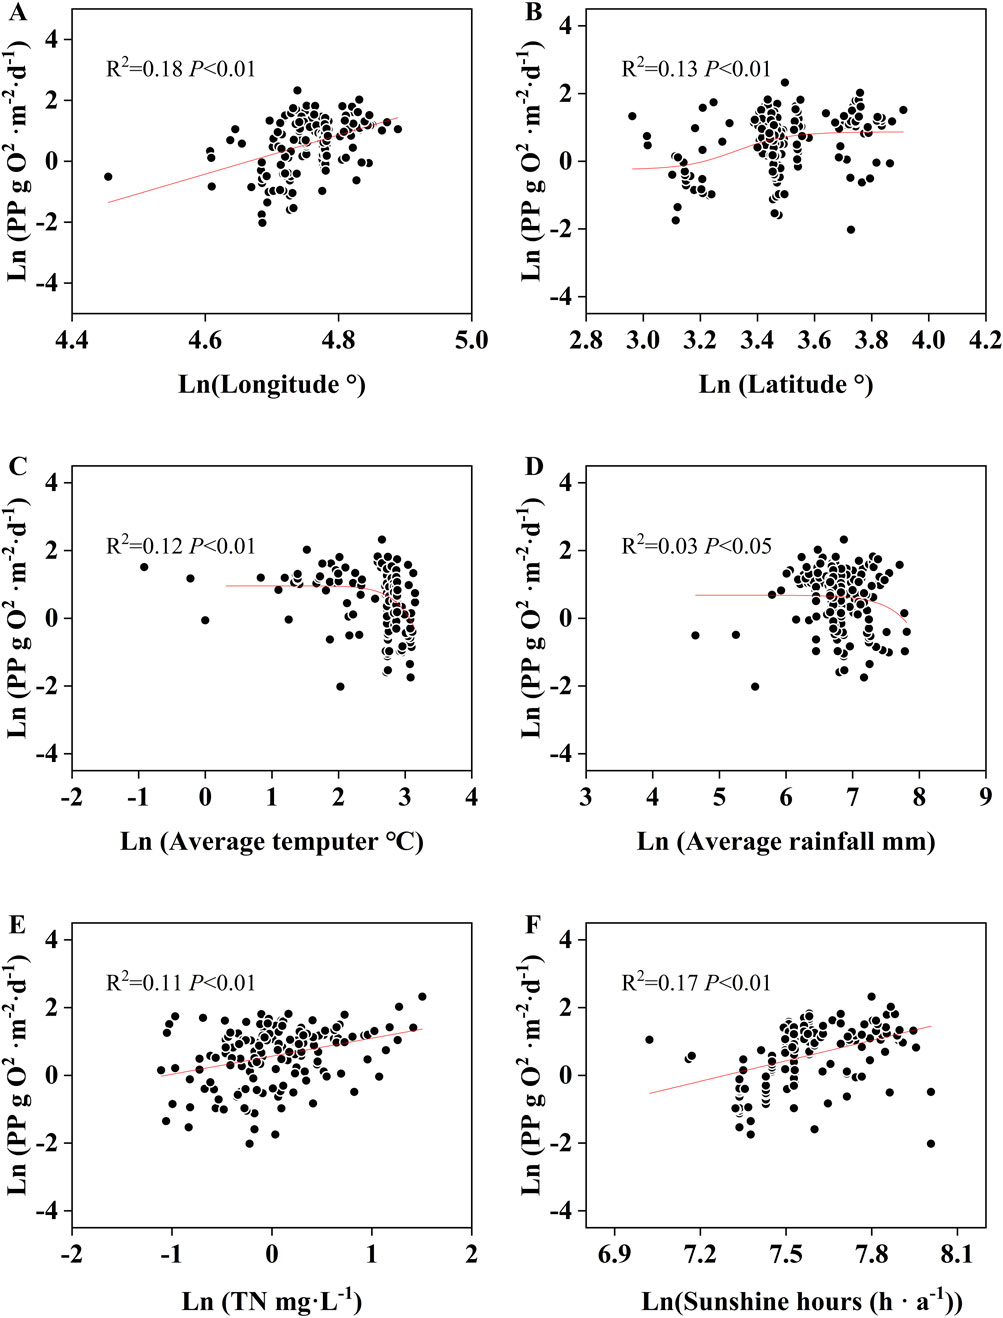
Figure 6. Correlation between phytoplankton PP and longitude (A), latitude (B), local annual average temperature (C), annual rainfall (D), TN (E) and sunshine hour (F) around the sample sites.
Phytoplankton PP demonstrated a significant positive correlation with TN and sunshine hours (P < 0.01) (Figure 6) but did not significantly correlate with TP (Supplementary Figure S1) or the N:P ratio (P > 0.05). However, at the basin-specific scale, this significant positive correlation between phytoplankton PP and TN was only observed in the YTZ basin (P < 0.01). In contrast, phytoplankton PP exhibited a significant positive correlation with the N:P ratio in the H/HR basin (P < 0.01). No significant correlation was identified between phytoplankton PP and TP across the river basins.
3.5 Estimation of total phytoplankton PP in Chinese reservoirs
The total phytoplankton PP in Chinese reservoirs was quantified as 22.08 Tg·O2·a−1. The YTZ basin leads in contribution, representing over 43% (9.55 Tg·O2·a−1) (Figure 7). The YR basin and the S/LR basin follow, contributing 21.67% (4.79 Tg·O2·a−1) and 21.46% (4.74 Tg·O2·a−1), respectively. The PR basin contributes 8.93% (1.97 Tg·O2·a−1). The NIR basin and SWR basin make more modest contributions of 1.30% (0.29 Tg·O2·a−1) and 0.37% (0.08 Tg·O2·a−1), respectively.
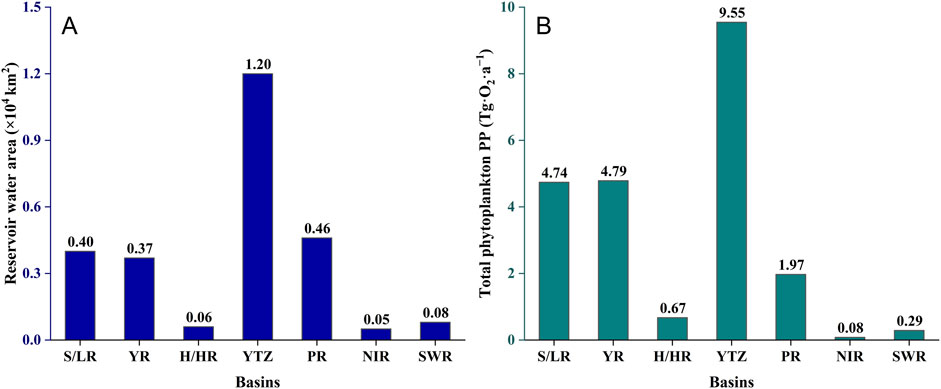
Figure 7. Estimation of total phytoplankton PP in different basins. (A) shows reservoir area, and (B) displays PP estimates.
4 Discussion
4.1 Factors influencing spatiotemporal variation of phytoplankton PP
Phytoplankton primary production (PP) shows significant latitudinal gradients across China’s major basins, with higher values in the Yellow River (YR), Songhua River and Liaohe River (S/LR), and Haihe and Huaihe River (H/HR) basins compared to the Pearl River (PR), Northwest Internal Rivers (NIR), and Southwest Rivers (SWR) basins (Figure 3A). This south-north increasing trend reflects spatial variation in nutrient availability, light condition, and anthropogenic impacts (Wang et al., 2019b; Zhong et al., 2021; Jung et al., 2023). Eutrophic reservoirs in the eastern and northeastern plains sustain elevated PP through nutrient enrichment, whereas oligotrophic southwestern reservoirs with superior water quality limit growth due to nutrient scarcity (Yu et al., 2022; Hu et al., 2024). Extended growing seasons and favorable photoperiods enhance productivity in northern regions (Sun et al., 2023), while cloud cover and shorter photoperiods reduce output in PR and Yangtze (YTZ) basins (Ran et al., 2013a). Industrial activities in eastern/northeastern plains further alter productivity patterns via pollution loading (Cao et al., 2020). Topographic and climatic constraints render southwestern and Qinghai-Tibetan Plateau reservoirs particularly sensitive to temperature/precipitation variability (Ma et al., 2010).
Elevated phytoplankton PP in eastern plain reservoirs confirms established spatial eutrophication gradients, consistent with prior findings (Sun et al., 2023; Hu et al., 2024). Conversely, western regions (particularly Qinghai-Tibet Plateau and southwestern areas) exhibit nutrient-limited systems with suppressed PP (Deng et al., 2020).
Seasonal PP variations generally follow summer > spring > autumn > winter. While Sun et al. (2023) reported peak PP in spring/autumn for northern China (YTZ/SWR basins), this discrepancy likely stems from their predominant lake (vs. reservoir) sampling focus. Our reservoir data align with southern studies showing summer maxima > spring/autumn > winter (Ran et al., 2013a; Wang et al., 2019a; Yi et al., 2022). Dry-season reductions in nutrients and temperature constrain biomass and PP relative to wet periods (Lu et al., 2016). Notably, pronounced seasonal variability in downstream Yalongjiang and Three Gorges reservoirs underscore hydrological controls on PP dynamics (Ran et al., 2017a; 2017b; Deng et al., 2020).
4.2 Determinants of phytoplankton PP
Sixteen variables were analyzed to identify key drivers of phytoplankton PP in Chinese reservoirs. Sunshine hours, water depth, and rainfall emerged as primary predictors, though the stepwise regression model explained 28.9% of PP variation (Table 3). Regionally, the Yellow River (YR) and Songhua River and Liaohe River (S/LR) basins showed non-significant regression results. Significant drivers included: Sunshine hours and Reservoir capacity (explaining 70.0% variation) in the Haihe and Huaihe River (H/HR) basin; Sunshine hours and average rainfall (41.1%) in the Yangtze (YTZ) basin; water depth and reservoir area (89.5%) in Pearl River (PR) basin.
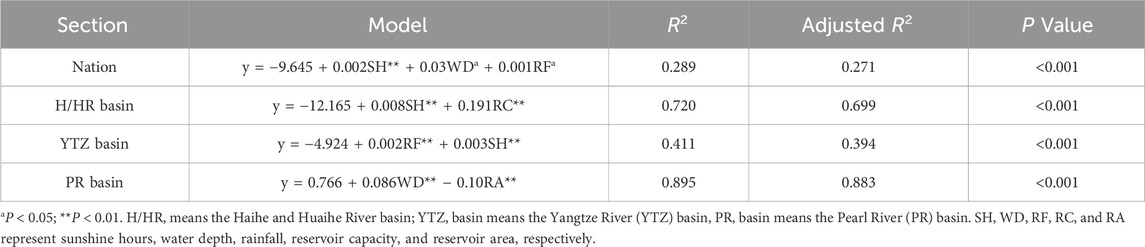
Table 3. Multivariate linear regression model of phytoplankton PP.
Phytoplankton photosynthetic rates exhibit a significant positive correlation with light radiation (Kirk, 1994). At the national scale, phytoplankton PP shows a significant positive correlation with sunshine hours (r = 0.43, P < 0.01), with stronger regional correlations (r = 0.43–0.76, P < 0.01). Rainfall constrains phytoplankton PP by reducing light availability, evidenced by significant negative correlations between light duration and rainfall, consistent with lower light duration in southwestern regions. Furthermore, turbidity and net radiation collectively regulate underwater light conditions (Sun et al., 2023): light intensity increases with radiation but decreases with turbidity (Tanabe et al., 2019). We used a light limitation index integrating Secchi depth and water depth, yet it showed no significant correlation with phytoplankton PP (Supplementary Figure S1, P > 0.05). This contrasts with typical patterns where turbidity suppresses phytoplankton PP and light radiation enhances it. Consequently, the index’s reliability as a phytoplankton PP indicator requires further validation, potentially influenced by limited sample size.
Nitrogen significantly influences PP in inland waters (Gao et al., 2019). In this study, the correlation between phytoplankton PP and TN is considerably stronger than between TP and phytoplankton PP, indicating nitrogen’s critical limiting role. Phytoplankton PP significantly correlates with TN in the YTZ basin (P < 0.05). These findings contradict prior studies (Jia et al., 2022; Sun et al., 2023). Methodological differences may explain the divergence: model estimates versus field measurements, or combined lake-reservoir sampling increasing system heterogeneity. Among reservoir characteristics, only water depth shows a significant correlation with phytoplankton PP. This is because water depth critically influences light penetration, nutrient distribution, and thermal stratification, as established by previous studies (Ran et al., 2016; Wang et al., 2019a; Zhong et al., 2021; Jung et al., 2023). However, the regression model’s limited predictive power suggests that key variables affecting phytoplankton PP in Chinese reservoirs remain unquantified or underexplored due to research constraints.
4.3 Carbon sequestration of phytoplankton in Chinese reservoirs
In addition to understanding the dynamics of PP, assessing the carbon sink capacity of reservoirs is critical (Figure 8). The total phytoplankton PP in Chinese reservoirs is 22.08 Tg⋅O2⋅a−1. Using the photosynthetic principle that 1 mg of O2 release corresponds to 0.30 mg of organic carbon production (Shiying, 1981), the total carbon sequestration by phytoplankton in these reservoirs is estimated at 6.62 Tg⋅C⋅a−1.
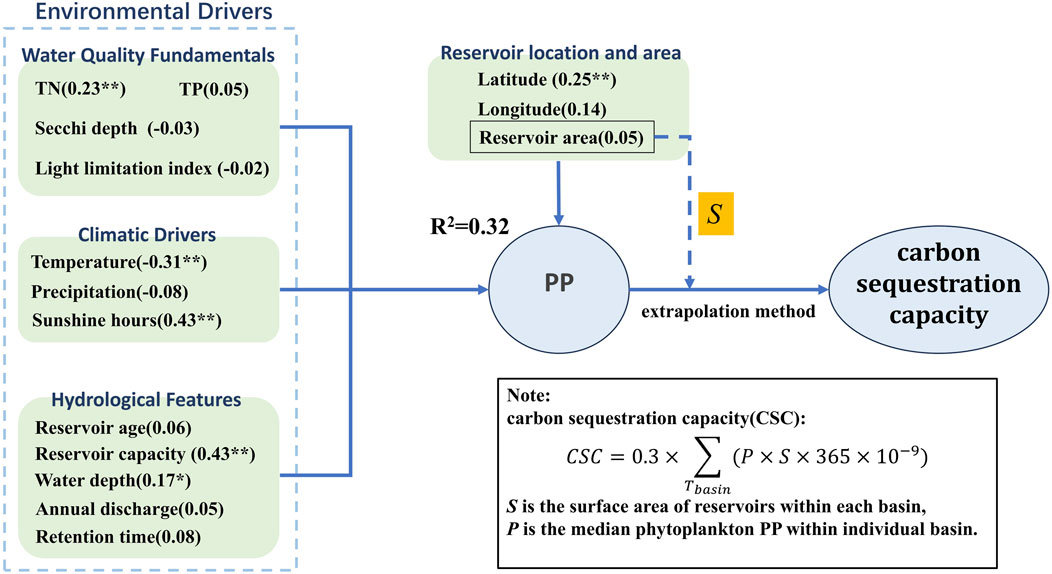
Figure 8. Conceptual framework linking drivers, phytoplankton PP and carbon sequestration. *P < 0.05; **P < 0.01.
Previous studies estimate phytoplankton photosynthetic carbon sequestration in Chinese terrestrial aquatic ecosystems at approximately 18.69 and 19.41 Tg⋅C⋅a−1, respectively (Gao et al., 2019; Sun et al., 2023). However, these studies did not differentiate between lakes and reservoirs. Using the lake (75,703 km2) and reservoir (25,616 km2) area data from Sun et al. (2023), we recalculated the reservoir-specific carbon sequestration. This yielded estimates of 6.32 Tg⋅C⋅a−1 based on Sun et al.'s total and 6.56 Tg⋅C⋅a−1 based on Gao et al.'s total (Gao et al., 2019; Sun et al., 2023). These recalculated values closely align with this study’s finding of 6.62 Tg⋅C⋅a−1. Furthermore, compared to the global estimate for reservoir phytoplankton carbon sequestration (36 Tg·C·a−1) (Maavara et al., 2017), the Chinese reservoir contribution represents 18.40% of the global total.
4.4 Uncertainty and limitations
Phytoplankton primary production estimation methods include light-dark bottle incubation, VGPM modeling, and carbon isotope techniques (13C/14C), deriving PP from dissolved oxygen changes, chlorophyll/environmental parameters, and carbonate isotopes, respectively (Pratt and Berkson, 1959; Cox et al., 2015; Lan et al., 2020; Lu et al., 2023). Methodological limitations and environmental factors cause significant PP discrepancies across methods or sites. Thus, this study exclusively uses light-dark bottle-sourced PP data to minimize methodological errors.
The light-dark bottle method exhibits broad applicability to river, reservoir, and estuary environments, with particular effectiveness in eutrophic waters. Key limitations include: (1) static incubation impeding nutrient replenishment in flowing waters, potentially causing PP underestimation; (2) exclusion of benthic metabolism, preventing comprehensive ecosystem assessment; and (3) reduced sensitivity in oligotrophic or high-bacterial-concentration waters (Hs et al., 2019; Loken et al., 2021; Molinari et al., 2021). This study employed the light-dark bottle method to measure reservoir phytoplankton PP. The method revealed low PP measurements in oligotrophic and mesotrophic reservoirs (Lu et al., 2023). Southern China’s oligotrophic reservoirs, experiencing long-term nutrient deficiency, light limitation, thermal stratification, and other constraints, inherently exhibit low phytoplankton PP (Chen et al., 2020; Deng et al., 2020; Li et al., 2022). Consequently, the light-dark bottle method may underestimate PP and carbon sequestration potential in such systems. Furthermore, severe data gaps exist in some regions (e.g., only three reservoirs sampled each in each of the southwest river’s basin and the northwest internal rivers basin), potentially limiting the model’s explanatory power regarding driving factors. Seasonal data may also be biased since not all reservoirs include seasonal data.
This study investigates phytoplankton PP characteristics and carbon sequestration potential in Chinese reservoirs, revealing significant impacts of regional variations, seasonal fluctuations, and environmental factors (Sun et al., 2023; Wei et al., 2024). To advance the understanding of carbon balance dynamics in these ecosystems, future research must resolve these uncertainties. Implementing a comprehensive long-term monitoring system is therefore essential for systematic assessment of reservoir phytoplankton PP.
5 Conclusion
Phytoplankton primary production (PP) in Chinese reservoirs averaged 2.42 ± 1.65 g O2·m−2·d−1 (range: 0.13–10.82). Spatially, PP was significantly elevated in the Yellow River (YR), Songhua River and Liaohe River (S/LR), and Haihe and Huaihe River (H/HR) basins relative to the Pearl River (PR), Northwest Internal Rivers (NIR), and Southwest Rivers (SWR) basins. Temporally, PP peaked in the 1990s (3.18 ± 0.33 g O2·m−2·d−1), declined subsequently, and rebounded in the 2020s (2.82 ± 0.54 g O2·m−2·d−1), with the full sequence being: 1990s > 2020s > 2000s (2.40 ± 0.16 g O2·m−2·d−1) > 1980s (2.38 ± 0.20 g O2·m−2·d−1) > 2010s (2.20 ± 0.61 g O2·m−2·d−1). Seasonal maxima occurred in summer (4.65 ± 0.52 g O2·m−2·d−1) and minima in winter (1.41 ± 0.44 g O2·m−2·d−1). A multivariate linear regression identified sunshine hours, water depth, and rainfall as the strongest predictors of PP, collectively accounting for 28.9% of the observed variance. Extrapolation yielded an annual reservoir PP of 22.08 Tg·O2·a−1, dominated by the Yangtze basin. This represents 6.62 Tg·C·a−1 of carbon sequestration—18.40% of the global reservoir estimate (36 Tg C a−1). Our analysis delineates spatio-temporal patterns of phytoplankton PP in Chinese reservoirs and underscores its significance for regional carbon budgets, aquatic ecosystem dynamics, and sustainable resource management.
Data availability statement
The original contributions presented in the study are included in the article/Supplementary Material, further inquiries can be directed to the corresponding author.
Author contributions
HD: Conceptualization, Visualization, Formal Analysis, Software, Methodology, Data curation, Writing – original draft, Writing – review and editing, Validation, Investigation, Funding acquisition. ZZ: Funding acquisition, Resources, Writing – review and editing, Project administration, Conceptualization. QC: Conceptualization, Data curation, Writing – review and editing. JW: Software, Writing – review and editing, Data curation. AC: Writing – review and editing, Funding acquisition, Supervision, Validation.
Funding
The author(s) declare that financial support was received for the research and/or publication of this article. This research was funded by the National Natural Science Foundation of China (No. 42401044 and 42301128), the High-Level Project Cultivation Plan of Zhaoqing University (No. GCCZK202413), and the Zhaoqing University Scientific Research Fund Project (No. QN202231), the Natural Science Key Research Project of Universities in Anhui Province (No. 2022AH051672).
Conflict of interest
The authors declare that the research was conducted in the absence of any commercial or financial relationships that could be construed as a potential conflict of interest.
Generative AI statement
The author(s) declare that no Generative AI was used in the creation of this manuscript.
Any alternative text (alt text) provided alongside figures in this article has been generated by Frontiers with the support of artificial intelligence and reasonable efforts have been made to ensure accuracy, including review by the authors wherever possible. If you identify any issues, please contact us.
Publisher’s note
All claims expressed in this article are solely those of the authors and do not necessarily represent those of their affiliated organizations, or those of the publisher, the editors and the reviewers. Any product that may be evaluated in this article, or claim that may be made by its manufacturer, is not guaranteed or endorsed by the publisher.
Supplementary material
The Supplementary Material for this article can be found online at: https://www.frontiersin.org/articles/10.3389/fenvs.2025.1615267/full#supplementary-material
References
Berga, L., Buil, J. M., Bofill, E., De Cea, J. C., Garcia Perez, J. A., Mañueco, G., et al. (2006). Dams and reservoirs, societies and environment in the 21st century. London: Taylor and Francis Group Two Volume Set. doi:10.1201/b16818
Cao, Z., Ma, R., Duan, H., Pahlevan, N., Melack, J., Shen, M., et al. (2020). A machine learning approach to estimate chlorophyll-a from Landsat-8 measurements in inland lakes. Remote Sens. Environ. 248, 111974. doi:10.1016/j.rse.2020.111974
Carey, J. C., and Fulweiler, R. W. (2012). Human activities directly alter watershed dissolved silica fluxes. Biogeochemistry 111, 125–138. doi:10.1007/s10533-011-9671-2
Chen, Q., Shi, W., Huisman, J., Maberly, S. C., Zhang, J., Yu, J., et al. (2020). Hydropower reservoirs on the upper Mekong River modify nutrient bioavailability downstream. Natl. Sci. Rev. 7, 1449–1457. doi:10.1093/nsr/nwaa026
Cox, T. J. S., Maris, T., Soetaert, K., Kromkamp, J. C., Meire, P., and Meysman, F. (2015). Estimating primary production from oxygen time series: a novel approach in the frequency domain. Limnol. Oceanogr. Methods 13, 529–552. doi:10.1002/lom3.10046
Deng, H., Tao, Z., Gao, Q., Yao, L., Feng, Y., Li, Y., et al. (2020). Variation of biogeochemical cycle of riverine dissolved inorganic carbon and silicon with the cascade damming. Environ. Sci. Pollut. Res. 27, 28840–28852. doi:10.1007/s11356-020-09174-5
Essa, D. I., Elshobary, M. E., Attiah, A. M., Salem, Z. E., Keshta, A. E., and Edokpayi, J. N. (2024). Assessing phytoplankton populations and their relation to water parameters as early alerts and biological indicators of the aquatic pollution. Ecol. Indic. 159, 111721. doi:10.1016/j.ecolind.2024.111721
Gao, Y., Ma, M., Yang, T., Chen, W., and Yang, T. (2018). Global atmospheric sulfur deposition and associated impaction on nitrogen cycling in ecosystems. J. Clean. Prod. 195, 1–9. doi:10.1016/j.jclepro.2018.05.166
Gao, Y., Jia, Y., Yu, G., He, N., Zhang, L., Zhu, B., et al. (2019). Anthropogenic reactive nitrogen deposition and associated nutrient limitation effect on gross primary productivity in inland water of China. J. Clean. Prod. 208, 530–540. doi:10.1016/j.jclepro.2018.10.137
Gao, Y., Jia, J., Lu, Y., Yang, T., Lyu, S., Shi, K., et al. (2021). Determining dominating control mechanisms of inland water carbon cycling processes and associated gross primary productivity on regional and global scales. Earth-Science Rev. 213, 103497. doi:10.1016/j.earscirev.2020.103497
Grill, G., Lehner, B., Thieme, M., Geenen, B., Tickner, D., Antonelli, F., et al. (2019). Mapping the world’s free-flowing rivers. Nature 569, 215–221. doi:10.1038/s41586-019-1111-9
Han, Q., Wang, B., Liu, C. Q., Wang, F., Peng, X., and Liu, X. L. (2018). Carbon biogeochemical cycle is enhanced by damming in a karst river. Sci. Total Environ. 616–617, 1181–1189. doi:10.1016/j.scitotenv.2017.10.202
Hiroki, M., Tomioka, N., Murata, T., Imai, A., Jutagate, T., Preecha, C., et al. (2020). Primary production estimated for large lakes and reservoirs in the Mekong River Basin. Sci. Total Environ. 747, 141133. doi:10.1016/j.scitotenv.2020.141133
Ho, J. C., Michalak, A. M., and Pahlevan, N. (2019). Widespread global increase in intense lake phytoplankton blooms since the 1980s. Nature 574, 667–670. doi:10.1038/s41586-019-1648-7
Hs, P. J., Daggula, N., Maloth, M., Praveen, C., Hs, J., Naik, R., et al. (2019). Primary productivity and phytoplankton diversity in Pilikula Lake, Dakshina Kannada dist, Karnataka, India. J. Entomol. Zool. Stud. 7, 133–139.
Hu, M., Ma, R., Xue, K., Cao, Z., Xiong, J., Loiselle, S. A., et al. (2024). Eutrophication evolution of lakes in China: four decades of observations from space. J. Hazard. Mater. 470, 134225. doi:10.1016/j.jhazmat.2024.134225
Hughes, H. J., Bouillon, S., André, L., and Cardinal, D. (2012). The effects of weathering variability and anthropogenic pressures upon silicon cycling in an intertropical watershed (Tana River, Kenya). Chem. Geol. 308–309, 18–25. doi:10.1016/j.chemgeo.2012.03.016
Jia, J., Gao, Y., Zhou, F., Shi, K., Johnes, P. J., Dungait, J. A. J., et al. (2020). Identifying the main drivers of change of phytoplankton community structure and gross primary productivity in a river-lake system. J. Hydrol. 583, 124633. doi:10.1016/j.jhydrol.2020.124633
Jia, J., Gao, Y., Sun, K., Lu, Y., Wang, J., and Shi, K. (2022). Phytoplankton community composition, carbon sequestration, and associated regulatory mechanisms in a floodplain lake system. Environ. Pollut. 306, 119411. doi:10.1016/j.envpol.2022.119411
Jia, J., Dungait, J. A. J., Lu, Y., Cui, T., Yu, G., and Gao, Y. (2023). Inland water metabolic carbon processes and associated biological mechanisms that drive carbon source-sink instability. Innov. Geosci. 1, 100035. doi:10.59717/j.xinn-geo.2023.100035
Jung, E., Joo, G. J., Kim, H. G., Kim, D. K., and Kim, H. W. (2023). Effects of seasonal and diel variations in thermal stratification on phytoplankton in a regulated river. Sustainability 15, 16330. doi:10.3390/su152316330
Lan, K. W., Lian, L. J., Li, C. H., Hsiao, P. Y., and Cheng, S. Y. (2020). Validation of a primary production algorithm of vertically generalized production model derived from multi-satellite data around the waters of Taiwan. Remote Sens. 12, 1627. doi:10.3390/rs12101627
Lehner, B., Liermann, C. R., Revenga, C., Vörömsmarty, C., Fekete, B., Crouzet, P., et al. (2011). High-resolution mapping of the world’s reservoirs and dams for sustainable river-flow management. Front. Ecol. Environ. 9, 494–502. doi:10.1890/100125
Li, J., Pu, J., and Zhang, T. (2022). Transport and transformation of dissolved inorganic carbon in a subtropical groundwater-fed reservoir, south China. Water Res. 209, 117905. doi:10.1016/j.watres.2021.117905
Loken, L. C., Van Nieuwenhuyse, E. E., Dahlgren, R. A., Lenoch, L. E. K., Stumpner, P. R., Burau, J. R., et al. (2021). Assessment of multiple ecosystem metabolism methods in an estuary. Limnol. Oceanogr. Methods 19, 741–757. doi:10.1002/lom3.10458
Lu, T., Chen, N., Duan, S., Chen, Z., and Huang, B. (2016). Hydrological controls on cascade reservoirs regulating phosphorus retention and downriver fluxes. Environ. Sci. Pollut. Res. 23, 24166–24177. doi:10.1007/s11356-016-7397-3
Lu, Y., Huang, L., Jia, J., and Gao, Y. (2023). Estimation of primary productivity of inland water. Adv. Earth Sci. 38, 57–69. doi:10.11867/j.issn.1001-8166.2022.055
Ma, R., Duan, H., Hu, C., Feng, X., Li, A., Ju, W., et al. (2010). A half-century of changes in China’s lakes: global warming or human influence? Geophys. Res. Lett. 37, L24106. doi:10.1029/2010GL045514
Maavara, T., Lauerwald, R., Regnier, P., and Van Cappellen, P. (2017). Global perturbation of organic carbon cycling by river damming. Nat. Commun. 8, 15347. doi:10.1038/ncomms15347
Molinari, B., Stewart-Koster, B., Adame, M. F., Campbell, M. D., McGregor, G., Schulz, C., et al. (2021). Relationships between algal primary productivity and environmental variables in tropical floodplain wetlands. Inl. Waters 11, 180–190. doi:10.1080/20442041.2020.1843932
Pratt, D. M., and Berkson, H. (1959). Two sources of error in the oxygen light and dark bottle method. Limnol. Oceanogr. 4, 328–334. doi:10.4319/lo.1959.4.3.0328
Ran, X., Yu, Z., Chen, H., Zhang, X., and Guo, H. (2013a). Silicon and sediment transport of the changjiang river (Yangtze River): could the three Gorges reservoir be a filter? Environ. Earth Sci. 70, 1881–1893. doi:10.1007/s12665-013-2275-5
Ran, X., Yu, Z., Yao, Q., Chen, H., and Guo, H. (2013b). Silica retention in the three Gorges reservoir. Biogeochemistry 112, 209–228. doi:10.1007/s10533-012-9717-0
Ran, X., Liu, S., Liu, J., Zang, J., Che, H., Ma, Y., et al. (2016). Composition and variability in the export of biogenic silica in the changjiang River and the effect of three Gorges reservoir. Sci. Total Environ. 571, 1191–1199. doi:10.1016/j.scitotenv.2016.07.125
Ran, X., Bouwman, L., Yu, Z., Beusen, A., Chen, H., and Yao, Q. (2017a). Nitrogen transport, transformation, and retention in the Three Gorges Reservoir: a mass balance approach. Limnol. Oceanogr. 62, 2323–2337. doi:10.1002/lno.10568
Ran, X., Xu, B., Liu, J., Zhao, C., Liu, S., and Zang, J. (2017b). Biogenic silica composition and δ13C abundance in the Changjiang (Yangtze) and Huanghe (Yellow) Rivers with implications for the silicon cycle. Sci. Total Environ. 579, 1541–1549. doi:10.1016/j.scitotenv.2016.11.161
Ran, L., Butman, D. E., Battin, T. J., Yang, X., Tian, M., Duvert, C., et al. (2021). Substantial decrease in CO2 emissions from Chinese inland waters due to global change. Nat. Commun. 12, 1730–1739. doi:10.1038/s41467-021-21926-6
Ruan, Q., Liu, H., Dai, Z., Wang, F., and Cao, W. (2024). Damming exacerbates the discontinuities of phytoplankton in a subtropical river in China. J. Environ. Manage. 351, 119832. doi:10.1016/j.jenvman.2023.119832
Rusanov, A. G., Bíró, T., Kiss, K. T., Buczkó, K., Grigorszky, I., Hidas, A., et al. (2022). Relative importance of climate and spatial processes in shaping species composition, functional structure and beta diversity of phytoplankton in a large river. Sci. Total Environ. 807, 150891. doi:10.1016/j.scitotenv.2021.150891
Sun, K., Deng, W., Jia, J., and Gao, Y. (2023). Spatiotemporal patterns and drivers of phytoplankton primary productivity in China’s lakes and reservoirs at a national scale. Glob. Planet. Change 228, 104215. doi:10.1016/j.gloplacha.2023.104215
Tanabe, Y., Hori, M., Mizuno, A. N., Osono, T., Uchida, M., Kudoh, S., et al. (2019). Light quality determines primary production in nutrient-poor small lakes. Sci. Rep. 9, 4639. doi:10.1038/s41598-019-41003-9
Wagner, T., and Erickson, L. E. (2017). Sustainable management of eutrophic lakes and reservoirs. J. Environ. Prot. Irvine, Calif. 08 (08), 436–463. doi:10.4236/jep.2017.84032
Wang, W., Li, S. L., Zhong, J., Li, C., Yi, Y., Chen, S., et al. (2019a). Understanding transport and transformation of dissolved inorganic carbon (DIC)in the reservoir system using δ13CDIC and water chemistry. J. Hydrol. 574, 193–201. doi:10.1016/j.jhydrol.2019.04.036
Wang, W., Li, S., Zhong, J., Maberly, S. C., Li, C., Wang, F., et al. (2019b). Climatic and anthropogenic regulation of carbon transport and transformation in a karst river-reservoir system. Sci. Total Environ. 707, 135628. doi:10.1016/j.scitotenv.2019.135628
Wang, Y., Gu, D., Liu, Z., Lu, J., Hu, T., Li, G., et al. (2024). Characteristics and impacts of pollution and remediation on riverine greenhouse gas emissions: a review. Sustainability 16, 11061. doi:10.3390/su162411061
Wei, J., Ji, X., and Hu, W. (2022). Characteristics of phytoplankton production in wet and dry seasons in hyper-eutrophic lake taihu, China. Sustainability 14, 11216. doi:10.3390/su141811216
Wei, J., Ji, X., and Hu, W. (2024). Characteristics of phytoplankton productivity in three typical lake zones of Taihu, China. Sustainability 16, 2376. doi:10.3390/su16062376
Xiao, L. J., Zhu, Y., Yang, Y., Lin, Q., Han, B. P., and Padisák, J. (2018). Species-based classification reveals spatial processes of phytoplankton meta-communities better than functional group approaches: a case study from three freshwater lake regions in China. Hydrobiologia 811, 313–324. doi:10.1007/s10750-017-3502-y
Yi, Y., Li, S. L., Zhong, J., Wang, W., Chen, S., Bao, H., et al. (2022). The influence of the deep subtropical reservoir on the karstic riverine carbon cycle and its regulatory factors: insights from the seasonal and hydrological changes. Water Res. 226, 119267. doi:10.1016/j.watres.2022.119267
Yu, H., Shi, X., Zhao, S., Sun, B., Liu, Y., Arvola, L., et al. (2022). Primary productivity of phytoplankton and its influencing factors in cold and arid regions: a case study of Wuliangsuhai Lake, China. Ecol. Indic. 144, 109545. doi:10.1016/j.ecolind.2022.109545
Zhang, M., Yu, Y., Yang, Z., and Kong, F. (2016). Deterministic diversity changes in freshwater phytoplankton in the Yunnan-Guizhou Plateau lakes in China. Ecol. Indic. 63, 273–281. doi:10.1016/j.ecolind.2015.12.017
Zhong, J., Wallin, M. B., Wang, W., Li, S. L., Guo, L., Dong, K., et al. (2021). Synchronous evaporation and aquatic primary production in tropical river networks. Water Res. 200, 117272–117279. doi:10.1016/j.watres.2021.117272
Keywords: phytoplankton primary productivity, temporal and spatial variations, influencing factors, carbon sequestration, Chinese reservoirs
Citation: Deng H, Zheng Z, Cai Q, Wu J and Chen A (2025) Spatial and temporal dynamics of phytoplankton primary productivity in Chinese reservoirs: influencing factors and carbon sequestration. Front. Environ. Sci. 13:1615267. doi: 10.3389/fenvs.2025.1615267
Received: 21 April 2025; Accepted: 09 September 2025;
Published: 25 September 2025.
Edited by:
Yang Song, University of Michigan, United StatesReviewed by:
Michael Pollock, Northwest Fisheries Science Center, NOAA Fisheries, United StatesTerry Eugene Whitledge, Retired, Fairbanks, AK, United States
Copyright © 2025 Deng, Zheng, Cai, Wu and Chen. This is an open-access article distributed under the terms of the Creative Commons Attribution License (CC BY). The use, distribution or reproduction in other forums is permitted, provided the original author(s) and the copyright owner(s) are credited and that the original publication in this journal is cited, in accordance with accepted academic practice. No use, distribution or reproduction is permitted which does not comply with these terms.
*Correspondence: Haojun Deng, ZGVuZ2hhb2p1bjE5OTBAenF1LmVkdS5jbg==; Qun Cai, Y2FpcXVuMTk5MUAxMjYuY29t