 Nzuzo Nxumalo
 Ntombifuthi Precious Nzimande
 Sifiso Xulu
- Discipline of Geography and Environmental Sciences, University of KwaZulu-Natal, Durban, South Africa
Land use and land cover (LULC) in the Dolphin Coast of South Africa have undergone substantial transformation due to rapid urbanization and growing environmental pressures. Understanding these spatiotemporal dynamics is crucial for managing development in sensitive coastal ecosystems. This study utilized high-resolution RapidEye and PlanetScope imagery, classified through the Random Forest algorithm within the Google Earth Engine (GEE) platform, to map five LULC categories: built-up, bareland, forest, vegetation, and water. The analysis achieved overall classification accuracies ranging from 88% to 95%, confirming strong agreement between predicted and reference data. A structured change analysis was further applied to quantify land transitions by examining components of quantity, exchange, and shift. The results revealed dominant conversions from vegetation to built-up (9.0 km2), bareland to built-up (3.6 km2), and vegetation to forest (5.6 km2). Built-up areas consistently expanded over time, while vegetation showed both gains and notable losses, reflecting intense development pressures on green spaces. The study highlights clear trajectories of landscape transformation and underscores the importance of spatially explicit change metrics for monitoring dynamic coastal environments. These findings provide valuable insights for policymakers and urban planners to design sustainable land-use frameworks, control unplanned urban expansion, and protect ecologically sensitive zones along the Dolphin Coast.
1 Introduction
In recent decades, substantial alterations to the Earth’s land surface cover have occurred at an alarming rate due to human activities (Di Marco et al., 2019; Minaei et al., 2018). To effectively quantify and monitor these changes, Land Use and Land Cover (LULC) change analysis has become a key component in modern approaches to managing and monitoring natural resources (Basheer et al., 2024; González-González et al., 2022; Ngondo et al., 2021). Typically, land use encompasses how people and communities utilize land, involving economic activities (Regasa et al., 2021; Mariye et al., 2022), while land cover refers to the physical characteristics of the Earth’s surface (Feng et al., 2023). LULC changes are so pervasive that, when aggregated globally, they meaningfully affect key aspects of Earth system functioning (Titeux et al., 2016; Dhruw et al., 2023). They directly impact biotic diversity worldwide and are the primary source of habitat destruction and land degradation (Agidew and Singh, 2017; Sharma et al., 2018), and contribute to local and regional climate, as well as to global climate warming (Mantyka-Pringle et al., 2015). Such changes are driven by urban development, agricultural expansion, and deforestation (Arowolo and Deng, 2018; Gaur and Singh, 2023). Urbanization, a substantial driver of LULC, reduces vegetation coverage and converts agricultural areas into built-up areas (Dadashpoor et al., 2019; Jamei et al., 2019).
Over the years, geospatial applications have become widely accepted and increasingly influential in land use monitoring, offering important opportunities to enhance the assessment of LULC changes by analyzing the spatial distribution, characteristics, extent, rate of change, and future prediction (Rogan and Chen, 2004; Sabr et al., 2016). Particularly, the combination of Geographical Information Systems (GIS) and remote sensing technologies offers valuable tools for spatial analysis of land use changes (Guida-Johnson and Zuleta, 2013; Wiatkowska et al., 2021), including LULC classification and change detection (Chughtai et al., 2021). Historically, medium-resolution satellite products such as Landsat and Sentinel have been used extensively to monitor LULC changes in South Africa (Biggs and Scholes, 2002; Gillson et al., 2012; Musetsho et al., 2021; Dzurume et al., 2022). However, their accuracy in urban environments remains uncertain (Lefulebe et al., 2022; Radeloff et al., 2024), due to their inability to effectively distinguish between different land cover classes, such as residential and industrial areas (Voltersen et al., 2014), for very fine details. In contrast, small satellites (SmallSats) use commercial off-the-shelf (COTS) technologies that, thanks to advances in electronics miniaturization, are now smaller, lighter, more affordable, and easier to access (Basheer et al., 2024).
Remote sensing, defined as the acquisition of Earth surface data without direct contact (Elachi and Van Zyl, 2021), has been a vital tool for LULC monitoring, offering comprehensive, cost-effective, and time-efficient datasets that support urban observation, planning, and monitoring (Verde et al., 2018; Saputra and Lee, 2019). Numerous studies have demonstrated the effectiveness of remote sensing in numerous applications, for instance, Edosa and Nagasa (2024) used Landsat imagery with maximum likelihood classification algorithm to analyze LULC changes in Naqamte City, western Ethiopia, achieving overall accuracies between 86% and 97%. Their findings indicated a substantial rate of change, such as forest cover, which decreased by 14.5%, while bareland, built-up land, and agricultural areas increased by 6.83%, 4.33%, and 3.21%, respectively. Similarly, Mogonong et al. (2024) applied Landsat imagery and Random Forests classification algorithm to assess land cover changes and agricultural trends over 38 years, achieving accuracies above 80%. The study revealed declines in agricultural land from 1984 to 2022 across rural regions of South Africa, such as Umhlabuyalingana, Joe Morolong, and Mangaung, underscoring the value of remote sensing in capturing LULC dynamics. The increasing accessibility of remotely sensed data from Earth-observing satellites, along with advancements in spatial, temporal, and spectral resolution, offers valuable opportunities for researchers to adopt comprehensive methods for LULC analysis (Basheer et al., 2024; Swain et al., 2024).
In recent decades, LULC mapping has increasingly relied on the integration of remotely sensed imagery with statistical and machine learning algorithms to detect and analyze spatial and temporal landscape dynamics (Li et al., 2020; Talukdar et al., 2020). Supervised classification techniques such as Support Vector Machine (SVM), Random Forests (RF), Decision Tree (DT), K-Nearest Neighbour (KNN), Multilayer Perceptron (MLP), Naïve Bayes (NB), and Maximum Likelihood Classifier (MLC) have been widely applied in LULC studies (Akhtar et al., 2021; Gaur and Singh, 2023; Mashala et al., 2023). Numerous comparative assessments have demonstrated the varying classification performance of these algorithms (Li et al., 2024), with a growing body of evidence highlighting the superior accuracy of ensemble and kernel-based approaches such as RF and SVM over traditional classifiers. In particular, Random Forests has emerged as one of the most robust and reliable classifiers for LULC classification (Ul Din and Mak, 2021; Bayas et al., 2022), owing to its ability to handle high-dimensional datasets, mitigate overfitting, and accommodate non-linear relationships among spectral variables (Talukdar et al., 2020; Regasa et al., 2021; Mashala et al., 2023). For example, Lefulebe et al. (2022) utilized PlanetScope imagery and machine learning algorithms, namely, the KNN, RF, NB, and SVM, to classify LULC changes in Cape Town from 2016 to 2021. The study found KNN to be the most accurate, with 96.5% accuracy, followed by RF (94.8%), NB (93.7%), and SVM (92.3%). Another study by Gokool et al. (2024) demonstrated the effectiveness of Google Earth Engine (GEE)’s advanced geospatial cloud computing for processing high-resolution multispectral Unmanned Aerial Vehicle (UAV) imagery to map LULC within smallholder farms. The study identified the RF classifier as the best-performing algorithm, achieving an overall accuracy of 86%, surpassing Classification and Regression Tree (CART) (81%), SVM (83%), and Gradient Tree Boost (GTB) (85%). The findings confirm that selecting the right combination of LULC classifiers improves the accuracy of high-resolution imagery classification (Basheer et al., 2024).
In South Africa, much of LULC changes are particularly threatening, with coastal regions being heavily impacted by urbanization, climate change, and biodiversity loss (Mead et al., 2013). The rapid and alarming expansion of urban areas has increased pressure on natural ecosystems (Palmer et al., 2011). This pressure is exacerbated by the increasing proximity of urban development initiatives in regions with high species richness and endemism (Potgieter et al., 2020). For example, the KwaZulu-Natal coastline, vital for tourism and conservation, faces issues such as climate change, flooding, and urban expansion (Mthiyane et al., 2022), which hinders natural regeneration (Smith et al., 2013; Law, 2023). Uneven settlement distribution in coastal regions like the Dolphin Coast further led to resource exploitation and land-based pollution (Nxumalo et al., 2025). For instance, Todes (2014) highlighted the weighty impact of residents relocating from northern eThekwini to Ballito, which catalyzed substantial housing demand in the area. This movement, fueled by rapid economic growth in northern Durban, particularly in Umhlanga and around the King Shaka International Airport, marked a pivotal shift during the mid-2000s boom, positioning Ballito as a key destination within the high-income coastal region and intensifying migration trends (Ramsarup, 2022). However, research on land use changes in this region is limited, highlighting the need to assess the extent and pace of these LULC changes along the coastline.
Many studies evaluating land cover change have fallen short in accurately measuring change over time. Typically, they report only the category sizes at different time points and quantify the change between intervals. This approach often assumes that maps with overall accuracy above 85%, or a high Kappa statistic, are satisfactory, despite substantial criticism of these metrics’ limitations (Pontius and Millones, 2011; Quan et al., 2020). In response to these shortcomings, Pontius and Lippitt (2006) introduced a method that quantifies the size of map errors in relation to observed changes between two time points. This method assesses whether the apparent differences are greater than what can be attributed to error alone (Pontius and Millones, 2011; Xie et al., 2020; Pontius Jr, 2022). Building on this framework, the current study adopts the approach by decomposing change into three key components: quantity, exchange, and shift (Pontius and Santacruz, 2014; Pontius Jr, 2022). Thereby, this study investigates the spatio-temporal dynamics of LULC in the Dolphin Coast region of KwaZulu-Natal between 2009 and 2024 using four time points of fine-resolution imagery classified with Random Forests algorithm. In addition, the study evaluates the net changes and accuracy of the classified maps.
2 Materials and methods
2.1 Study area
The Dolphin Coast coastal region extends approximately 45 km2 and is about 40 km north of Durban (Figure 1). It falls within the KwaDukuza Local Municipality within the iLembe District Municipality, with geographical coordinates between 29° 28′6″S and 31° 5′38″E. The region is renowned for its diverse ecological features and unique geomorphological features, including estuaries such as the Mdloti River estuary, which are vital to the local ecosystem (Garden and Garland, 2005; Tagliarolo and Scharler, 2018). The area is characterized by predominantly subtropical vegetation, encompassing lush coastal and dune forests, as well as a variety of palm species. It is celebrated for its scenic beauty and prominent coastal destinations like Ballito, Zimbali, and Umhlanga Rocks. This extensive coastal biodiversity contributes substantial aesthetic and economic value (Law, 2023).
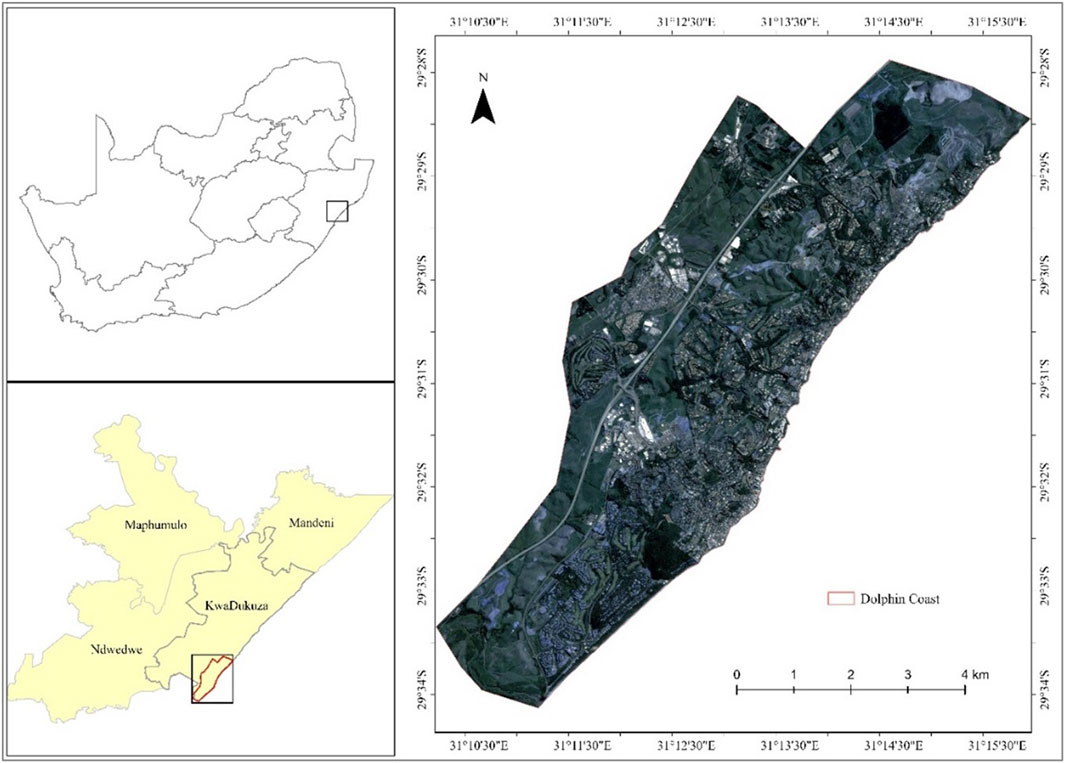
Figure 1. Location of the dolphin coast, South Africa.
The area is also part of the uThukela Marine Protected Area and has experienced considerable LULC changes in recent years, mainly due to increasing development activities (Palmer et al., 2011), including the expansion of residential housing, commercial infrastructure, and tourism facilities, as well as the development of road networks and coastal recreation areas (Todes, 2014). In this context, a study that maps the most important LULC changes is desirable.
2.2 Remote sensing data
In this study, we used satellite products from RapidEye and PlanetScope at four time points: 2009, 2014, 2019, and 2024, which we obtained free of charge from Planet Lab Inc. (San Francisco, CA, USA), portal (https://www.planet.com, accessed in July 2024) under a research and educational license. These cloud-free datasets were pre-processed in analysis-ready format (geometrically, radiometrically, and atmospherically corrected) (Şahin and Kaplan, 2023), at Level 3A and 3B surface reflectance, and subsequently orthorectified (Marta, 2018; Gašparović et al., 2018). Geometric correction ensured accurate spatial alignment by referencing a consistent coordinate system. Radiometric correction normalized variations in sensor response and illumination conditions to ensure consistency in surface reflectance values across all image dates. Atmospheric correction was performed using the provider’s standardized surface reflectance processing pipeline at Level 3A and 3B, which compensates for atmospheric scattering and absorption effects to produce true surface reflectance imagery. RapidEye has a constellation of five Earth observation satellites, operational since 2008, that capture fine-resolution multispectral imagery with an orthorectified pixel size of 5 m across five spectral bands (Blue, Green, Red, Red-edge, and Near-infrared). PlanetScope is equipped with four bands (Blue, Green, Red, and Near-infrared) that have been imaging the Earth with a resolution of 3 m since 2013 (Yoon and Choi, 2018). PlanetScope has, so far, the highest number of satellites in orbit, with over 200 Dove satellites, making it one of the few commercial satellite products with combined finer spatial and temporal characteristics (Hermle et al., 2021; Lefulebe et al., 2022; Basheer et al., 2024). Both these satellite products provide a valuable data source for a wide range of applications, including urban planning and land cover change analysis (Gašparović et al., 2018; Tamiminia et al., 2020).
We selected the most informative spectral bands, red, green, blue, and near-infrared (NIR), to effectively distinguish forest regeneration and reduce the computational costs during model training. Bands which are sensitive to moisture content in vegetation and soil, are particularly valuable for land cover identification (Chuvieco et al., 2002; Wang et al., 2008). These bands are recognized for their ability to capture critical information about vegetation health, moisture content, and land cover changes (Rukhovich et al., 2022). The characteristics of these datasets are summarized in Table 1. Subsequently, the images were mosaicked and clipped according to the boundaries of the study area.
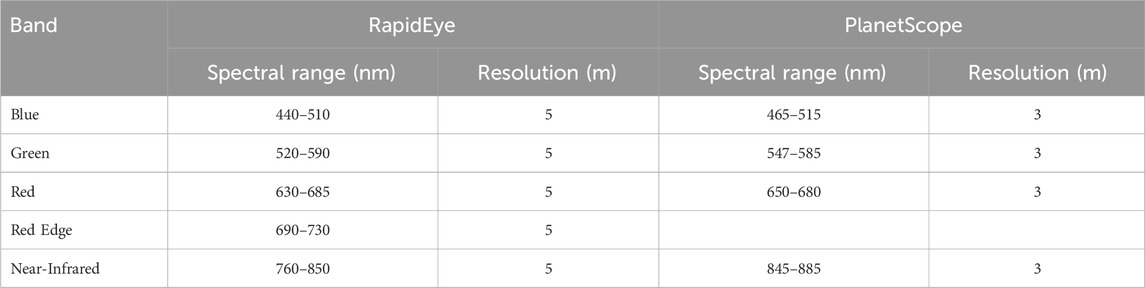
Table 1. Characteristics of satellite products used in the study.
2.3 LULC classes in the dolphin coast
Given the heterogeneity of land cover types and land use patterns in the study area, it was essential to classify the landscape based on its physical characteristics and functional use (Kgaphola et al., 2023). To ensure consistency and comparability with national datasets, the South African National Land Cover Classification System (Department of Rural Development and Land Reform) was adopted for this study. Specifically, Level 1 land cover categories were employed to delineate and map five key LULC categories: water, built-up areas, forests, vegetation, and bareland (Table 2).
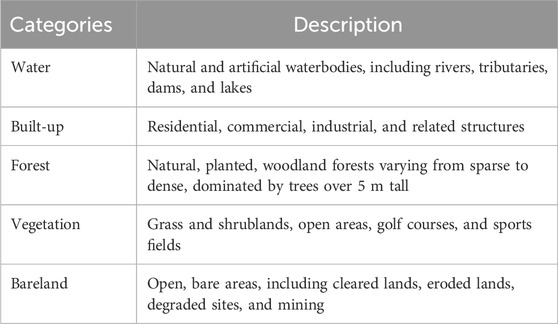
Table 2. Descriptions of the LULC classes utilized in the study.
2.4 Training and testing data processing
All training samples were collected in GEE and Google Earth Pro using RapidEye and PlanetScope satellite images. A minimum of 50 training samples were utilized for LULC classification for each class. According to Lillesand et al. (2015) it is generally recommended that each LULC class should possess at least 50 training examples. Then, the spectral properties of LULC classes were randomly divided into two datasets, a training dataset (80%) and a validation dataset (20%) (Lefulebe et al., 2022). To reduce spatial autocorrelation and ensure representative sampling across all LULC classes, a stratified random sampling design was implemented. This approach ensured that each class was proportionally and spatially represented across the landscape. Training points were digitized through visual interpretation of high-resolution imagery and validated using historical images in Google Earth. Furthermore, care was taken to ensure that training and validation points were drawn from spatially distinct locations to avoid overlap and sampling bias.
2.5 LULC classification algorithm
Recent advancements in artificial intelligence (AI), particularly machine learning (ML) algorithms have revolutionized the understanding and modelling of LULC changes. The use of satellite datasets have become indispensable for mapping LULC changes through advanced classification techniques (Atef et al., 2024). Among these, supervised classification methods stand out, leveraging ML algorithms such as SVM, Artificial Neural Networks (ANN) (Adam et al., 2023) and RF (Mashala et al., 2023; Parracciani et al., 2024), among others. In this study, we adopted a pixel-based approach to classify satellite images using a supervised RF algorithm in GEE. The Random Forests (RF) algorithm, introduced by Breiman (2001), is a widely adopted ensemble machine learning technique recognized for its robustness, computational efficiency, and ability to handle high-dimensional and complex datasets. As a non-parametric model based on decision trees, RF constructs multiple independent classification trees through a process known as bootstrap aggregating or bagging, where random subsets of the training data are drawn with replacement. Each tree independently votes on the classification outcome, and the final class assignment is determined by majority voting (Belgiu and Drăguţ, 2016; Boateng et al., 2020).
The algorithm is particularly well-suited for land use and land cover (LULC) classification tasks using remote sensing data due to its ability to model non-linear relationships, manage large numbers of input variables, and minimize the risk of overfitting (Belgiu and Drăguţ, 2016; Talukdar et al., 2020; Bayas et al., 2022). Unlike traditional classifiers, RF does not require assumptions about the distribution or independence of input variables and is resilient to outliers and noise within the data (Couronné et al., 2018; Basheer et al., 2024). Thus, in this study, RF was selected due to its consistent performance in comparative classification studies and its proven reliability in handling high-resolution satellite imagery (Breiman, 2001; Liu et al., 2020). For example, Gokool et al. (2024) utilized RF within GEE to classify UAV-derived imagery over smallholder farms and found that RF outperformed Support Vector Machines (SVM), Classification and Regression Trees (CART), and Gradient Boosted Trees (GTB), achieving the highest overall accuracy (86%). Similar conclusions were drawn in recent studies applying RF for LULC mapping in South Africa (Lefulebe et al., 2022; Bhungeni et al., 2024; Basheer et al., 2024).
In this study, the RF classifier was implemented within the GEE environment using the smileRandomForest function. Two key model parameters were tuned to enhance performance: the number of decision trees (ntree) was set to 25, and the number of variables considered for each split (mtry) was defined as the square root of the total number of explanatory features. Each node was configured to have a minimum of two leaf samples. The input features included five spectral bands from the RapidEye and PlanetScope sensors, namely,: visible (blue, green, and red), near-infrared (NIR), and red-edge bands. These features were selected for their sensitivity to vegetation structure, moisture content, and surface reflectance properties, which are essential for differentiating LULC classes (Shandu and Atif, 2023). By leveraging the ensemble structure of RF and its capability to generalize well across heterogeneous landscapes, the classification approach enabled a robust and spatially consistent mapping of five major land cover classes.
2.6 Change component
To better interpret the patterns of LULC transitions, this study applied the intensity analysis framework introduced by Pontius Jr (2022). In this method, intensity analysis distinguishes between size and intensity. Size is an area in the context of landscapes. Intensity is a ratio, where the numerator is the size of the change and the denominator is the size of the extent where the change could have possibly occurred. Intensity analysis explains a change’s size as a product of two factors: the size of the spatial extent and the intensity of the change. A category’s net change is its gain minus its loss. If a category loses in some places while it gains in other places, then its net change is less than its gross change, because a category’s gross change is its gain plus its loss (Quan et al., 2020; Bilintoh et al., 2024). This method examines the extent and nature of change between LULC categories by decomposing the differences into three distinct components: quantity, exchange, and shift for each time interval: 2009–2014, 2014–2019, and 2019–2024. The Supplementary Material give equations and mathematical symbols that the equations use for those concepts for each category j and the extent during each time interval t, denoted as dtj, qtj, etj, stj, Dt, Qt, Et, and St. Where the first component, quantity, measures the net change in the area of each LULC category, irrespective of the spatial location of transitions. The second component, exchange, captures the symmetric, mutual transitions between pairs of categories, such as when forest becomes vegetation and vegetation becomes forest, revealing bidirectional dynamics often concealed by net area statistics. Lastly, the shift component quantifies the asymmetric reallocation of change that remains after accounting for quantity and exchange (Pontius and Millones, 2011; Xie et al., 2020; Pontius, 2022). All the equations in the Supplementary Material were adopted from Xie et al. (2020).
2.7 Classification accuracy assessment
Accuracy assessment is essential for any LULC map derived from remote sensing data (Islami et al., 2022). We generated a confusion matrix that merged the classified LULC map with reference information. Various measures such as the producer accuracy, user accuracy, and the overall accuracy (OA) (Faqe Ibrahim et al., 2023; Basheer et al., 2024). OA was calculated from Equation 1 below.
The overall accuracy represents the sum of correctly labelled pixels for all the classes in the input image as per the provided test sample sites and is mathematically expressed as a fraction of the number of correctly classified pixels and the total number of test sample sites (Kang et al., 2021). The validation 20% dataset was used to derive confusion matrices from which producer’s accuracy, user’s accuracy, and overall accuracy were computed. However, we acknowledge that the sample was not proportional to the actual distribution of class sizes in the landscape (i.e., population distribution). While stratified random sampling improves representation of minority classes, it may introduce bias into summary accuracy metrics if not corrected. In this study, we did not apply a bias correction or convert the sample confusion matrix into an estimated population confusion matrix. As such, the summary metrics presented may slightly over- or under-estimate true population-level accuracy. This limitation is consistent with the caution advised by Pontius Jr (2022), who emphasizes the importance of transparency when reporting unadjusted accuracy results from stratified samples.
To provide a more diagnostic evaluation, we further applied quantity disagreement and allocation disagreement, as introduced by Pontius and Millones (2011). Quantity disagreement reflects the difference in the amount of each class between the classified and reference maps, while allocation disagreement captures differences in spatial location of those classes. These two measures help overcome conceptual flaws in traditional summary metrics like the Kappa coefficient, which we intentionally excluded (Pontius and Millones, 2011; Foody, 2020). Instead, we advocate interpreting the confusion matrix in terms of individual class accuracies, total agreement, and the explicit breakdown of quantity and allocation disagreement (Pontius, 2022).
3 Results
Here we report an analysis of LULC change at the Dolphin Coast between 2009 and 2024 based on the PlanetScope and RapidEye satellite products. We first provide a detailed analysis of LULC distribution and changes from categories, intervals, and then accuracy assessment.
3.1 LULC areal distribution
Figure 2 illustrates the spatial distribution of five land cover categories across the four time points, while Figure 3 presents the corresponding gain and loss maps. Although the overall spatial patterns appear visually consistent across the years, substantial underlying changes were detected. The most prominent trends include a consistent increase in built-up areas, expanding from 2009 to 2014, and a marked rise in forest cover over the same period. In contrast, vegetation experienced a sharp decline, suggesting widespread land conversion to urban or forest uses. Some of the temporal alternations, such as a category gaining in one interval and then declining in the next, may be attributed to map classification errors.
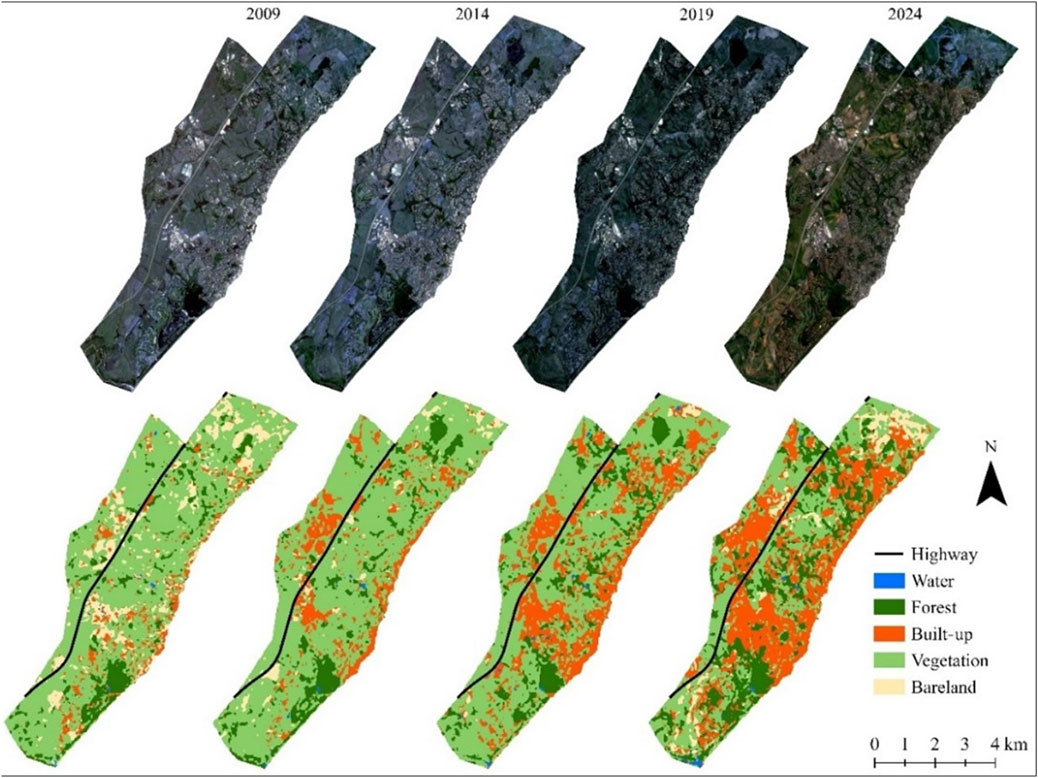
Figure 2. Maps of land categories in the Dolphin Coast from 2009, 2014, 2019 and 2024.
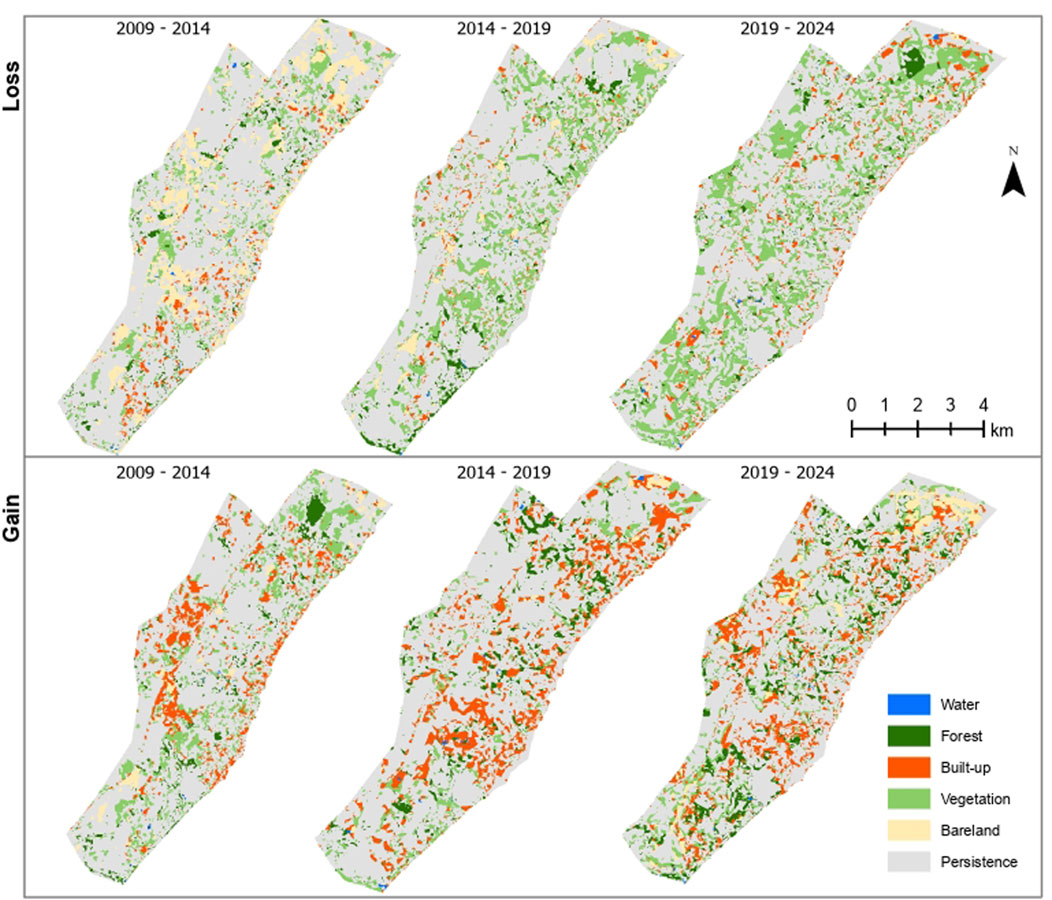
Figure 3. Maps of losses and gains in the Dolphin Coast.
The areal extent and distribution of the individual LULC categories in the Dolphin Coast from 2009 to 2024 are further shown in Table 3, a point to which discussions in the following sections will inevitably refer as necessary. As seen from Table 3, the LULC classes in the study area consist mainly of vegetation (55.71% on average), followed by forests (20.38%), built-up areas (15.65%), then barren land (7.82%) and, to a lesser extent, waterbodies (0.45%). While the area is currently dominated by classes of natural origin, the anthropogenic influence is rapidly increasing, which is a cause for concern in this ecologically sensitive coastal area.
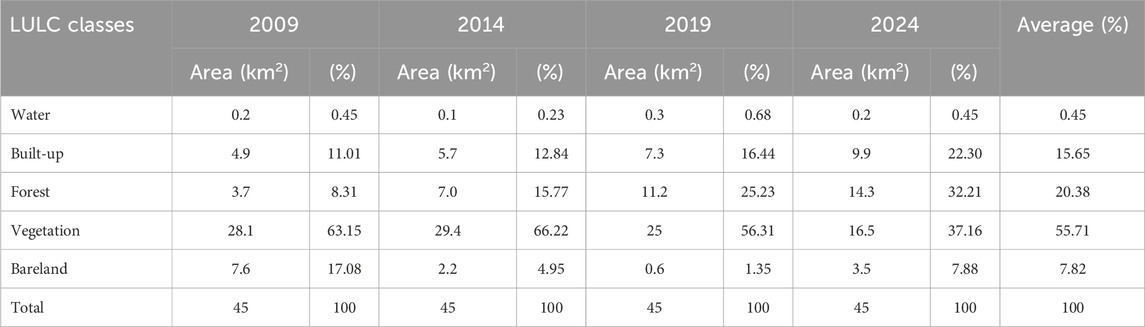
Table 3. Area of each land category in the Dolphin Coast at four time points (km2 and %) over time.
For emphasis, the 45 km2 area was dominated by a widespread vegetation class that occupied two-thirds (63.15%) of the area, but declined over time to almost one-third in 2024 (37.16%) (Table 3). This is followed by barren land, the proportion of which was 17.08% in 2009, mostly distributed in the southern, central and northern parts, however, it fluctuated over time to 7.88% in 2024, mainly in the south and north. Built-up area is varyingly distributed in the central-south to the north and over the coast, increasing from 11.01% in 2009 to 22.30% in 2024. Similarly, forests grew from and 8.31% in 2009 to 32.21% in 2024. To a lesser extent, the area at the southern tip represents less than 1% of the waterbodies, which remained relatively unchanged during the study period.
The results in Figures 4, 5 show that vegetation was the largest source of increases in built-up area (9.0 km2), forest (5.6 km2) and bareland (2.1 km2), while 14.1 km2 remained unchanged. Bareland was the second source of change, with 3.6 km2 lost to built-up area and 1.6 km2 to vegetation, with 0.6 km2 remaining unchanged.
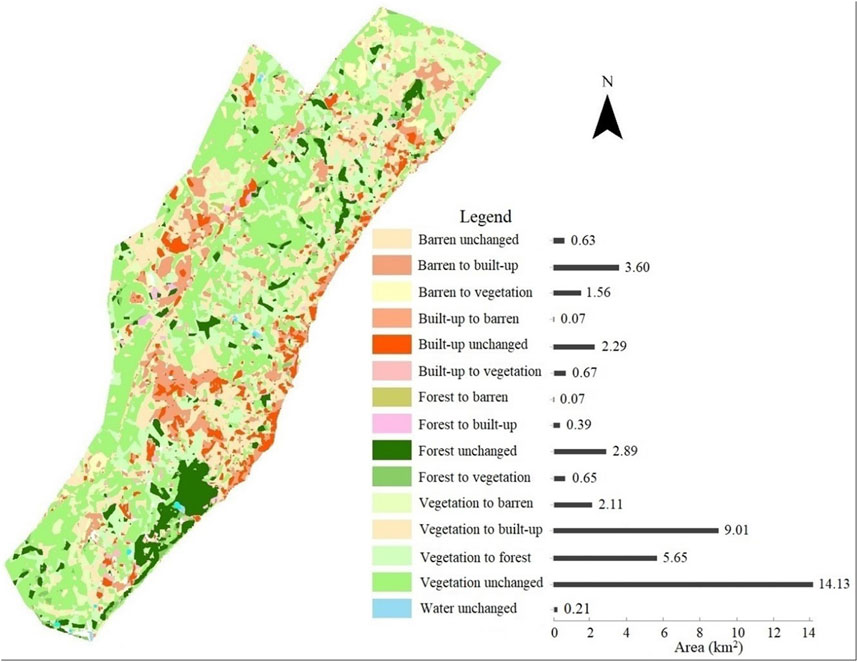
Figure 4. Spatial and quantitative representation of LULC conversion from 2009 to 2024.
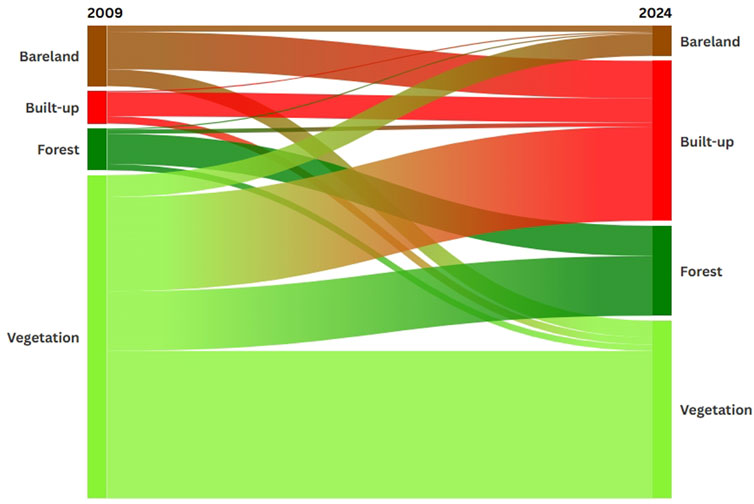
Figure 5. LULC conversion between 2009 and 2024 in the Dolphin Coast.
3.2 Change analysis
Figures 6a,c,e display the components of temporal difference: quantity, exchange, and shift, for each land cover category across the three intervals (2009–2014, 2014–2019, and 2019–2024), expressed as a percentage of the Dolphin Coast area. Vegetation consistently contributed the largest share of change across all intervals, followed by built-up and forest categories. Built-up areas exhibited net gains during each interval, while vegetation shifted from net gain (2009–2014) to net loss (2014–2024). Forest showed a pattern of persistent net gain, while bareland alternated between net loss and gain.
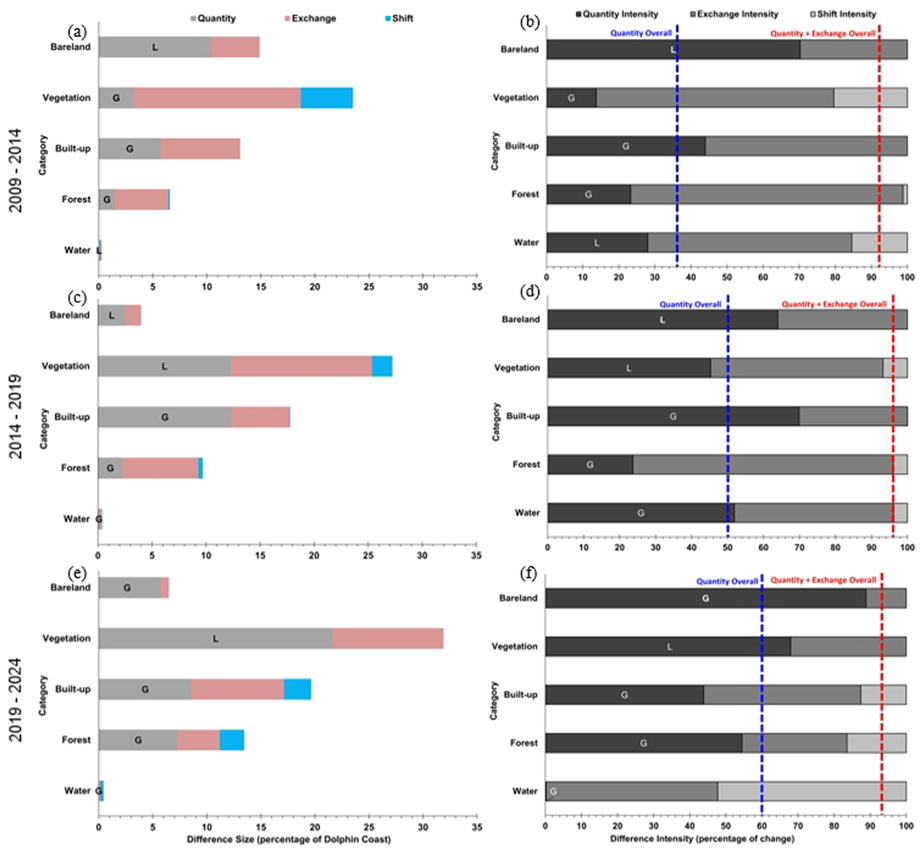
Figure 6. Size (a,c,e) and intensity (b,d,f) of differences during three-time intervals in the Dolphin Coast. L denotes net loss and G denotes net gain.
Exchange emerged as the largest component for several categories, particularly vegetation and bareland, suggesting dynamic spatial turnover and potential classification inconsistencies. For built-up, however, the relationship between exchange and quantity components varied by interval. In 2009–2014 (Figures 6a,b), exchange slightly exceeded quantity, but during 2014–2019 and 2019–2024 (Figures 6c–f), quantity intensity either matched or surpassed exchange, indicating that net directional growth of built-up land became more dominant than simultaneous turnover in later years.
Figures 7a,c,e illustrate the absolute sizes of category-level gains, persistence, and losses, while Figure 7b,d,f show the gain and loss intensities relative to each category’s size. Vegetation consistently exhibited both the highest losses and gains, reflecting high internal variability. During 2009–2014, vegetation had an active loss (above the blue line), while gain remained dormant. Built-up showed moderate-to-high gain intensities throughout, with active gains during 2014–2019 and 2019–2024, consistent with urban expansion. Bareland exhibited increasing gain intensity in the final interval, suggesting emergent land degradation or exposure.
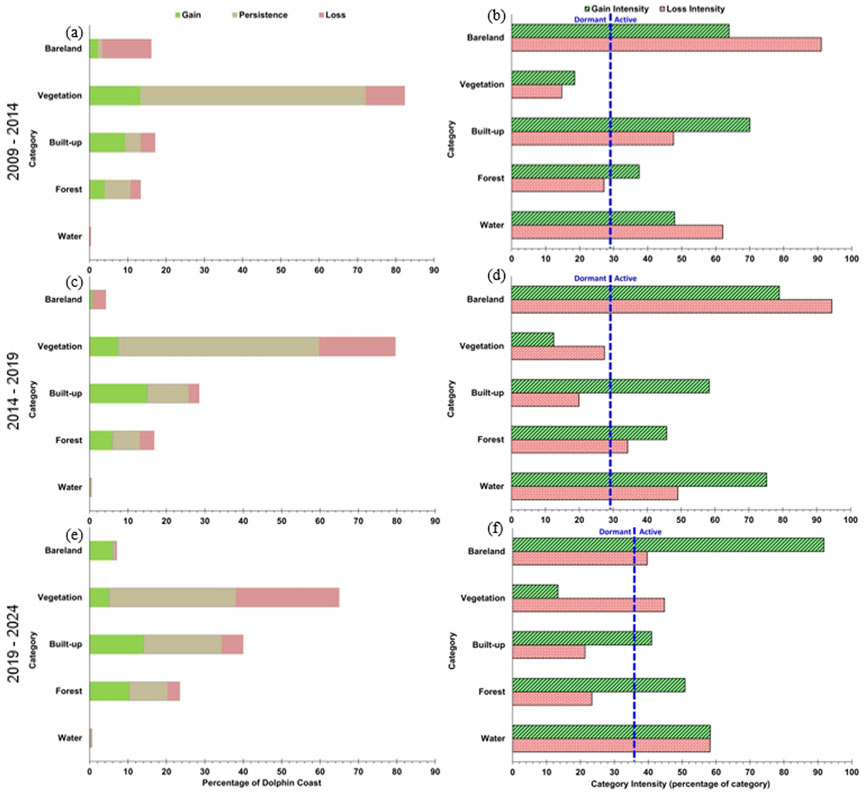
Figure 7. Category level losses and gains for size (a,c,e) and intensities (b,d,f). The dashed line indicates the annual difference in overall percentage of the Dolphin Coast.
The vertical reference lines in both figures clarify the intensity context. In Figure 6, the blue line indicates overall quantity intensity, while the red line shows the combined quantity + exchange intensity. In Figure 7, the dashed line indicates the overall annual difference intensity across Dolphin Coast, allowing identification of active vs. dormant change.
Overall, the analysis confirms that the dominant drivers of change varied by class and period. Importantly, exchange did not consistently exceed quantity for built-up, highlighting the need for precise interpretation and avoiding overgeneralization.
3.3 Mapping accuracy assessment
The accuracy assessment of LULC classification was conducted for four time points: 2009, 2014, 2019, and 2024, using standard metrics including overall accuracy (OA), producer accuracy (PA), and user accuracy (UA). These metrics were derived from confusion matrices based on reference validation samples. Table 4 summarizes the classification performance across the five land categories.
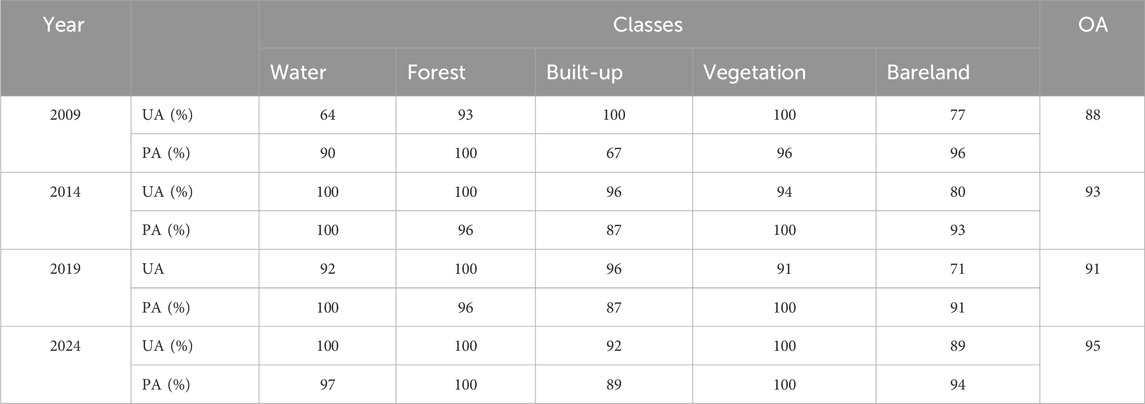
Table 4. LULC classification accuracies for the Dolphin Coast in 2009, 2014, 2019 and 2024.
The highest overall accuracy was achieved in 2024 at 94.8%, followed by 2014 (93.2%), 2019 (91.0%), and the lowest in 2009 (88.3%). These results reflect an improvement in classification performance, particularly due to the transition from RapidEye (5 m resolution) used in 2009 and 2014, to PlanetScope (3 m resolution) imagery used in 2019 and 2024. This trend aligns with recent LULC studies (Lefulebe et al., 2022; Gokool et al., 2024; Basheer et al., 2024), which report improved performance of PlanetScope imagery in capturing finer land cover details, especially in heterogeneous landscapes.
Producer accuracy was generally high across all years, with water and bareland occasionally showing lower UA values, particularly in 2009 (UA for water: 64%, and bareland: 77%), possibly due to spectral confusion with adjacent land covers or seasonal variation in surface appearance. Built-up and vegetation classes achieved consistently high PA and UA across all years, reflecting their distinct spectral signatures and the robustness of the Random Forest classifier.
To further evaluate classification quality, Quantity Disagreement (QD) and Allocation Disagreement (AD) were computed. These metrics help distinguish between errors due to incorrect quantities of classes (QD) and incorrect spatial allocation (AD). The 2024 classification showed in Table 5, the lowest disagreement values (QD: 0.0316; AD: 0.0204), confirming both quantitative and spatial consistency in class assignment. In contrast, the 2009 map had the highest QD (0.0789), suggesting a greater mismatch in class proportions, which may relate to coarser spatial resolution and seasonal spectral variability.
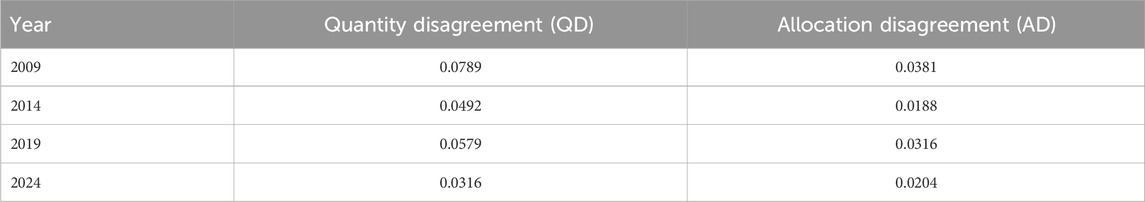
Table 5. Overall disagreement components for LULC maps.
Overall, the classification accuracy results demonstrate improved map reliability over time, with the best performance observed in 2024. The consistent improvements across all metrics reflect the use of high-resolution imagery combined with machine learning classifiers in generating reliable LULC, maps.
4 Discussion
This study investigated land use and land cover dynamics in the Dolphin Coast in South Africa over a 15-year period using high-resolution PlanetScope and RapidEye imagery based on Random Forests classification. The classified maps achieved satisfactory per-year agreement with reference data, with overall accuracies ranging from 88% (2009) to 95% (2024). Improvements in classification performance over time could be attributed to the higher spatial resolution of PlanetScope imagery and the effectiveness of RF in heterogeneous landscapes. The spatial and temporal LULC patterns revealed consistent expansion in built-up areas, increasing from 11.01% in 2009 to 22.30% in 2024. This trend was accompanied by a crucial reduction in vegetation cover, which declined by nearly half from 63.15% to 37.16% over the same period. Forest cover increased from 8.31% to 32.21%, a trend that may be influenced by improvements in the conservation status of the coastal forests in this area (Kambaj et al., 2018). Bareland decreased initially but experienced a slight resurgence in the final interval (2019–2024), while waterbodies remained stable throughout the study period, occupying less than 1% of the total area.
Transition mapping showed that vegetation was the primary source of gains in built-up, forest, and bareland areas, indicating its role as a transitional class under land development pressure. Spatial analysis of gains and losses (Figures 4, 5) confirmed widespread conversions, especially in peri-urban and coastal zones. The dominance of the exchange component in intensity analysis suggests substantial bi-directional changes, possibly reflecting land reallocation or classification noise. Notably, built-up areas exhibited net gains across all three intervals, reinforcing a unidirectional trend of urban expansion. In contrast, vegetation experienced both gains and losses, with net losses during the latter two intervals (2014–2024), suggesting land system instability.
Disagreement metrics further supported the quality of classification, with Quantity Disagreement (QD) and Allocation Disagreement (AD) lowest in 2024 (QD: 0.0316; AD: 0.0204). The highest disagreement occurred in 2009, aligning with lower accuracy and the coarser RapidEye imagery. These results affirm that using fine-resolution imagery in later years improved class allocation and detection of smaller features, consistent with other regional studies (e.g., Lefulebe et al., 2022; Basheer et al., 2024).
While Random Forests showed reliable classification across all time points, the presence of high exchange components in intensity analysis, particularly between vegetation and forest, may signal confusion between spectrally similar classes. Future studies may benefit from incorporating temporal or ancillary variables (e.g., NDVI trajectories or elevation data) to reduce misclassification. We recommend that future studies adopt the approach proposed by Zhang et al. (2025), incorporating methods like DynamicPATCH to capture spatially explicit and gross land cover changes often missed by traditional net change metrics. This method enables detailed tracking of patch-level dynamics, such as splitting, merging, and expanding, thereby improving the understanding of complex landscape transitions.
4.1 Implications for land change monitoring and future planning
Although the current analysis did not model policy, population, or ecological outcomes directly, the observed LULC patterns, particularly vegetation loss and rapid urban expansion, highlight areas of potential planning concern. These findings suggest the value of integrating routine LULC monitoring into regional planning frameworks. The spatially explicit nature of the observed changes may inform zoning updates or land use conflict resolution. Additional research linking socio-economic data with LULC transitions could strengthen the basis for sustainable development and resilience planning in fast-changing coastal landscapes like the Dolphin Coast.
5 Conclusion
This study assessed land cover changes in the Dolphin Coast area of almost 45 km2 in South Africa, from 2009 to 2024, using multi-date PlanetScope and RapidEye satellite images based on a Random Forests classifier. The analysis revealed notable land transformation, including a two-fold increase in built-up area (11.01%–22.30%) and forest areas (8.31%–32.21%) with a corresponding reduction in vegetation cover (63.15%–37.16%). Bareland fluctuated while waterbodies remained relatively stable (∼0.45%) over the study period. Overall classification accuracies varied from 88% to 95%, with the highest accuracy value achieved in 2024 using PlanetScope imagery. The use of transition matrices, intensity analysis, and disagreement metrics provided deeper insight into the spatial and temporal characteristics of land change processes. The dominance of exchange and persistent gains in built-up and forest categories underscores the dynamic nature of the coastal landscape. By integrating fine-resolution satellite data and robust classification techniques, this study contributes a spatially detailed assessment of LULC transitions over a 15-year period. Given these findings, it is important to highlight the potential of PlanetScope and RapidEye satellite products for capturing the spatial and temporal characteristics of land changes, and also to establish a baseline for future LULC monitoring in the Dolphin Coast.
Data availability statement
The raw data supporting the conclusions of this article will be made available by the authors, without undue reservation.
Author contributions
NN: Conceptualization, Formal Analysis, Methodology, Validation, Visualization, Writing – original draft, Writing – review and editing. NPN: Formal Analysis, Supervision, Writing – review and editing. SX: Conceptualization, Formal Analysis, Investigation, Resources, Supervision, Validation, Writing – review and editing.
Funding
The author(s) declare that no financial support was received for the research and/or publication of this article.
Acknowledgements
We gratefully acknowledge Planet Labs for the satellite data used in this study.
Conflict of interest
The authors declare that the research was conducted in the absence of any commercial or financial relationships that could be construed as a potential conflict of interest.
Generative AI statement
The author(s) declare that no Generative AI was used in the creation of this manuscript.
Any alternative text (alt text) provided alongside figures in this article has been generated by Frontiers with the support of artificial intelligence and reasonable efforts have been made to ensure accuracy, including review by the authors wherever possible. If you identify any issues, please contact us.
Publisher’s note
All claims expressed in this article are solely those of the authors and do not necessarily represent those of their affiliated organizations, or those of the publisher, the editors and the reviewers. Any product that may be evaluated in this article, or claim that may be made by its manufacturer, is not guaranteed or endorsed by the publisher.
Supplementary material
The Supplementary Material for this article can be found online at: https://www.frontiersin.org/articles/10.3389/fenvs.2025.1639760/full#supplementary-material
References
Adam, E., Masupha, N., and Xulu, S. (2023). Spatial assessment and prediction of urbanization in Maseru using Earth observation data. Appl. Sci. 13, 5854. doi:10.3390/app13105854
Agidew, A.-m. A., and Singh, K. (2017). The implications of land use and land cover changes for rural household food insecurity in the Northeastern highlands of Ethiopia: the case of the Teleyayen sub-watershed. Agric. and Food Secur. 6, 56–14. doi:10.1186/s40066-017-0134-4
Akhtar, N., Syakir Ishak, M. I., Bhawani, S. A., and Umar, K. (2021). Various natural and anthropogenic factors responsible for water quality degradation: a review. Water 13, 2660. doi:10.3390/w13192660
Arowolo, A. O., and Deng, X. (2018). Land use/land cover change and statistical modelling of cultivated land change drivers in Nigeria. Reg. Environ. change 18, 247–259. doi:10.1007/s10113-017-1186-5
Atef, I., Ahmed, W., and Abdel-Maguid, R. H. (2024). Future land use land cover changes in El-Fayoum governorate: a simulation study using satellite data and CA-Markov model. Stoch. Environ. Res. Risk Assess. 38, 651–664. doi:10.1007/s00477-023-02592-0
Basheer, S., Wang, X., Nawaz, R. A., Pang, T., Adekanmbi, T., and Mahmood, M. Q. (2024). A comparative analysis of PlanetScope 4-band and 8-band imageries for land use land cover classification. Geomatica 76, 100023. doi:10.1016/j.geomat.2024.100023
Bayas, S., Sawant, S., Dhondge, I., Kankal, P., and Joshi, A. (2022). “Land use land cover classification using different ml algorithms on sentinel-2 imagery,” in Advanced machine intelligence and signal processing. Springer. doi:10.1007/978-981-19-0840-8_59
Belgiu, M., and Drăguţ, L. (2016). Random forest in remote sensing: a review of applications and future directions. ISPRS J. photogrammetry remote Sens. 114, 24–31. doi:10.1016/j.isprsjprs.2016.01.011
Bhungeni, O., Ramjatan, A., and Gebreslasie, M. (2024). Evaluating machine-learning algorithms for mapping LULC of the uMngeni catchment area, KwaZulu-Natal. Remote Sens. 16, 2219.
Biggs, R., and Scholes, R. (2002). Land-cover changes in South Africa 1911-1993: research in action. South Afr. J. Sci. 98, 420–424. doi:10.3390/rs16122219
Bilintoh, T. M., Pontius Jr, R. G., and Zhang, A. (2024). Methods to compare sites concerning a category’s change during various time intervals. GIScience and Remote Sens. 61, 2409484. doi:10.1080/15481603.2024.2409484
Boateng, E. Y., Otoo, J., and Abaye, D. A. (2020). Basic tenets of classification algorithms K-nearest-neighbor, support vector machine, random forest and neural network: a review. J. Data Analysis Inf. Process. 8, 341–357. doi:10.4236/jdaip.2020.84020
Chughtai, A. H., Abbasi, H., and Karas, I. R. (2021). A review on change detection method and accuracy assessment for land use land cover. Remote Sens. Appl. Soc. Environ. 22, 100482. doi:10.1016/j.rsase.2021.100482
Chuvieco, E., Riaño, D., Aguado, I., and Cocero, D. (2002). Estimation of fuel moisture content from multitemporal analysis of Landsat Thematic Mapper reflectance data: applications in fire danger assessment. Int. J. remote Sens. 23, 2145–2162. doi:10.1080/01431160110069818
Couronné, R., Probst, P., and Boulesteix, A.-L. (2018). Random forest versus logistic regression: a large-scale benchmark experiment. BMC Bioinforma. 19, 270–14. doi:10.1186/s12859-018-2264-5
Dadashpoor, H., Azizi, P., and Moghadasi, M. (2019). Land use change, urbanization, and change in landscape pattern in a metropolitan area. Sci. Total Environ. 655, 707–719. doi:10.1016/j.scitotenv.2018.11.267
Dhruw, S., Patil, N., Naitam, R., Kumar, N., and Kumar, A. (2023). Land Use/Land cover change detection using remote sensing and GIS approach in Sawangi Watershed of yavatmal district, Maharashtra, India. Int. J. Plant and Soil Sci. 35, 335–345. doi:10.9734/IJPSS/2023/v35i183296
Di Marco, M., Harwood, T. D., Hoskins, A. J., Ware, C., Hill, S. L., and Ferrier, S. (2019). Projecting impacts of global climate and land-use scenarios on plant biodiversity using compositional-turnover modelling. Glob. Change Biol. 25, 2763–2778. doi:10.1111/gcb.14663
Dzurume, T., Dube, T., Thamaga, K. H., Shoko, C., and Mazvimavi, D. (2022). Use of multispectral satellite data to assess impacts of land management practices on wetlands in the Limpopo Transfrontier River Basin, South Africa. South Afr. Geogr. J. 104, 193–212. doi:10.1080/03736245.2021.1941220
Edosa, B. T., and Nagasa, M. D. (2024). Spatiotemporal assessment of land use land cover change, driving forces, and consequences using geospatial techniques: the case of Naqamte city and hinterland, western Ethiopia. Environ. Challenges 14, 100830. doi:10.1016/j.envc.2023.100830
Elachi, C., and Van Zyl, J. J. (2021). Introduction to the physics and techniques of remote sensing. John Wiley and Sons.
Faqe Ibrahim, G. R., Rasul, A., and Abdullah, H. (2023). Improving crop classification accuracy with integrated Sentinel-1 and Sentinel-2 data: a case study of barley and wheat. J. Geovisualization Spatial Analysis 7, 22. doi:10.1007/s41651-023-00152-2
Feng, H., Wang, S., Zou, B., Nie, Y., Ye, S., Ding, Y., et al. (2023). Land use and cover change (LUCC) impacts on Earth’s eco-environments: research progress and prospects. Adv. Space Res. 71, 1418–1435. doi:10.1016/j.asr.2022.09.054
Foody, G. M. (2020). Explaining the unsuitability of the kappa coefficient in the assessment and comparison of the accuracy of thematic maps obtained by image classification. Remote Sens. Environ. 239, 111630. doi:10.1016/j.rse.2019.111630
Garden, S., and Garland, G. (2005). Spit development in the Mdloti River estuary, KwaZulu-Natal. South Afr. J. Geol. 108, 257–270. doi:10.2113/108.2.257
Gašparović, M., Dobrinić, D., and Medak, D. (2018). “Urban vegetation detection based on the land-cover classification of planetscope, rapideye and worldview-2 satellite imagery,” in Proceedings of the 18th international multidisciplinary scientific Geo-Conference SGEM2018. Albena, Bulgaria, 249–256. doi:10.5593/sgem2018/2.3/S10.032
Gaur, S., and Singh, R. (2023). A comprehensive review on land use/land cover (LULC) change modeling for urban development: current status and future prospects. Sustainability 15, 903. doi:10.3390/su15020903
Gillson, L., Wakeling, J. L., and Midgley, G. F. (2012). Exploring the significance of land-cover change in South Africa: news and views. South Afr. J. Sci. 108, 1–3. doi:10.4102/sajs.v108i5/6.1247
Gokool, S., Mahomed, M., Brewer, K., Naiken, V., Clulow, A., Sibanda, M., et al. (2024). Crop mapping in smallholder farms using unmanned aerial vehicle imagery and geospatial cloud computing infrastructure. Heliyon 10, e26913. doi:10.1016/j.heliyon.2024.e26913
González-González, A., Clerici, N., and Quesada, B. (2022). A 30 m-resolution land use-land cover product for the Colombian Andes and Amazon using cloud-computing. Int. J. Appl. Earth Observation Geoinformation 107, 102688. doi:10.1016/j.jag.2022.102688
Guida-Johnson, B., and Zuleta, G. A. (2013). Land-use land-cover change and ecosystem loss in the Espinal ecoregion, Argentina. Agric. Ecosyst. and Environ. 181, 31–40. doi:10.1016/j.agee.2013.09.002
Hermle, D., Keuschnig, M., Hartmeyer, I., Delleske, R., and Krautblatter, M. (2021). Challenging the timely prediction of landside early warning systems with multispectral remote sensing: a novel conceptual approach tested in the Sattelkar, Austria. Nat. Hazards Earth Syst. Sci. Discuss. 2021, 1–24. doi:10.5194/nhess-2021-18
Islami, F., Tarigan, S., Wahjunie, E., and Dasanto, B. (2022). “Accuracy assessment of land use change analysis using Google Earth in Sadar watershed mojokerto regency,” Bristol, United Kingdom: IOP Conf. Ser. Earth Environ. Sci. 950. doi:10.1088/1755-1315/950/1/012091
Jamei, Y., Rajagopalan, P., and Sun, Q. (2019). Spatial structure of surface urban heat island and its relationship with vegetation and built-up areas in Melbourne, Australia. Sci. total Environ. 659, 1335–1351. doi:10.1016/j.scitotenv.2018.12.308
Kang, C. S., Kanniah, K., and Najib, N. (2021). “Google earth engine for landsat image processing and monitoring land use/land cover changes in the johor river basin, Malaysia,” in 2021 IEEE International Geoscience and Remote Sensing Symposium IGARSS, 2021. IEEE, 4236–4239.
Kgaphola, M. J., Ramoelo, A., Odindi, J., Mwenge Kahinda, J.-M., Seetal, A. R., and Musvoto, C. (2023). Impact of land use and land cover change on land degradation in rural semi-arid South Africa: case of the Greater Sekhukhune District Municipality. Environ. Monit. Assess. 195, 710. doi:10.1007/s10661-023-11104-0
Law, J. (2023). Validating the National Coastal Climate Change Vulnerability Assessment’s inundation and erosion layers for the KwaDukuza Municipality. KwaZulu-Natal, Stellenbosch, South Africa: Stellenbosch University.
Lefulebe, B. E., Van der Walt, A., and Xulu, S. (2022). Fine-scale classification of urban land use and land cover with planetscope imagery and machine learning strategies in the city of Cape Town, South Africa. Sustainability 14, 9139. doi:10.3390/su14159139
Li, J., Pei, Y., Zhao, S., Xiao, R., Sang, X., and Zhang, C. (2020). A review of remote sensing for environmental monitoring in China. Remote Sens. 12, 1130. doi:10.3390/rs12071130
Li, Z., Chen, B., Wu, S., Su, M., Chen, J. M., and Xu, B. (2024). Deep learning for urban land use category classification: a review and experimental assessment. Remote Sens. Environ. 311, 114290. doi:10.1016/j.rse.2024.114290
Lillesand, T., Kiefer, R. W., and Chipman, J. (2015). Remote sensing and image interpretation. John Wiley and Sons.
Liu, B., Gao, L., Li, B., Marcos-Martinez, R., and Bryan, B. A. (2020). Nonparametric machine learning for mapping forest cover and exploring influential factors. Landsc. Ecol. 35, 1683–1699. doi:10.1007/s10980-020-01046-0
Mantyka-Pringle, C. S., Visconti, P., Di Marco, M., Martin, T. G., Rondinini, C., and Rhodes, J. R. (2015). Climate change modifies risk of global biodiversity loss due to land-cover change. Biol. Conserv. 187, 103–111. doi:10.1016/j.biocon.2015.04.016
Mariye, M., Mariyo, M., Changming, Y., Teffera, Z. L., and Weldegebrial, B. (2022). Effects of land use and land cover change on soil erosion potential in Berhe district: a case study of Legedadi watershed, Ethiopia. Int. J. River Basin Manag. 20, 79–91. doi:10.1080/15715124.2020.1767636
Marta, S. (2018). Planet imagery product specifications, 91. San Francisco, CA, USA: Planet Labs, 170.
Mashala, M. J., Dube, T., Mudereri, B. T., Ayisi, K. K., and Ramudzuli, M. R. (2023). A systematic review on advancements in remote sensing for assessing and monitoring land use and land cover changes impacts on surface water resources in semi-arid tropical environments. Remote Sens. 15, 3926. doi:10.3390/rs15163926
Mead, A., Griffiths, C., Branch, G., McQuaid, C., Blamey, L., Bolton, J., et al. (2013). Human-mediated drivers of change—impacts on coastal ecosystems and marine biota of South Africa. Afr. J. Mar. Sci. 35, 403–425. doi:10.2989/1814232X.2013.830147
Minaei, M., Shafizadeh-Moghadam, H., and Tayyebi, A. (2018). Spatiotemporal nexus between the pattern of land degradation and land cover dynamics in Iran. Land Degrad. and Dev. 29, 2854–2863. doi:10.1002/ldr.3007
Mogonong, B. P., Twine, W., Feig, G. T., Van der Merwe, H., and Fisher, J. T. (2024). Influences of climate variability on land use and land cover change in rural South Africa. Remote Sens. 16, 1200. doi:10.3390/rs16071200
Mthiyane, D. B., Wissink, H., and Chiwawa, N. (2022). The impact of rural–urban migration in South Africa: a case of KwaDukuza municipality. J. Local Gov. Res. Innovation 3, 56. doi:10.4102/.jolgri.v3i0.56
Musetsho, K. D., Chitakira, M., and Nel, W. (2021). Mapping land-use/land-cover change in a critical biodiversity area of South Africa. Int. J. Environ. Res. Public Health 18, 10164. doi:10.3390/ijerph181910164
Ngondo, J., Mango, J., Liu, R., Nobert, J., Dubi, A., and Cheng, H. (2021). Land-use and land-cover (LULC) change detection and the implications for coastal water resource management in the Wami–Ruvu Basin, Tanzania. Sustainability 13, 4092. doi:10.3390/su13084092
Nxumalo, N., Xulu, S., and Nzimande, N. P. (2025). Land use and land cover change dynamics and local perception in the Dolphin Coast, KwaZulu-Natal. Cogent Soc. Sci. 11, 2563785. doi:10.1080/23311886.2025.2563785
Palmer, B., Van der Elst, R., Mackay, F., Mather, A., Smith, A., Bundy, S., et al. (2011). Preliminary coastal vulnerability assessment for KwaZulu-Natal, South Africa. J. Coast. Res., 1390–1395.
Parracciani, C., Gigante, D., Mutanga, O., Bonafoni, S., and Vizzari, M. (2024). Land cover changes in grassland landscapes: combining enhanced Landsat data composition, LandTrendr, and machine learning classification in Google Earth Engine with MLP-ANN scenario forecasting. GIScience and Remote Sens. 61, 2302221. doi:10.080/15481603.2024.2302221
Pontius, R. G., and Lippitt, C. D. (2006). Can error explain map differences over time? Cartogr. Geogr. Inf. Sci. 33, 159–171. doi:10.1559/152304006777681706
Pontius, R. G., and Millones, M. (2011). Death to Kappa: birth of quantity disagreement and allocation disagreement for accuracy assessment. Int. J. remote Sens. 32, 4407–4429. doi:10.1080/01431161.2011.552923
Pontius, R. G., and Santacruz, A. (2014). Quantity, exchange, and shift components of difference in a square contingency table. Int. J. remote Sens. 35, 7543–7554. doi:10.1080/2150704X.2014.969814
Potgieter, L. J., Douwes, E., Gaertner, M., Measey, J., Paap, T., and Richardson, D. M. (2020). Biological invasions in South Africa’s urban ecosystems: patterns, processes, impacts, and management. Biol. Invasions S. Afr. 14, 275–309. doi:10.1007/978-3-030-32394-3_11
Quan, B., Pontius Jr, R. G., and Song, H. (2020). Intensity Analysis to communicate land change during three time intervals in two regions of Quanzhou City, China. GIScience and Remote Sens. 57, 21–36. doi:10.1080/15481603.2019.1658420
Radeloff, V. C., Roy, D. P., Wulder, M. A., Anderson, M., Cook, B., Crawford, C. J., et al. (2024). Need and vision for global medium-resolution Landsat and Sentinel-2 data products. Remote Sens. Environ. 300, 113918.
Ramsarup, N. (2022). Assessing techniques to successfully monitor the oceanography of the complex uThukela Marine Protected Area. doi:10.1016/j.rse.2023.113918
Regasa, M. S., Nones, M., and Adeba, D. (2021). A review on land use and land cover change in Ethiopian basins. Land 10, 585. doi:10.3390/land10060585
Rogan, J., and Chen, D. (2004). Remote sensing technology for mapping and monitoring land-cover and land-use change. Prog. Plan. 61, 301–325. doi:10.1016/S0305-9006(03)00066-7
Rukhovich, D. I., Koroleva, P. V., Rukhovich, A. D., and Komissarov, M. A. (2022). Informativeness of the long-term average spectral characteristics of the bare soil surface for the detection of soil cover degradation with the neural network filtering of remote sensing data. Remote Sens. 15, 124. doi:10.3390/rs15010124
Sabr, A., Moeinaddini, M., Azarnivand, H., and Guinot, B. (2016). Assessment of land use and land cover change using spatiotemporal analysis of landscape: case study in south of Tehran. Environ. Monit. Assess. 188, 691–14. doi:10.1007/s10661-016-5701-9
Şahin, G. R., and Kaplan, G. (2023). Land cover classification using various remote sensing datasets with PlanetScope SuperDove Data in GEE. Intercont. Geoinformation Days 6, 152–156.
Saputra, M. H., and Lee, H. S. (2019). Prediction of land use and land cover changes for North Sumatra, Indonesia, using an artificial-neural-network-based cellular automaton. Sustainability 11, 3024. doi:10.3390/su11113024
Shandu, I. D., and Atif, I. (2023). An integration of geospatial modelling and machine learning techniques for mapping groundwater potential zones in Nelson Mandela Bay, South Africa. Water 15, 3447. doi:10.3390/w15193447
Sharma, R., Nehren, U., Rahman, S. A., Meyer, M., Rimal, B., Aria Seta, G., et al. (2018). Modeling land use and land cover changes and their effects on biodiversity in Central Kalimantan, Indonesia. Land 7, 57. doi:10.3390/land7020057
Smith, A., Guastella, L. A., Mather, A. A., Bundy, S. C., and Haigh, I. D. (2013). KwaZulu-Natal coastal erosion events of 2006/2007 and 2011: a predictive tool? South Afr. J. Sci. 109, 4. doi:10.1590/sajs.2013/20120025
Swain, R., Paul, A., and Behera, M. D. (2024). Spatio-temporal fusion methods for spectral remote sensing: a comprehensive technical review and comparative analysis. Trop. Ecol. 65, 356–375. doi:10.1007/s42965-023-00318-5
Tagliarolo, M., and Scharler, U. (2018). Spatial and temporal variability of carbon budgets of shallow South African subtropical estuaries. Sci. total Environ. 626, 915–926. doi:10.1016/j.scitotenv.2018.01.166
Talukdar, S., Singha, P., Mahato, S., Pal, S., Liou, Y.-A., Rahman, A., et al. (2020). Land-use land-cover classification by machine learning classifiers for satellite observations—A review. Remote Sens. 12, 1135. doi:10.3390/rs12071135
Tamiminia, H., Salehi, B., Mahdianpari, M., Quackenbush, L., Adeli, S., and Brisco, B. (2020). Google Earth Engine for geo-big data applications: a meta-analysis and systematic review. ISPRS J. photogrammetry remote Sens. 164, 152–170. doi:10.1016/j.isprsjprs.2020.04.001
Titeux, N., Henle, K., Mihoub, J. B., Regos, A., Geijzendorffer, I. R., Cramer, W., et al. (2016). Biodiversity scenarios neglect future land-use changes. Glob. change Biol. 22, 2505–2515. doi:10.1111/gcb.13272
Todes, A. (2014). New African suburbanisation? Exploring the growth of the northern corridor of eThekwini/KwaDakuza. Afr. Stud. 73, 245–270. doi:10.1080/00020184.2014.925188
Ul Din, S., and Mak, H. W. L. (2021). Retrieval of land-use/land cover change (LUCC) maps and urban expansion dynamics of Hyderabad, Pakistan via Landsat datasets and support vector machine framework. Remote Sens. 13, 3337. doi:10.3390/rs13163337
Verde, N., Mallinis, G., Tsakiri-Strati, M., Georgiadis, C., and Patias, P. (2018). Assessment of radiometric resolution impact on remote sensing data classification accuracy. Remote Sens. 10, 1267. doi:10.3390/rs10081267
Voltersen, M., Berger, C., Hese, S., and Schmullius, C. (2014). Object-based land cover mapping and comprehensive feature calculation for an automated derivation of urban structure types at block level. Remote Sens. Environ. 154, 192–201. doi:10.1016/j.rse.2014.08.024
Wang, L., Qu, J. J., and Hao, X. (2008). Forest fire detection using the normalized multi-band drought index (NMDI) with satellite measurements. Agric. For. meteorology 148, 1767–1776. doi:10.1016/j.agrformet.2008.06.005
Wiatkowska, B., Słodczyk, J., and Stokowska, A. (2021). Spatial-temporal land use and land cover changes in urban areas using remote sensing images and GIS analysis: the case study of Opole, Poland. Geosciences 11, 312. doi:10.3390/geosciences11080312
Xie, Z., Pontius Jr, R. G., Huang, J., and Nitivattananon, V. (2020). Enhanced intensity analysis to quantify categorical change and to identify suspicious land transitions: a case study of Nanchang, China. Remote Sens. 12, 3323. doi:10.3390/rs12203323
Yoon, B., and Choi, J. (2018). Analysis of Land cover changes based on classification result using PlanetScope satellite imagery. Korean J. Remote Sens. 34, 671–680. doi:10.7780/kjrs.2018.34.4.9
Keywords: land use and land cover change, planetscope, rapideye, random forests, dolphin coast
Citation: Nxumalo N, Nzimande NP and Xulu S (2025) Geo-temporal analysis of land use dynamics in the Dolphin Coast, KwaZulu-Natal, South Africa, using RapidEye and PlanetScope imagery. Front. Environ. Sci. 13:1639760. doi: 10.3389/fenvs.2025.1639760
Received: 02 June 2025; Accepted: 21 October 2025;
Published: 06 November 2025.
Edited by:
Hugo Wai Leung Mak, Hong Kong University of Science and Technology, Hong Kong SAR, ChinaReviewed by:
Robert Gilmore Pontius Jr, Clark University, United StatesReniko Gondo, University of Botswana, Botswana
Copyright © 2025 Nxumalo, Nzimande and Xulu. This is an open-access article distributed under the terms of the Creative Commons Attribution License (CC BY). The use, distribution or reproduction in other forums is permitted, provided the original author(s) and the copyright owner(s) are credited and that the original publication in this journal is cited, in accordance with accepted academic practice. No use, distribution or reproduction is permitted which does not comply with these terms.
*Correspondence: Nzuzo Nxumalo, MjI0MDQ1MTE1QHN0dS51a3puLmFjLnph