 Samadhee Kaluarachchi*
 Younes Alila
- Forest Resources Management, Faculty of Forestry, The University of British Columbia, Vancouver, Canada
Anthropogenic activities have led to an alarming rise in frequencies and severities of hydroclimatic extremes, resulting in deaths, adverse health impacts, near-destruction of municipalities, and trillions of US dollars or equivalent in economic impacts worldwide. With trends expected to continue or intensify, there is growing pressure to re-evaluate current adaptation and mitigation strategies. Here, it is demonstrated that while much of risk management, particularly of floods, remains magnitude-centric, a frequency-centric approach is key for reliably predicting risks and designing cost-effective solutions. This approach requires bridging hydroclimatology’s extreme value theory with the modern science of causation through stochastic physics. It anchors physical understanding in probabilistic frameworks, centring environmental and anthropogenic controls when modelling and interpreting frequency distributions. Linking natural controls to a system’s undisturbed state and subsequent frequency-centric quantification of anthropogenic influence highlights large frequency changes far surpassing changes in magnitude, aligning scientific and professional practice with reality. In fact, the dramatic rise in extremes likely arises in part as a manifestation of an undisturbed distribution that is inherently highly sensitive to anthropogenic change, a crucial question for risk management. Only with an accurate portrayal of risk and sensitivity grounded in the deeper meaning of probability can hydroclimatology motivate strong policies and support the design of innovative solutions in the Anthropocene.
1 Introduction
While hydroclimatic extremes such as heatwaves, wildfires, storms, floods, and droughts have long been a reality, the recent decades have seen an unprecedented and alarming rise in their frequencies and severities worldwide (Chiang et al., 2021; Fischer and Knutti, 2015; Philip et al., 2019; J. Wang et al., 2021). In 2021 alone, British Columbia (BC), Canada, experienced an extreme heatwave causing 619 heat-related deaths (White et al., 2023), severe wildfire destroying much of the municipality of Lytton (Parisien et al., 2023), and extensive flooding (Gillett et al., 2022), with disproportionate impacts on local and Indigenous communities (e.g., White et al., 2023) and estimated costs up to CAD 17 billion (Lee and Parfitt, 2022). Elsewhere, heatwaves have led to tens of thousands of deaths (Ballester et al., 2023), severe wildfires are projected to cost billions of United States dollars or equivalent in mortality effects alone (Borchers-Arriagada et al., 2024), and floods, storms, and droughts are projected to cost trillions of US dollars or equivalent in damages in seven major countries (GHD, 2022). While climate change, land use and cover (LULC) change, and other human activities all influence extremes, those attributable to climate change alone cost USD 143 billion per year globally (Newman and Noy, 2023).
These events have motivated the rise of attribution science, which compares “factual” (real-world) conditions to those of a “counterfactual” world with minimal anthropogenic influence (i.e., natural or early industrial conditions), isolating the role of human disturbance on risks of extremes (Stott et al., 2016). They have led to startling conclusions, especially concerning changes in frequency (Lloyd and Shepherd, 2020) (see Supplementary Table S1). In some cases, events that were nearly impossible or extremely rare under counterfactual conditions became less than 200- (or even 100-) year events. Despite uncertainties in quantification of these shifts and increased vulnerability to type 2 errors (false negatives) (Lloyd and Shepherd, 2020; Xie et al., 2015), conclusions are clear: human activity has greatly altered risks of extremes, with trends expected to continue or accelerate (Fischer and Knutti, 2015; Seneviratne et al., 2014).
Consequently, there is growing pressure to re-evaluate current adaptation and mitigation strategies for changing risks of hydroclimatic extremes, especially as other factors such as increased urbanization onto flood-prone areas (Rentschler et al., 2023) further increase vulnerability and exposure to risks. Since risk is often defined as a function of probability and event impact (Eslamian and Eslamian, 2023), both changes in probability and magnitude must be accurately quantified. In the case of floods, for instance, traditional engineering-based solutions such as dikes and bridges can fail from either hydrologic or geomorphic activity. Hydrological failures often occur during flow maxima or rare events, when a single flood event exceeds a structure’s design capacity, such as the 200-year event, which it is engineered to withstand (Flint et al., 2017). Geomorphic failures result from longer-term cumulative work associated with frequent flows, leading to failures at lower return periods (Flint et al., 2017; Wardhana and Hadipriono, 2003). While scour is often emphasized (Wardhana and Hadipriono, 2003), mobilization and accumulation of sediments additionally aggrade the channel, lowering its capacity to contain flood volumes (Hudson, 2021). Transport of sediment can also increase impact forces on flood infrastructure and encourage further scour, potentially leading to infrastructure failure (Vázquez-Tarrío et al., 2024). Therefore, assessing changing flood risk requires examining both changes in magnitude (i.e., exceedance of flood design capacity) and frequency (i.e., increased geomorphic activity), especially when determining suitability of older structures to change and incorporating nonstationarity into new designs. Even though design flood magnitudes can be increased, small changes in magnitude produce much larger changes in frequency (Allen and Ingram, 2002; Mearns et al., 1984) which often go unrecognized (Quintero et al., 2018). With a range of floods (i.e., medium and large) increasing in frequency, a magnitude-centric approach is ill-suited to capture these more frequent (i.e., sustained) higher flows and consequent increases in geomorphic activity. Furthermore, a change in hydrological regime, especially through changes in variability which greatly alter flood frequencies and magnitudes, can lead to changes in species abundance, richness, and diversity (Poff et al., 1997; Strickland et al., 2024), which are underestimated with a magnitude-centric focus on the design flood event. Only a frequency-centric approach emphasizes both sustained higher flows and its geomorphic and ecological implications for a holistic understanding of change. Moreover, engineering-based solutions require regular maintenance and upgrades (especially with rising flood risks) (Baldassarre et al., 2018), provide a false sense of security which encourages development in high-risk areas (Jongman, 2018), and may treat only symptoms rather than address the root cause of the problem (Awah et al., 2024), thus they are increasingly deemed insufficient for managing risk (Kiesel et al., 2023).
Due to the limitations of traditional engineering solutions, many calls instead focus on nature-based solutions (NBS) (Jongman, 2018), which temporarily store and gradually discharge stormwater, preventing sudden increases in fast runoff (Dadson et al., 2017). Sponge parks and retention basins have already been implemented in China and Europe (Chan et al., 2018; Leanza, 2022), and reforestation and afforestation studies suggest risk mitigation elsewhere (Lallemant et al., 2021; Penny et al., 2023). While many emphasize their cost-effectiveness (Vicarelli et al., 2024) and benefits for flood loss avoidance (Atkins, 2015), NBS can be costly to install (Chan et al., 2018). Others have questioned effectiveness of NBS for larger floods (Dadson et al., 2017; Kay et al., 2019), suggesting that their suitability under changing risks must first be established prior to their widespread adoption for mitigating extremes.
Although science has advanced on the prediction front (i.e., attribution science), an accurate quantification of risk must be supported by the right physical understanding of the phenomenon. Due to the interconnected nature of drivers within Earth systems, time series of hydroclimatic variables such as streamflow are influenced by multiple simultaneous drivers (B. Merz et al., 2012; Runge et al., 2019), thus understanding of extremes must stem from the correct framework. Only a causal investigation can disentangle multiple influences and identify direct, causal relationships between both natural and anthropogenic drivers and extremes (Runge et al., 2019). Thus, while modern science of causation (Pearl, 2009) and extreme value theory (EVT) common to hydroclimatology have largely remained separate, they must be bridged together to understand extremes and their causative factors (Chavez-Demoulin and Mhalla, 2024) through a stochastic physics approach (Klemeš, 1978; Pham and Alila, 2024). This approach uses probability to understand the system of interest (WMO, 2012), accounting for inherent stochasticity (randomness) in nature (Klemeš, 1978; Swain et al., 2020). It “tries to place the statistics in a physical framework” to understand physical controls of a given phenomenon (Dawdy and Gupta, 1997, p. 274) and is already well-established in many fields (Ayalew and Krajewski, 2017; Commenges, 2018; Eagleson, 1972; Lague, 2014; Loewer, 2020; McCuen and Smith, 2008; Palmer and Williams, 2008; Parascandola and Weed, 2001; Sudakov et al., 2022). However, despite numerous hydrology studies investigating climatic and catchment controls of extremes (Macdonald et al., 2022; B. Merz et al., 2022; Sivapalan et al., 2005), attention remains directed on predictions via fitting frequency distributions to time series (e.g., Opere et al., 2006) or on the use of models or other statistical methods with limited incorporation of physical understanding and interpretation (e.g., Dhasmana et al., 2023). Instead, a stochastic physics approach integrating environmental and anthropogenic controls of frequency distributions are urgently needed for more robust quantification of risk, especially given nonstationarities and limited record lengths, and for design of NBS.
The upper tail of frequency distributions represents the most extreme events, with the shape of this tail linked to a system’s sensitivity to change, especially in literature outside of hydroclimatology. “Lighter tailed” systems are fragile, losing from environmental variations (or anthropogenic disturbances) while “heavier tailed” systems are “antifragile,” gaining from variability (Taleb, 2012; Taleb and Douady, 2013). Although governing mechanisms of tail behaviour differ across hydroclimatic variables, Taleb’s distinction between fragility and antifragility can be used to predict a hydroclimatic system’s sensitivity to disturbance. However, despite frequency distributions being ubiquitous throughout hydroclimatology, their tail behaviour and implications are often overlooked. Studies that examine tail behaviour within a stationary framework typically link high-magnitude events to heavier tails, suggesting that this tail behaviour is more consequential (B. Merz et al., 2022) although lighter tails suggest hypersensitive regimes under nonstationarity (Taleb, 2012; Taleb and Douady, 2013); even under small changes in magnitude, “boundedness” of distributions leads to large frequency changes following a disturbance (Fischer et al., 2023) (see Figure 1). Similarly, aggregation of flood-generating factors more easily yields heavier tails than maintains lighter tails (B. Merz et al., 2022), further emphasizing fragility of lighter tails. Consequently, these two tail behaviours have contrasting implications on a regime’s fragility and response to change. For example, whether the current 100-year event becomes a 5-year or 50-year event depends greatly on pre-disturbance tail behaviour and its shift to the post-disturbance distribution. Therefore, to reliably quantify risk and support more robust risk management, how should the physics of extremes be understood?
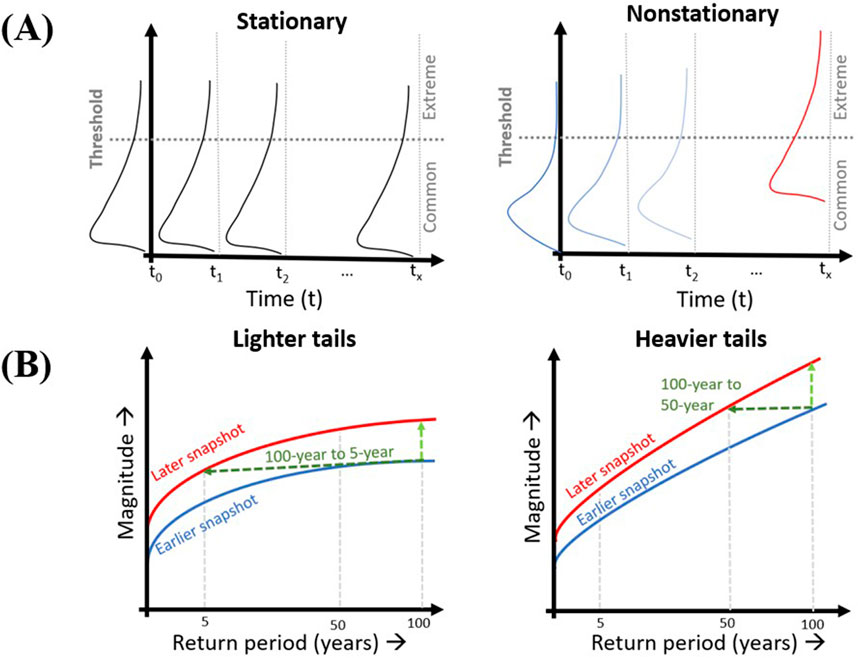
Figure 1. Tail sensitivity under a nonstationary framework. (A) Conceptual drawing of a distribution representing a hydroclimatic variable through time under both stationary (left) and nonstationary (right) conditions. Floods under the threshold (grey dotted line) represent the population of common events while floods greater than the threshold represent extremes. In the nonstationary figure, the blue curve suggests an earlier period with reduced anthropogenic activity while the red curve suggests a later period with increased anthropogenic activity. The nonstationary distribution changes with time in location, shape, and scale, all of which influence tail behaviour. Figure inspired in part by Salas and Obeysekera (2014). (B) A nonstationary distribution portrayed using “snapshots in time” at different stages across the modelled period, showing how magnitude-frequency relationships evolve with varying intensities of anthropogenic activity. This conceptual drawing shows example changes in magnitude (light green, dashed) and frequency (dark green, dashed) between an earlier “snapshot” with less anthropogenic activity (blue) and a later “snapshot” with greater anthropogenic activity (red) under lighter (left) and heavier (right) tails. The 100-year event undergoes a larger change in frequency under lighter tails (i.e., to a 5-year event) than under heavier tails (i.e., to a 50-year event).
Additionally, even though tails are an asymptotic property of the distribution, most studies assess tail behaviour in the pre-asymptote. For instance, in hydrology, sample sizes typically span only a few decades (Hu et al., 2020), but they are primarily used to model the upper tail including up to the 100- or 200-year event (B. Merz et al., 2022), exacerbating its likelihood of mischaracterization (Fisher and Tippett, 1928). Given these pre-asymptotic practices (e.g., use of pre-asymptotic samples to model the pre-asymptote or even asymptote), known hypersensitivity of lighter tails, and the global surge in extremes, another crucial question is raised: can such dramatic frequency changes be a manifestation, at least in part, of a pre-disturbance distribution that is inherently milder than previously thought?
Using floods as an illustrative example, this paper will dive into these two crucial questions. It brings together insights throughout stochastic hydrology, general hydroclimatology, and beyond to advance understanding and prediction of extremes. The review is primarily based upon 1) attribution science literature investigating how anthropogenic climate change and LULC changes alter hydroclimatic extremes and 2) hydrology literature investigating natural and anthropogenic controls of flood variance, flood skew, and the flood frequency distribution. The Scopus database was used for both searches, where titles and abstracts were screened for relevance, then full texts of appropriate papers were examined for final suitability. Attribution science literature that quantify change in frequencies (e.g., through the risk ratio, fraction attributable risk, a change in return periods, X-fold increases, or frequency distributions (e.g., Gillett et al., 2022; Stott et al., 2016)) were used to summarize general changes in hydroclimatic regimes. Hydrology literature relating climatic, physiographic, and anthropogenic controls to lighter- or heavier-tailed behaviour, or to flood variance or skewness, were retained to support a stochastic overview of flood frequency curve (FFC) tail behaviour. Overarching trends in the natural and anthropogenic controls were summarized, highlighting any inconsistencies among studies. These studies were further supplemented by conceptual or methods-oriented literature from throughout hydroclimatology and beyond to shed light on key stochastic physics and attribution science principles that support a sound understanding of upper tail behaviour and its sensitivity to change.
The paper is structured as follows: Section 2 will discuss the need for a causal, stochastic physics approach for understanding risk, and hence the upper tail of the frequency distribution. Section 3 will discuss environmental controls of the upper tail of the FFC as an illustrative example of extremes, focusing on how each control favours lighter or heavier distributions, but noting that these controls and their interactions together define tail behaviour. Section 4 begins by assessing implications of tail behaviour and how anthropogenic controls shift the natural distribution, then it re-examines a key assumption of tail behaviour in hydrology. Finally, implications of a proper understanding of the upper tail and a frequency-centric interpretation for flood management are provided. Together, these sections emphasize that only a proper understanding of the physics in the stochastic framework will allow for reliable prediction and effective adaptation and mitigation of risks associated with extremes. In the words of Good (2007, p. 407), “We are controlled by nature, but by discovering causes we can recover some of the control.”
2 The need for a causal, stochastic approach
2.1 Integrating physics into hydroclimatic risk prediction: a stochastic approach
A rigorous quantification of risk requires a causal framework due to the entangled nature of drivers within Earth systems (Runge et al., 2019; Swain et al., 2020). Multiple drivers may superimpose on a time series (e.g., concurrent climate and LULC changes on flood peaks) (Johnson and Alila, 2023), making trend detection difficult when conventional statistical tests are applied to raw data (Runge et al., 2019), especially under limited record lengths (Yue et al., 2002). Similarly, correlational analyses can yield ambiguous and misleading results under multiple superimposing drivers while causal methods can isolate effects of a disturbance, identify cause and effect relationships, and separate the direct from the indirect (Martínez-Sánchez et al., 2024; Runge et al., 2019). This principle was articulated by Klemeš (1978, p. 297), who emphasized that “knowledge is not identical with the sum of empirical facts and their descriptions by empirical laws, but arises through an ability of the human mind to discover causal relationships between these empirical laws, i.e., its ability to understand nature,” progressing beyond mere observations and descriptions of phenomena to the “discovery of their underlying causal structure” (Klemeš, 1978, p. 285).
In the science of extremes, a causal investigation of risk requires a probability-based approach accounting for the “multiple and chancy” nature (Karhausen, 2000, p. 59) of hydroclimatic phenomena (Pham and Alila, 2024). It uses probability to understand physics (Rubin, 2003; WMO, 2012) and anchors physical understanding in the framework of frequency distributions (Dawdy et al., 2012; R. Merz and Blöschl, 2008). This stochastic (or quantum) approach accounts for both stochasticity (randomness) and complexity (from multiple causes) of nature (Parascandola and Weed, 2001; Strevens, 2014), which are characteristics of flood generation (Klemeš, 1978; Pham and Alila, 2024) and climatic extremes (Swain et al., 2020). Thus, a probability-based definition has been identified as highly suitable for causation because it accounts for the indeterministic or chancy nature of the phenomenon of interest, the infinitely many combinations of conditions, processes, and events that may have led to it, incorporation of other unknown causes, and even the lack of knowledge to predict the phenomenon perfectly (Karhausen, 2000; Parascandola and Weed, 2001; Strevens, 2014).
While such approaches, namely the Extreme Value Theory (EVT), are common in the science of extremes (Brunner et al., 2021; Stott et al., 2016), incorporation of physical knowledge required for a deeper, causal understanding is often overlooked when modelling and interpreting frequency distributions (R. Merz and Blöschl, 2008). Mathematical or statistical formulations may provide insights, but they are insufficient by themselves to provide physical explanations (Hirschboeck, 1999). As Klemeš (1986, p. 184) stated,
no hydrologic, climatic, geologic, or other physical conditions are invoked in the analysis. The floods are stripped of all hydrologic context down to bleached skeletons of numbers giving their peak flows and these numbers are then subjected to the most rigorous treatments … , apparently in an unshakeable belief that the amount of this rigour determines the degree of hydrologic relevance of the results.
Despite being articulated by Klemeš several decades ago, this reliance on mathematical and statistical procedures persists and is criticized today (Dawdy et al., 2012; R. Merz and Blöschl, 2008). Similarly, hydrology is in dire need of a move away from simply detecting trends to a focus on attribution (i.e., identifying causes), which “is addressed, if at all, rather sloppily” (B. Merz et al., 2012, p. 1385). Thus, many have advocated for a move away from a “statistics only approach” (Dawdy and Gupta, 1997, p. 274) to one which centres physical understanding (Dawdy et al., 2012; R. Merz and Blöschl, 2008).
Stochastic hydrology boasts a 50-year history of understanding environmental controls of frequency distributions (Blöschl and Sivapalan, 1997; Eagleson, 1972) and skewness (McCuen and Hromadka, 1988; R. Merz and Blöschl, 2009), but to the best of our knowledge its connection to causality and causal inference has seldom been discussed (except by Klemeš (1978)) and incorporation of this knowledge into flood frequency analysis (FFA) is often neglected. In fact, while “most hydrologists would agree on the importance of hydrological reasoning in flood frequency estimation, most publications in the hydrological literature have focused on solving the estimation problem,” (R. Merz and Blöschl, 2008, p. 2) leading hydrology astray from its original aim of understanding and predicting probabilities of extremes (Klemeš, 1993). Thus, FFA must incorporate physical knowledge for more robust predictions (Klemeš, 1986; R. Merz and Blöschl, 2008), especially given nonstationarities and limited record lengths (Dawdy et al., 2012).
Similarly, in the wider attribution science literature, despite large changes in frequencies noted under anthropogenic activity (see Supplementary Table S1), environmental controls of frequency distributions are typically overlooked. The authors are not aware of studies linking tail heaviness of hydrometeorological variables (outside of floods) to their environmental controls, in line with Van Oldenborgh et al. (2022, p. 4) who stated that they are “not aware of a rigorous derivation of the origin of the upper bound” for temperature extremes.
To address these gaps, a stochastic physics approach can be used to integrate physical understanding into the prediction of hydroclimatic extremes. Frequency distributions integrate interactions across space and time at the holistic macroscale (e.g., at the watershed scale for floods) (Robinson and Sivapalan, 1997). Hence, identifying the distribution’s physical (environmental and anthropogenic) controls, how its tail behaviour and environmental controls influence its sensitivity to disturbances, and what physical characteristics may have led to an observed post-disturbance shift (or lack of shift) all provide physically meaningful information crucial for managing risk. While pre- and post-disturbance shifts are typically evaluated using a stochastic framework (i.e., quantile to quantile comparison), many interpretations of this change interestingly utilize deterministic (i.e., event by event) reasoning which could lead to conceptual fallacies (e.g., Alila et al., 2009; Pham and Alila, 2024), as discussed in Section 4.3. Consistent with the stochastic framework, this paper will thus advocate for a causal, stochastic interpretation assessing how classes of events (i.e., flood quantiles) including small, medium, large, and apocalyptic events are changing.
2.2 A brief overview of tail heaviness
As this paper primarily serves as a guide to understanding and predicting extremes with particular attention to tail heaviness, a quick mathematical definition of lighter and heavier tails is first provided.
The Extreme Value Theory (EVT) commonly used throughout hydroclimatology states that distributions converge asymptotically on one of the Gumbel, Fréchet, or Weibull families in their upper limit (Coles, 2001). Within this framework, the Generalized Extreme Value (GEV) distribution is most often used for annual maximum series (AMS) data, with its cumulative distribution function (CDF) as follows:
and where
EVT is an asymptotic theory and corresponding identification of tail behaviour requires a focus on the asymptote. Although the pre-asymptote is often considered more applicable for hydrological practice (B. Merz et al., 2022), the slow rate of convergence in the Gumbel distribution for instance can produce a heavier pre-asymptotic tail while it is asymptotically within the Gumbel domain of attraction (Fisher and Tippett, 1928). Any mischaracterization of tail behaviour holds significant implications for assessment of sensitivity of extremes to disturbances and hence, understanding of system fragility, leading Taleb (2009) to emphasize the danger in utilizing asymptotic theories outside of “idealized” (i.e., asymptotic) conditions. Thus, in conjunction with existing asymptotic theories, an asymptotic focus utilizing appropriate sample sizes is key.
While shape parameters are most commonly used to identify tail behaviour, skewness is also commonly examined (Klemeš, 1978; McCuen and Smith, 2008). A skewed distribution does not necessarily suggest heavier tails, but skewness is directly linked to shape parameters in the GEV distribution for instance (B. Merz et al., 2022). Similarly, variance is incorporated within mathematical equations of skewness (Chattamvelli and Shanmugam, 2023). Thus, linkages between shape parameters, skewness, and variability suggest similarities in their underlying physical controls, though to different extents. Additionally, mean and variance can be utilized to understand change in a post-disturbance frequency curve relative to its pre-disturbance curve. While changes in mean vastly influence frequencies of extremes (Mearns et al., 1984) by shifting the frequency distribution, changes in variability can be much more influential (Katz, 1993; Katz and Brown, 1992) as they lighten or steepen the distribution tail; increased variability increases steepness (i.e., “divergence” of the two curves) and decreased variability decreases steepness (i.e., “convergence”) (Beckers et al., 2002; Green and Alila, 2012; Pham and Alila, 2024). In this way, shape parameters most directly determine tail behaviour, but variance and skewness may be additionally evoked to understand physical controls of tail behaviour.
3 Environmental controls of the flood frequency curve’s upper tail
3.1 Overview
This paper emphasizes a causal, physically based understanding of extremes, which requires consideration of natural and anthropogenic controls of frequency distributions. Establishing how natural controls yield the undisturbed state can help to infer a system’s inherent sensitivity and offer a baseline for understanding change, with subsequent quantification of anthropogenic influence allowing for prediction of risks and designing of cost-effective solutions. While the following sections focus primarily on flood frequency literature and controls of the FFC as an illustrative example, approaches and considerations presented here can be applied to other hydroclimatic variables.
Examining physical controls of the FFC and its tail behaviour requires a holistic, macroscale approach, as highlighted by Robinson and Sivapalan (1997, p. 2981):
The flood frequency curve represents one of the most comprehensive and compact descriptions of a catchment’s storm response. It is the culmination of interactions, across both time and space, between climatic inputs, that is, rainfall influxes and evaporative effluxes (radiant energy), and properties of the catchment’s landscape, for example, topography, soils, and vegetation.
Understanding and predicting flood extremes thus requires viewing interactions among climatic, physiographic, and anthropogenic controls holistically (see Figure 2), as any combination may amplify or attenuate streamflow response (Green and Alila, 2012; Johnson and Alila, 2023). Use of limited sample sizes also dominates hydrology, leading to difficulties in determining higher order moments (Klemeš, 1970) and tail behaviours (Bernardara et al., 2008; B. Merz et al., 2022). Thus, this paper uses the terms “lighter” and “heavier” to showcase the “direction of influence” of each control without a direct association with formally defined “light” and “heavy” tails, respectively. The remainder of Section 3 presents key influences of environmental controls highlighted throughout stochastic hydrology literature (see Supplementary Table S2).
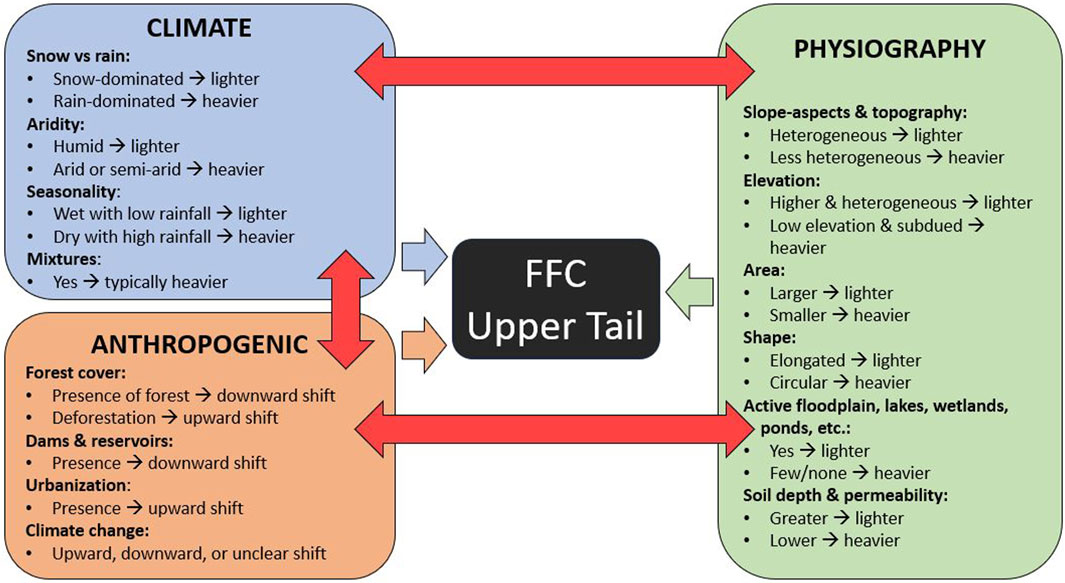
Figure 2. Conceptual drawing of climatic, physiographic, and anthropogenic controls of the upper tail of the FFC. The three groups of controls influence both each other (larger red arrows) and the upper tail (smaller arrows). For anthropogenic controls, only those with sufficient literature assessing their impacts on the FFC tail are considered.
3.2 Climatic controls of the upper tail
Snow- or glacier-dominated regions exhibit decreased variability and lighter tails relative to rain environments (R. Merz and Blöschl, 2003; 2009; Pitlick, 1994). In these regions, higher baseflow conditions suggest greater diversion of runoff from quicker surface or near-subsurface routes (which typically contribute to flood peaks) towards slower subsurface pathways (Guo et al., 2014). These slower pathways act as a filtering mechanism, attenuating variability and increasing uniformity of flood peaks throughout the year (Blöschl and Sivapalan, 1997; Guo et al., 2014; R. Merz and Blöschl, 2009). A poorly draining catchment with low baseflow conditions would instead allow multiple precipitation events to interact and amplify flood response, increasing nonlinearity and tail heaviness (Blöschl and Sivapalan, 1997; Guo et al., 2014; Robinson and Sivapalan, 1997). Additionally, limitations in daytime energy available for snowmelt constrain tail behaviour, producing lighter, upper-bounded tails in snow environments (R. Merz and Blöschl, 2003; Yu et al., 2022). In contrast, rain environments are unlikely to display upper bounds in the pre-asymptote (R. Merz and Blöschl, 2003; Yu et al., 2022). Whether this behaviour prevails in the asymptotic tail is likely watershed-size dependent and requires further investigation. Extremes can result from storms bringing strong convergence of water vapour, including high intensity (i.e., convective) or long-duration (i.e., frontal) storms (B. Merz et al., 2021; Yang et al., 2017). Higher rain fractions and convective activity increase tail heaviness for both precipitation (Araujo et al., 2023) and floods (Pitlick, 1994), thus yielding heavier FFCs even relative to areas with mixed rain and snow contributions (R. Merz and Blöschl, 2003).
In a similar fashion, arid or semi-arid regions exhibit smaller runoff coefficients, higher variability, and heavier tails than humid regions. In arid catchments, floods typically result from high-intensity storms with limited spatial extent, with their decreased regularity increasing inter-annual variability in flood generation (Farquharson et al., 1992). With some years experiencing no floods or only minor floods, occasional extremes lead to higher coefficients of variation (CV) and skewness (CS) (R. Merz and Blöschl, 2009). Runoff coefficients also tend to be small (i.e., under dry conditions), but increase significantly during extreme events (R. Merz and Blöschl, 2009). Thus, in semi-arid regions where a few storm events generate much of the annual precipitation and/or where rainfall dominates flood generation, tail heaviness is increased (Beckers et al., 2002; Pitlick, 1994). Wetter catchments see lower CVs and CSs due to greater consistency of runoff coefficients and flood-producing events (R. Merz and Blöschl, 2009). These humid and/or snow-dominated catchments and those experiencing frontal storms are likely to experience longer periods of precipitation, increased subsurface flow, and lighter FFCs (Pitlick, 1994).
Additionally, when flood seasonality is present, the largest floods occur when high rainfall intensities and runoff coefficients (i.e., from wetter catchments) coincide, or are “in phase” (Sivapalan et al., 2005). When wetter seasons coincide with lower rainfall intensities, a lighter tail is produced (Sivapalan et al., 2005). Drier seasons coinciding with higher rainfall intensities would instead produce fewer small floods but with occasional larger events, increasing tail heaviness (Sivapalan et al., 2005).
Any differences in flood generation mechanisms can produce a break in the FFC separating upper tail extremes from common events (Alila and Mtiraoui, 2002) through an inflection point (i.e., a change in slope) (Miniussi et al., 2023) or a sudden step change (Rogger et al., 2012). Breaks can be associated with a shift from subsurface to fast surface runoff or an increase in contributing area (see Section 3.3) (Rogger et al., 2012), differences in storm types (e.g., synoptic to larger cyclonic storms) (Kusumastuti et al., 2007), and/or influences of natural variability (e.g., El Niño-Southern Oscillation conditions and monsoonal events) (Alila and Mtiraoui, 2002). While breaks in the FFC are typically linked to heavier tails (Kusumastuti et al., 2007; Macdonald et al., 2024), use of homogeneous distributions common to FFA (i.e., those assuming events are all identically distributed and consist of only one population or flood generation mechanism) under two or more flood populations may yield a poor fit at the upper tail, particularly under extreme outliers (Alila and Mtiraoui, 2002). Use of mixed distributions can improve characterization of upper tails under heterogeneities, underscoring the need for large sample sizes and knowledge of flood generating processes (Alila and Mtiraoui, 2002).
Finally, both climatic and physiographic variables influence the FFC, but climatic controls conveniently dominate at sufficiently high return periods. The GRADEX (GRADient of EXtreme values) concept assumes that flood volumes mimic the exponential tail of rainfall volumes after exceedance of watershed storage capacity (Naghettini et al., 2012). The FFC is shifted down relative to the rainfall curve such that flood volumes are consistently lower than rainfall volumes for the same return period (Naghettini et al., 2012). Other studies also suggest that flood skewness or tail behaviour more closely echo rainfall skew (McCuen and Smith, 2008) or tail behaviour (Macdonald et al., 2024) (respectively) after catchment saturation, with higher saturation thresholds indicating larger ratios of watershed storage to catchment wetness (Macdonald et al., 2024). Therefore, while both physiography and runoff generation modulate the FFC, exceedance of storage thresholds leads to a dominance of climatic influences on the most extreme floods (Macdonald et al., 2024), hence imposing the asymptotic behaviour of upper tails.
3.3 Physiographic controls of the upper tail
Catchment physiography strongly modulates flood response to meteorological controls through its topography (i.e., slope, aspect, and elevation distributions), catchment shape and size, soil and bedrock characteristics, floodplain storage, and presence of lakes, ponds, wetlands, etc. (see Supplementary Table S2). These physiographic characteristics shape the FFC’s upper tail primarily through their influence on watershed storage. Many controls such as subsurface characteristics and lakes, ponds, wetlands, floodplains, etc. directly influence the availability of above- (i.e., as a snowpack) and below-ground storage of snow, snowmelt, and rainwater. Others such as heterogeneity in elevation, slope, and aspect influence the relative timing and efficiency with which stored precipitation is delivered as runoff to the channel network (i.e., synchronization or desynchronization of runoff), influencing variability and tail heaviness.
Increased storage capacity decreases variability and delays occurrence of “kinks” or “step changes” (i.e., breaks) in the FFC to larger return periods (Macdonald et al., 2024; Rogger et al., 2012). Step changes can occur when catchment storage thresholds are exceeded, generating faster surface runoff through saturation excess (Rogger et al., 2012). Storage capacity can be increased through deeper soils and permeable geology, both of which promote infiltration, increase baseflow, and support deeper flowpaths (Chen et al., 2021; Kusumastuti et al., 2007). Additionally, when lakes, wetlands, ponds, etc. are present, their retention capacity must be filled (Blöschl and Sivapalan, 1997) before water can be “spilled” to other down-gradient storages and conveyed to streams (i.e., the “fill-and-spill” mechanism) (McDonnell et al., 2021). This reduces quick flow and variability (Johnson and Alila, 2023) and can drive skewness towards negative values (Klemeš, 1970; McCuen and Smith, 2008). Even catchments containing wide, active floodplains can yield lighter tails (Archer, 1981); for floods above bankfull stage, overbank storage of floodwaters can produce lighter tails relative to floodwaters contained within the channel (Archer, 1981). Thus, increasing catchment storage capacity and its spatial heterogeneity can yield lighter tails and step changes which are less prominent or occur only at the highest return periods (Rogger et al., 2012). When storage capacity is low and spatially uniform, threshold exceedances can yield notable step changes at earlier return periods (Rogger et al., 2012), heavier tails (Macdonald et al., 2024), and a greater influence of climatic controls (Macdonald et al., 2024).
Additionally, nonlinear expansion of runoff generating areas increases synchronous delivery of flow to the drainage network. Areas generating runoff are typically small for common floods, but larger floods involve simultaneous activation of large contributing areas, leading to changes in runoff generating mechanisms (e.g., from saturation excess to infiltration excess) (Sivapalan et al., 1990) and/or nonlinearity in runoff generation (Rogger et al., 2012). Resulting synchronous delivery of runoff can yield step changes in the FFC (Rogger et al., 2012). However, in a British study, a similar nonlinear growth was noted only in dry catchments (Archer, 1981). Increased soil moisture conditions in wetter upland catchments led to an initial increase in steepness (Archer, 1981). When the contributing area consisted of most or nearly all of the catchment, flood tails mainly depended on rainfall growth rates, leading to step changes with lighter tails (Archer, 1981). Together, these studies demonstrate that the dynamic nature of runoff contributing areas and stream networks (Prancevic and Kirchner, 2019) may yield nonlinearities which influence tail behaviour.
Tail behaviours are also controlled by catchment area. Smaller catchments are more likely to experience greater storm coverage and catchment saturation (R. Merz and Blöschl, 2009; Sivapalan et al., 1990; Yang et al., 2017). High-intensity, short-duration storms with limited spatial extent (e.g., convective storms) typically form their upper tails (R. Merz and Blöschl, 2009; Yang et al., 2017). Increased spatial uniformity in storage capacity is also likely, promoting simultaneous activation of larger source areas and notable step changes (Rogger et al., 2012). In larger catchments, long-duration storms with greater spatial extent are required to first fill up retention capacity before flood generation can occur (Blöschl and Sivapalan, 1997; R. Merz and Blöschl, 2009; Yang et al., 2017). Their heterogeneous storage capacity is also likely to prevent synchronized saturation over large areas, yielding less notable step changes (Rogger et al., 2012). Increased importance of flood routing and baseflow conditions further attenuate the catchment’s response to rainfall variability (Blöschl and Sivapalan, 1997; H. J. Wang et al., 2023), especially with asynchronous delivery of flow (Beckers et al., 2002). These differences suggest tendencies towards lighter tails and lower skew and variability in larger catchments (Yang et al., 2019). While some studies did not find a dependence of tail behaviour on catchment area (Smith et al., 2018), other climatic and physiographic factors varying with catchment size (Benson, 1962) may obscure this relationship, underscoring the need for a holistic evaluation of controls and their interactions.
Other controls such as heterogeneity in elevations and slope-aspects influence energy, storage, and efficiency at which stored precipitation is delivered to the stream network. Topographical heterogeneities influence patterns of radiation input (i.e., higher on south-facing slopes in the northern hemisphere), soil moisture (i.e., higher on north-facing or shaded slopes in the northern hemisphere), and snowpack accumulation, determining above- and below-ground storage in both rain and snow environments (Duncan, 1995; Liu et al., 2024; Moreno et al., 2016). These heterogeneities also influence synchronization or desynchronization of runoff (Hendrick et al., 1971), and thus of variability and tail heaviness. North-facing aspects (in the northern hemisphere) experience increased natural shading, limited shortwave irradiance, and limited evaporation rates relative to south-facing aspects, inducing differences in snowmelt timing (in snow environments) and runoff generation (in rain and snow environments) (Duncan, 1995; Ellis et al., 2011; Green and Alila, 2012; Moreno et al., 2016). Increased aspect heterogeneity may thus promote asynchronous, “time-staggered” snowmelt and floods while minimal heterogeneity may promote synchronized melt and floods (Green and Alila, 2012; Hendrick et al., 1971). Similarly, gradual snowmelt from lower to higher elevations can desynchronize runoff while subdued terrain synchronizes melt, increasing variability and tail heaviness (Green and Alila, 2012; Hendrick et al., 1971; Johnson and Alila, 2023). While more research is required (particularly in rain environments), low elevation and/or less heterogeneous catchments may experience heavier tails due to increased rainfall contributions or synchronized runoff. Conversely, high elevation and/or heterogenous catchments may display lighter tails due to a greater influence of snowmelt or asynchronous runoff.
Similarly, synchronization of runoff can increase variability and tail heaviness in circular catchments while elongated catchments desynchronize runoff (Ayalew and Krajewski, 2017). Even though H. J. Wang et al. (2023) found that flood tail heaviness increased most readily with spatial rainfall variability for elongated catchments, these catchments displayed greater symmetry in runoff routing distances, ultimately synchronizing flows. In circular and less elongated catchments, asymmetric routing led to asynchronous delivery of flow and increased buffer capacity, preventing increases in tail heaviness (H. J. Wang et al., 2023). Therefore, these studies all underscore the role of catchment shape in synchronizing or desynchronizing runoff.
Together, these watershed characteristics combine with climatic controls to influence tail behaviour. For example, integrating climatic and physiographic attributes into a single index led to catchments with “erratic regimes” (i.e., a lower ratio of flood-producing rainfall events to mean watershed recession rate) displaying increased variability, step changes, and steeper FFCs, contrasting “persistent regimes” with decreased variability and lighter tails (Basso et al., 2016). In this way, a holistic, physical understanding of tail behaviour requires assessing interactions among climatic and physiographic controls, with emphasis on climatic controls for the largest floods in catchments with little storage capacity. Incorporating this physical knowledge supports a defensible, stochastic interpretation of the upper tail, relates environmental characteristics to a system’s sensitivity or response to disturbances, and aids in the design of nature-based solutions.
4 Discussion
4.1 Overview
While Section 3 addressed climatic and physiographic controls of the natural FFC tail, Section 4 examines implications of tail behaviour under anthropogenic change. Section 4.2 examines how lighter or heavier tails reflect a watershed’s inherent sensitivity to anthropogenic change, after which Section 4.3 outlines how anthropogenic controls alter the FFC. Finally, Section 4.4 presents methods for improved modelling of the upper tail, re-examines hydrology’s current understanding of tail behaviour, and provides implications for a frequency-centric approach for strong flood management.
4.2 Implications of tail behaviour: magnitude-centric or frequency-centric?
Perhaps the most critical implication of tail behaviour is its sensitivity to disturbance, which shapes how society perceives, adapts to, and mitigates risk. A well-established concept in climate change science, a small increase in magnitude yields a larger, disproportionate increase in frequency, especially for extremes (Allen and Ingram, 2002; Mearns et al., 1984). Changes in frequency can therefore be much more impactful than changes in magnitude and the former are often the foundation of attribution science (Lloyd and Shepherd, 2020) (see Supplementary Table S1). While concepts of lighter tails suffering from environmental variability (i.e., fragility) and heavier tails benefitting from environmental variability (i.e., antifragility, or the opposite of fragility) originate in finance literature (Taleb, 2012; Taleb and Douady, 2013), their application to hydroclimatology suggests that hypersensitive lighter tails may experience larger changes in event frequencies under nonstationarity (Fischer et al., 2023) (see Figure 1). Hence, a magnitude-centric approach and improper use of heavier tails for lighter-tailed distributions can underestimate change and diminish the perceived efficacy of NBS for managing flood risk, especially for extremes.
Yet much of hydrological reasoning remains magnitude-centric and stationary, particularly when evaluating tail behaviour. These studies (e.g., B. Merz et al., 2022) often compare the sharp rise in magnitude of heavier tails (per rise in return period) to the slower increase in magnitude of lighter tails, utilizing a stationary framework rather than assessing change between pre- and post-disturbance curves under nonstationarity (see Figure 1). As high-magnitude events seemingly correspond to lower return periods, extremes are said to be more likely, arise unexpectedly, and be more difficult to predict under heavier tails (B. Merz et al., 2022; H. J. Wang et al., 2023). However, given known nonstationarities and large frequency changes, it is worth re-thinking whether a magnitude-centric, stationary quantification of risk suffices in the 21st Century. Could a frequency-centred, nonstationary analysis better highlight sensitivity to change and support resilient adaptation?
A similar debate concerns NBS. While initial installation may be costly (Chan et al., 2018), NBS are generally deemed cost-effective (Vicarelli et al., 2024) and can yield high annual savings in flood loss prevention (Atkins, 2015), bolstering the global push for NBS (Faivre et al., 2017; Leanza, 2022). However, NBS are also accompanied by magnitude-centric skepticism regarding their effectiveness against large floods (i.e., when flood magnitudes exceed watershed storage capacity) (Dadson et al., 2017; Kay et al., 2019; Kiesel et al., 2023; Lallemant et al., 2021). Yet, NBS continues to gain traction worldwide; China has pioneered the “Sponge City Program” (Chan et al., 2018) while Europe’s NBS-friendly policies and initiatives, particularly in the Netherlands and Denmark, have led to afforestation, stripping of pavement, and installations such as “sponge parks” and retention basins (Faivre et al., 2017; Jongman, 2018; Leanza, 2022). While the efficacy of NBS for mitigating smaller floods is well-acknowledged (Kay et al., 2019; Lallemant et al., 2021), the key question remains: are they truly inadequate for preventing large floods or have deterministic event-by-event reasoning prevented society from benefitting from the value of NBS for mitigating against large events?
While concerns surrounding reliable quantification of risks and cost-effective adaptation strategies remain unsolved and require further research, particularly on the efficacy of NBS for flood extremes, existing literature on anthropogenic controls of the FFC may offer a starting point.
4.3 Anthropogenic controls of the flood frequency curve’s upper tail
Many studies assessing anthropogenic impacts focus on climate change, forest cover changes, urbanization, and dam or reservoir construction, with conventional wisdom leading many to suggest decreasing influences of such activities on the largest floods (Barnes et al., 2023; Brath et al., 2006; Maheshwari et al., 1995). In fact, the human and scientific tendency for deterministic event-by-event reasoning suggests that when flood magnitudes exhaust available storage capacity, forest cover and dams/reservoirs have no influence on floods (e.g., Dadson et al., 2017; Maheshwari et al., 1995). Similarly, urbanization (or even the role of catchment moisture in urbanized landscapes) is typically perceived to have little influence on the largest floods (Bian et al., 2020; Brath et al., 2006; Hettiarachchi et al., 2019).
However, the stochastic framework assesses differences between pre-disturbance (i.e., with little or no anthropogenic influence) and post-disturbance (i.e., under anthropogenic change) curves, allowing for detection and attribution of changing risk (Gillett et al., 2022; Johnson and Alila, 2023; Prosdocimi et al., 2015). The corresponding stochastic interpretation emphasized by this subsection instead highlights how climatic and LULC changes alter flood magnitudes and (most notably) frequencies using flood quantiles.
Forests intercept both rainfall and snowfall, enhancing interception moisture loss and decreasing snow accumulation underneath the canopy, in addition to drawing up soil moisture through their roots (Alila et al., 2009; Duncan, 1995). By reducing moisture available for runoff (equivalent to increasing available watershed storage) and decreasing flood peaks (Alila et al., 2009; Duncan, 1995), the forested FFC is typically shifted “down” relative to one without forest cover (or shifted “up” under deforestation) (Duncan, 1995; McEachran et al., 2021; Reynard et al., 2001; Te Linde et al., 2010), with this effect, as explained earlier, exacerbated or reduced depending on physiographical characteristics. For example, deforestation in watersheds with little environmental (e.g., aspect and elevational) heterogeneity can amplify changes in net radiation and stored precipitation, thus synchronizing snowmelt and runoff, increasing variability, and leading to divergence of the two FFCs (see Section 2.2) (Green and Alila, 2012; Pham and Alila, 2024). Overall, a consistent upward (downward) shift under deforestation (forest cover), even at the upper tail, suggests increased (decreased) magnitudes and frequencies in both rain and snow environments (Duncan, 1995; Johnson and Alila, 2023). In fact, lack of a clear threshold event size beyond which forest cover has no influence on floods supports the hypothesis that effects of forest cover (or deforestation) remain notable for extreme events (Birkinshaw et al., 2011; Duncan, 1995; Green and Alila, 2012; Reynard et al., 2001; Te Linde et al., 2010), though more research is needed utilizing a stochastic framework. Even though large floods may still occur with and without forest cover, forest cover significantly decreases flood frequencies as a whole (Barnes et al., 2023). Thus, contrary to perceptions that NBS involving afforestation or reforestation are ineffective for the largest floods (Dadson et al., 2017), a stochastic interpretation suggests that forest cover interacts with physiography and climate to greatly influence flood frequencies and magnitudes, even of the most extreme events.
Presence of dams and reservoirs increases catchment storage capacity and attenuation of flows, delaying catchment saturation to higher return periods. After exceedance of storage capacity, the reservoir-containing tail resembles the no-reservoir tail but shifted “downwards” such that the two tails are parallel (Ayalew et al., 2015; Fleischmann et al., 2019; Xiong et al., 2020). Their vertical difference represents water storage within reservoirs (Fleischmann et al., 2019). Even though individual flood magnitudes may exceed storage capacity (Xiong et al., 2019), added capacity through dams and reservoirs stores more runoff, decreasing overall frequencies and magnitudes as evidenced by upper tail “parallelism” (Fleischmann et al., 2019). Thus, contrary to common perceptions (Maheshwari et al., 1995), dams, reservoirs, and similar NBS can shift the FFC tail “downwards”, decreasing flood frequencies and magnitudes for both common and extreme events.
Urbanization increases impervious cover of the watershed, decreases infiltration of precipitation into the subsurface, and promotes fast runoff, shifting the FFC “upwards” relative to its pre- (or reduced-) urbanization curve (Brath et al., 2006; Prosdocimi et al., 2015; Reynard et al., 2001). Shifting of the FFC, generally without convergence of the two tails, increases flood magnitudes and frequencies across all return periods (Brath et al., 2006).
Finally, climate change induced shifts in the FFC depend highly on region-specific climatic trends. Many have highlighted increased flood risk (Gillett et al., 2022) through an “upward” shift of the FFC, with large changes in frequency (Ross et al., 2021; Schaller et al., 2016). This is often linked to a higher water-holding capacity of a warmer atmosphere and precipitation increases (Schaller et al., 2016) surpassing any increase in evapotranspiration (Ross et al., 2021), increasing overall flood risk. Other regions, however, may see decreased flood risk (i.e., FFC shifted “down”) (Dhasmana et al., 2023) or unclear trends. In some areas, opposing influences of greenhouse gases and sulfate aerosols on precipitation extremes have led to unclear trends, but future reductions in sulfate aerosols are expected to increase flood frequencies and magnitudes (Philip et al., 2019). Similarly, snow-influenced regions may see increased rainfall levels counterbalanced by decreased snowpack accumulation and spring snow cover, leading to little (or unclear) change between the two FFCs (Teufel et al., 2019). Together, these studies underscore the importance of considering local and regional climatic trends when assessing flood risk.
Overall, urbanization, deforestation, and climate change can increase flood risk (or potentially decrease risk depending on climatic trends) while forest cover and added storage capacity decrease risk through a “downward” shift in the tail. Akin to GRADEX, this vertical difference reflects added storage capacity through dams or reservoirs or loss of moisture under the forest canopy, both of which allow for greater storage of precipitation and attenuation of floods. Perhaps similar NBS can shift the tail “down”, helping decrease flood risk (i.e., frequencies and magnitudes) under otherwise-increasing risks by climate change, urbanization, etc. (Hettiarachchi et al., 2019; Te Linde et al., 2010), presenting promising future research directions. If extremes exist such that NBS have negligible influence on floods, only a stochastic approach to both modelling and interpretation can provide a defensible answer.
4.4 Where do we go from here?
4.4.1 Guiding science and professional practice
Knowledge of tail behaviour is typically generated using limited, pre-asymptotic record lengths under a stationary framework, hindering proper understanding of controls of floods and reliable prediction of associated risks, which increases the likelihood of upper tail mischaracterization. Although several distributions may appear to fit data well under limited record lengths, large differences in their tail behaviours greatly impact prediction of extremes (Alila and Mtiraoui, 2002; Klemeš, 1986). Even one or a few extremes plotting above (or below) the curve fitting the body of the sample unduly affects tail characteristics (i.e., heavier versus lighter), particularly under pre-asymptotic conditions (Bernardara et al., 2008; R. Merz and Blöschl, 2009). While these problems are well recognized, use of sample sizes generally under 50 years persist in hydrology (Hu et al., 2020), likely stemming from the lack of appropriate record lengths available. Given the urgent need for reliable prediction of large floods for flood management, scientific and professional practice must aim for a rigorous, asymptotic characterization of the upper tail.
Limited sample sizes can be extended using stochastic or deterministic simulations, supplementing observational records. By mimicking statistical characteristics of observations, stochastic simulations produce longer time series and generate larger numbers of extremes for study (Brunner et al., 2021). Similarly, despite vulnerability to many data-related, structural, and parameter uncertainties (Renard et al., 2010), deterministic models can utilize climatic and streamflow inputs to simulate longer time series (Brunner et al., 2021; Stott et al., 2016), complementing observed records. For instance, the inability of climate models to resolve processes finer than their grid resolution increases uncertainty (Palmer and Williams, 2008), prompting calls for integration of models, observational records, and physical understanding (Stott et al., 2016; Xie et al., 2015). Similarly, perhaps the real need in hydrological sciences is not necessarily that of more data (Nearing et al., 2021) but rather incorporation of hydrological reasoning (Dawdy et al., 2012; R. Merz and Blöschl, 2008) using the correct causal (stochastic) framework, especially for modelling asymptotic upper tails. For instance, extending the GRADEX logic, a decrease in available storage capacity (such as through forest removal) may lead to an earlier return period at which this capacity is exceeded. This means that the flood tail mimics that of rainfall at an earlier return period (i.e., is shifted “upward”) than the tail associated with greater storage capacity, with the vertical difference between the tails representing the difference in storage. In this way, concepts such as GRADEX (where “hydrological reasoning is part of a formal method” (R. Merz and Blöschl, 2008, p. 10)) can be used in opportunistic ways to allow for physically based modelling and making of attribution statements, especially under limited record lengths.
In hydrology, other methods can also be used to supplement records, identify trends, and generate FFCs. Derived FFCs simulate streamflow using a statistical rainfall model, a deterministic rainfall-runoff model, and a mathematical model depicting the transformation of rainfall to peak flows (e.g., Kusumastuti et al., 2007; Sivapalan et al., 2005). For ungaged watersheds and those with insufficient record lengths, gauges at nearby watersheds can be used to increase effective record length through regional FFA (e.g., Schaefer, 1990). Another approach consists of a meta-analysis of available streamflow records to identify trends due to anthropogenic disturbances (e.g., Singh and Basu, 2022). Moreover, paleoflood hydrology uses geological evidence to estimate magnitudes and frequencies of past floods while historical flood hydrology considers observations before systematic records began (e.g., Benito and O’Connor, 2013; Blöschl et al., 2020). As both are associated with large uncertainties, they are typically combined to increase reliability and help constrain upper tails (Benito and O’Connor, 2013; Blöschl et al., 2020).
Additionally, while FFA traditionally used in science and professional practice assumes stationarity, recognition that past trends are no longer representative of the future (B. Merz et al., 2021; Milly et al., 2008) has led to nonstationary analyses and attribution science methods gaining momentum (McEachran et al., 2021). Despite increased uncertainties (e.g., Lu et al., 2020), nonstationary FFA can incorporate climatic and land use-related covariates, allowing for detection of relevant drivers and improved modelling of observed time series (e.g., Chen et al., 2021; Xiong et al., 2020). While the shape parameter is often assumed constant due to difficulties and high uncertainties at the tail (Salas and Obeysekera, 2014), more rigour in modelling can allow for a proper understanding of how anthropogenic controls alter the FFC and flood risk (e.g., Hani et al., 2025; Ouarda and Charron, 2019). Furthermore, current use of nonstationary methods focus on trend detection with attribution “treated as an appendix to detection studies” and supported mainly through qualitative reasoning (B. Merz et al., 2012, p. 1382). Instead, nonstationary frequency analysis can be used throughout scientific and professional practice to make more robust attribution statements which quantify cause and effect relationships (e.g., Johnson and Alila, 2023; Prosdocimi et al., 2015).
Furthermore, as conventional FFA assumes a homogeneous population of floods, forcing such assumptions onto records containing multiple populations increases potential for mischaracterization of upper tails, thus mixed distributions may be more suitable alternatives (e.g., Alila and Mtiraoui, 2002; Yu et al., 2022). Additionally, with climate and LULC changes exerting a greater influence on current and recent past events relative to those in the distant past, could this present another source of mixture in the FFC, increasing likelihood of tail mischaracterization? This possibility may warrant careful investigation in both scientific and professional practice. While we are unaware of any hydrologist disputing the fact that the past no longer represents current and future conditions, fitting a stationary, homogeneous FFC to the flood record conflates extremes of the distant past with those of the recent past, highlighting a large discrepancy between established knowledge and scientific practice.
By addressing the above challenges, hydroclimatological sciences and professional practice can obtain a deeper understanding of upper tails and produce more reliable projections under changing conditions.
4.4.2 Re-examining current understanding of tail behaviour
Flood frequency literature has predominantly yielded heavier tails (B. Merz et al., 2022), although some have long called for a closer examination of the assumption of such heavy tailed behaviour (Smith, 1987). This assumption emanates from a body of literature in which limited sample sizes are available and stationary approaches are used to fit statistical distributions. When extreme events occur within a short observational period (B. Merz et al., 2022), heavier tails may, at least in part, reflect artifacts of short sample sizes and stationary approaches. With nonstationarity leading to once-rare extremes now becoming much more probable and heavier tails influenced largely by one or a few extremes under short observational periods, are the heavier tails observed, in fact, truly heavy or are once-rare extremes from lighter-tailed distributions now becoming the norm?
The “antifragile” nature of commonly assumed heavy tails (Taleb, 2012; Taleb and Douady, 2013) in floods appears seemingly at odds with large observed increases in frequencies under anthropogenic change (see Supplementary Table S1). For example, watersheds in many regions around BC (Loukas et al., 2000; Waylen and Woo, 1983) are considered to have lighter tails, especially in snow-dominated and wetter regions compared to arid areas (Beckers et al., 2002) or areas with greater rainfall influence (Zaerpour et al., 2024). BC’s landscape also encompasses large mountainous regions (i.e., potentially indicating greater environmental heterogeneity, supporting gradual snowmelt) and forest cover under undisturbed conditions, and much of the province is influenced by frontal storms (Pike and Robin, 2010). These characteristics may additionally favour lighter tailed FFCs and decrease flood magnitudes and frequencies (i.e., the FFC with forest cover may be shifted “downward” compared to one with less forest cover). In the recent past, BC has seen large changes in extreme event frequencies under anthropogenic activities, such as 7-fold (Kuraś et al., 2012) or 10-fold increases (Johnson and Alila, 2023) following forest harvesting or 2- to 4-fold increases under climate change (Gillett et al., 2022) in the 100-year event. These large frequency changes which accompany even small changes in magnitude (Allen and Ingram, 2002) have been noted to be significant under lighter tails in hydrology (Johnson and Alila, 2023) and especially climatology (Fischer et al., 2023; Van Oldenborgh et al., 2022), in line with the known “fragility” of lighter tails elsewhere (Taleb, 2012; Taleb and Douady, 2013). Could the large increases in flood frequencies under anthropogenic change thus hint at an underlying sensitivity of natural systems to change?
As much of hydrological research has been dominated by limited sample sizes and stationary frameworks, obtaining a proper answer requires further investigation using nonstationary, asymptotic approaches. In the absence of stochastic reasoning, however, neither a reliance on statistical theory nor a sole focus on fitting distributions can robustly support or refute such hypotheses due to challenges with record lengths and nonstationarity. Causal, stochastic physics must be incorporated to overcome these challenges for more reliable, physically based modelling. While using heavier-tailed distributions to prevent underestimation of maxima may seem appealing (Moccia et al., 2021), it impedes obtaining a reliable understanding of the upper tail and, hence, its risks under change. A stationary, magnitude-centric approach misses potentially large increases in frequency, as lighter tails can yield alarming reductions in return periods under nonstationarity. Therefore, a reliable quantification of upper tails rooted in causal, stochastic understanding is key for flood prediction and management.
4.4.3 Implications for risk assessments, planning, and decision-making
Decision-making, policy implementation, and land use and management planning must be preceded by assessments of how projected or proposed anthropogenic activities will alter hydroclimatic risks. These assessments should aim to predict the combined influences of all relevant anthropogenic drivers (James et al., 2019) which may exert an influence on the extreme(s) of interest over the relevant spatiotemporal scales. For example, for floods, projections should aim to identify the combined effects of climate change and LULC changes such as forest harvesting, land conversion, and urbanization. Effects on both magnitudes and frequencies should be examined, as well as any other important attributes such as duration and inundated area (Guido et al., 2023; Poff et al., 1997). While much of the discourse regarding extreme event attribution currently focuses on climate change (see Supplementary Table S1), a sole focus on climate change may misrepresent change, fail to identify other key drivers, and divert attention away from LULC practices which could help mitigate these risks (Lahsen and Ribot, 2022). To account for simultaneous climatic and LULC changes, models can be used to simulate different scenarios (Reynard et al., 2001) and techniques such as nonstationary FFA can be used on both observations and modelled data for flood projection (Johnson and Alila, 2023). Similarly, other hazards such as wildfire have been shown to influence FFCs (Yu et al., 2023) while droughts are acknowledged to attenuate or exacerbate floods (Barendrecht et al., 2024), although catchment-scale studies of drought-to-flood or flood-to-drought compound events are few. As extremes continue to intensify and become more frequent, linkages between floods and other hydroclimatic extremes and how these linkages alter frequency distributions may be highly relevant for robustly understanding and predicting extremes. Quantifying extreme event magnitudes and frequencies should be based on causal stochastic reasoning, along with the use of appropriate sample sizes and consideration of nonstationarity. This reasoning supports quantitative estimates by allowing for more reliable projections given a catchment’s climatic and physiographic properties, especially where record lengths are limited.
An example where addressing the multiple root causes of flooding may show promise for stronger flood management is BC. Flood management in BC has traditionally relied upon engineering-based solutions which appear ill-suited to the realities of the 21st century. For example, a dike assessment in its Lower Mainland region (which contains the largest population in the province) considered 69% of dikes Poor to Fair and only 13% as Fair to Good, although none fully met the province’s standards due to increasing flood risks since dike reconstruction (Northwest Hydraulic Consultants Ltd., 2015). This highlights both serious shortcomings in the current engineering-based approach and an opportunity to implement longer-term solutions addressing root causes of increasing flood risk. Climate change typically receives the spotlight in influential technical (BGC Engineering Inc., 2022; Fraser Basin Council, 2016) and governmental (Government of British Columbia, 2024) reports with less attention to other LULC causes of flooding, despite documented causal linkages of the latter and often substantial impacts (e.g., Green and Alila, 2012; Johnson and Alila, 2023). A shift towards stronger LULC management which targets underlying drivers of flood risk increases could thus present a more resilient path forward.
In any assessments of change or proposed flood management strategies, how changing magnitudes and frequencies for small, medium, and large events will impact key values should then be considered holistically. Magnitudes may be important in legal contexts to estimate the fraction of losses attributable to defendants (Callahan and Mankin, 2025) or in engineering and construction purposes (Flint et al., 2017; Hudson, 2021) where design flood magnitudes may be updated accordingly through nonstationary approaches. However, frequency changes may be more compelling from other impacts perspectives. In engineering applications, flood infrastructure should account not just for increased magnitudes and frequencies of extremes, but also the geomorphic consequences of small and medium flows increasing in frequency, such as increased scour and aggradation (Wardhana and Hadipriono, 2003; Wolman and Miller, 1960). A changed hydrological regime from sustained increases in small and medium flows may also change river geomorphology and its associated habitats (Poff et al., 1997; Wolman and Miller, 1960). This can make conditions less suitable for both aquatic and riparian species which are dependent on a river’s natural flow regime (Bower et al., 2022; Poff et al., 1997), highlighting the need to identify and support vulnerable species. Assessments of changing magnitudes and frequencies further provide a starting point for identifying vulnerability and exposure (James et al., 2019; Young et al., 2019), such as upland harvesting leading to larger inundated areas downstream. With even small increases in magnitude, large changes in flood frequencies which were once highly unlikely may be especially impactful for property owners. Frequency can also be more impactful for communicating change, especially through attribution-style statements (Brunner et al., 2021); while smaller increases in m3/s of floods may be challenging to conceptualize, communicating larger increases in frequency through a change in return periods or x-fold increases may be easier to understand and more meaningful to the public (Swain et al., 2020). Furthermore, the use of probabilistic information rather than a “best fit” deterministic estimate can account for stochasticity and support resiliency under uncertainty in planning and decision-making. Above all, probability-based attribution can support professional practice, policy design, or even litigation (e.g., Callahan and Mankin, 2025), as society requires not only prediction but causal explanations of why extremes occur (Pearl and Mackenzie, 2018).
For resource management, lighter-tailed watersheds may indicate the need for careful resource extraction and a greater need for mitigation of downstream flood risks. This can motivate stronger LULC policies which decrease vulnerability and exposure downstream, such as preventing new development in projected high-risk areas. Resource extraction or harvesting activities can be conducted in ways that desynchronize floods (e.g., sizes and locations of harvested areas supporting gradual, staggered snowmelt to mitigate increases in large floods) and leave key areas intact for flood control (e.g., landscapes which act as natural flood buffers). Downstream interventions such as retention basins can also increase storage capacity and mitigate flood risk (Chan et al., 2018; Leanza, 2022). Although floods may occur with or without forests (Barnes et al., 2023) or other management interventions, stochastic reasoning suggests that even a small reduction in flood magnitude may greatly reduce the frequency of a flood extreme (e.g., 20-year to 70-year event), which may constitute a meaningful decrease in flood risk for communities and the public. In this way, a robust characterization of extremes grounded in causal, stochastic physics provides a solid foundation for understanding change and is key for flood management in the 21st Century.
5 Conclusion
Around the world, hydroclimatic extremes have led to deaths, displacements, substantial damage to cities, and disruption of critical sectors such as agriculture and transportation, amounting to billions of US dollars in damages. Due to anthropogenic activity, such events that were once highly rare (or almost impossible) are now increasingly probable, with current trends expected to continue or accelerate. This fact presents an urgent need to protect communities from both current and future change, which fundamentally depends on a sound understanding and hence defensible prediction of risks. The stochastic nature of hydroclimatic extremes has led to widespread adoption of probability-based frameworks, yet the scientific tendency to reduce and isolate has largely maintained deterministic interpretations. This tendency is perhaps further amplified by human nature, which gravitates towards a deterministic, event-by-event characterization instead of addressing the stochastic, spatiotemporal whole. Moreover, despite widespread recognition that the past no longer represents the present, stochastic hydrology reflects a body of literature dominated by stationary, pre-asymptotic frameworks and little integration of physical knowledge into FFA. Failure to incorporate widely accepted, integral facets of reality into academic and professional practice serves to maintain the disconnect between scientific understanding and real-world application and a perpetual rift between public and science perceptions, compromising adaptation and mitigation efforts. While uncertainties persist in estimating (asymptotic) upper tails, they must not deter hydroclimatology from the pursuit of rigorous methods addressing issues of sample size and nonstationarity, especially given severe consequences for human life and socioeconomic damages. In fact, challenges regarding uncertainties should be best overcome with a causal, stochastic physics approach which provides a deeper understanding of physical controls and incorporates them into FFA for defensible risk prediction. A stochastic and frequency-centric interpretation can identify large changes in risk following anthropogenic interventions or implementation of NBS, far surpassing those deduced through a magnitude-centric approach. With a causal, physically meaningful understanding of upper tails, hydroclimatology can motivate transformational policies, inform the design of innovative and cost-effective solutions, and foster resilience in both natural and human systems in the Anthropocene.
Author contributions
SK: Conceptualization, Writing – review and editing, Writing – original draft. YA: Conceptualization, Supervision, Writing – review and editing.
Funding
The author(s) declare that financial support was received for the research and/or publication of this article. This work was supported by the Natural Sciences and Engineering Research Council of Canada.
Acknowledgments
We thank Cindy Prescott and Bianca Eskelson for their insightful discussions and suggestions. We also thank the feedback of the peer reviewers whose comments greatly helped improve the manuscript.
Conflict of interest
The authors declare that the research was conducted in the absence of any commercial or financial relationships that could be construed as a potential conflict of interest.
Generative AI statement
The author(s) declare that no Generative AI was used in the creation of this manuscript.
Any alternative text (alt text) provided alongside figures in this article has been generated by Frontiers with the support of artificial intelligence and reasonable efforts have been made to ensure accuracy, including review by the authors wherever possible. If you identify any issues, please contact us.
Publisher’s note
All claims expressed in this article are solely those of the authors and do not necessarily represent those of their affiliated organizations, or those of the publisher, the editors and the reviewers. Any product that may be evaluated in this article, or claim that may be made by its manufacturer, is not guaranteed or endorsed by the publisher.
Supplementary material
The Supplementary Material for this article can be found online at: https://www.frontiersin.org/articles/10.3389/fenvs.2025.1643416/full#supplementary-material
References
Alila, Y., and Mtiraoui, A. (2002). Implications of heterogeneous flood-frequency distributions on traditional stream-discharge prediction techniques. Hydrol. Process. 16 (5), 1065–1084. doi:10.1002/hyp.346
Alila, Y., Kuraś, P. K., Schnorbus, M., and Hudson, R. (2009). Forests and floods: a new paradigm sheds light on age-old controversies. Water Resour. Res. 45 (8). doi:10.1029/2008WR007207
Allen, M. R., and Ingram, W. J. (2002). Constraints on future changes in climate and the hydrologic cycle. Nature 419 (Issue 6903), 224–232. doi:10.1038/nature01092
Araujo, D. S. A., Marra, F., Ali, H., Fowler, H. J., and Nikolopoulos, E. I. (2023). Relation between storm characteristics and extreme precipitation statistics over CONUS. Adv. Water Resour. 178, 104497. doi:10.1016/j.advwatres.2023.104497
Archer, D. R. (1981). A catchment approach to flood estimation. J. Institution Water Eng. Sci. 35 (3).
Atkins (2015). Flood loss avoidance benefits of green infrastructure for stormwater management. Available online at: https://www.epa.gov/sites/default/files/2016-05/documents/flood-avoidance-green-infrastructure-12-14-2015.pdf.
Awah, L. S., Nyam, Y. S., Belle, J. A., and Orimoloye, I. R. (2024). A system archetype approach to identify behavioural patterns in flood risk management: case study of Cameroon. Environ. Dev. 51, 101026. doi:10.1016/j.envdev.2024.101026
Ayalew, T. B., and Krajewski, W. F. (2017). Effect of river network geometry on flood frequency: a Tale of two watersheds in Iowa. J. Hydrologic Eng. 22 (8), 06017004. doi:10.1061/(asce)he.1943-5584.0001544
Ayalew, T. B., Krajewski, W. F., and Mantilla, R. (2015). Insights into expected changes in Regulated flood frequencies due to the spatial Configuration of flood retention ponds. J. Hydrologic Eng. 20 (10), 04015010. doi:10.1061/(asce)he.1943-5584.0001173
Baldassarre, G.Di, Kreibich, H., Vorogushyn, S., Aerts, J., Arnbjerg-Nielsen, K., Barendrecht, M., et al. (2018). Hess opinions: an interdisciplinary research agenda to explore the unintended consequences of structural flood protection. Hydrology Earth Syst. Sci. 22 (11), 5629–5637. doi:10.5194/hess-22-5629-2018
Ballester, J., Quijal-Zamorano, M., Méndez Turrubiates, R. F., Pegenaute, F., Herrmann, F. R., Robine, J. M., et al. (2023). Heat-related mortality in Europe during the summer of 2022. Nat. Med. 29 (7), 1857–1866. doi:10.1038/s41591-023-02419-z
Barendrecht, M. H., Matanó, A., Mendoza, H., Weesie, R., Rohse, M., Koehler, J., et al. (2024). Exploring drought-to-flood interactions and dynamics: a global case review. Wiley Interdiscip. Rev. Water 11 (4), e1726. doi:10.1002/wat2.1726
Barnes, M. S., Bathurst, J. C., Lewis, E., and Quinn, P. F. (2023). Leaky dams augment afforestation to mitigate catchment scale flooding. Hydrol. Process. 37 (6), e14920. doi:10.1002/hyp.14920
Basso, S., Schirmer, M., and Botter, G. (2016). A physically based analytical model of flood frequency curves. Geophys. Res. Lett. 43 (17), 9070–9076. doi:10.1002/2016GL069915
Beckers, J., Alila, Y., and Mtiraoui, A. (2002). On the validity of the British Columbia Forest Practices Code guidelines for stream culvert discharge design. Can. J. For. Res. 32 (4), 684–692. doi:10.1139/x02-010
Benito, G., and O’Connor, J. E. (2013). 9.24 quantitative paleoflood hydrology. Treatise Geomorphol. 9, 459–474. doi:10.1016/B978-0-12-374739-6.00250-5
Benson, M. A. (1962). Factors influencing the occurrence of floods in a humid region of Diverse terrain. Available online at: https://pubs.usgs.gov/wsp/1580b/report.pdf.
Bernardara, P., Schertzer, D., Sauquet, E., Tchiguirinskaia, I., and Lang, M. (2008). The flood probability distribution tail: how heavy is it? Stoch. Environ. Res. Risk Assess. 22 (1), 107–122. doi:10.1007/s00477-006-0101-2
BGC Engineering Inc (2022). FBC Detailed flood mapping study: frequency-magnitude relationship for the Coldwater river. Available online at: https://www.fraserbasin.bc.ca/_Library/TR_Flood/tr_frequency-magnitude-coldwater_draft_may_2022_web.pdf.
Bian, G., Du, J., Song, M., Zhang, X., Zhang, X., Li, R., et al. (2020). Detection and attribution of flood responses to precipitation change and urbanization: a case study in Qinhuai River Basin, Southeast China. Hydrology Res. 51 (2), 351–365. doi:10.2166/nh.2020.063
Birkinshaw, S. J., Bathurst, J. C., Iroumé, A., and Palacios, H. (2011). The effect of forest cover on peak flow and sediment discharge-an integrated field and modelling study in central-southern Chile. Hydrol. Process. 25 (8), 1284–1297. doi:10.1002/hyp.7900
Blöschl, G., and Sivapalan, M. (1997). Process controls on regional flood frequency: Coefficient of variation and basin scale. Water Resour. Res. 33 (12), 2967–2980. doi:10.1029/97WR00568
Blöschl, G., Kiss, A., Viglione, A., Barriendos, M., Böhm, O., Brázdil, R., et al. (2020). Current European flood-rich period exceptional compared with past 500 years. Nature 583 (7817), 560–566. doi:10.1038/s41586-020-2478-3
Borchers-Arriagada, N., Schulz-Antipa, P., and Conte-Grand, M. (2024). Future fire-smoke PM2.5 health burden under climate change in Paraguay. Sci. Total Environ. 924, 171356. doi:10.1016/j.scitotenv.2024.171356
Bower, L. M., Peoples, B. K., Eddy, M. C., and Scott, M. C. (2022). Quantifying flow–ecology relationships across flow regime class and ecoregions in South Carolina. Sci. Total Environ. 802, 149721. doi:10.1016/j.scitotenv.2021.149721
Brath, A., Montanari, A., and Moretti, G. (2006). Assessing the effect on flood frequency of land use change via hydrological simulation (with uncertainty). J. Hydrology 324 (1–4), 141–153. doi:10.1016/j.jhydrol.2005.10.001
Brunner, M. I., Slater, L., Tallaksen, L. M., and Clark, M. (2021). Challenges in modeling and predicting floods and droughts: a review. (Vol. 8, e1520, Issue 3). doi:10.1002/wat2.1520
Callahan, C. W., and Mankin, J. S. (2025). Carbon majors and the scientific case for climate liability. Nature 640 (8060), 893–901. doi:10.1038/s41586-025-08751-3
Chan, F. K. S., Griffiths, J. A., Higgitt, D., Xu, S., Zhu, F., Tang, Y. T., et al. (2018). “Sponge City” in China—a breakthrough of planning and flood risk management in the urban context. Land Use Policy 76, 772–778. doi:10.1016/j.landusepol.2018.03.005
Chattamvelli, R., and Shanmugam, R. (2023). Descriptive statistics for Scientists and Engineers. Springer Cham. doi:10.1007/978-3-031-32330-0
Chavez-Demoulin, V., and Mhalla, L. (2024). Causality and extremes. ArXiv Prepr. ArXiv:2403.05331. doi:10.48550/arXiv.2403.05331
Chen, M., Papadikis, K., and Jun, C. (2021). An investigation on the non-stationarity of flood frequency across the UK. J. Hydrology 597, 126309. doi:10.1016/j.jhydrol.2021.126309
Chiang, F., Mazdiyasni, O., and AghaKouchak, A. (2021). Evidence of anthropogenic impacts on global drought frequency, duration, and intensity. Nat. Commun. 12 (1), 2754. doi:10.1038/s41467-021-22314-w
Coles, S. (2001). An introduction to statistical modeling of extreme values. London: Springer. doi:10.1007/978-1-4471-3675-0
Commenges, D. (2018). The stochastic system approach to causality with a view toward lifecourse epidemiology. arXivLabs. doi:10.48550/arXiv.1203.5728
Dadson, S. J., Hall, J. W., Murgatroyd, A., Acreman, M., Bates, P., Beven, K., et al. (2017). “A restatement of the natural science evidence concerning catchment-based “natural” flood management in the UK,” 473. Royal Society, 20160706. doi:10.1098/rspa.2016.0706
Dawdy, D. R., and Gupta, V. K. (1997). Reply [to “comment on ‘Multiscaling and skew separation in regional floods’ by David R. Dawdy and Vijay K. Gupta”]. Water Resour. Res. 33 (1), 273–275. doi:10.1029/96WR02732
Dawdy, D. R., Griffis, V. W., and Gupta, V. K. (2012). Regional flood-frequency analysis: how We Got here and where We are going. J. Hydrologic Eng. 17 (9), 953–959. doi:10.1061/(asce)he.1943-5584.0000584
Dhasmana, M. K., Mondal, A., and Zachariah, M. (2023). On the role of climate change in the 2018 flooding event in Kerala. Environ. Res. Lett. 18 (8), 084016. doi:10.1088/1748-9326/ace6c0
Duncan, M. J. (1995). Hydrological impacts of converting pasture and gorse to pine plantation, and forest harvesting, Nelson, New Zealand. J. Hydrology (New Zealand) 34 (1).
Eagleson, P. S. (1972). Dynamics of flood frequency. Water Resour. Res. 8 (4), 878–898. doi:10.1029/WR008i004p00878
El Adlouni, S., Bobée, B., and Ouarda, T. B. M. J. (2008). On the tails of extreme event distributions in hydrology. J. Hydrology 355 (1–4), 16–33. doi:10.1016/j.jhydrol.2008.02.011
Ellis, C. R., Pomeroy, J. W., Essery, R. L. H., and Link, T. E. (2011). Effects of needleleaf forest cover on radiation and snowmelt dynamics in the Canadian Rocky Mountains. Can. J. For. Res. 41 (3), 608–620. doi:10.1139/X10-227
Eslamian, S., and Eslamian, F. (2023). “Disaster risk reduction for resilience: disaster Socio-hydrological resilience and Sustainability,” in Disaster risk reduction for resilience: Disaster Socio-hydrological resilience and Sustainability (Springer International Publishing). doi:10.1007/978-3-031-43177-7
Faivre, N., Fritz, M., Freitas, T., de Boissezon, B., and Vandewoestijne, S. (2017). Nature-Based Solutions in the EU: Innovating with nature to address social, economic and environmental challenges. Environ. Res. 159, 509–518. doi:10.1016/j.envres.2017.08.032
Farquharson, F. A. K., Meigh, J. R., and Sutcliffe, J. V. (1992). Regional flood frequency analysis in arid and semi-arid areas. J. Hydrology 138 (3–4), 487–501. doi:10.1016/0022-1694(92)90132-F
Fischer, E. M., and Knutti, R. (2015). Anthropogenic contribution to global occurrence of heavy-precipitation and high-temperature extremes. Nat. Clim. Change 5 (6), 560–564. doi:10.1038/nclimate2617
Fischer, E. M., Beyerle, U., Bloin-Wibe, L., Gessner, C., Humphrey, V., Lehner, F., et al. (2023). Storylines for unprecedented heatwaves based on ensemble boosting. Nat. Commun. 14 (1), 4643. doi:10.1038/s41467-023-40112-4
Fisher, R. A., and Tippett, L. H. C. (1928). Limiting forms of the frequency distribution of the largest or smallest member of a sample. Math. Proc. Camb. Philosophical Soc. 24 (2), 180–190. doi:10.1017/S0305004100015681
Fleischmann, A., Collischonn, W., Paiva, R., and Tucci, C. E. (2019). Modeling the role of reservoirs versus floodplains on large-scale river hydrodynamics. Nat. Hazards 99 (2), 1075–1104. doi:10.1007/s11069-019-03797-9
Flint, M. M., Fringer, O., Billington, S. L., Freyberg, D., and Diffenbaugh, N. S. (2017). Historical analysis of Hydraulic bridge Collapses in the Continental United States. J. Infrastructure Syst. 23 (3), 04017005. doi:10.1061/(asce)is.1943-555x.0000354
Fraser Basin Council (2016). Lower Mainland flood management Strategy phase 1 summary report. Available online at: https://www.fraserbasin.bc.ca/_Library/Water_Flood_Strategy/FBC_LMFMS_Phase_1_Report_Web_May_2016.pdf.
GHD (2022). Aquanomics: the economics of water risk and future resiliency. Available online at: https://aquanomics.ghd.com/.
Gillett, N. P., Cannon, A. J., Malinina, E., Schnorbus, M., Anslow, F., Sun, Q., et al. (2022). Human influence on the 2021 British Columbia floods. Weather Clim. Extrem. 36, 100441. doi:10.1016/j.wace.2022.100441
Good, I. J. (2007). [The Interface between statistics and Philosophy of science]: Rejoinder. Stat. Sci. 3 (4). doi:10.1214/ss/1177012759
Government of British Columbia (2024). From flood risk to resilience: a B.C. Flood Strategy to 2035. Available online at: https://www2.gov.bc.ca/assets/gov/environment/air-land-water/water/integrated-flood-hazard-mgmt/bc_flood_strategy.pdf.
Green, K. C., and Alila, Y. (2012). A paradigm shift in understanding and quantifying the effects of forest harvesting on floods in snow environments. Water Resour. Res. 48 (10). doi:10.1029/2012WR012449
Guido, B. I., Popescu, I., Samadi, V., and Bhattacharya, B. (2023). An integrated modeling approach to evaluate the impacts of nature-based solutions of flood mitigation across a small watershed in the southeast United States. Nat. Hazards Earth Syst. Sci. 23 (7), 2663–2681. doi:10.5194/nhess-23-2663-2023
Guo, J., Li, H. Y., Leung, L. R., Guo, S., Liu, P., and Sivapalan, M. (2014). Links between flood frequency and annual water balance behaviors: a basis for similarity and regionalization. Water Resour. Res. 50 (2), 937–953. doi:10.1002/2013WR014374
Hani, I., St-Hilaire, A., and Ouarda, T. B. M. J. (2025). Trends, teleconnections and nonstationary frequency modeling of riverine heatwaves in North American Atlantic salmon rivers (1979–2100). Sci. Total Environ. 989, 179866. doi:10.1016/j.scitotenv.2025.179866
Hendrick, R. L., Filgate, B. D., and Adams, W. M. (1971). Application of environmental analysis to watershed snowmelt. J. Appl. Meteorology 10 (3), 418–429. doi:10.1175/1520-0450(1971)010<0418:aoeatw>2.0.co;2
Hettiarachchi, S., Wasko, C., and Sharma, A. (2019). Can antecedent moisture conditions modulate the increase in flood risk due to climate change in urban catchments? J. Hydrology 571, 11–20. doi:10.1016/j.jhydrol.2019.01.039
Hirschboeck, K. K. (1999). A room with a view: some geographic perspectives on dilettantism, cross’training, and scale in hydrology. Ann. Assoc. Am. Geogr. 89 (4), 696–706. doi:10.1111/0004-5608.00170
Hu, L., Nikolopoulos, E. I., Marra, F., and Anagnostou, E. N. (2020). Sensitivity of flood frequency analysis to data record, statistical model, and parameter estimation methods: an evaluation over the contiguous United States. J. Flood Risk Manag. 13 (1), e12580. doi:10.1111/jfr3.12580
Hudson, P. F. (2021). “Dikes and floodplains,” in Flooding and management of large Fluvial Lowlands. doi:10.1017/9781139015738.007
James, R. A., Jones, R. G., Boyd, E., Young, H. R., Otto, F. E. L., Huggel, C., et al. (2019). “Attribution: how is it relevant for loss and damage policy and practice?,” in Loss and damage from climate change. Editors R. Mechler, L. M. Bouwer, T. Schinko, S. Surminski, and J. Linnerooth-Bayer, 113–154. doi:10.1007/978-3-319-72026-5_5
Johnson, R. S. H., and Alila, Y. (2023). Nonstationary stochastic paired watershed approach: investigating forest harvesting effects on floods in two large, nested, and snow-dominated watersheds in British Columbia, Canada. J. Hydrology 625, 129970. doi:10.1016/j.jhydrol.2023.129970
Jongman, B. (2018). Effective adaptation to rising flood risk. Nat. Commun. 9 (1), 1986. doi:10.1038/s41467-018-04396-1
Karhausen, L. R. (2000). Causation: the elusive grail of epidemiology. Health Care Philosophy (Vol. 3).59, 67. doi:10.1023/a:1009970730507
Katz, R. W. (1993). Towards a statistical paradigm for climate change. Clim. Res. 2 (3), 167–175. doi:10.3354/cr002167
Katz, R. W., and Brown, B. G. (1992). Extreme events in a changing climate: variability is more important than averages. Clim. Change 21 (3), 289–302. doi:10.1007/BF00139728
Kay, A. L., Old, G. H., Bell, V. A., Davies, H. N., and Trill, E. J. (2019). An assessment of the potential for natural flood management to offset climate change impacts. Environ. Res. Lett. 14 (4), 044017. doi:10.1088/1748-9326/aafdbe
Kiesel, J., Honsel, L. E., Lorenz, M., Gräwe, U., and Vafeidis, A. T. (2023). Raising dikes and managed realignment may be insufficient for maintaining current flood risk along the German Baltic Sea coast. Commun. Earth Environ. 4 (1), 433. doi:10.1038/s43247-023-01100-0
Klemeš, V. (1970). Negatively skewed distribution of runoff. Symposium Wellingt. (N.Z.) 90, 219–236.
Klemeš, V. (1978). Physically based stochastic hydrologic analysis. Adv. Hydrosci. 11, 285–356. doi:10.1016/b978-0-12-021811-0.50010-3
Klemeš, V. (1986). Dilettantism in hydrology: Transition or destiny? Water Resour. Res. 22 (9 S), 177S–188S. doi:10.1029/WR022i09Sp0177S
Kuraś, P. K., Alila, Y., and Weiler, M. (2012). Forest harvesting effects on the magnitude and frequency of peak flows can increase with return period. Water Resour. Res. 48 (1). doi:10.1029/2011WR010705
Kusumastuti, D. I., Struthers, I., Sivapalan, M., and Reynolds, D. A. (2007). Threshold effects in catchment storm response and the occurrence and magnitude of flood events: implications for flood frequency. Hydrol. Earth Syst. Sci. (Vol. 11). 1515, 1528. doi:10.5194/hess-11-1515-2007
Lague, D. (2014). The stream power river incision model: evidence, theory and beyond. Earth Surf. Process. Landforms 39 (1), 38–61. doi:10.1002/esp.3462
Lahsen, M., and Ribot, J. (2022). “Politics of attributing extreme events and disasters to climate change,” 13. John Wiley and Sons Inc. doi:10.1002/wcc.750
Lallemant, D., Hamel, P., Balbi, M., Lim, T. N., Schmitt, R., and Win, S. (2021). Nature-based solutions for flood risk reduction: a probabilistic modeling framework. One Earth 4 (9), 1310–1321. doi:10.1016/j.oneear.2021.08.010
Leanza, S. (2022). The Architectural and landscape Project for a sustainable urban context. Use and application of nature-based solutions to manage urban floods. Lect. Notes Civ. Eng. 242 LNCE, 56–63. doi:10.1007/978-3-030-96985-1_7
Lee, M., and Parfitt, B. (2022). A Climate Reckoning the economic costs of BC’s extreme weather in 2021.
Liu, Q., Chen, Z., Wang, S., Liang, T., Gao, Z., and Dong, Y. (2024). Changes in soil hydrological retention properties and controlling factors on shaded and Sunny slopes in semi-arid Alpine Woodlands. Forests 15 (7), 1136. doi:10.3390/f15071136
Lloyd, E. A., and Shepherd, T. G. (2020). Environmental catastrophes, climate change, and attribution. Ann. N. Y. Acad. Sci. 1469 (1), 105–124. doi:10.1111/nyas.14308
Loewer, B. (2020). “The Mentaculus Vision,” in Statistical Mechanics and scientific explanation. doi:10.1142/9789811211720_0001
Loukas, A., Vasiliades, L., and Dalezios, N. R. (2000). Flood producing mechanisms identification in southern British Columbia, Canada. J. Hydrology 227, 218–235. doi:10.1016/s0022-1694(99)00182-1
Lu, F., Song, X., Xiao, W., Zhu, K., and Xie, Z. (2020). “Detecting the impact of climate and reservoirs on extreme floods using nonstationary frequency models,” 34. 169–182. doi:10.1007/s00477-019-01747-2
Macdonald, E., Merz, B., Guse, B., Wietzke, L., Ullrich, S., Kemter, M., et al. (2022). Event and catchment controls of heavy tail behavior of floods. Water Resour. Res. 58 (6), e2021WR031260. doi:10.1029/2021WR031260
Macdonald, E., Merz, B., Guse, B., Nguyen, V. D., Guan, X., and Vorogushyn, S. (2024). What controls the tail behaviour of flood series: rainfall or runoff generation? Hydrology Earth Syst. Sci. 28 (4), 833–850. doi:10.5194/hess-28-833-2024
Maheshwari, B. L., Walker, K. F., and McMahon, T. A. (1995). Effects of regulation on the flow regime of the river Murray, Australia. Regul. Rivers Res. and Manag. 10 (1), 15–38. doi:10.1002/rrr.3450100103
Martínez-Sánchez, Á., Arranz, G., and Lozano-Durán, A. (2024). Decomposing causality into its synergistic, unique, and redundant components. Nat. Commun. 15 (1), 9296. doi:10.1038/s41467-024-53373-4
McCuen, R. H., and Hromadka, T. V. (1988). Flood skew in hydrologic design on ungaged watersheds. J. Irrigation Drainage Eng. 114 (2), 301–310. doi:10.1061/(asce)0733-9437(1988)114:2(301)
McCuen, R. H., and Smith, E. (2008). Origin of flood skew. J. Hydrologic Eng. 13 (9), 771–775. doi:10.1061/(asce)1084-0699(2008)13:9(771)
McDonnell, J. J., Spence, C., Karran, D. J., van Meerveld, H. J., and Harman, C. J. (2021). Fill-and-Spill: a process description of runoff generation at the scale of the Beholder. Water Resour. Res. 57 (5), e2020WR027514. doi:10.1029/2020WR027514
McEachran, Z. P., Karwan, D. L., Sebestyen, S. D., Slesak, R. A., and Ng, G. H. C. (2021). Nonstationary flood-frequency analysis to assess effects of harvest and cover type conversion on peak flows at the Marcell Experimental Forest, Minnesota, USA. J. Hydrology 596, 126054. doi:10.1016/j.jhydrol.2021.126054
Mearns, L. O., Katz, R. W., and Schneider, S. H. (1984). Extreme high-temperature events: changes in their probabilities with changes in mean temperature. J. Clim. and Appl. Meteorology 23 (12). doi:10.1175/1520-0450(1984)023<1601:EHTECI>2.0
Merz, R., and Blöschl, G. (2003). A process typology of regional floods. Water Resour. Res. 39 (12). doi:10.1029/2002WR001952
Merz, R., and Blöschl, G. (2008). Flood frequency hydrology: 1. Temporal, spatial, and causal expansion of information. Water Resour. Res. 44 (8). doi:10.1029/2007WR006744
Merz, R., and Blöschl, G. (2009). Process controls on the statistical flood moments - a data based analysis. Hydrol. Process. 23 (5), 675–696. doi:10.1002/hyp.7168
Merz, B., Vorogushyn, S., Uhlemann, S., Delgado, J., and Hundecha, Y. (2012). HESS Opinions: “More efforts and scientific rigour are needed to attribute trends in flood time series.”. Hydrology Earth Syst. Sci. 16 (5), 1379–1387. doi:10.5194/hess-16-1379-2012
Merz, B., Blöschl, G., Vorogushyn, S., Dottori, F., Aerts, J. C. J. H., Bates, P., et al. (2021). Causes, impacts and patterns of disastrous river floods. Nat. Rev. Earth Environ., (Vol. 2, 592, 609. doi:10.1038/s43017-021-00195-3
Merz, B., Basso, S., Fischer, S., Lun, D., Blöschl, G., Merz, R., et al. (2022). Understanding heavy tails of flood peak distributions. Water Resour. Res., (Vol. 58. doi:10.1029/2021WR030506
Milly, P. C. D., Betancourt, J., Falkenmark, M., Hirsch, R. M., Kundzewicz, Z. W., Lettenmaier, D. P., et al. (2008). Climate change: stationarity is dead: Whither water management? Science 319 (5863), 573–574. doi:10.1126/science.1151915
Miniussi, A., Merz, R., Kaule, L., and Basso, S. (2023). Identifying discontinuities of flood frequency curves. J. Hydrology 617, 128989. doi:10.1016/j.jhydrol.2022.128989
Moccia, B., Papalexiou, S. M., Russo, F., and Napolitano, F. (2021). Spatial variability of precipitation extremes over Italy using a fine-resolution gridded product. J. Hydrology Regional Stud. 37, 100906. doi:10.1016/j.ejrh.2021.100906
Moreno, H. A., Gupta, H. V., White, D. D., and Sampson, D. A. (2016). Modeling the distributed effects of forest thinning on the long-term water balance and streamflow extremes for a semi-arid basin in the southwestern US. Hydrology Earth Syst. Sci. 20 (3), 1241–1267. doi:10.5194/hess-20-1241-2016
Naghettini, M., Gontijo, N. T., and Portela, M. M. (2012). Investigation on the properties of the relationship between rare and extreme rainfall and flood volumes, under some distributional restrictions. Stoch. Environ. Res. Risk Assess. 26 (6), 859–872. doi:10.1007/s00477-011-0530-4
Nearing, G. S., Kratzert, F., Sampson, A. K., Pelissier, C. S., Klotz, D., Frame, J. M., et al. (2021). What role does hydrological science Play in the age of Machine Learning? Water Resour. Res. 57 (3), e2020WR028091. doi:10.1029/2020WR028091
Newman, R., and Noy, I. (2023). The global costs of extreme weather that are attributable to climate change. Nat. Commun. 14 (1), 6103. doi:10.1038/s41467-023-41888-1
Northwest Hydraulic Consultants Ltd (2015). Lower Mainland dike assessment final report. Available online at: https://www2.gov.bc.ca/assets/gov/environment/air-land-water/water/integrated-flood-hazard-mgmt/nhc_final_lower_mainland_dike_assessment.pdf.
Opere, A. O., Mkhandi, S., and Willems, P. (2006). At site flood frequency analysis for the Nile Equatorial basins. Phys. Chem. Earth 31 (15–16), 919–927. doi:10.1016/j.pce.2006.08.018
Ouarda, T. B. M. J., and Charron, C. (2019). Changes in the distribution of hydro-climatic extremes in a non-stationary framework. Sci. Rep. 9 (1), 8104. doi:10.1038/s41598-019-44603-7
Palmer, T. N., and Williams, P. D. (2008). Introduction. Stochastic physics and climate modelling. Philosophical Trans. R. Soc. A Math. Phys. Eng. Sci. 366 (1875), 2419–2425. doi:10.1098/rsta.2008.0059
Parascandola, M., and Weed, D. L. (2001). Causation in epidemiology. J. Epidemiol. Community Health 55 (12), 905–912. doi:10.1136/jech.55.12.905
Parisien, M. A., Barber, Q. E., Bourbonnais, M. L., Daniels, L. D., Flannigan, M. D., Gray, R. W., et al. (2023). Abrupt, climate-induced increase in wildfires in British Columbia since the mid-2000s. Commun. Earth Environ. 4 (1), 309. doi:10.1038/s43247-023-00977-1
Pearl, J. (2009). “Causality: models, reasoning, and inference, second edition,” in Causality: models, reasoning, and inference. Second Edition. doi:10.1017/CBO9780511803161
Pearl, J., and Mackenzie, D. (2018). The book of why: the new science of cause and effect. Basic Books. Available online at: www.basicbooks.com.
Penny, J., Alves, P. B. R., De-Silva, Y., Chen, A. S., Djordjević, S., Shrestha, S., et al. (2023). Analysis of potential nature-based solutions for the Mun river basin, Thailand. Water Sci. Technol. 87 (6), 1496–1514. doi:10.2166/wst.2023.050
Pham, H. C., and Alila, Y. (2024). Science of forests and floods: the quantum leap forward needed, literally and metaphorically. Sci. Total Environ. 912, 169646. doi:10.1016/j.scitotenv.2023.169646
Philip, S., Sparrow, S., Kew, S. F., Van Der Wiel, K., Wanders, N., Singh, R., et al. (2019). Attributing the 2017 Bangladesh floods from meteorological and hydrological perspectives. Hydrology Earth Syst. Sci. 23 (3), 1409–1429. doi:10.5194/hess-23-1409-2019
Pike, R. G., and Robin, G. (2010). Compendium of forest hydrology and geomorphology in British Columbia. Ministry of Forests and Range.
Pitlick, J. (1994). Relation between peak flows, precipitation, and physiography for five mountainous regions in the western USA. J. Hydrology 158 (3–4), 219–240. doi:10.1016/0022-1694(94)90055-8
Poff, N. L., David Allan, J., Bain, M. B., Karr, J. R., Prestegaard, K. L., Richter, B. D., et al. (1997). The natural flow regime. 47, 769, 784. doi:10.2307/1313099
Prancevic, J. P., and Kirchner, J. W. (2019). Topographic controls on the extension and Retraction of flowing streams. Geophys. Res. Lett. 46 (4), 2084–2092. doi:10.1029/2018GL081799
Prosdocimi, I., Kjeldsen, T. R., and Miller, J. D. (2015). Detection and attribution of urbanization effect on flood extremes using nonstationary flood-frequency models. Water Resour. Res. 51 (6), 4244–4262. doi:10.1002/2015WR017065
Quintero, F., Mantilla, R., Anderson, C., Claman, D., and Krajewski, W. (2018). Assessment of changes in flood frequency due to the effects of climate change: implications for engineering design. Hydrology 5 (1), 19. doi:10.3390/hydrology5010019
Renard, B., Kavetski, D., Kuczera, G., Thyer, M., and Franks, S. W. (2010). Understanding predictive uncertainty in hydrologic modeling: the challenge of identifying input and structural errors. Water Resour. Res. 46 (5). doi:10.1029/2009WR008328
Rentschler, J., Avner, P., Marconcini, M., Su, R., Strano, E., Vousdoukas, M., et al. (2023). Global evidence of rapid urban growth in flood zones since 1985. Nature 622 (7981), 87–92. doi:10.1038/s41586-023-06468-9
Reynard, N. S., Prudhomme, C., and Crooks, S. M. (2001). The flood characteristics of large U.K. rivers: potential effects of changing climate and land use. Clim. Change 48, 343–359. doi:10.1023/a:1010735726818
Robinson, J. S., and Sivapalan, M. (1997). Temporal scales and hydrological regimes: implications for flood frequency scaling. Water Resour. Res. 33 (12), 2981–2999. doi:10.1029/97WR01964
Rogger, M., Pirkl, H., Viglione, A., Komma, J., Kohl, B., Kirnbauer, R., et al. (2012). Step changes in the flood frequency curve: process controls. Water Resour. Res. 48 (5). doi:10.1029/2011WR011187
Ross, A. C., Stock, C. A., Adams-Smith, D., Dixon, K., Findell, K. L., Saba, V., et al. (2021). Anthropogenic influences on extreme annual streamflow into chesapeake bay from the Susquehanna river. Bull. Am. Meteorological Soc. 102 (1), S25–S32. doi:10.1175/BAMS-D-20-0129.1
Rubin, Y. (2003). “Applied stochastic Hydrogeology,” in Applied stochastic Hydrogeology. doi:10.1093/oso/9780195138047.001.0001
Runge, J., Bathiany, S., Bollt, E., Camps-Valls, G., Coumou, D., Deyle, E., et al. (2019). Inferring causation from time series in Earth system sciences. Nat. Commun. 10 (1), 2553. doi:10.1038/s41467-019-10105-3
Salas, J. D., and Obeysekera, J. (2014). Revisiting the concepts of return period and risk for nonstationary hydrologic extreme events. J. Hydrologic Eng. 19 (3), 554–568. doi:10.1061/(asce)he.1943-5584.0000820
Schaefer, M. G. (1990). Regional analyses of precipitation annual maxima in Washington State. Water Resour. Res. 26 (1), 119–131. doi:10.1029/WR026i001p00119
Schaller, N., Kay, A. L., Lamb, R., Massey, N. R., Van Oldenborgh, G. J., Otto, F. E. L., et al. (2016). Human influence on climate in the 2014 southern England winter floods and their impacts. Nat. Clim. Change 6 (6), 627–634. doi:10.1038/nclimate2927
Seneviratne, S. I., Donat, M. G., Mueller, B., and Alexander, L. V. (2014). No pause in the increase of hot temperature extremes. Nat. Clim. Change 4 (Issue 3), 161–163. doi:10.1038/nclimate2145
Singh, N. K., and Basu, N. B. (2022). The human factor in seasonal streamflows across natural and managed watersheds of North America. Nat. Sustain. 5 (5), 397–405. doi:10.1038/s41893-022-00848-1
Sivapalan, M., Wood, E. F., and Beven, K. J. (1990). On hydrologic similarity: 3. A dimensionless flood frequency model using a generalized geomorphologic unit hydrograph and partial area runoff generation. Water Resour. Res. 26 (1), 43–58. doi:10.1029/WR026i001p00043
Sivapalan, M., Blöschl, G., Merz, R., and Gutknecht, D. (2005). Linking flood frequency to long-term water balance: incorporating effects of seasonality. Water Resour. Res. 41 (6). doi:10.1029/2004WR003439
Smith, J. A. (1987). Estimating the upper tail of flood frequency distributions. Water Resour. Res. 23 (8), 1657–1666. doi:10.1029/WR023i008p01657
Smith, J. A., Cox, A. A., Baeck, M. L., Yang, L., and Bates, P. (2018). Strange floods: the upper tail of flood peaks in the United States. Water Resour. Res. 54 (9), 6510–6542. doi:10.1029/2018WR022539
Stott, P. A., Christidis, N., Otto, F. E. L., Sun, Y., Vanderlinden, J. P., van Oldenborgh, G. J., et al. (2016). Attribution of extreme weather and climate-related events. Wiley Interdiscip. Rev. Clim. Change 7 (1), 23–41. doi:10.1002/wcc.380
Strevens, M. (2014). “Probabilistic explanation,” in Physical theory: method and interpretation. doi:10.1093/acprof:oso/9780195145649.003.0003
Strickland, B. A., Patrick, C. J., Carvallo, F. R., Kinard, S. K., Solis, A. T., Reese, B. K., et al. (2024). Long-term climate and hydrologic regimes shape stream invertebrate community responses to a hurricane disturbance. J. Animal Ecol. 93 (7), 823–835. doi:10.1111/1365-2656.14086
Sudakov, I., Vakulenko, S. A., and Bruun, J. T. (2022). Stochastic physics of species extinctions in a large population. Phys. A Stat. Mech. Its Appl. 585, 126422. doi:10.1016/j.physa.2021.126422
Swain, D. L., Singh, D., Touma, D., and Diffenbaugh, N. S. (2020). Attributing extreme events to climate change: a new Frontier in a warming world. One Earth 2 (6), 522–527. doi:10.1016/j.oneear.2020.05.011
Taleb, N. N. (2009). Errors, robustness, and the fourth quadrant. Int. J. Forecast. 25 (4), 744–759. doi:10.1016/j.ijforecast.2009.05.027
Taleb, N. N., and Douady, R. (2013). Mathematical definition, mapping, and detection of (anti)fragility. Quant. Finance 13 (11), 1677–1689. doi:10.1080/14697688.2013.800219
Te Linde, A. H., Aerts, J. C. J. H., and Kwadijk, J. C. J. (2010). Effectiveness of flood management measures on peak discharges in the Rhine basin under climate change. J. Flood Risk Manag. 3 (4), 248–269. doi:10.1111/j.1753-318X.2010.01076.x
Teufel, B., Sushama, L., Huziy, O., Diro, G. T., Jeong, D. I., Winger, K., et al. (2019). Investigation of the mechanisms leading to the 2017 Montreal flood. Clim. Dyn. 52 (7–8), 4193–4206. doi:10.1007/s00382-018-4375-0
Van Oldenborgh, G. J., Wehner, M. F., Vautard, R., Otto, F. E. L., Seneviratne, S. I., Stott, P. A., et al. (2022). Attributing and projecting heatwaves is hard: we can do better. Earth’s Future 10 (6), e2021EF002271. doi:10.1029/2021EF002271
Vázquez-Tarrío, D., Ruiz-Villanueva, V., Garrote, J., Benito, G., Calle, M., Lucía, A., et al. (2024). Effects of sediment transport on flood hazards: Lessons learned and remaining challenges. Geomorphology 446, 108976. doi:10.1016/j.geomorph.2023.108976
Vicarelli, M., Sudmeier-Rieux, K., Alsadadi, A., Shrestha, A., Schütze, S., Kang, M. M., et al. (2024). On the cost-effectiveness of Nature-based Solutions for reducing disaster risk. Sci. Total Environ. (Vol. 947). doi:10.1016/j.scitotenv.2024.174524
Wang, J., Chen, Y., Liao, W., He, G., Tett, S. F. B., Yan, Z., et al. (2021). Anthropogenic emissions and urbanization increase risk of compound hot extremes in cities. Nat. Clim. Change 11 (12), 1084–1089. doi:10.1038/s41558-021-01196-2
Wang, H. J., Merz, R., Yang, S., Tarasova, L., and Basso, S. (2023). Emergence of heavy tails in streamflow distributions: the role of spatial rainfall variability. Adv. Water Resour. 171, 104359. doi:10.1016/j.advwatres.2022.104359
Wardhana, K., and Hadipriono, F. C. (2003). Analysis of recent bridge failures in the United States. J. Perform. Constr. Facil. 17 (3), 144–150. doi:10.1061/ASCE0887-3828200317:3144
Waylen, P., and Woo, M. K. (1983). Annual floods in southwestern British Columbia, Canada. J. Hydrology 62 (1–4), 95–105. doi:10.1016/0022-1694(83)90096-3
White, R. H., Anderson, S., Booth, J. F., Braich, G., Draeger, C., Fei, C., et al. (2023). The unprecedented Pacific Northwest heatwave of June 2021. Nat. Commun. 14 (1), 727. doi:10.1038/s41467-023-36289-3
Wolman, M. G., and Miller, J. P. (1960). Magnitude and frequency of forces in geomorphic processes. J. Geol. 68 (1), 54–74. doi:10.1086/626637
Xie, S. P., Deser, C., Vecchi, G. A., Collins, M., Delworth, T. L., Hall, A., et al. (2015). Towards predictive understanding of regional climate change. Nat. Clim. Chang, (Vol. 5, Issue 10, pp. 921–930). doi:10.1038/nclimate2689
Xiong, B., Xiong, L., Xia, J., Xu, C. Y., Jiang, C., and Du, T. (2019). Assessing the impacts of reservoirs on downstream flood frequency by coupling the effect of scheduling-related multivariate rainfall with an indicator of reservoir effects. Hydrology Earth Syst. Sci. 23 (11), 4453–4470. doi:10.5194/hess-23-4453-2019
Xiong, B., Xiong, L., Guo, S., Xu, C. Y., Xia, J., Zhong, Y., et al. (2020). Nonstationary frequency analysis of Censored data: a case study of the floods in the Yangtze river from 1470 to 2017. Water Resour. Res. 56 (8), e2020WR027112. doi:10.1029/2020WR027112
Yang, L., Smith, J., Baeck, M. L., Morin, E., and Goodrich, D. C. (2017). Flash flooding in arid/semiarid regions: Dissecting the hydrometeorology and hydrology of the 19 August 2014 storm and flood hydroclimatology in Arizona. J. Hydrometeorol. 18 (12), 3103–3123. doi:10.1175/JHM-D-17-0089.1
Yang, L., Wang, L., Li, X., and Gao, J. (2019). On the flood peak distributions over China. Hydrology Earth Syst. Sci. 23 (12), 5133–5149. doi:10.5194/hess-23-5133-2019
Young, H. R., Cornforth, R. J., Gaye, A. T., and Boyd, E. (2019). Event Attribution science in adaptation decision-making: the context of extreme rainfall in urban Senegal. Clim. Dev. 11 (9), 812–824. doi:10.1080/17565529.2019.1571401
Yu, G., Wright, D. B., and Davenport, F. V. (2022). Diverse physical processes drive upper-tail flood quantiles in the US mountain west. Geophys. Res. Lett. 49 (10), e2022GL098855. doi:10.1029/2022GL098855
Yu, G., Liu, T., McGuire, L. A., Wright, D. B., Hatchett, B. J., Miller, J. J., et al. (2023). Process-based quantification of the role of wildfire in shaping flood frequency. Water Resour. Res. 59 (12), e2023WR035013. doi:10.1029/2023WR035013
Yue, S., Pilon, P., and Cavadias, G. (2002). Power of the Mann-Kendall and Spearman’s rho tests for detecting monotonic trends in hydrological series. J. Hydrology, 259, 254–271. doi:10.1016/S0022-1694(01)00594-7
Keywords: flood management, hydroclimatic extremes, causality, stochastic physics, nature based solutions
Citation: Kaluarachchi S and Alila Y (2025) Managing extremes in the Anthropocene: a causal, stochastic physics approach. Front. Environ. Sci. 13:1643416. doi: 10.3389/fenvs.2025.1643416
Received: 09 June 2025; Accepted: 08 September 2025;
Published: 07 October 2025.
Edited by:
Patrick Laux, Karlsruhe Institute of Technology (KIT), GermanyReviewed by:
Ying Zhu, Xi’an University of Architecture and Technology, ChinaIonut Minea, Alexandru Ioan Cuza University, Romania
Hero Xu, Sichuan University, China
Copyright © 2025 Kaluarachchi and Alila. This is an open-access article distributed under the terms of the Creative Commons Attribution License (CC BY). The use, distribution or reproduction in other forums is permitted, provided the original author(s) and the copyright owner(s) are credited and that the original publication in this journal is cited, in accordance with accepted academic practice. No use, distribution or reproduction is permitted which does not comply with these terms.
*Correspondence: Samadhee Kaluarachchi, c2FtYWRoZWVrQGdtYWlsLmNvbQ==