 Qianqian Du1
 Lei Li2,3*
- 1School of Economics and Management, Xizang University, Lhasa, China
- 2Department of Geography, School of History and Tourism, Fuyang Normal University, Fuyang, China
- 3Graduate School of Global Environment Studies, Sophia University, Tokyo, Japan
Introduction: Amid accelerating global urbanization and climate change, ecologically fragile regions such as the Xizang Autonomous Region face increasing pressure to balance ecological conservation with socio-economic development. Xizang serves as a critical ecological security barrier in China and Asia, making it an ideal case for assessing ecosystem service value (ESV) dynamics and ecological compensation needs.
Methods: This study assessed land use changes and ESV dynamics across eight key ecological function zones in Xizang from 2000 to 2020 using the value equivalent factor method, high-resolution remote sensing data, and field validation. We further proposed an ecological compensation priority score (ECPS) based on the ratio of non-market ESV to GDP per unit area.
Results: The findings reveal a “U-shaped” trend in grassland coverage, rapid ESV gains in wetlands, and losses in snow and barren lands. Despite their limited area, water bodies contributed disproportionately to total ESV due to their strong regulatory functions. The northwestern Qiangtang Plateau desert ecological zone exhibited the highest ecological compensation priority, with a theoretical compensation amount of approximately 1.6 trillion CNY in 2020.
Discussion: The results highlight significant gaps between ecosystem service provision and current fiscal transfers. This study provides a scientific basis for improving ecological compensation mechanisms and promoting sustainable development in high-altitude ecological zones with limited economic capacity.
1 Introduction
The study of ecosystem services has a long history worldwide (Barile et al., 2016), particularly in developed countries and regions (Barot et al., 2017), where extensive and in-depth evaluations of the service functions of various ecosystem types such as forests, wetlands, oceans, and grasslands have been conducted (As’ad et al., 2024). Methods like contingent valuation and ecological value calculation have enabled precise estimates of ESV across different areas, thereby advancing the understanding and attention to ecosystem service functions (Bennett et al., 2009; Berglihn and Gómez-Baggethun, 2021; Boerema et al., 2017). These research outcomes have demonstrated that assessing the capacity of ecosystem services can scientifically guide ecosystem management and decision-making (Bolund and Hunhammar, 1999; Caputo and Butler, 2017). In the realm of ecological compensation, studies based on ESV are especially crucial (Chen and Zhang, 2000). The key lies in clarifying the specific link between ESV and ecological compensation (Chiaravalloti et al., 2022). Theoretically, the amount of ecological compensation should be determined by the ecological service value spilling over the market (Collier, 2014). Emergy analysis provides an essential tool in this regard by distinguishing between the service value generated purely by natural contributions, the combined effects of natural contributions and human inputs (Comberti et al., 2015; Delgado and Marín, 2015), and existence values based on human preferences (Delphin et al., 2016). This forms a theoretical framework for addressing the relationships among ecosystem services, beneficiary areas, compensation methods, compensation standards, and compensated entities.
In recent years, the research on ESV in key areas has gained increasing attention (Evers et al., 2018). For instance, methods for evaluating the ESV of grasslands, wetlands, and urban agglomerations have continuously evolved, leading to the emergence of new assessment frameworks and methods (Feng et al., 2018; Field et al., 2021; Granek et al., 2010). By integrating the spatial correlation of land use data and utilizing hotspot analysis and geographical detection methods, studies have delved into the spatiotemporal characteristics and driving factors of ESV changes (Hasan et al., 2020; Hein et al., 2016). Previous research has also employed approaches like the “ecological benefit ratio targeting” method and the “ecological compensation priority” method (Jiang et al., 2021; Kandziora et al., 2013; La Notte et al., 2022), which, based on comprehensive ecological compensation and performance assessment systems (Cheng et al., 2022; Deng et al., 2011), aim to achieve dual objectives of improving livelihoods and environmental protection (Lee et al., 2020). These studies underscore the importance of considering both environmental and livelihood factors comprehensively when allocating ecological compensation funds, thereby promoting the sustainable development of regional ecological environments.
Numerous studies have investigated land use changes and ecosystem service values (ESV) across China, including high-altitude regions such as Xizang and the broader Qinghai–Xizang Plateau (e.g., Pan et al., 2021, Zhang et al., 2022, Liu et al., 2016, Yu et al., 2024). These works have offered important insights into the effects of subsidy policies, approaches to ESV estimation, and the development of ecological compensation thresholds. However, most of these studies adopt macro-level perspectives, often overlooking the heterogeneity and ecological significance of Xizang’s officially designated key ecological function zones. Moreover, there remains a lack of long-term, fine-scale assessments that integrate county-level and grid-based analyses of ESV dynamics over extended periods (e.g., 2000–2020), as well as comprehensive evaluations of theoretical ecological compensation gaps that distinguish between market and non-market ecosystem values. To bridge these gaps, this study applies a multi-scale analytical framework incorporating high-resolution land use data, an enhanced non-market valuation method, and spatial autocorrelation analysis to examine eight key ecological function zones in Xizang. Furthermore, it proposes a novel ecological compensation priority index (ECPS) based on the ratio of non-market ESV to GDP per unit area. This integrated approach not only improves the accuracy of ESV assessments but also provides a scientific basis for prioritizing compensation allocations, thereby offering valuable policy implications for ecologically fragile and economically underdeveloped regions on the Xizangan Plateau.
2 Materials and methods
2.1 Overview of the study area
The Xizang Autonomous Region (hereinafter referred to as “Xizang”) is located in the southwestern part of the Qinghai–Xizang Plateau. The region’s topography varies significantly from northwest to southeast, making it extremely complex. With an average altitude of over 4,000 m, Xizang is often referred to as the “Roof of the World” and the “Third Pole of the Earth.” Covering an area of over 1.2 million square kilometers, Xizang experiences most of its annual precipitation from May to September, ranging from less than 100 mm in the northwest to over 2,000 mm in the southeast. This makes Xizang one of the most ecologically diverse regions in China and globally, with outstanding ecological significance and high ecosystem service values (Zhang et al., 2022).
Currently, Xizang’s administrative divisions include six cities—Lhasa, Shigatse, Shannan, Nyingchi, Chamdo, and Nagqu—together with Ngari Prefecture, comprising a total of 74 counties (districts). The region’s unique climatic conditions, diverse geographical landscapes, and abundant wildlife resources provide exceptional advantages for ecological conservation and sustainable eco-tourism. To safeguard ecological security and promote regional sustainable development, the Chinese government officially established eight key ecological function zones in Xizang in 2010 (Supplementary Table S1). These zones cover approximately 790,000 square kilometers—about 65% of the region’s total area—and encompass 33 counties (Figure 1). They form an essential part of China’s national ecological security barrier, functioning as critical areas for water conservation, biodiversity protection, desertification control, and climate regulation. Beyond their ecological importance, these zones also hold significant policy relevance, as they serve as priority regions for ecological compensation schemes and reflect China’s commitment to balancing ecological protection with socio-economic development on the Qinghai–Xizang Plateau.
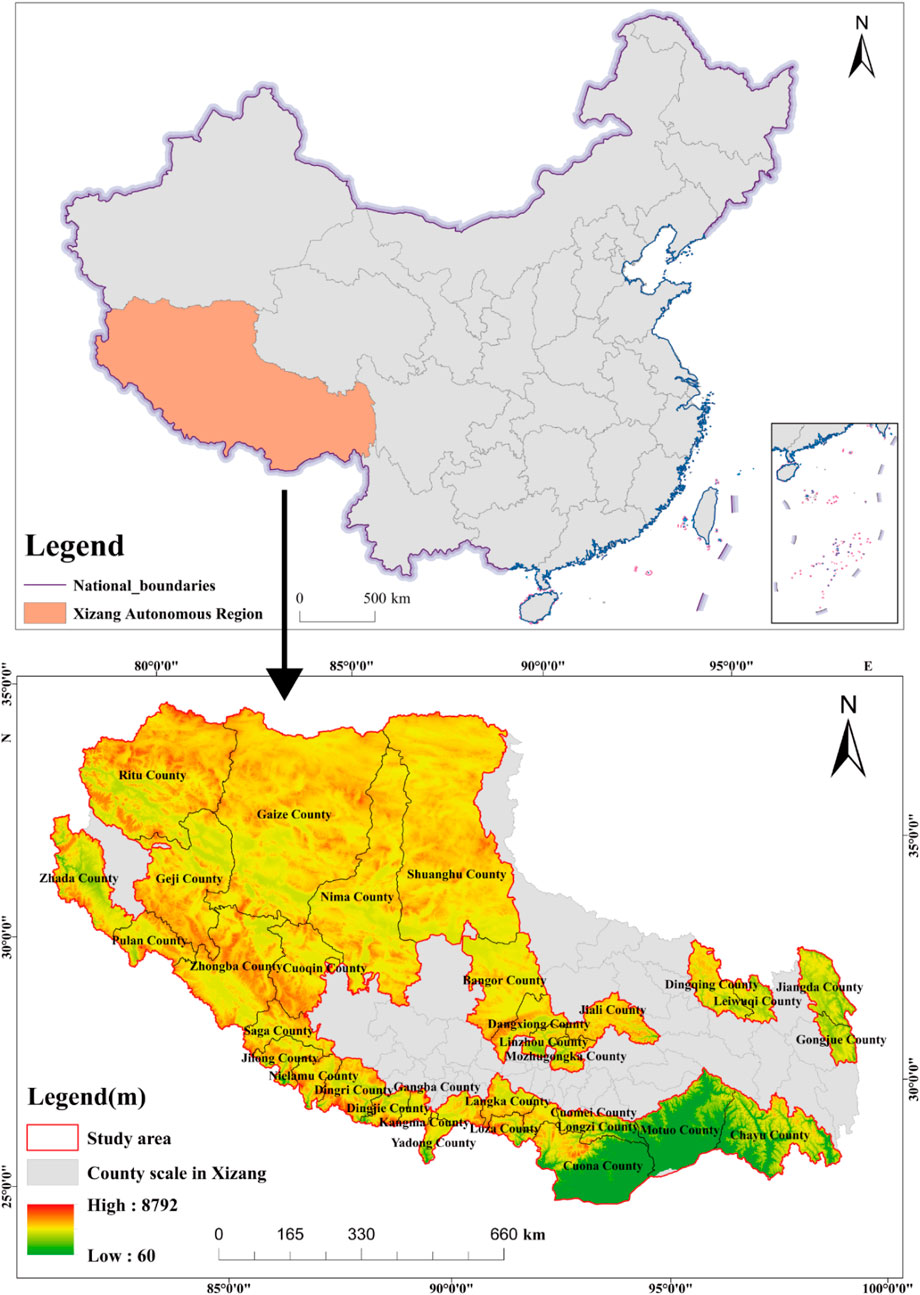
Figure 1. Overview map of key ecological function zones in Xizang.
2.2 Data sources
The data used in this study were sourced from the “Xizang Statistical Yearbook,” “China County Statistical Yearbook,” “Xizang Autonomous Region Ecological and Environmental Bulletin,” various municipal ecological and environmental bulletins and government work reports, as well as excellent scholarly achievements and literature in the field. Additionally, land use raster data for key ecological function zones in Xizang were obtained from the 1985–2022 China 30 m resolution land use dataset published by the Wuhan University team in the journal ESSD (https://www.zenodo.org/record/8176941). Based on the classification of ESV, the original land use raster data were adjusted and merged to categorize land use types into eight categories: arable land, forest land (merging forest and shrubland), grassland, water bodies, ice and snow, wetlands, construction land, and unused land. Further analysis and processing were conducted using the ArcGIS 10.2 platform. This study also utilized the “1:1,000,000 Public Edition Fundamental Geographic Information Data (2021)” from the National Geographic Information Resource Catalog Service System, organized according to administrative division adjustments released by the Ministry of Civil Affairs.
2.3 Research methods
2.3.1 Ecosystem service value assessment method
This study employed the equivalent factor method to estimate the ESV in Xizang, modifying the 2015 revised equivalent table of China’s ESV. First, the equivalent table was adjusted and merged based on the actual land use types and crop types in the study area. The main crops in the study area are wheat and barley, with rice cultivation area accounting for less than 1%, so the value for arable land directly corresponds to dryland equivalents. The forest land value is an average of coniferous, broadleaf-coniferous mixed, broadleaf, and shrub values (Potsch et al., 2011). The grassland value is an average of grassland, shrub-grassland, and meadow values. The unused land value is an average of desert and bare land values. Other land categories correspond to secondary classifications of ESV (Rau et al., 2020). Next, the unit area ESV coefficient for the study area was corrected based on the types, yields, planted areas, and prices of the main grain crops in Xizang.
By collecting relevant data from the “Xizang Statistical Yearbook” and the “National Compilation of Agricultural Product Cost and Benefit Data,” the average grain crop yield per unit area from 2000 to 2020 was found to be 5,332.20 kg/hm2. The average purchase price of major crops in Xizang in 2020 was calculated to be 3.95 yuan/kg based on the proportions of wheat and barley yields, using a weighted average method. According to the principle that “one standard equivalent of ESV is equivalent to 1/7 of the economic value of food production per unit area of farmland,” the standard equivalent ESV D was finally determined to be 3,008.88 yuan/hm2, as shown in Equation 1. Using this value and formula 3, the ESV coefficient table for Xizang was derived (Supplementary Table S2).
2.3.2 Spatial pattern analysis method
To reveal the spatial distribution characteristics and correlations of small-scale unit values within the eight key ecological function zones in Xizang, an exploratory spatial analysis method was adopted (Schröter et al., 2017). Exploratory spatial analysis provides a visual representation of the spatial interaction mechanisms of various natural, economic, and social phenomena, thereby revealing the degree of spatial autocorrelation of such phenomena (Serna-Chavez et al., 2014). This includes both global and local spatial autocorrelation. Global spatial autocorrelation can reveal the overall clustering and dispersion patterns within the study area, while local spatial autocorrelation can highlight local differences (Zhang et al., 2010).
The commonly used Global Moran’s I index is employed to test whether the ESV at the grid scale in Xizang are spatially clustered. It is defined as:
In Equation 4:
Additionally, local spatial autocorrelation analysis can better explore local differences in grid values within Xizang. Local spatial autocorrelation is typically represented by the Local Indicators of Spatial Association (LISA) statistics. It is defined as:
In Equation 5:
2.3.3 Non-market value analysis
The market value of provisioning services is already circulated in monetary form within the market, contributing significantly to regional production. Therefore, this study selects the values of regulating services (ERV), supporting services (EPV), and cultural services (ECV) as the non-market values of ecosystem services in Xizang to calculate the ecological compensation priority score (ECPS) for each of Xizang’s key ecological function zones (Li et al., 2022).
Based on the existing ecological compensation mechanisms and data availability, to ensure that the ecological compensation amounts and market values are more reasonable and practical (Liu et al., 2016), this study uses 2020 as the baseline year to explore the theoretical ecological compensation amounts in Xizang. The ecological compensation amount (AEC) for each key ecological function zone in Xizang for the year 2020 is calculated using the ecosystem’s non-market value (ENMV) as defined in Equation 6. The rankings of ecological compensation priority (ECPS) and ecological compensation amount (AEC) for each key ecological function zone in Xizang are then compared. This comparison aims to propose reasonable development strategies and suggestions for ecological compensation in Xizang.
2.3.4 Ecological priority analysis
Ecological compensation priority score (ECPS) refers to the ratio of the non-market value of ecosystem services per unit area to the GDP per unit area in a given region. This ratio reflects the demand for ecological compensation in the study area. The calculation formula is as follows:
In Equation 7, ENMV represents the non-market economic value of the ecosystem per unit area, while GDP refers to the GDP per unit area. The higher the value of ECPS, the stronger the demand for ecological compensation in that region; conversely, a lower ECPS indicates a weaker demand for ecological compensation. Based on the actual situation in Xizang, this study classifies ecological compensation into two levels: regions with ECPS > 1 are designated as priority areas for ecological compensation and should receive compensation funds first. In contrast, regions with ECPS < 1 are designated as non-priority areas for ecological compensation, with lower demand for compensation and may receive funds subsequently (Smith et al., 2019).
The ECPS index employed in this study—defined as the ratio of non-market ecosystem service value to GDP per unit area—offers a conceptually straightforward yet policy-relevant proxy for identifying ecological compensation priorities. It reflects the principle that regions providing high levels of ecological services while possessing limited economic capacity should be prioritized in compensation allocations. The use of non-market ESV highlights ecological contributions that are typically undervalued in conventional economic metrics. However, we acknowledge that this single-ratio approach does not fully capture the multidimensional nature of ecological importance. Key ecological attributes such as biodiversity, ecosystem integrity, and vulnerability to disturbance are not explicitly considered. As such, ECPS should be interpreted as a baseline indicator rather than a definitive prioritization metric. To improve robustness, future studies may consider incorporating supplementary indices—such as ecological sensitivity, habitat connectivity, or composite multi-criteria evaluation frameworks—to better capture the complex socio-ecological context underlying compensation needs.
2.3.5 Calculation and analysis of ecological compensation amounts
According to ecological economic theory, the regional demand for ecological compensation is negatively correlated with GDP per unit area and positively correlated with the non-market value of ecosystem services per unit area. (Xie et al., 2013). Ecological function zones, in order to protect the ecological environment, may sacrifice their economic development to some extent, creating a relative contradiction between economic development and ecological protection in these areas (Liu et al., 2018). Therefore, ecological function zones should be given priority for ecological compensation funds. After receiving compensation funds, these areas can not only accelerate their economic development but also continue to provide financial support for ecological protection (Thomas et al., 2020).
Thus, this study, based on the actual situation in Xizang, uses the regional ecological compensation demand intensity coefficient to reflect the differences in ecological compensation amounts across regions. The arctangent function is used to calculate the ecological compensation amounts. The calculation formula is as follows:
In Equations 8, 9, RT represents the total ecological compensation for the study area, VT denotes the non-market economic value of the ecosystem in that area, k is the coefficient for calculating the ecological economic value, set at 15% based on related studies, and t is the regional ecological compensation demand intensity coefficient.
3 Results and analysis
3.1 Land use changes
Using ArcGIS 10.2 to extract and analyze land use data from 2000 to 2020 in Xizang, the area of each ecosystem type was determined (Supplementary Table S3).
From Figure 2 and Supplementary Table S3, it can be seen that grassland is the main land type in the key ecological function zones of Xizang, primarily distributed in the southeast direction of the study area, accounting for over 70% of the total area. This indicates Xizang’s significant advantage in agriculture and animal husbandry. Unused land and forest land follow, accounting for 14% and 9.3%, respectively. Water bodies and ice and snow each account for about 2.5%, while arable land, construction land, and wetlands each account for less than 0.1%.
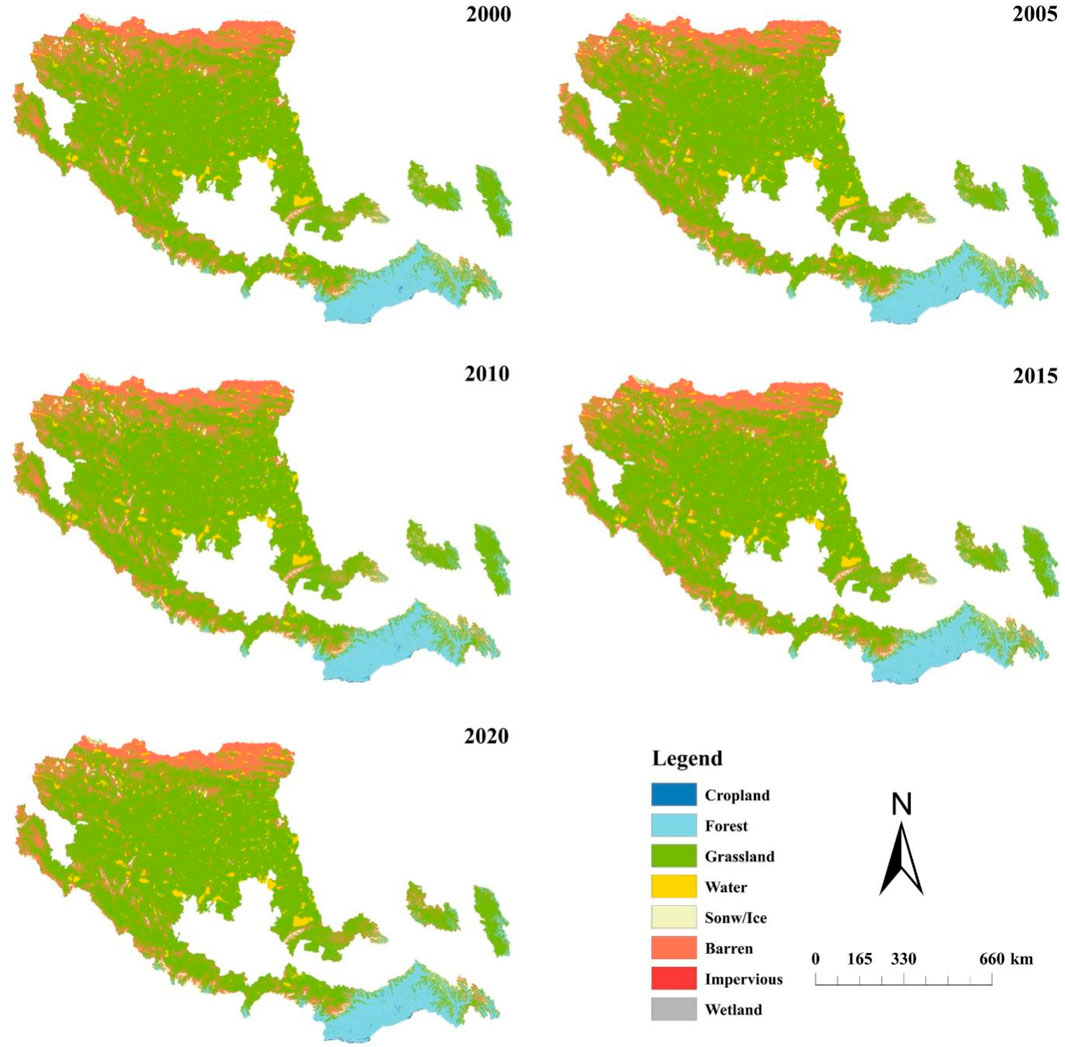
Figure 2. Spatial distribution of land use types in key ecological function zones in Xizang over 5-year periods.
Grassland exhibited a “U”-shaped growth trend, reflecting initial degradation followed by restoration driven by ecological protection policies post-2010. Arable land, forest land, construction land, wetlands, and water bodies generally expanded, while ice/snow and unused land declined. Wetland protection has been effective due to their critical ecological functions. Increases in construction land signal potential sustainability challenges, requiring careful land-use balancing. The decline in unused land—mainly in the north—reflects intensified development, underscoring the need for continued environmental safeguards.
As shown in Figure 3, land use in Xizang’s key ecological zones remained relatively stable from 2000 to 2010, with only minor conversions among arable land, grassland, and impervious surfaces. However, from 2010 to 2020, land use changes became more pronounced—especially reductions in forest and grassland areas—driven by agricultural expansion, urbanization, and possible climate impacts. Impervious surfaces increased markedly, reflecting accelerated urban development. Over the full period (2000–2020), arable land and impervious surfaces expanded, while grasslands declined substantially, potentially compromising ecosystem services. Although water bodies and wetlands changed only slightly, the wetland loss is ecologically significant and warrants further protection.
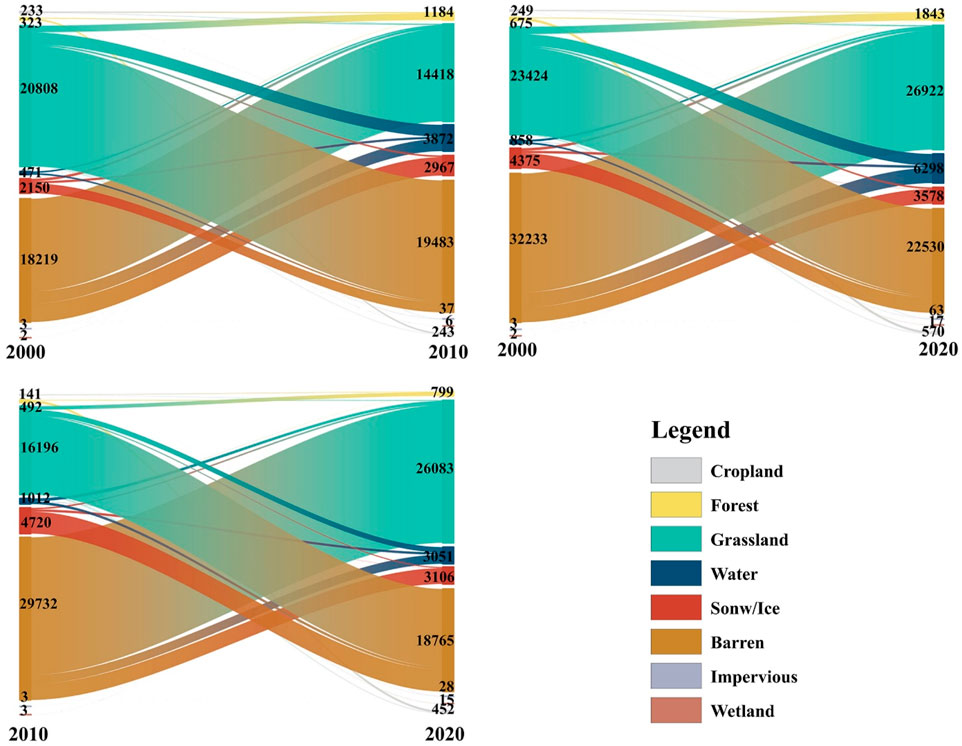
Figure 3. Land use transition matrix of key ecological function zones in Xizang from 2000 to 2020.
3.2 Ecosystem service value
Figure 4 shows the ESV of key ecological function zones in Xizang from 2000 to 2020. According to the secondary classification standards of ecosystem services, the value distribution is observed. In terms of land use types, the ESV of grassland is significantly higher than that of other land types. Additionally, the value of each land type changes differently over time.
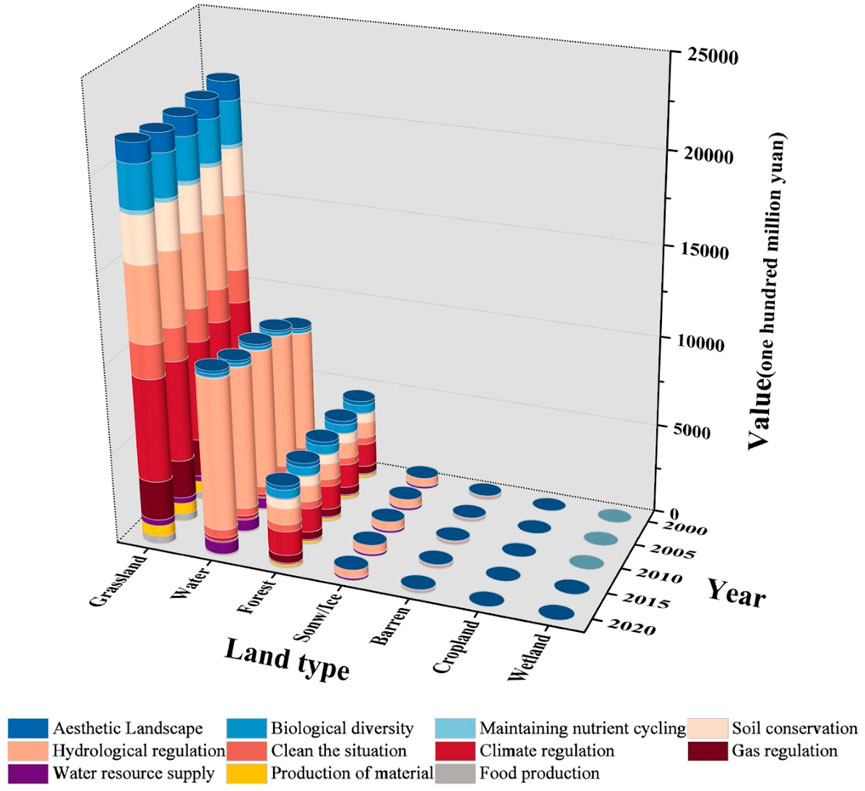
Figure 4. Ecosystem service value of different land types in Xizang from 2000 to 2020.
From Figure 4, it can be observed that the total ESV of the key ecological function zones in Xizang has shown a positive growth trend over the past 20 years (Supplementary Table S4). It increased from 3,548.205 billion yuan in 2000 to 3,769.702 billion yuan in 2020. The growth in ESV over these 20 years was 221.496 billion yuan, representing a growth rate of 6.24%. Analyzing by land use type, from 2000 to 2020, the ESV of water bodies had the highest growth, increasing by 205.61 billion yuan. Wetlands had the highest growth rate at 346.76%. The ESV of ice and snow decreased the most, declining by 2.463 billion yuan, while unused land had the highest reduction rate at −7.95%. In terms of contribution rate, grassland contributed approximately 60% to the ESV, but its contribution rate has been slowly declining over time. Although water bodies account for a small proportion of the land use area, they provide a relatively high amount of ESV. With about 3% of the land use area, water bodies contribute around 30% of the ESV. Forest land contributes 12.6% of the ESV. Unused land accounts for approximately 14% of the land use area, but it only provides around 0.6% of the ESV.
3.3 County-level ecosystem service value
Figures 5, 6 illustrate the ESV and their changes at the County level in key ecological function zones in Xizang from 2000 to 2020 (Supplementary Table S5), highlighting the effectiveness and challenges of ecological protection and compensation. Firstly, the Northwestern Xizangan Plateau Qiangtang Desert Ecological Function Zone has the highest ESV, with Shuanghu ranking first, followed by Gêrzê. This region also exhibits the highest rate of change in ESV, particularly significant from 2015 to 2020, indicating that ecological protection and compensation measures have been highly effective, providing crucial habitats for wildlife and holding significant social and environmental value. Secondly, the three counties in the Southeastern Xizangan Plateau Edge Forest Ecological Function Zone have similar ESV, but different growth rates. Motuo shows a slight increase, while Zayü and Cuona show small declines, with Cuona experiencing a more significant decrease, leading to a slight overall decline in ESV. Despite this, the region’s ecological value is reflected in its strategic reserve of unique ecological locations and biological resources, serving as an important genetic repository for species in China. Thirdly, the Western Ngari Land Desertification Prevention Zone and the Northern Chamdo Upper Reaches of Rivers Water Conservation Zone both show negative changes in ESV. Both counties in Ngari show a consistent downward trend. In Northern Chamdo, three of the four counties (Jiangda, Dingqing, and Leiwuqi) show a yearly decline in ESV, with only Gongjue showing a slight increase. The Southern Nyanchen Tanglha Mountains Water Conservation and Biodiversity Protection Zone and the Southwestern Qiangtang Plateau Desertification Prevention Zone both exhibit positive changes in ESV. In these zones, Damxung shows a positive rate of change, while Jiali shows a negative rate, resulting in a slight overall positive change. Cuoqin has a high ecosystem value and a significant rate of change, particularly notable between 2015 and 2020, reflecting the effectiveness of ecological transfer payments. Finally, the Upper Reaches of Lhasa River and the Central Himalaya Ecological Barrier Zone both show positive growth rates in ESV. Linzhou and Maizhokunggar in the Upper Lhasa River show positive growth rates, especially significant in Linzhou, while Maizhokunggar shows an initial increase followed by a decrease. In the Central Himalaya Ecological Barrier Zone, Zhongba has a high ESV with a positive growth rate. Overall, the western counties show significant growth in ESV, mainly contributing to the growth from 2015 to 2020. The eastern counties have lower growth rates, with some even experiencing negative growth. The Central Himalaya Ecological Barrier Zone shows uneven changes in ESV, indicating the complexity of the ecological environment in this area, requiring more coordinated and tailored protection measures to achieve balanced and long-term effective ecological transfer payments.
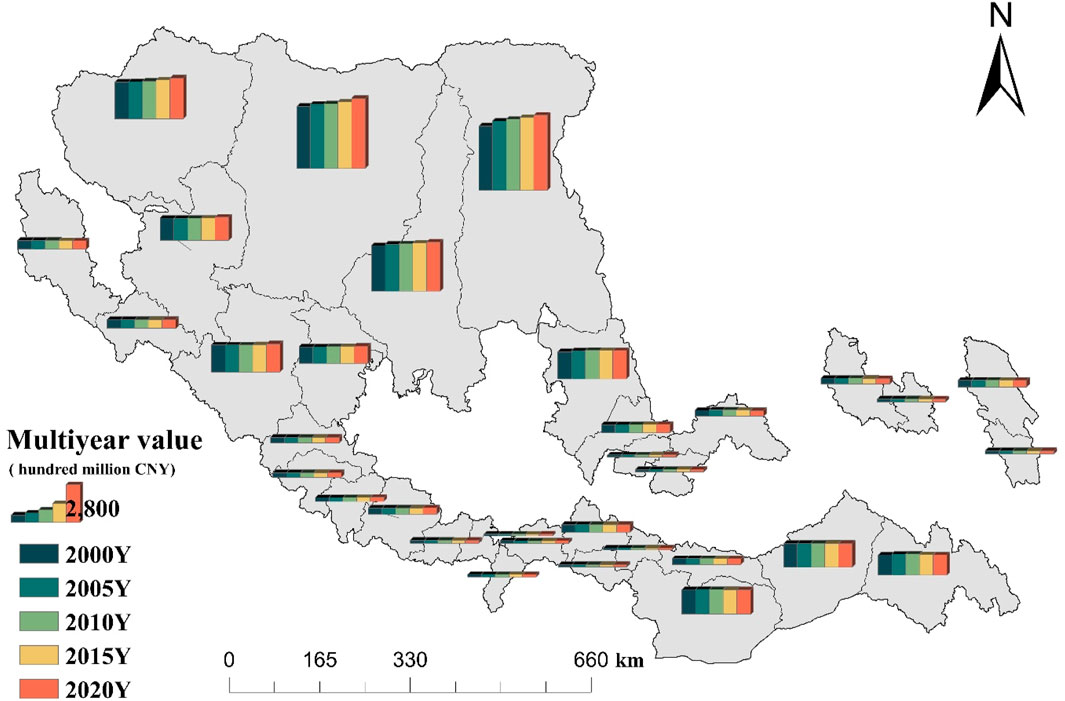
Figure 5. Spatial bar chart of county-level ESV in key ecological function zones in Xizang from 2000 to 2020.
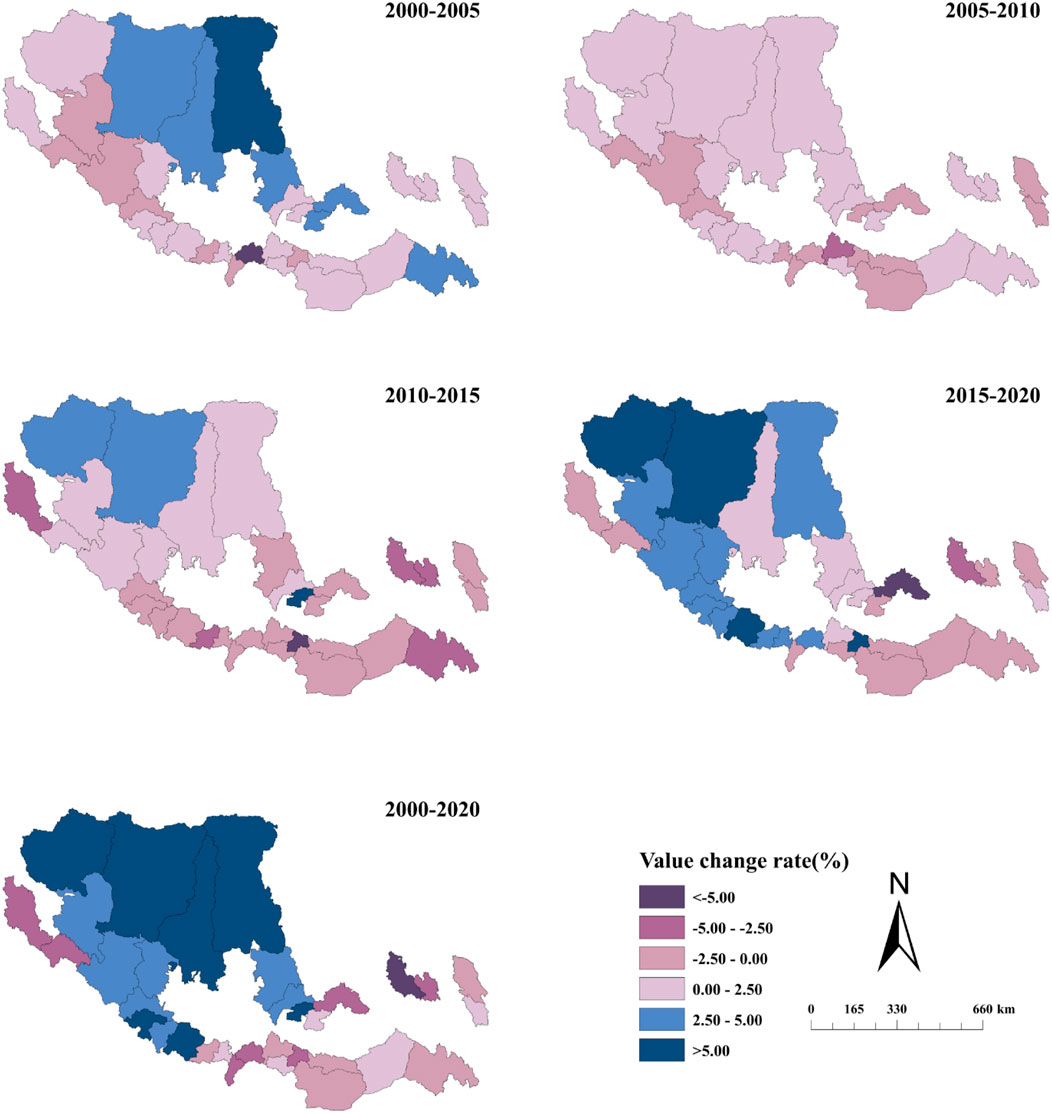
Figure 6. Changes in county-level ESV in key ecological function zones in Xizang from 2000 to 2020.
3.4 Grid-scale ecosystem service value
3.4.1 ESV classification
Using ArcGIS 10.2, a grid-scale analysis of ESV was conducted. Compared to the county-level scale, the grid-scale provides a more detailed spatial layout (Zhou et al., 2019). The 5-year grid-scale ESV and value classifications in the key ecological function zones of Xizang are shown in Figures 7, 8. The horizontal axis represents the eight key ecological function zones.
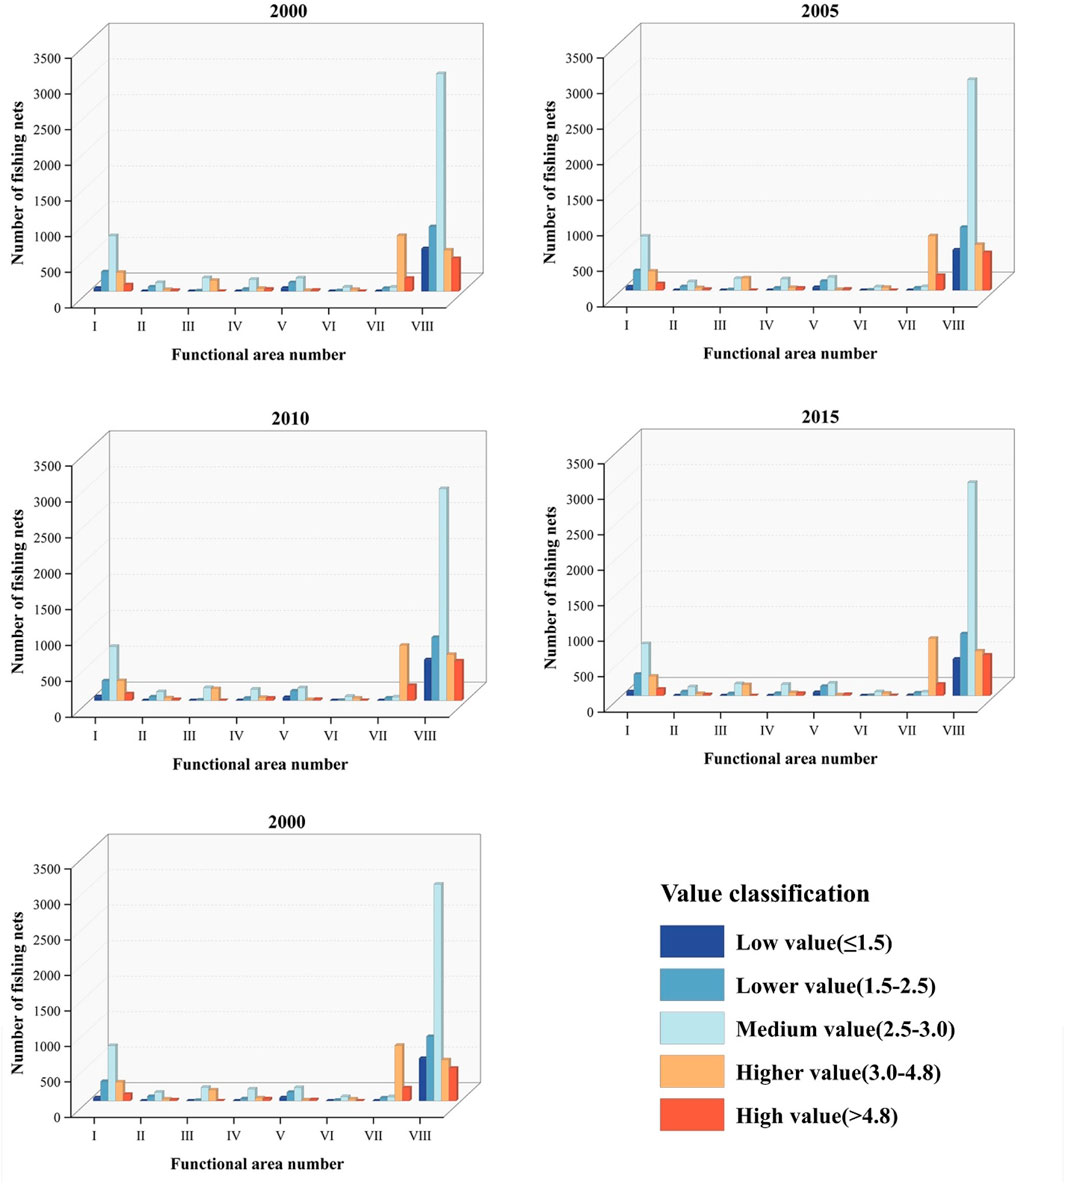
Figure 7. Stacked bar chart of five-year grid-scale ESV in key ecological function zones in Xizang.
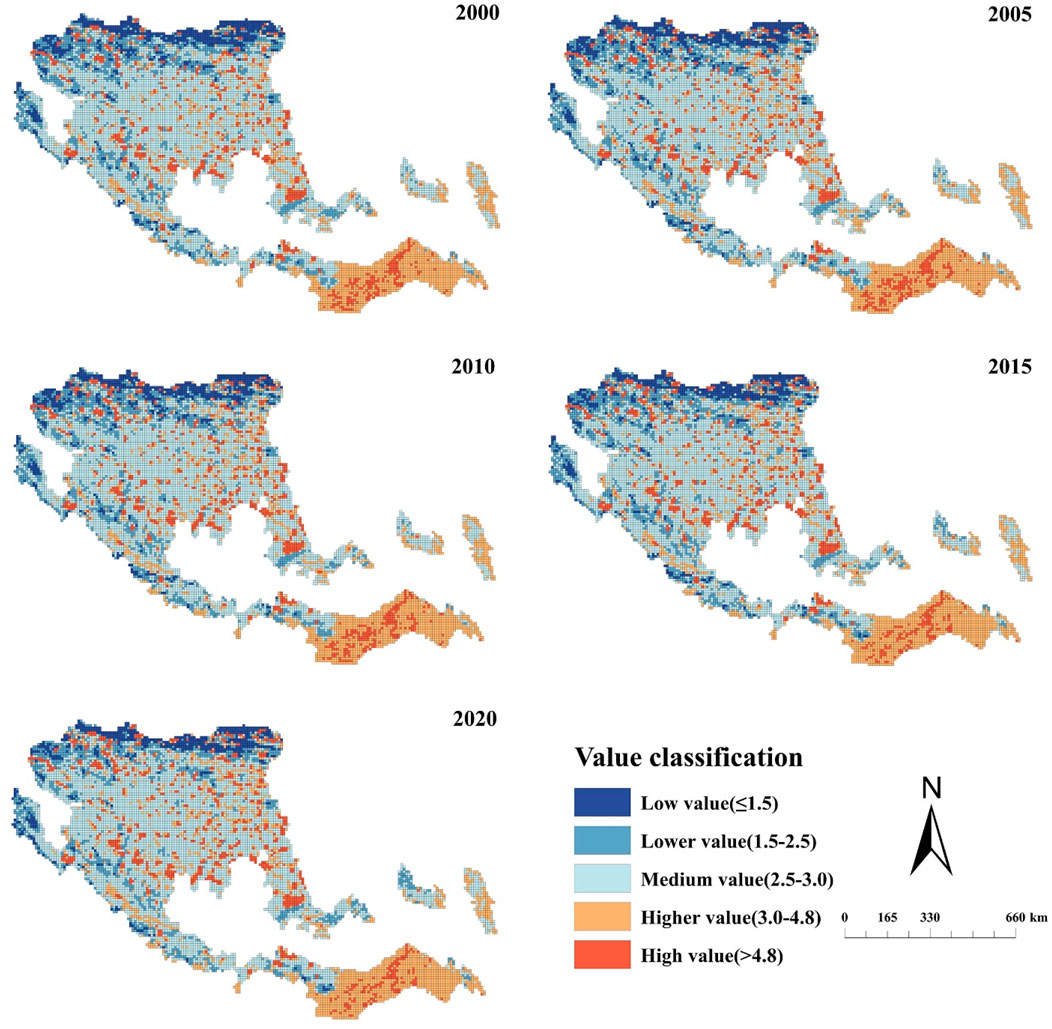
Figure 8. Five-year grid-scale ESV classification in key ecological function zones in Xizang.
The total number of grids in the Northwestern Xizangan Plateau Qiangtang Desert Ecological Function Zone accounts for a large proportion, while the number of grids in the Upper Reaches of the Lhasa River Water Conservation and Biodiversity Protection Zone is relatively small. This result is consistent with the aforementioned value analysis results. From a temporal perspective, the number of grids in the low and relatively low-value areas shows a decreasing trend over time. The number of grids in the medium and relatively high-value areas shows a fluctuating growth trend, while the number of grids in the high-value areas shows a trend of gradual increase. This indicates that under the ecological compensation in the key ecological function zones of Xizang, more and more low-value areas are gradually upgrading to high-value areas. However, in the Southern Nyanchen Tanglha Mountains Water Conservation and Biodiversity Protection Zone and the Northern Chamdo Upper Reaches of Rivers Water Conservation Zone, some high-value areas have decreased in value, moving into the low-value category. Other key ecological function zones are consistent with the overall trend, and the value increase in the grids of the Northwestern Tibetan Plateau Qiangtang Desert Ecological Function Zone is the most prominent, playing a significant role in boosting the overall ESV. This result is consistent with the previous analysis of ecosystem change rates.
3.4.2 Spatial correlation and heterogeneity
The above analysis reveals that the value connections between adjacent counties and grids in the key ecological function zones of Xizang are relatively close. Therefore, local spatial autocorrelation is used to reveal the spatial heterogeneity of grid values and the spatial relationship between a grid and its neighboring grids (Figure 9).
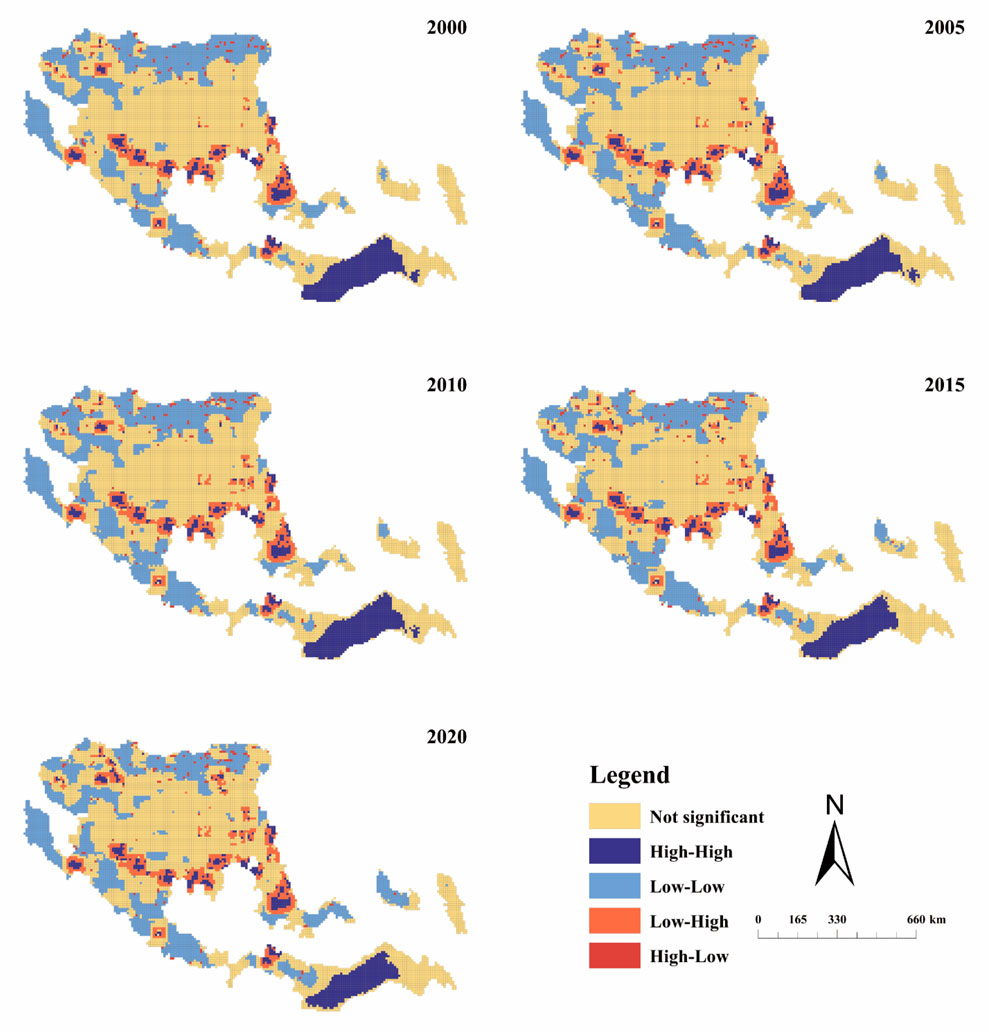
Figure 9. Five-year grid-scale ESV cluster map in key ecological function zones in Xizang.
The research results are mainly divided into five categories: not significant, high-high, low-low, low-high, and high-low. “High-high” indicates that a grid with a high value is surrounded by grids with high values. “High-low” indicates that a grid with a high value is surrounded by grids with low values. “Not significant” indicates that there is no correlation between the value of a grid and the values of the surrounding grids.
The local correlation of grid values in the key ecological function zones of Xizang is mainly insignificant. The low-low areas are relatively large and dispersed, primarily located in the western part of the key ecological function zones. Compared to 2000, their distribution is more scattered, mainly separated by insignificant areas.
The Southeastern Tibetan Plateau Edge Forest Ecological Function Zone mainly exhibits high-high value clusters, with strong local correlation in Cuona County and Motuo County, while Zayü County has shifted from partial correlation to insignificance, and the overall area of local correlation has gradually decreased over time. High-high areas are also distributed in the central part of the key ecological function zones, coinciding with the main distribution areas of water bodies, indicating a high ecological value correlation in water body areas, which significantly influence the surrounding regions.
The low-high areas are mainly distributed around the high-high water body regions. Based on the conservation role of water resources for other ecological resources, this results in high ecological values in the surrounding areas. Overall, during the development process from 2000 to 2020, the area of local correlation in Xizang has decreased, gradually being replaced by insignificant areas. This indicates that the ecological transfer payment policies in Xizang have made balanced plans for the internal environmental development of key ecological function zones, gradually evolving into balanced development. The local correlation of high-high water body areas remains stable, and the conservation role of water resources has been effectively utilized.
3.5 Non-market value and ecological compensation
3.5.1 Non-market value of key ecological function zones in Xizang
Based on the non-market value table of key ecological function zones in Xizang in 2020 (Figures 10a,b), it can be seen that areas with high non-market ESV per unit area are mainly distributed in the western key ecological function zones, with values greater than 50,000 yuan per hectare (Supplementary Table S6). These areas have high support service values and much higher regulation service values compared to other key ecological function zones. The vegetation primarily consists of herbaceous plants and low shrubs, such as wild yak grass, deer hoof grass, and short awn grass, with wild yak grass being the dominant species. Due to the sparse ground cover, the vegetation is relatively sparse and single-species, leading to problems such as grassland degradation, land desertification, and reduced vegetation due to land desertification. This not only affects the development of animal husbandry and the sustainability of agricultural production but also disrupts ecological balance and biodiversity, necessitating strong ecological protection measures. Therefore, the non-market value of the ecosystem in this area is high.
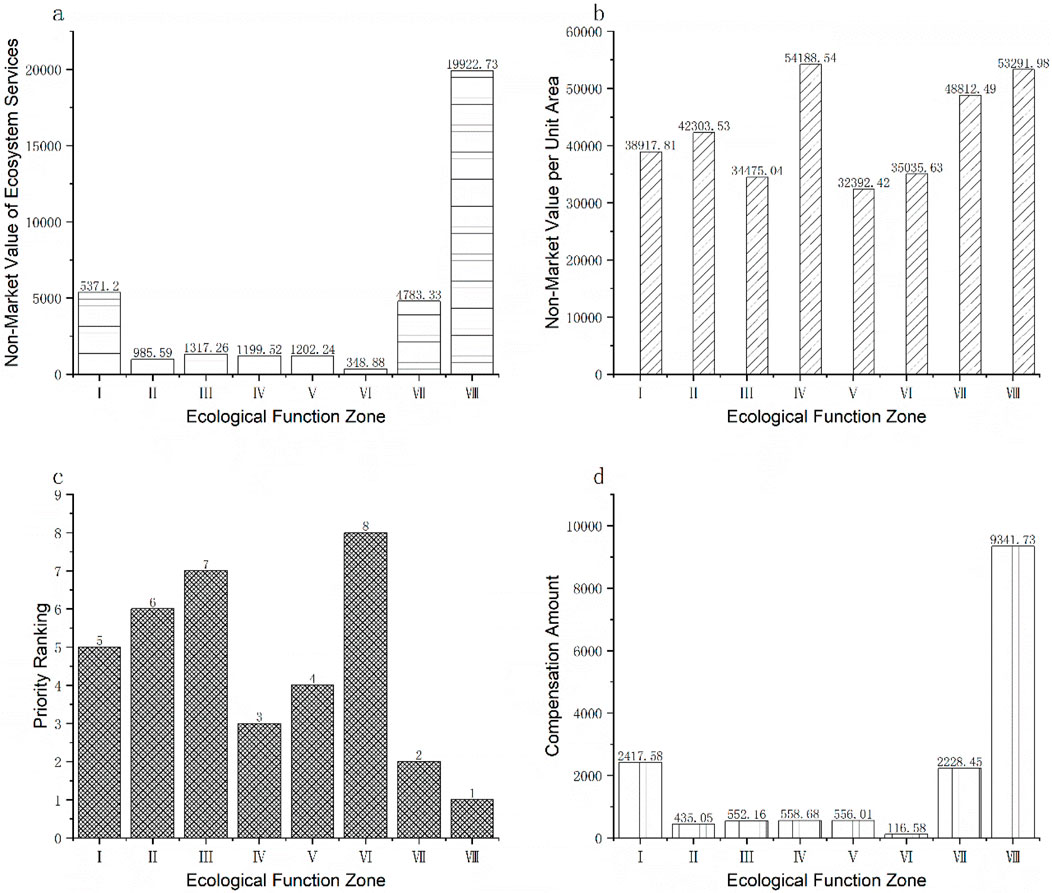
Figure 10. Non-market value and ecological compensation of key ecological function zones in Xizang. (a) Non-market value of ecosystem services in each zone; (b) Non-market value per unit area; (c) Ecological compensation priority ranking; (d) Theoretical ecological compensation amount.
The Southeastern Tibetan Plateau Edge Forest Ecological Function Zone mainly reflects high support service values. Despite the fragile forest ecological environment, the central and southern Tibetan alpine meadows and forests are significant ecological resources, including many rare plant and animal species. Forest resources also have important economic and ecological value.
The Northern Chamdo Upper Reaches of Rivers Water Conservation Zone, the Western Ngari Land Desertification Prevention Zone, and the Upper Reaches of the Lhasa River Water Conservation and Biodiversity Protection Zone all have non-market values per unit area less than 36,000 yuan per hectare. As one of Asia’s primary water sources, Xizang has many renowned rivers and lakes, resulting in lower non-market values provided by the ecosystem in these areas. Regions near water resources have higher economic development levels, and the ESV are more easily converted into market circulation value, hence higher provisioning value and lower non-market value.
3.5.2 Priority analysis of key ecological function zones in Xizang
According to the 2020 ecological compensation priority of key ecological function zones in Xizang (Figure 10c), ecological compensation is divided into three priority levels. The Northwestern Tibetan Plateau Qiangtang Desert Ecological Function Zone is considered the top priority for ecological compensation and is given priority compensation. This zone includes the counties of Rutog, Ge’gyai, and Gêrzê, located in the northern part of Ngari. Due to the lowest GDP per unit area, its ecological priority is extremely high. The Southwestern Qiangtang Plateau Land Desertification Prevention Zone, the Southeastern Tibetan Plateau Edge Forest Ecological Function Zone, and the Western Ngari Land Desertification Prevention Zone are classified as second priority. As key ecological function zones in Xizang, they bear the core responsibility of maintaining ecological security, leading to some loss in economic development. Due to the relatively low GDP per unit area, their economic growth rate is relatively slow, presenting a significant contradiction between ecological protection and economic growth.
The third priority includes the Central Himalaya Ecological Barrier Zone, the Southern Nyanchen Tanglha Mountains Water Conservation and Biodiversity Protection Zone, the Northern Chamdo Upper Reaches of Rivers Water Conservation Zone, and the Upper Reaches of the Lhasa River Water Conservation and Biodiversity Protection Zone. Among these, the zone with the lowest ECPS value is the Upper Reaches of the Lhasa River Water Conservation and Biodiversity Protection Zone. Despite having a relatively high GDP per unit area, its non-market value is not significant, hence its lower priority. This indicates that the coordinated benefits of ecological protection and regional economic development are higher in these key ecological function zones.
3.5.3 Analysis of ecological compensation amounts in Xizang
The theoretical ecological compensation amount for Xizang in 2020 (Figure 10d) is approximately 1.6 trillion yuan. The ecological compensation amount for the Northwestern Tibetan Plateau Qiangtang Desert Ecological Function Zone is in the high-value region, actually exceeding half of the total ecological compensation amount. Key ecological function zones with higher ecological compensation amounts include the Central Himalaya Ecological Barrier Zone and the Southeastern Tibetan Plateau Edge Forest Ecological Function Zone. Those with lower amounts include the Southwestern Qiangtang Plateau Land Desertification Prevention Zone, the Western Ngari Land Desertification Prevention Zone, the Northern Chamdo Upper Reaches of Rivers Water Conservation Zone, and the Southern Nyanchen Tanglha Mountains Water Conservation and Biodiversity Protection Zone. Compared with high-priority zones such as the Northwestern Qiangtang Plateau, these areas show significantly lower ecological compensation needs. This is mainly due to their relatively higher GDP per unit area and lower non-market ecosystem service values, which indicate a stronger ability to balance ecological protection with economic development. However, despite the lower compensation amounts, these regions still play a crucial role in maintaining regional ecological stability, suggesting that compensation schemes should not only consider the absolute amount but also ensure the continuity of support for long-term ecological protection. The compensation amount for the Upper Reaches of the Lhasa River Water Conservation and Biodiversity Protection Zone accounts for 0.7% of the total ecological compensation, indicating that Lhasa has given considerable attention to ecological protection while developing its economy. The other four key ecological function zones each account for about 3% of the total ecological compensation. These zones have high non-market ESV and high GDP per unit area, showing high coordination between economic development and ecological protection.
Comparing these research results with the actual compensation schemes implemented by national public authorities reveals that the actual ecological compensation funds need to be further strengthened to match the ecological compensation required for the protection of the ecological environment and the economic sacrifices made by the local areas.
4 Discussion and research limitations
4.1 Discussion
4.1.1 Land use changes and their driving factors
This study reveals significant land use changes in the Xizang Autonomous Region over the past two decades. Grassland remains the primary land type, accounting for over 70% of the area, and exhibits a “U”-shaped growth trend. This pattern reflects both early degradation and subsequent ecological recovery, highlighting the effectiveness of governmental ecological protection policies—particularly following the Fifth Central Xizang Work Forum in 2010, after which restoration efforts were significantly intensified. In addition to ecological policies, broader socioeconomic dynamics have also played an important role in shaping land use trajectories. Regional population growth and migration—especially urban migration patterns—have increased demands for construction land and infrastructure, contributing to the expansion of built-up areas. Simultaneously, national and regional economic policies promoting development in western China, such as the Western Development Strategy, have stimulated investment in transportation, agriculture, and tourism, thereby intensifying land use pressures in certain ecological zones. Moreover, climate change has led to the shrinkage of glaciers and permanent snow cover, resulting in both direct landscape transformation and hydrological shifts that indirectly affect ecosystems. Wetlands, which show the highest degree of land use change, are particularly sensitive to both climatic fluctuations and anthropogenic interventions, underscoring the need for integrated conservation approaches that consider both environmental and socioeconomic drivers.
4.1.2 Ecosystem service value dynamics and spatial patterns
This study employs the equivalent factor method to dynamically assess the ESV of key ecological function zones in Xizang. The results indicate a continuous increase in total ESV from 35,482.05 billion yuan in 2000 to 37,697.02 billion yuan in 2020. Notably, although water bodies occupy a small area, their ESV is significant, contributing about 30% of the total value. This result highlights the crucial regulatory and supportive roles of water bodies in plateau ecosystems, echoing findings from other highland ecosystem studies.
Through grid-scale spatial analysis, this study provides a more detailed understanding of the distribution and changes in ESV (van Ree et al., 2017). The results show a decreasing trend in the number of grids in low and relatively low-value areas, while the number of grids in medium and relatively high-value areas fluctuates and the number of high-value grids gradually increases. This suggests that ecological compensation policies have positively impacted increasing ESV. The high-value grids in the Northwestern Tibetan Plateau Qiangtang Desert Ecological Function Zone are the most concentrated, significantly driving the overall ESV, which is closely related to strong ecological protection measures and financial investments in the region.
4.1.3 Ecological compensation priority and funding needs assessment
This study assesses the ecological compensation priority of each ecological function zone by calculating the ratio of non-market value to GDP (ECPS). The results indicate that the Northwestern Tibetan Plateau Qiangtang Desert Ecological Function Zone should receive priority compensation, given its lowest GDP per unit area and high non-market value of the ecosystem. This finding provides scientific support for prioritizing higher compensation for high-priority areas. The study also estimates the theoretical ecological compensation amount for Xizang in 2020 to be about 1.6 trillion yuan, with the Northwestern Tibetan Plateau Qiangtang Desert Ecological Function Zone accounting for more than half. However, the actual transfer payment funds to key ecological function zones were only 2.334 billion yuan, representing 1.44% of the theoretical amount, highlighting a significant gap between compensation funds and actual needs, which necessitates further optimization of the compensation mechanism. While this study focuses specifically on the Xizang Autonomous Region, the methodological framework, spatial analysis techniques, and ecological compensation prioritization model proposed herein are applicable to other ecologically sensitive regions across the Qinghai–Xizang Plateau. Given the Plateau’s shared biophysical characteristics—such as high elevation, ecosystem fragility, and limited socio-economic development—the findings of this study provide transferable insights for ecological compensation policy design and sustainable land management across similar high-altitude contexts. Incorporating such approaches into broader regional frameworks could enhance the comparability and scalability of compensation strategies. Future research may build upon this foundation by extending the spatial scope to the entire Qinghai–Xizang Plateau, thereby enabling more comprehensive assessments of trans-regional ecosystem service provision, ecological governance, and inter-jurisdictional policy coordination.
While ecological compensation frameworks are conceptually sound, their implementation faces practical challenges such as limited administrative capacity, fragmented governance, and weak stakeholder engagement—particularly in remote regions like Xizang. These issues highlight the need for stronger institutional support, policy continuity, and participatory mechanisms aligned with local development. In light of observed ecological changes, including wetland degradation and glacial retreat, proactive adaptation strategies are also essential. Ecosystem-based adaptation (EbA), early warning systems, and flexible land use planning can enhance resilience under climate stress. Additionally, though this study employs the equivalent factor method due to data constraints, tools like InVEST offer more detailed, function-based assessments. Integrating such models in future research can improve the precision and policy relevance of ecosystem service valuation and climate adaptation planning.
4.2 Research limitations and outlook
Future research should focus on the following areas to provide stronger scientific support and decision-making basis for the healthy and sustainable development of Xizang’s ecological environment:
The ECPS index—defined as the ratio of non-market ecosystem service value (ESV) to GDP per unit area—serves as a simple yet policy-relevant proxy for identifying ecological compensation priorities. It emphasizes regions with high ecological contributions but limited economic capacity. While ECPS highlights undervalued non-market services, it does not account for ecological dimensions such as biodiversity, integrity, or vulnerability. Thus, it should be viewed as a baseline indicator. Future studies could enhance its robustness by integrating additional indices like ecological sensitivity, habitat connectivity, or multi-criteria frameworks to better reflect complex socio-ecological dynamics. Additionally, we acknowledge the need for sensitivity analysis in estimating the standard equivalent (D) used in the value coefficient table. While this study relied on the multi-year average yield to mitigate volatility, this method may obscure year-specific variations that could influence ESV estimates. Employing annual per-unit cultivated land outputs to recalculate D could reveal the extent to which ESV outcomes are sensitive to fluctuations in agricultural productivity. Incorporating such sensitivity tests in future research would enhance the methodological robustness and provide policymakers with more adaptive and dynamic compensation estimates.
Due to the vast area and complex terrain of the key ecological function zones in Xizang, this study has limitations in the precision of remote sensing data. Most current studies use primary land use types, and this study also adopts primary land use types, which limits the accuracy of medium and small-scale studies. Future research should conduct more detailed analyses of land use types and interpret secondary land use types through remote sensing technology to more accurately reflect the internal structure of various land uses. This will help in more precise assessments of the contributions of different land types to ESV.
The current understanding of the internal structure and functional characteristics of ecosystems in key ecological function zones is still insufficient, and the evaluation methods have certain shortcomings. Future research should further understand the internal characteristics of key ecological function zones to more scientifically calculate ecological values. By using multidisciplinary approaches, integrating theories and techniques from ecology, economics, and sociology, a more comprehensive understanding of the dynamic changes and driving factors of ESV can be achieved.
Although the ecological compensation prioritization method adopted in this study—specifically the ECPS index—offers a policy-relevant and analytically transparent approach, we acknowledge that it represents a simplified proxy for complex ecological and socio-economic dynamics. The ECPS index effectively captures the imbalance between non-market ecological service provision and regional economic capacity, providing a rational basis for identifying priority areas. However, its reliance on a single ratio may overlook other critical dimensions of ecological significance, such as biodiversity richness, ecosystem vulnerability, landscape connectivity, and exposure to climate-related risks. Additionally, the prioritization results may be affected by data scale, spatial aggregation, and assumptions inherent in non-market valuation techniques.
In recognition of these limitations, we have discussed the need for methodological diversification in ecological compensation assessment. Current literature increasingly advocates for integrated frameworks combining multiple valuation techniques—such as the opportunity cost method, ecological footprint analysis, and willingness-to-pay approaches—to more comprehensively reflect ecological values and societal preferences. Building on the foundation established in this study, future research should incorporate multi-criteria evaluation (MCE), ecological risk modeling, and stakeholder-informed tools (e.g., pressure–state–response frameworks) to improve the robustness, precision, and practical relevance of compensation schemes. Such enhancements will contribute to more scientifically grounded and context-sensitive policy design, supporting the efficient allocation of compensation funds and the coordination of ecological protection with regional development goals.
5 Conclusion
5.1 Land use changes
In terms of land use, grassland is the primary land type in the key ecological function zones of Xizang, accounting for as much as 70% and showing a “U”-shaped growth trend. The areas of other land use types have generally increased over time, with only ice and unused land showing a year-by-year decline, primarily due to the impact of global warming. In terms of land use dynamics, the growth rates of forest and grassland are both less than 0.1%, with insignificant changes over 5-year periods, but their total areas remain high. Wetlands have an overall dynamic degree of 17.34%, with the greatest changes over 5-year periods, highlighting their importance and sensitivity in the ecosystem.
5.2 ESV
Regarding ESV, the total ESV of the key ecological function zones in Xizang has shown a growing trend over the past 20 years. Water bodies have the highest increase in ecological value, wetlands have the highest growth rate, ice and snow have the largest decrease in ecological value, and unused land has the highest rate of decrease in ESV. Although water bodies occupy a small proportion of the area, they contribute significantly to the ecological value. From a county-level perspective, the overall ESV of Bange County, Nyima County, and Shuanghu County in Nagqu City, as well as Ritog County, Ge’gyai County, and Gêrzê County in Ngari Prefecture, are significantly higher than those in other major ecological function zones. In contrast, the overall value of the Upper Reaches of Lhasa River Water Conservation and Biodiversity Protection Zone is relatively low.
5.3 Grid-scale and spatial autocorrelation
In terms of grid values, the number of grids in low and relatively low-value areas shows a decreasing trend, while those in medium, relatively high, and high-value areas show an increasing trend. This indicates that ecological protection and compensation policies have effectively improved the ecological environment, further enhancing the value of ecosystem services. Grid values are mainly concentrated in the Northwestern Tibetan Plateau Qiangtang Desert Ecological Function Zone, significantly boosting the overall ecological value. Regarding local spatial autocorrelation of grid values, the locally correlated area in Xizang has decreased, gradually being replaced by insignificant areas, showing that the ecological transfer payment policy since 2008 has balanced the internal environment and promoted balanced development within key ecological function zones. Additionally, the local correlation of high-high water body areas remains stable, and the conservation role of water resources is effectively utilized.
5.4 Ecological compensation priority and amount
In terms of non-market value, high-value areas of ecosystem service per unit area are mainly distributed in the western key ecological function zones, such as the Northwestern Tibetan Plateau Qiangtang Desert Ecological Function Zone and the Southwestern Qiangtang Plateau Desertification Prevention Zone. The ranking of GDP does not fully align with the ranking of non-market value, indicating that policy formulation and implementation should place greater emphasis on ecological value, favoring areas with high ESV. The compensation priorities are higher for the Northwestern Tibetan Plateau Qiangtang Desert Ecological Function Zone and the Southeastern Tibetan Plateau Edge Forest Ecological Function Zone. Although the non-market value of ecosystem services in the Southwestern Qiangtang Plateau Desertification Prevention Zone is higher than that of the Southeastern Xizangan Plateau Edge Forest Ecological Function Zone, its priority is lower when considering regional GDP, indicating that ecological compensation priorities depend not only on ESV but also on economic development and actual needs. The theoretical ecological compensation amount for the Xizang Autonomous Region in 2020 is about 1.6 trillion yuan, with the Northwestern Tibetan Plateau Qiangtang Desert Ecological Function Zone accounting for more than half. In contrast, the compensation amount for the Upper Reaches of Lhasa River Water Conservation and Biodiversity Protection Zone is relatively low, accounting for less than 1%. The actual transfer payment to key ecological function zones was 2.334 billion yuan, accounting for 1.44%, indicating a significant gap between ecological compensation funds and actual needs in Xizang’s key ecological function zones, necessitating further optimization and strengthening of the compensation mechanism.
Data availability statement
The original contributions presented in the study are included in the article/Supplementary Material, further inquiries can be directed to the corresponding author.
Author contributions
QD: Resources, Data curation, Methodology, Software, Funding acquisition, Writing – original draft, Investigation, Formal Analysis, Writing – review and editing, Conceptualization. LL: Visualization, Validation, Project administration, Supervision, Writing – review and editing.
Funding
The author(s) declare that financial support was received for the research and/or publication of this article. This study was supported by Xizang University Graduate High-level Talent Training Program “Xizang Ecological Compensation Finance Payment” (Project ID:2020-GSP-B035).
Acknowledgments
The authors would like to express their sincere gratitude to the Xizang University Graduate High-level Talent Training Program. This support was instrumental in facilitating the data collection, field investigation, and analytical work carried out in this study.
Conflict of interest
The authors declare that the research was conducted in the absence of any commercial or financial relationships that could be construed as a potential conflict of interest.
Generative AI statement
The author(s) declare that no Generative AI was used in the creation of this manuscript.
Publisher’s note
All claims expressed in this article are solely those of the authors and do not necessarily represent those of their affiliated organizations, or those of the publisher, the editors and the reviewers. Any product that may be evaluated in this article, or claim that may be made by its manufacturer, is not guaranteed or endorsed by the publisher.
Supplementary material
The Supplementary Material for this article can be found online at: https://www.frontiersin.org/articles/10.3389/fenvs.2025.1648758/full#supplementary-material
References
As’ad, N., Patrício, L., Koskela-Huotari, K., and Edvardsson, B. (2024). Understanding service ecosystem dynamics: a typology. J. Serv. Manag. 35 (6), 159–184. doi:10.1108/josm-07-2023-0322
Barile, S., Lusch, R., Reynoso, J., Saviano, M., and Spohrer, J. (2016). Systems, networks, and ecosystems in service research. J. Serv. Manag. 27 (4), 652–674. doi:10.1108/josm-09-2015-0268
Barot, S., Yé, L., Abbadie, L., Blouin, M., and Frascaria-Lacoste, N. (2017). Ecosystem services must tackle anthropized ecosystems andecological engineering. Ecol. Eng. 99, 486–495. doi:10.1016/j.ecoleng.2016.11.071
Bennett, E. M., Peterson, G. D., and Gordon, L. J. (2009). Understanding relationships among multiple ecosystem services. Ecol. Lett. 12 (12), 1394–1404. doi:10.1111/j.1461-0248.2009.01387.x
Berglihn, E. C., and Gómez-Baggethun, E. (2021). Ecosystem services from urban forests: the case of Oslomarka, Norway. Ecosyst. Serv. 51, 101358. doi:10.1016/j.ecoser.2021.101358
Boerema, A., Rebelo, A. J., Bodi, M. B., Esler, K. J., and Meire, P. (2017). Are ecosystem services adequately quantified? J. Appl. Ecol. 54 (2), 358–370. doi:10.1111/1365-2664.12696
Bolund, P., and Hunhammar, S. (1999). Ecosystem services in urban areas. Ecol. Econ. 29 (2), 293–301. doi:10.1016/s0921-8009(99)00013-0
Caputo, J., and Butler, B. (2017). Ecosystem service supply and capacity on US family forestlands. Forests 8 (10), 395. doi:10.3390/f8100395
Chen, Z. X., and Zhang, X. S. (2000). Value of ecosystem services in China. Chin. Sci. Bull. 45 (10), 870–876. doi:10.1007/bf02886190
Cheng, X. Y., Fang, L., Mu, L., Li, J., and Wang, H. (2022). Watershed eco-compensation mechanism in China: policies, practices and recommendations. Water 14 (5), 777. doi:10.3390/w14050777
Chiaravalloti, R. M., Bolzan, F., Roque, F. D., and Biswas, S. (2022). Ecosystem services in the floodplains: socio-cultural services associated with ecosystem unpredictability in the Pantanal Wetland, Brazil. Aquatic Ecosyst. Health Manag. 25 (1), 72–80. doi:10.14321/aehm.025.01.72
Collier, M. J. (2014). Novel ecosystems and the emergence of cultural ecosystem services. Ecosyst. Serv. 9, 166–169. doi:10.1016/j.ecoser.2014.06.002
Comberti, C., Thornton, T. F., Echeverria, V. W., and Patterson, T. (2015). Ecosystem services or services to ecosystems? Valuing cultivation and reciprocal relationships between humans and ecosystems. Glob. Environ. Change-Human Policy Dimensions 34, 247–262. doi:10.1016/j.gloenvcha.2015.07.007
Delgado, L. E., and Marín, V. H. (2015). Ecosystem services: where on earth? Ecosyst. Serv. 14, 24–26. doi:10.1016/j.ecoser.2015.03.002
Delphin, S., Escobedo, F. J., Abd-Elrahman, A., and Cropper, W. P. (2016). Urbanization as a land use change driver of forest ecosystem services. Land Use Policy 54, 188–199. doi:10.1016/j.landusepol.2016.02.006
Deng, H. B., Zheng, P., Liu, T. X., and Liu, X. (2011). Forest ecosystem services and eco-compensation mechanisms in China. Environ. Manag. 48 (6), 1079–1085. doi:10.1007/s00267-011-9742-0
Evers, C. R., Wardropper, C. B., Branoff, B., Granek, E. F., Hirsch, S. L., Link, T. E., et al. (2018). The ecosystem services and biodiversity of novel ecosystems: a literature review. Glob. Ecol. Conservation 13, e00362. doi:10.1016/j.gecco.2017.e00362
Feng, Z., Cui, Y. Z., Zhang, H. B., and Gao, Y. (2018). Assessment of human consumption of ecosystem services in China from 2000 to 2014 based on an ecosystem service footprint model. Ecol. Indic. 94, 468–481. doi:10.1016/j.ecolind.2018.07.015
Field, J. M., Fotheringham, D., Subramony, M., Gustafsson, A., Ostrom, A. L., Lemon, K. N., et al. et al. (2021). Service research priorities: designing sustainable service ecosystems. J. Serv. Res. 24 (4), 462–479. doi:10.1177/10946705211031302
Granek, E. F., Polasky, S., Kappel, C. V., Reed, D. J., Stoms, D. M., Koch, E. W., et al. (2010). Ecosystem services as a common language for coastal ecosystem-based management. Conserv. Biol. 24 (1), 207–216. doi:10.1111/j.1523-1739.2009.01355.x
Hasan, S. S., Zhen, L., Miah, M. G., Ahamed, T., and Samie, A. (2020). Impact of land use change on ecosystem services: a review. Environ. Dev. 34, 100527. doi:10.1016/j.envdev.2020.100527
Hein, L., van Koppen, C. S. A., van Ierland, E. C., and Leidekker, J. (2016). Temporal scales, ecosystem dynamics, stakeholders and the valuation of ecosystems services. Ecosyst. Serv. 21, 109–119. doi:10.1016/j.ecoser.2016.07.008
Jiang, H. Q., Wu, W. J., Wang, J. N., Yang, W. S., Gao, Y. M., Duan, Y., et al. (2021). Mapping global value of terrestrial ecosystem services by countries. Ecosyst. Serv. 52, 101361. doi:10.1016/j.ecoser.2021.101361
Kandziora, M., Burkhard, B., and Müller, F. (2013). Interactions of ecosystem properties, ecosystem integrity and ecosystem service indicators-A theoretical matrix exercise. Ecol. Indic. 28, 54–78. doi:10.1016/j.ecolind.2012.09.006
La Notte, A., Czúcz, B., Vallecillo, S., Polce, C., and Maes, J. (2022). Ecosystem condition underpins the generation of ecosystem services: an accounting perspective. One Ecosyst. 7, e81487. doi:10.3897/oneeco.7.e81487
Lee, J. H., Park, H. J., Kim, I., and Kwon, H. S. (2020). Analysis of cultural ecosystem services using text mining of residents' opinions. Ecol. Indic. 115, 106368. doi:10.1016/j.ecolind.2020.106368
Li, Z. D., Su, B. R., and Liu, M. C. (2022). Research progress on the theory and practice of Grassland eco-compensation in China. Agriculture-Basel 12 (5), 721. doi:10.3390/agriculture12050721
Lin, J. C., Chiou, C. R., Chan, W. H., and Wu, M. S. (2021). Valuation of forest ecosystem services in Taiwan. Forests 12 (12), 1694. doi:10.3390/f12121694
Liu, C. L., Liu, W. D., Lu, D. D., Chen, M. X., Dunford, M., and Xu, M. (2016). Eco-compensation and harmonious regional development in China. Chin. Geogr. Sci. 26 (3), 283–294. doi:10.1007/s11769-015-0758-x
Liu, M. C., Yang, L., Bai, Y. Y., and Min, Q. W. (2018). The impacts of farmers’ livelihood endowments on their participation in eco-compensation policies: globally important agricultural heritage systems case studies from China. Land Use Policy 77, 231–239. doi:10.1016/j.landusepol.2018.05.054
Matthies, B. D., D'Amato, D., Berghäll, S., Ekholm, T., Hoen, H. F., Holopainen, J., et al. (2016). An ecosystem service-dominant logic? - integrating the ecosystem service approach and the service-dominant logic. J. Clean. Prod. 124, 51–64. doi:10.1016/j.jclepro.2016.02.109
Mitchell, M. G. E., Suarez-Castro, A. F., Martinez-Harms, M., Maron, M., McAlpine, C., Gaston, K. J., et al. (2015). Reframing landscape fragmentation’s effects on ecosystem services. Trends Ecol. Evol. 30 (4), 190–198. doi:10.1016/j.tree.2015.01.011
Pan, Y., Wu, J. X., Zhang, Y. J., Zhang, X. Z., and Yu, C. Q. (2021). Simultaneous enhancement of ecosystem services and poverty reduction through adjustments to subsidy policies relating to grassland use in Tibet, China. Ecosyst. Serv. 48, 101254. doi:10.1016/j.ecoser.2021.101254
Potschin, M. B., and Haines-Young, R. H. (2011). Ecosystem services: exploring a geographical perspective. Prog. Phys. Geogr. Environ. 35 (5), 575–594. doi:10.1177/0309133311423172
Rau, A. L., Burkhardt, V., Dorninger, C., Hjort, C., Ibe, K., Kessler, L., et al. (2020). Temporal patterns in ecosystem services research: a review and three recommendations. Ambio 49 (8), 1377–1393. doi:10.1007/s13280-019-01292-w
Schröter, M., Kraemer, R., Mantel, M., Kabisch, N., Hecker, S., Richter, A., et al. (2017). Citizen science for assessing ecosystem services: status, challenges and opportunities. Ecosyst. Serv. 28, 80–94. doi:10.1016/j.ecoser.2017.09.017
Serna-Chavez, H. M., Schulp, C. J. E., van Bodegom, P. M., Bouten, W., Verburg, P. H., and Davidson, M. D. (2014). A quantitative framework for assessing spatial flows of ecosystem services. Ecol. Indic. 39, 24–33. doi:10.1016/j.ecolind.2013.11.024
Smith, T., Bulkan, J., Zerriffi, H., and Tansey, J. (2019). Indigenous peoples, local communities, and payments for ecosystem services. Can. Geogr. Can. 63 (4), 616–630. doi:10.1111/cag.12553
Thomas, A., Masante, D., Jackson, B., Cosby, B., Emmett, B., and Jones, L. (2020). Fragmentation and thresholds in hydrological flow-based ecosystem services. Ecol. Appl. 30 (2), e02046. doi:10.1002/eap.2046
van Ree, C., van Beukering, P. J. H., and Boekestijn, J. (2017). Geosystem services: a hidden link in ecosystem management. Ecosyst. Serv. 26, 58–69. doi:10.1016/j.ecoser.2017.05.013
Wang, Z. Z., Mao, X. Q., Zeng, W. H., Xie, Y. X., and Ma, B. R. (2020). Exploring the influencing paths of natives' conservation behavior and policy incentives in protected areas: evidence from China. Sci. Total Environ., 744. doi:10.1016/j.scitotenv.2020.140123
Xie, R. R., Pang, Y., Li, Z., Zhang, N. H., and Hu, F. J. (2013). Eco-compensation in multi-district river networks in north Jiangsu, China. Environ. Manag. 51 (4), 874–881. doi:10.1007/s00267-012-9992-5
Yu, Z., Song, C. W., and Du, H. S. (2024). Dynamic changes in ecosystem service value and ecological compensation in original continuous poverty-stricken areas of China. Sustainability 16 (10), 3947. doi:10.3390/su16103947
Zhang, B. A., Li, W. H., and Xie, G. D. (2010). Ecosystem services research in China: progress and perspective. Ecol. Econ. 69 (7), 1389–1395. doi:10.1016/j.ecolecon.2010.03.009
Zhang, Y. X., Guan, D. J., Wu, L., Su, X. Y., Zhou, L. L., and Peng, G. C. (2022). How can an ecological compensation threshold be determined? A discriminant model integrating the minimum data approach and the most appropriate land use scenarios. Sci. Total Environ., 852.
Keywords: regional sustainable development, resource management, ecosystem service value, ecological compensation, ecosystem dynamics
Citation: Du Q and Li L (2025) Assessing ecosystem service value dynamics and compensation gaps in key ecological zones of Xizang: towards sustainable plateau development. Front. Environ. Sci. 13:1648758. doi: 10.3389/fenvs.2025.1648758
Received: 17 June 2025; Accepted: 30 July 2025;
Published: 11 August 2025.
Edited by:
Chong Jiang, Guangdong Academy of Science (CAS), ChinaReviewed by:
Li Wen, NSW Department of Planning, Industry and Environment, AustraliaLiu Kui, Xi’an Jiaotong University, China
Copyright © 2025 Du and Li. This is an open-access article distributed under the terms of the Creative Commons Attribution License (CC BY). The use, distribution or reproduction in other forums is permitted, provided the original author(s) and the copyright owner(s) are credited and that the original publication in this journal is cited, in accordance with accepted academic practice. No use, distribution or reproduction is permitted which does not comply with these terms.
*Correspondence: Lei Li, bC1saS0zZTRAZWFnbGUuc29waGlhLmFjLmpw