 Jasmin Fetzer1,2
 Sonia Meller1,2Hélène Iven2Denise Baur3Paula García Rivera2Alan Meller2
 Jörg Luster1*
- 1Swiss Federal Institute for Forest, Snow, and Landscape Research WSL, Birmensdorf, Switzerland
- 2Digit Soil, Adliswil, Switzerland
- 3Institute of Plant Nutrition, ETHZ Zurich, Zürich, Switzerland
Here we introduce a novel laboratory-independent Soil Enzymatic Activity Reader (SEAR). The assessment of extracellular enzymatic activity is based on the reaction of enzymes in a reactive layer of homogenized soil with fluorogenic substrates upon contact with an agarose gel in which they are dissolved. The reaction products are detected on the opposite side of the transparent gel by their fluorescence. Reaction plates with multiple gel compartments allow for the simultaneous assessment of several enzymes, including analytical replicates and suitable controls. We validated the new method by using sand, spiked with solutions of increasing concentrations of different enzymes. We further constrained the boundary conditions of operation, including limits of rate detection, precision, and the ranges of substrate concentrations, soil properties, and environmental conditions. We found our method to operate well for a wide range of different soils, comprising textures from sand to silty clay loam, acid forest soils with pH < 4 to carbonate containing agricultural soils, and soil organic carbon contents up to 18%. Furthermore, by successfully testing soil moistures from 2% to 173% of the respective water holding capacity and temperatures from 6 °C to 50 °C, we could show that measurements are possible under most conditions encountered in the field. We conclude that with SEAR, a novel device is available that allows fast, easy, and standardized measurements of extracellular enzymatic activity close to field conditions without laboratory access and thus without the need for storage and related sample pretreatments that may affect the results.
1 Introduction
Soil extracellular enzymes, also called abiontic enzymes, are key catalytic actors in the decomposition and mineralization of soil organic matter, and thus within the biogeochemical cycles of carbon and nutrients (Dick and Burns, 2011; Sinsabaugh and Shah, 2012). While mainly of microbial origin, they are also produced by plant roots and higher soil organisms. Enzymes whose activities are detectable by analytical methods comprise different ages and locations in soil. This ranges from enzymes that just have been released by living cells to those that were released to the soil a long time before and have been stabilized in the soil matrix, e.g., by sorption to clay surfaces or binding to soil organic matter (Dick and Burns, 2011). Throughout this paper we will refer to this measurable activity as extracellular enzymatic activity (EEA).
Since enzymatically catalyzed processes are directly linked to ecological functions such as the provision of nutrients, EEA are considered suitable indicators for the ability of soils to fulfill certain functions for soil health (Dick, 1997). There are two characteristics that make EEA particularly well suited for this task. Firstly, EEA are process- rather than compound-specific, i.e., enzymes catalyze reactions that cleave specific bonds (Wallenstein et al., 2011), and thus integrate over a variety of individual processes contributing to the same soil function. For instance, acid or alkaline phosphomonoesterases catalyze the hydrolysis of phospho-ester bonds in phospho-monoesters such as mononucleotides, sugar phosphates or lower-order inositol phosphates (Nannipieri et al., 2011) and thus contribute to the mineralization of organic phosphorus (P) which makes the P available to organisms as phosphate. This is even more emphasized when considering indicators based on the activity of more than one enzyme (Acosta-Martinez et al., 2018). Secondly, EEA are less sensitive to short-term fluctuations of soil environmental conditions and related processes compared to other indicators of biological activity, such as soil respiration (Vargas et al., 2011), because of the typically large contribution of stabilized enzyme pools remaining active up to several months (Schimel et al., 2017).
Therefore, they are particularly well suited to assess effects on soil biological activity by external factors such as management practices (Dick, 1997), disturbances (Geng et al., 2012), climatic factors (Burns et al., 2013; Fanin et al., 2022; Xiao et al., 2018; Zuccarini et al., 2022), or pollutants such as pesticides (Riah et al., 2014), heavy metals (Aponte et al., 2020) or microplastics (Fei et al., 2020).
Established methods to measure EEA can be grouped in two categories: slurry-based laboratory methods for determining EEA of individual soil samples (Nannipieri et al., 2018), and membrane-based soil zymography for two-dimensional mapping of small-scale heterogeneity of EEA (Bilyera and Kuzyakov, 2024; Razavi et al., 2019; Tegtmeier et al., 2021). Common to both groups of methods is that soil is exposed to an excess of artificial substrate, resulting in a measure of potential reaction rates of enzymes rather than actual rates with the natural substrates available in the soil.
Slurry-based methods can be further subdivided into classical bench-scale methods and microplate assays (Nannipieri et al., 2018). In both variants a representative amount of soil is suspended in a buffer solution or in water. In bench-scale methods, artificial substrate is then added to the whole slurry. After a specified incubation time, the suspension is filtered or centrifuged and the concentration of the reaction product is measured, most commonly colorimetrically (see several chapters in Dick R. P., 2011). Alternatively, the disappearance of the substrate could be measured, but this is generally more difficult to achieve (Dick W. A., 2011). In microplate assays, small aliquots of the stirred slurry are transferred to microplate wells. Fluorogenic substrate is added to the wells, and at specified incubation times, the fluorescence of the product is measured in presence of the soil using a plate reader (Deng et al., 2011; Marx et al., 2001). Usually, in microplate assays, time series of measurements are performed to constrain the time window of linear increase in product formation. With the availability of highly standardized protocols (e.g., Dick R. P., 2011), bench-scale methods ensure maximum comparability across studies and thus of different soils (Nannipieri et al., 2018). They are also less sensitive to small-scale heterogeneity of the samples than microplate assays. Nevertheless, and despite the need for higher technical replication, the latter methods generally allow for a higher throughput, especially if the activities of more than one enzyme are to be assessed. They also allow the measurement of EEA across a range of substrate concentrations to determine enzyme kinetics.
In soil zymography, a membrane impregnated with a fluorogenic substrate is applied to a soil surface, typically in a rhizobox or root window setting, to detect heterogeneity of EEA caused for instance by root-soil interactions in the rhizosphere (Bilyera and Kuzyakov, 2024; Meller et al., 2020; Razavi et al., 2019; Spohn and Kuzyakov, 2013) or by earthworm activity in the drilosphere (Hoang et al., 2016). After a specified incubation time, the membrane is removed from the soil, and the spatial distribution of fluorescence across the membrane is mapped by irradiation with a suitable light source and taking a photographic picture of the entire membrane. Newer developments of the method allow for constraining the linear increase of fluorescence by taking time-series of pictures while the membrane is in contact with the soil (“time-lapse” zymography; Guber et al., 2021).
The frameworks of the European Soil Strategy 2030 (European Commission, 2021) and related national strategies (e.g., Federal Office of the Environment, 2020) call for increasing efforts in assessing and mapping soil functions, promoted under the concept of “soil health”. Despite the crucial importance of biological actors for soil functions, soil biological indicators are still underrepresented in soil function assessments when compared to indicators based on chemical and physical soil properties. Despite their advantages as discussed above, EEA have been less frequently used than unspecific indicators of biological activity such as soil respiration or microbial biomass (Bünemann et al., 2018; Lehmann et al., 2020).
A major reason for the underrepresentation of EEA as a soil function indicator may be the inherent weaknesses of the classical slurry-based assays. So far, these methods require sample transport to a laboratory with potentially long storage times. The latter can be critical because preservation pre-treatments such as drying can have unknown effects on the measured EEA (DeForest, 2009; Lorenz and Dick, 2011). Therefore, the analysis of fresh samples is preferred. Furthermore, the preparation of a slurry with a wide liquid to soil ratio creates a rather artificial environment for the measurement. Particularly in the case of dry or dried soil samples, the instantaneous addition of relatively large amounts of water or buffer could lead to Birch-type re-wetting effects (Birch, 1958) that may cause an unwanted enhanced EEA due to lysis of microbial cells (Fierer and Schimel, 2003).
We argue that the use of EEA as soil function indicators could be fostered by a new enzymological method that (i) allows operators without special skills to perform reliable and standardized measurements of enzymatic rates under current environmental conditions on-site, i.e., without access to a laboratory and related storage, and (ii) avoids creating an artificial environment with excess of an aqueous phase. By combining operational elements of zymography and microplate assays, we therefore developed a soil enzyme activity reader (SEAR) that fulfills the afore-mentioned requirements. The instrument design allows for the simultaneous assessment of the activity of several enzymes, including analytical replicates. In this paper we describe the operation of EEA measurements with this new device, including the principles of data acquisition and analysis. Furthermore, we validate the method by using sand spiked with specific enzymes and provide data to evaluate the boundary conditions of operation, such as limits of rate detection, precision, and the ranges of soil properties, substrate concentrations, and environmental conditions. These data are discussed with respect to methodological rigor and potential applications.
2 Materials and methods
2.1 Method principle and set-up
As in classical microplate assays (Marx et al., 2001) and in soil zymography (Bilyera and Kuzyakov, 2024), the determination of EEA in SEAR is based on the reaction of soil enzymes with artificial fluorogenic substrates and measuring the increase in product fluorescence over time. We currently use substrates for enzymes that release either 7-Amino-4-methylcoumarin (AMC) or 4-Methylumbelliferone (MUF).
The SEAR setup consists of a reaction plate and a reader, as well as a soil tray and a 4 mm sieve (Figure 1). The reaction plate is composed of a passive carrier containing wells for substrates (reaction wells) and calibration substances (reaction products in different concentrations, calibration wells). Both substrates and calibration substances are dissolved in a transparent gel that consists of 99.0% water (Figure 1b). The current standard reaction plate contains reaction wells with substrates (3 replicates per substrate-type) as well as calibration wells with the reaction products MUF and AMC, each in 5 concentrations as basis for the respective calibration curves. The substrate wells target five different groups of hydrolytic enzymes involved in the carbon (C), nitrogen (N), and P cycles (Supplementary Table 1). Sealed reaction plates have a limited storage time as biotic or abiotic hydrolysis may decompose substrate over longer time periods. Therefore, storage at 4 °C is recommended.
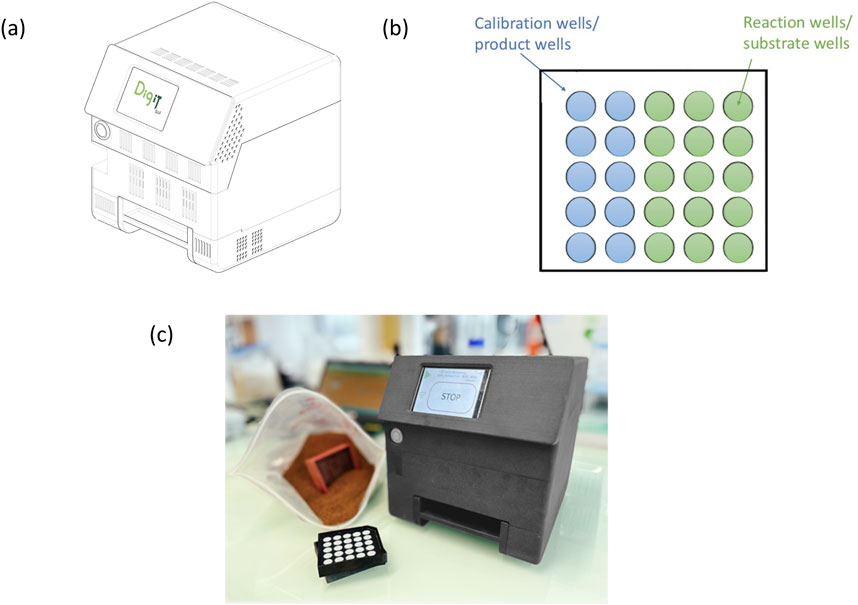
Figure 1. (a) The reader that will read out the signal produced in the reaction plate; (b) reaction plate; the plate contains reaction wells (wells containing artificial substrates) and calibration wells (wells containing products in different concentrations); (c) the whole Soil Enzymatic Activity Reader (SEAR) set including the reader, the reaction plate and the sieve.
For the measurement, sieved soil is filled into the soil tray, the foil on one side of the reaction plate is removed, and the open side of the reaction plate is pressed onto the soil (see Supplementary Material 1 for a detailed user protocol). Coarse homogenization using the 4 mm sieve included with the setup, should work with most field-fresh soils. However, if soil consistency allows, finer sieving, e.g., to 2 mm, may likely decrease variability among replicate measurements. The tray with soil and reaction plate is inserted into the reader, and over a period of 40 min the reader will register the change in fluorescence in reaction and calibration wells. Every 2 min, a picture is taken of the reaction plate from the opposite side of the soil following illumination with LED diodes matching the reaction product excitation and emission spectra. Temperature and time are recorded during the measurement period. This results in a set of images (= raw data) that are then analyzed in the data analysis pipeline to derive EEA rates.
2.2 Data analysis pipeline and calculations
The software included with the SEAR device derivates EEA rates from the generated images using the following steps (see also Supplementary Figure 1):
In the first step, in each image, all pixels for a given well are extracted. A single luminosity value for each well is computed from the 8-bit grayscale image by using the 90th percentile of all pixel values. This accounts for heterogeneity within the well that can be caused by non-perfect contact, border effects, or single spots that are outliers (dirt on the foil, single overexcited pixels). However, in most cases, the distribution of luminosity values is quite homogeneous (see example of reaction plate shown in Supplementary Figure 1, top left).
Next, the observed signal in the reaction wells is corrected based on the signal drop during the measurement period in the calibration wells, i.e., the respective AMC and MUF values, based on a fitted drop function. Depending on soil properties and moisture, this drop may be up to 25% of the initial signal (data not shown). This correction serves to account for the net effect of losses, such as transport and quenching processes on the fluorescence produced by the enzymatic reactions, whichis further discussed in Section 4.1. Third, using the calibration function, which is linear up to 30 μmol L-1 for both MUF and AMC (see Supplementary Figure 1, top right), the luminosity values for each well in each image are converted to product concentrations (in mol L-1). Luminosity values above the linear range of the calibration function are not considered by the data analysis pipeline. Soil background fluorescence as measured in the zero calibration well, has been found to be maximum 5 luminosity values.
Last, for each reaction well, the increase of corrected product concentration with time is used to compute the respective EEA rate. The concentration data used for this are taken only from the range of linear increase with time which is constrained as follows. Based on 20 recorded data points, an automated, proprietary code determines a range of at least 10 consecutive data points with a linearity requirement based on R2. If the quality requirements are not met, the measurement is labeled invalid. An example of product concentration increase with time is shown in Supplementary Figure 1 (bottom middle). The obtained rate is multiplied by a conversion factor of 5100, to convert from
2.3 Validation, analytical characteristics, effects of environmental conditions
2.3.1 Soil material
For the various experiments and test measurements, eleven soils of varying texture, pH, and organic carbon content as well as pure sand were selected (Table 1; Figure 2). Texture and soil organic carbon contents were analyzed by the laboratory SolConseil (Gland, CH). For these analyses, the samples were dried (40 °C, 48 h) and then 2 mm sieved. Texture was analyzed using the pipette method (Gee and Bauder, 1986), and soil organic C content was analyzed using the potassium dichromate method (Skjemstad and Baldock, 2007). Soil pH was measured in 0.01 M CaCl2 (Houba et al., 2000). For measuring EEA, if not specified otherwise, soil samples were used field moist and sieved to 4 mm.
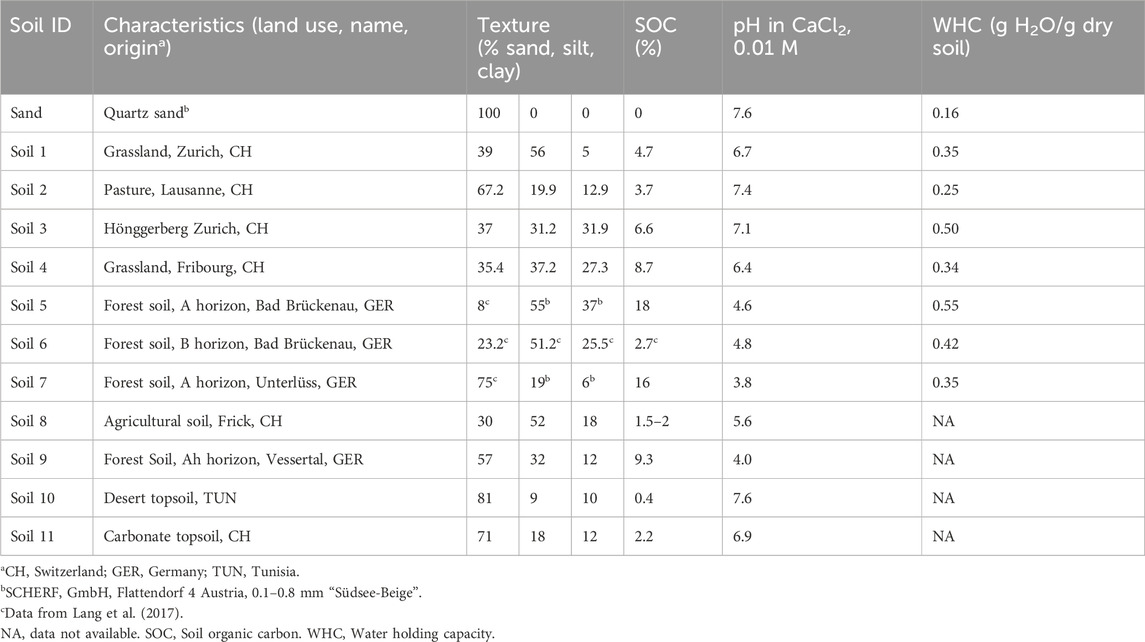
Table 1. Characteristics of the soils used for the various experiments and test measurements.
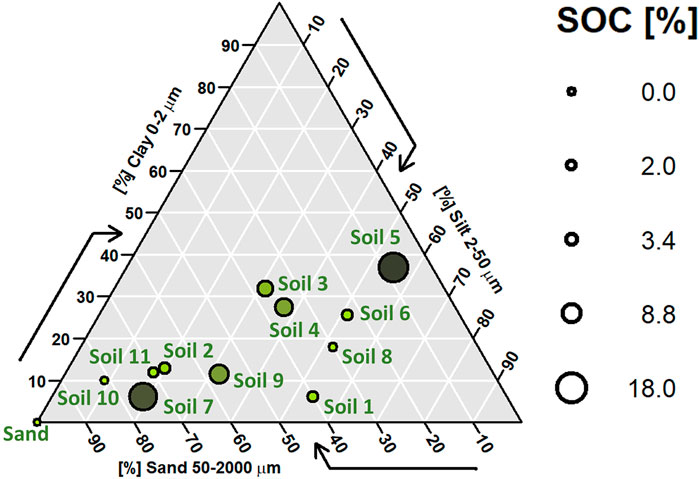
Figure 2. Overview of texture and soil organic carbon (SOC) content ranges covered by the test soil samples.
2.3.2 Substrate saturation tests
Quartz sand was spiked with β-glucosidase or phosphatase solutions as model enzymes (Supplementary Table 2). The quartz sand (13 g) was mixed with 2 mL of the model enzyme solution at concentrations of 0.125 mg mL-1 (GLS) and 0.250 mg mL-1 (GLS, PHO) (resulting in a water content of 0.14 g H20/g moist soil). The chosen concentrations for spiking resulted in EEA rates in the higher range of observed EEAs from measurements conducted with this device so far. The measurement temperature was approx. 25 °C. Additionally, two unspiked soils were used. These sands and soils were measured with a series of reaction plates containing increasing substrate (4-Methylumbelliferyl-β-D-Glucopyranoside (MU-GLU) concentrations of 0, 100, 150, 200, 250, 300, 350, 400, 450, and 500 μmol L-1. All sample/substrate concentration variants were replicated 3 times.
2.3.3 Negative control
As blanks five autoclaved soils (soils 5, 7, 9, 10, 11, Table 1) were measured at approx. 25 °C. Autoclaving has been shown to be an effective method for deactivating microbial activity in soils (e.g., King et al., 2024). Soil specific limits of detection (LOD) were determined based on the standard deviation of the blanks; this is equivalent to the standard deviation of the noise determined according to Equation 1 (ICH, 2005).
where σ = the standard deviation of the response. The water content of the samples ranged between 1% and 5%.
2.3.4 Positive control
The basic ability of the system to reliably detect enzymatic activity as well as the EEA activity range of the measurement were tested using a dilution series of enzyme solutions with known activity. Using the underlying assumption that an increase in enzyme concentration should result in a linear increase in EEA, we tested our SEAR setup with four model enzyme-substrate pairs (β-glucosidases + MU-GLU, β-xylosidases + 4-MUF-β-D-xylopyranoside (MU-XYL), phosphatase + 4-MUF phosphate (MU-PHO), protease + L-Leucine-AMC hydrochloride (AM-LEU), see Supplementary Table 2). From solutions with different concentrations of dissolved enzymes, 2 mL were added to 13 g of sand, mixed (resulting in a water content of 0.14 g H20/g moist soil), and measured with the SEAR. The measurement temperature was approx. 25 °C.
2.3.5 Effects of soil moisture
For assessing the short-term effects of soil moisture on EEA, eight soils of different texture and organic C content and an enzyme-spiked sand were used and brought to five levels of water content.
First, the water holding capacity (WHC) was determined for each soil as follows: 10 g of soil were placed on a filter in a funnel, and 20 mL of ultrapure water were added. The soil sample in the funnel was covered to reduce evaporation and left to drain for 24 h. Thereafter, the weight was determined again and the soil was dried at 105 °C for 24 h. The gravimetric water content after the 24 h of drainage corresponds to the WHC of that soil. Then, soils were air-dried at room temperature (24 °C) for 24 h, followed by adding different amounts of ultrapure water to obtain five levels of water content for each soil (Supplementary Table 5). The water content ranged from 2% of WHC to 173% of WHC (Supplementary Table 5).
After adjusting the water content, the soils were measured immediately with a replication of n = 3. The short incubation time was chosen in order to evaluate the effect of the physical measurement conditions only and minimize any moisture effect on the biological processes. The final water content (Supplementary Table 5) was gravimetrically determined for each sample by drying a known amount of moist soil at 105 °C for 24 h and re-weighing. The measurement temperature was approx. 25 °C.
2.3.6 Effects of soil temperature
For determining the short-term effects of temperature on the EEA, two soils (Soil 5, Soil 6) differing in texture and organic carbon content (Table 1) were used. The soil samples were brought to WHC (Table 1) and to the respective temperature 30 min before the measurement. During the whole measurement that temperature was kept constant by placing the SEAR device in an oven or a fridge. Samples were measured at 6 °C–55 °C in 5 °C increments (10 levels) with a replication between 4 and 7. The temperature dependency was expressed with the temperature coefficient Q10. The Q10 values were calculated with the R package “respirometry” based on vectors consisting of 8 data points from the temperature range between 15 °C and 50 °C.
2.4 Statistics
Statistical analysis was conducted using R version 4.3.1 (2023–06-16). To determine if there were significant differences in EEA among the soil moisture levels, a one-way analysis of variance (ANOVA) followed by Tukey’s Honest Significant Differences (HSD) test was performed. ANOVA assessed the overall variability in EEA attributed to different moisture levels, while Tukey’s HSD test enabled pairwise comparisons between treatment levels to identify statistically significant differences. A significance level of ɑ = 0.05 was chosen to determine statistical significance.
3 Results
3.1 Substrate saturation
The substrate saturation curves resulted for all four (GLS) and two (PHO) test samples in a similar pattern: with increasing substrate concentration, EEA showed an increase and then reached a plateau at 200–250 μmol L-1 (Figure 3). For all GLS amended samples and PHO amended soil 1 this was followed by a decrease in EEA for the highest substrate concentrations. Based on these results, a substrate concentration of 250 μmol L-1 was selected for all further measurements.
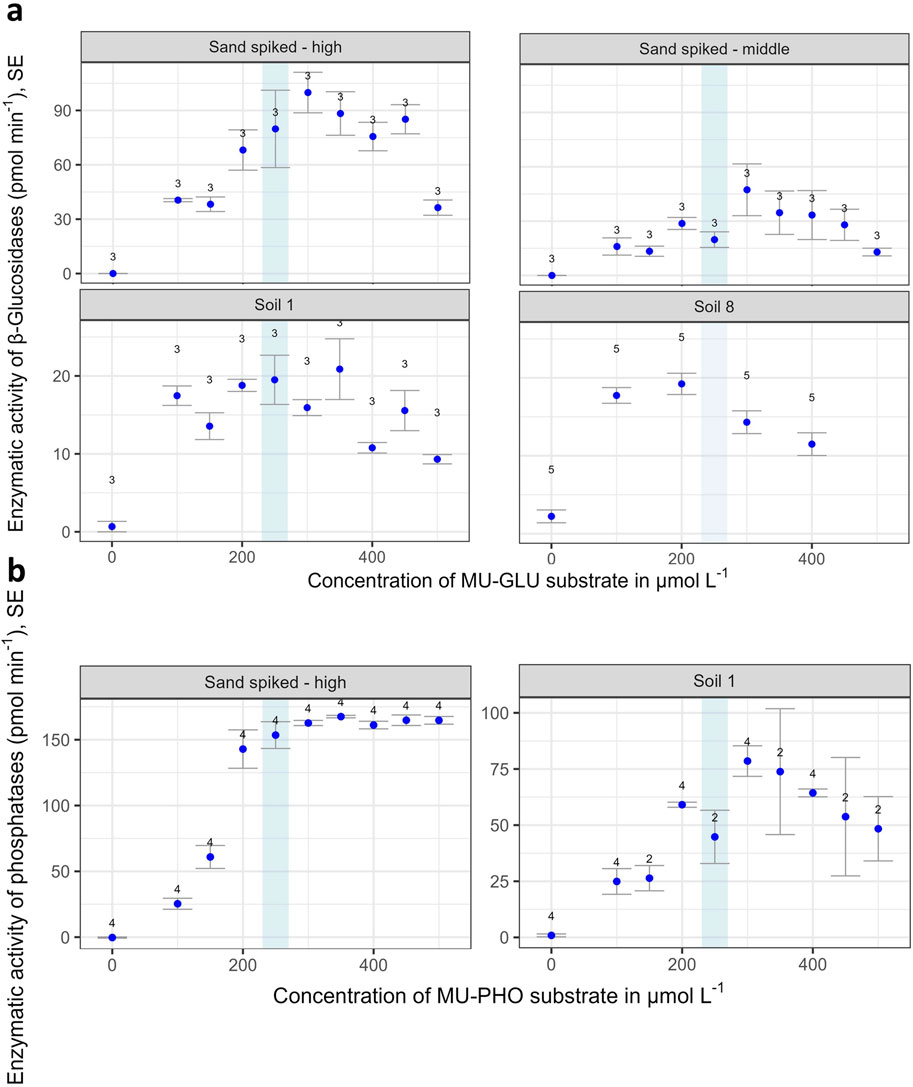
Figure 3. β-glucosidase (GLS) activity (a) obtained from GLS spiked sand (spiked with a solution of enzymes at concentrations of 0.125 mg L-1 (middle) and 0.250 mg L-1 (high), respectively), and from two soils Soil 1 and Soil 8 (see Table 1). Phosphomonoesterase (PHO) activity (b) obtained from PHO spiked sand (at concentration of 0.25 mg L-1) and from soil 1. The sands and the soils were measured with reaction plates containing reaction wells with Methylumbelliferyl-β-D-glucopyranoside (MU-GLU) or MUF-phosphate (MU-PHO) concentrations from 0 to 500 μmol L-1. Error bars denote standard errors of the mean, the numbers of replications are indicated in the graph. Blue stripe: chosen concentration for our standard SEAR (Soil Enzymatic Activity Reader) setup.
3.2 Limits of detection and repeatability
Enzyme specific LODs were determined as average soil specific LODs that were calculated as described in Section 2.3.3., exemplarily shown for Leucine-Aminopeptidase (LEU) in Figure 4 (5 technical replicates per sand/soil). Values for four enzymes ranged between 0.6 and 2.1 pmol min-1 (Table 2). Because of the particularly high variability of the response for phosphatase (PHO) activity at values close to 0 no value is given. More research is needed to improve the instrument performance for measuring low phosphatase activities.The repeatability in terms of coefficient of variations (CV) of soil measurements with SEAR varied between 5% and 50%, except for 94% for a β-Xylosidase (XYL) value close to the detection limit (Table 2; Supplementary Table 4). Generally XYL activities were low compared to other enzymes, which likely was the reason for the often relatively high CVs.
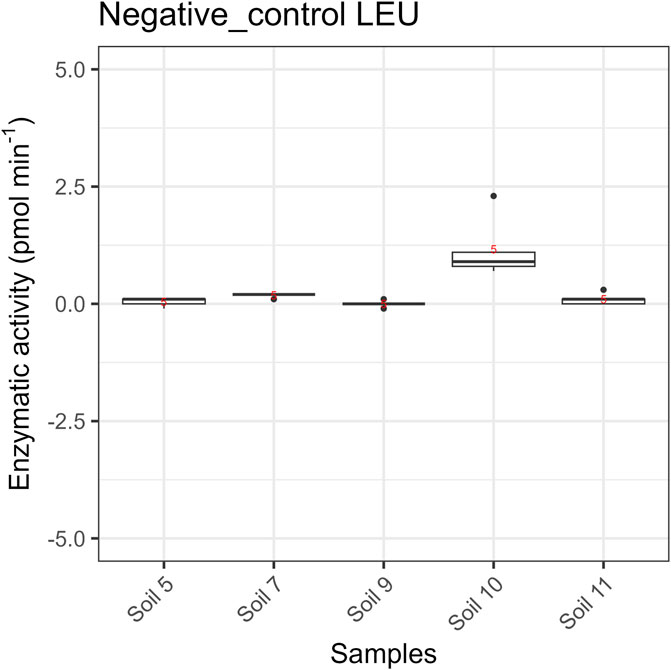
Figure 4. Negative control measurements on autoclaved soils, exemplarily shown for Leucine Amino Peptidase (LEU); n = 5. Data for β-Glucosaminidase (GLA), β-Glucosidase (GLS), and β-Xylosidase (XYL) see Supplementary Table 3.
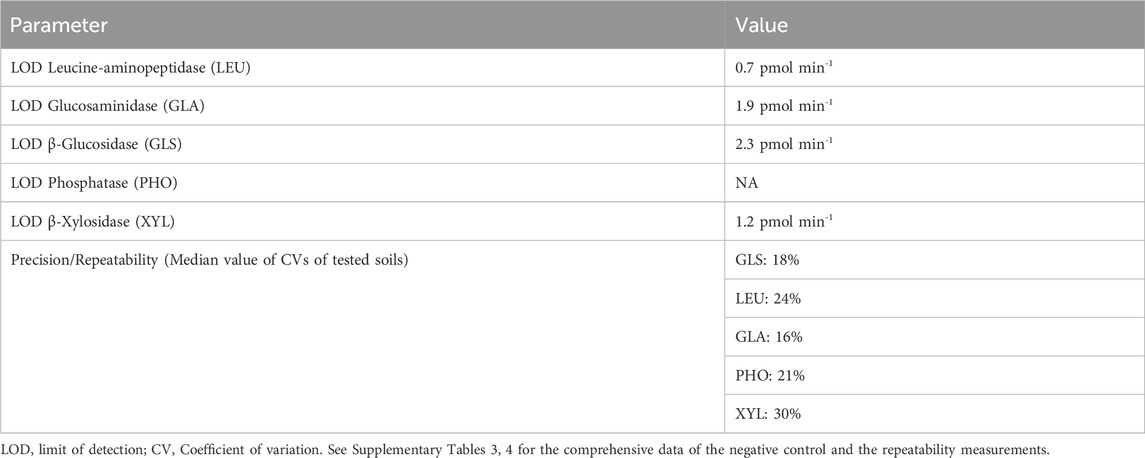
Table 2. Quality parameters for the Soil Enzymatic Activity Reader (SEAR) setup.
3.3 Positive controls
For all four tested model enzymes, EEA increased linearly with increasing enzyme concentrations in the solution the sand was spiked with (Figure 5). The R2 was above 0.9, except for LEU.
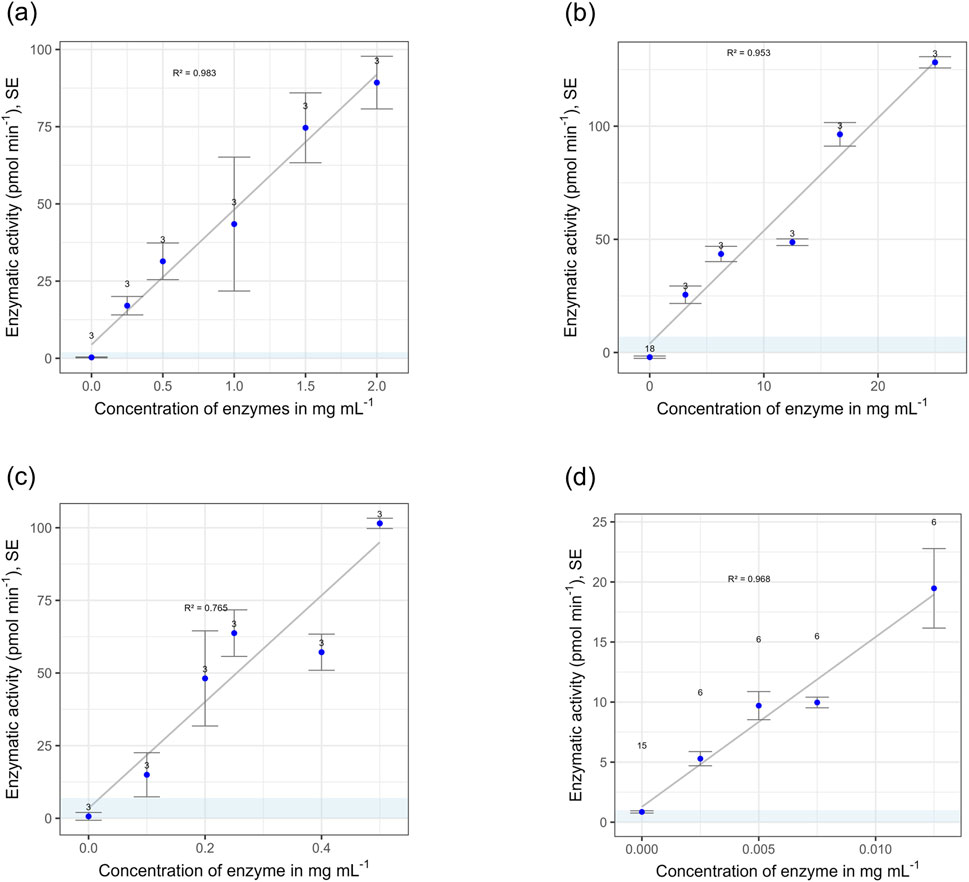
Figure 5. Extracellular enzymatic activities of four enzyme groups measured in sand that was spiked with solutions of increasing enzyme concentrations. The blue area depicts the calculated detection limit (see Table 2). Errors are standard errors of the mean (SE), replications are indicated in the graph. (a) β-Glucosidase (GLS). (b) Phosphatase (PHO). (c) Leucine-aminopeptidase (LEU). (d) β-Xylosidase (XYL).
3.4 Effects of soil moisture
The observed patterns of EEA as response to five levels of soil moisture appear to depend more on the soil than on the type of enzyme (Figure 6; Supplementary Figure 2; Supplementary Table 5). Overall, the influence of moisture was small, and in the two sands and most soils no clear increasing or decreasing trend in EEA with increasing soil moisture could be established. Exceptions were soils 5 and 7 with increasing and decreasing moisture effects, respectively. Of the 400 tested pairs, 20 resulted in significant (p < 0.05) differences according to Tukey’s HSD test, while all other pairs and all other soils were not significantly different from each other (see Supplementary Table 6).
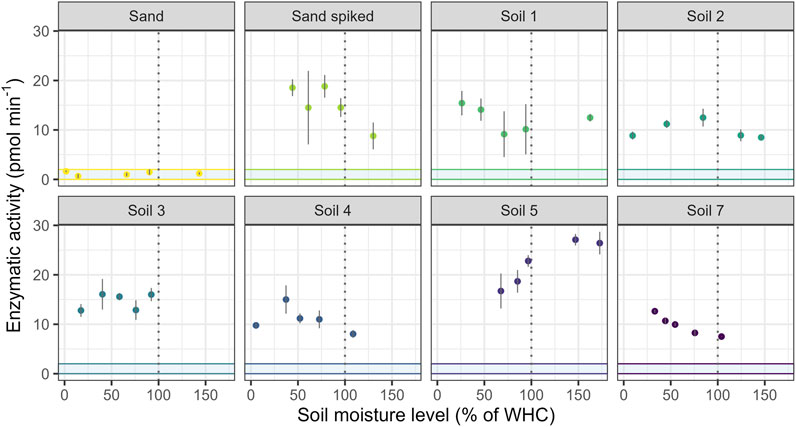
Figure 6. Soil moisture effects on β-Glucosidase (GLS) activities in six soils, sterilized sand and β-glucosidase (GLS)-spiked sand, n = 3. The blue area depicts the calculated detection limit (see Table 2). Graphs for moisture effects on β-Glucosaminidase (GLA), Phosphomonoesterase (PHO) and β-Xylosidase (XYL) activities see Supplementary Figure 2.
3.5 Effects of soil temperature
Effects of temperature during the measurement were assessed using the topsoil and the subsoil of a temperate beech forest site (Soils 5 and 6, Table 1). Within the tested range from 6 °C to 55 °C, the rates of all tested enzymes showed an exponential increase, except for EEA of GLS which reached a plateau at around 50 °C (Figure 7). The Q10 values, calculated for the range from 15 °C to 50 °C ranged between 1.4 and 1.8.
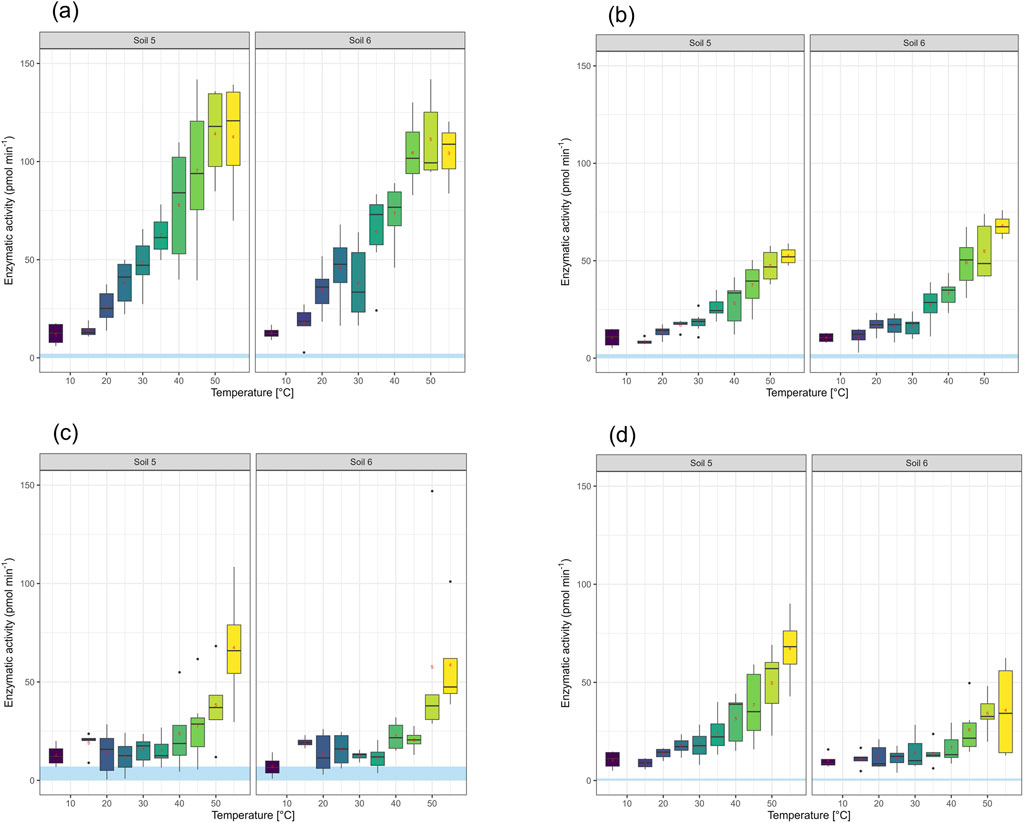
Figure 7. Soil temperature effects on the activities of 4 different extracellular enzymes in two soils (Soil 5 and 6, see Table 1). n = 4–7. The blue area depicts the calculated detection limit (see Table 2). (a) β-Glucosidase (GLS). (b) Glucosaminidase (GLA). (c) Leucine-aminopeptidase (LEU). (d) β-Xylosidase (XYL).
3.6 Comparison with classical enzymatic assays
While values per unit time and unit area obtained with the SEAR device cannot be directly compared with values per unit time and unit mass obtained with classical slurry-based enzymatic assays (see discussion Section 4.2), we include a relative comparison of EEAs obtained with both methods from experimental studies of research partners that were kindly provided to us (Supplemantary Data 9). Overall, SEAR data for 5 different enzymes from a model ecosystem experiment investigating drought and warming effects on various tree species, and for GLS from a field experiment in pastures comparing different management practices correlated significantly with respective data obtained by microplate assays (Supplementary Figure 3). However, the data from the model ecosystem experiment revealed that there were differences among the enzymes, e.g., a particularly strong correlation for GLS data and a much weaker one for LEU data.
4 Discussion
Here we introduced SEAR, a new method for the assessment of EEA in soils which, being coupled to an industrially manufactured instrument with a built-in data analysis pipeline, allows for a standardized operation. In the following, we first discuss the operating principles of the method and how unknown factors with potential effects on the results are dealt with by means of instrumental design and automated data analysis. We then evaluate the method based on the results presented in Section 3 in terms of analytical characteristics and range of suitable soil properties and conditions.
4.1 Operating principles of the method
The method is based on the reaction of enzymes in a reactive layer of homogenized soil with fluorogenic substrates upon contact with an agarose gel in which the substrates are dissolved. The reaction products are detected with a camera on the opposite side of the transparent gel by their fluorescence upon excitation with a set of diodes, employing a time series of images taken by a camera sensor. As such, the method incorporates the latest developments in soil zymography, specifically camera detection (Spohn and Kuzyakov, 2014) and time-lapse operation (Guber et al., 2021). However, using agarose as substrate medium corresponds to earlier versions of soil zymography (e.g., Baldrian and Větrovský, 2012), while substrate-impregnated membranes are preferred in current soil zymography methodology because of their better lateral resolution needed for mapping the small-scale heterogeneity of the EEA, e.g., around root systems (Bilyera and Kuzyakov, 2024). For our purposes, the gel is a better choice because it allows for a fast contact of soil with substrate in a well-defined concentration. Based on observations, we assume a fast uptake of water from the gel by the soil, the extent of which depends on the inherent moisture of the soil and its properties, most importantly texture. As a consequence, substrate is rapidly transported from the gel into the reactive soil layer, also in very dry soils.
In most cases, the pixel-wise data analysis indicated a quite homogeneous spatial distribution of the detected fluorescence, and thus, despite a limited degree of soil homogenization achieved by coarse sieving, a large part of the soil surface can be assumed to participate in the enzymatic reaction. However, in a given soil, homogeneity of EEA is a function of soil aggregation as well as the spatial distribution of enzyme hotspots, and thus the degree of homogeneity varies depending on the soil.
We define the reactive soil layer as the layer where reaction of soil enzymes with substrate leads to product fluorescence that reaches the detector within the measuring period. Based on theoretical considerations, the thickness of this layer is affected by various factors including convective and diffusive transport of substrate from the gel into the soil, the diffusive transport of reaction product from the location of formation towards the gel and to deeper soil layers, the convective transport of reaction product to deeper soil layers, the penetration depth of exciting light into the soil, and quenching or absorbance of product fluorescence in the soil or the gel. Soil background fluorescence as another factor affecting the measured luminescence, was found to be negligible in all our case studies to date, indicating low to no impact of autofluorescence within the emission wavelength interval.
In contrast to the importance of transport processes affecting the distribution of substrate and the reaction product, Guber et al. (2018), Guber et al. (2021) showed that movement of enzymes within the soil is negligible. In these studies, the maximum thickness of the reactive layer for direct soil zymography with membranes as substrate carriers was estimated to be about 200 µm. Since in the latter method the convective substrate transport is negligible and fluorescence detection is limited to the membrane itself, this result cannot be transferred unrestrictedly to our method. In our data-analysis pipeline, we account for the net effect of all afore-mentioned processes on product detection by correcting for the observed disappearance of product fluorescence from the reactive layer in the calibration wells, assuming that the freshly generated products in the reaction wells disappear with the same rate from the reactive layer as the products in the calibration wells. Although diffusive flux of product from the soil to the gel is not considered, applying this automated correction procedure improved the linearity of the response in our positive control experiment, and generally decreased the variability of the technical replicates.
In contrast to the need to correct for decreasing product fluorescence during the measuring period, no such correction should be necessary for transport of substrate to deeper soil layers. Since we work under conditions of substrate saturation, as is further discussed below, we can assume that disappearance of substrate from the reactive layer should have a negligible effect on the measured enzymatic rates.
4.2 Method performance
Table 3 presents an overview of several factors that were defined crucial for any new method aiming at assessing EEA in soils (Dick W. A., 2011), and how this is implemented in the SEAR system.
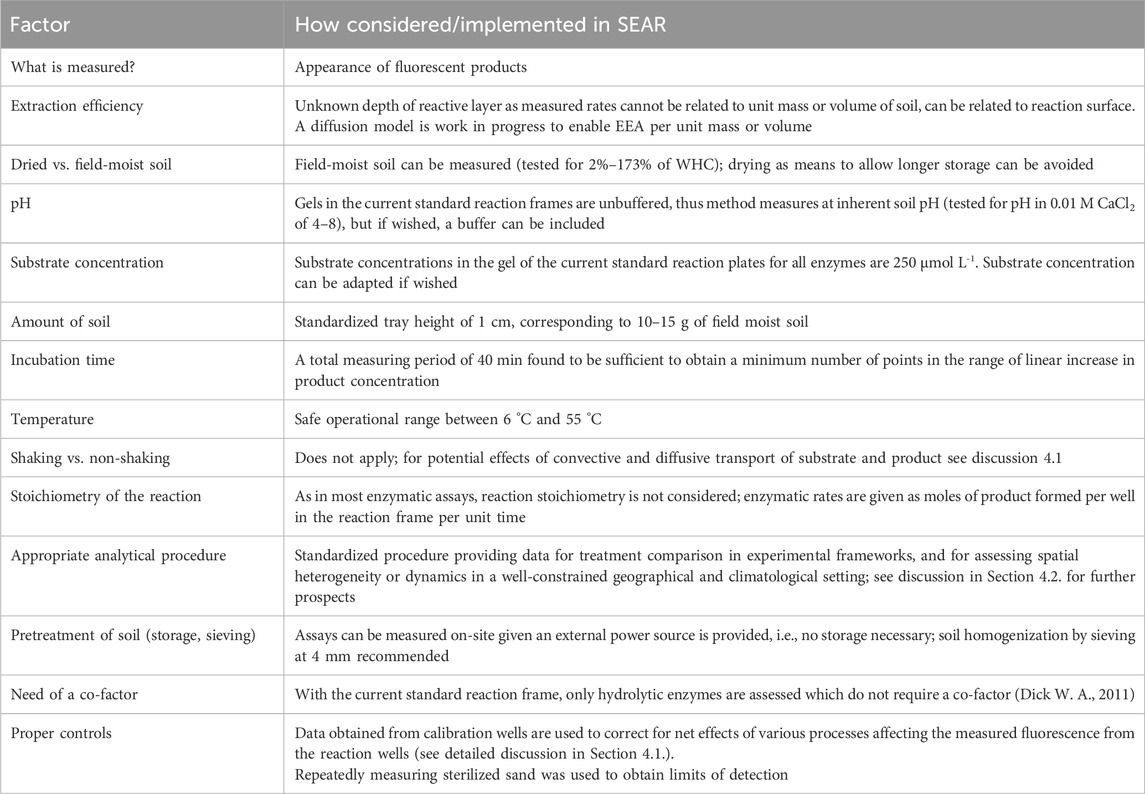
Table 3. Summary of factors and parameters considered in the development of the Soil Enzymatic Activity Reader (SEAR) and discussed in Sections 4.1, 4.2.; based on a similar table in Dick W. A. (2011).
An overall goal that a soil enzymological method needs to achieve is to be able to measure a reaction rate that is proportional to the concentration of enzymes in the soil (Dick W. A., 2011). The linear increase of EEA in our experiments with sand, spiked with solutions of increasing concentrations of four different enzymes, confirms that our method in the presented set-up achieves this basic goal. However, the thickness of the reactive layer for a given soil, which can be considered the equivalent of the extraction efficiency in slurry-based methods, is unknown (see Section 4.1), and thus activities per unit mass or volume of soil cannot be derived from the measured rates. Therefore, the data obtained with our method cannot be directly compared to data obtained with other soil enzymatic methods, in particular classical slurry-based assays. However, a first relative comparison of EEA obtained with SEAR and slurry-based microplate assays, based on experimental data provided by research partners, indicates that treatment effects can indeed be captured by our method in a similar way as by classical assays. However, these data also show that the strength of correlations between EEA obtained by the two methods can vary depending on the type of enzyme and the particular study. This may be attributed to inherent operational differences between the two methods. In particular, this concerns the slurry formation in an excess of buffer or water, often followed by ultrasonic dispersion, in the classical assays as compared to the gentle sample preparation by sieving employed in our method. Thus, our method on the one hand may not assess enzymes that are well protected in soil aggregates, on the other hand may avoid operational bias imposed by the slurry formation such as Birch-type re-wetting effects of dry soils (Birch, 1958; Fierer and Schimel, 2003), e.g., from drought experiments (see also introduction). A more in-depth discussion of results obtained by our method with classical slurry-based enzyme assays is beyond the scope of this manuscript but may be possible as soon as more such comparisons become available.
When related to unit surface area, the rates obtained with our method are up to one order of magnitude higher than those measured with membrane-based soil zymography (e.g., Meller et al., 2020; Spohn and Kuzyakov, 2014), which may be explained by the faster contact between substrate and soil enzymes when using a gel rather than a membrane due to the additional convective transport of substrate to the soil or generally, due to a thicker gel layer.We found our method to operate well for a wide range of different soils, comprising textures from sand to silty clay loam (USDA, 2017), acid forest soils with pH < 4 to carbonate containing agricultural soils, and soil organic carbon contents up to 18%. However, so far, we have limited experience with soils that are low in soil organic carbon (SOC <1%), and thus likely also exhibit low EEA. Furthermore, by successfully testing soil moistures from 2% to 173% of the respective water holding capacity and temperatures from 6 °C to 55 °C, we could show that measurements under most conditions encountered in the field are possible. Thus, there is no need for storage and related sample pretreatments such as drying that may affect the measured rates (Burns et al., 2013; Lorenz and Dick, 2011; and references therein). In all tested cases, we found sieving at 4 mm as a minimum soil pretreatment to be suitable for homogenizing the soil samples. This mesh size is within the range recommended by Lorenz and Dick (2011), although they argue for a 2 mm mesh size to be optimum for most soils and advise larger mesh sizes only for highly organic and clayey soils.
Overall, the effects of short-term changes in soil water content on the measured activity of five different enzymes were small, which can be explained by the equalizing wetting effect upon contact with the gel. The drier the soil the more water is lost from the gel to the soil, leading to a homogenization of moisture conditions among different samples. The weak patterns of EEA vs. soil moisture, observed in some cases, appear to be both soil and enzyme dependent, which is similar to observations by Gomez et al. (2020), Gomez et al. (2021). The small extent of the effects suggests that our method is able to capture climatic or longer-term experimental effects on EEA irrespective of the current soil moisture during the measurement.
We could show that our device is operational almost up to the temperature limit of 60 °C above which most enzymes in soils are expected to denature (Tabatabai, 1994). Within the range of 15 °C–50 °C, the EEA of GLS, β-glucosaminidase (GLA), and XYL in both the topsoil, rich in organic matter, and the mineral subsoil of an acidic beech forest site exhibited an exponential increase, with Q10 values of 2 or smaller, as is expected for catalyzed reactions in soil (Tabatabai, 1994). For GLS, a plateau at around 50 °C indicated that the optimum temperature for this enzyme was reached (Dick W. A., 2011). We conclude that with our device, EEA can be measured either at the current temperature, or if a thermostatic device is available, at any chosen standard temperature. In classical soil enzymatic assays, often standard temperatures of 25 °C or 37 °C have been chosen in order to allow for better comparison among different studies (Dick W. A., 2011; ISO/TS 22939, 2019). In order to extrapolate measured EEA with SEAR in the field to other temperatures, average Q10 values may be used.
The need to buffer soil enzyme assays at an enzyme’s optimum pH has been discussed controversially and depends on the research question or purpose of the analyses (German et al., 2011). Since SEAR is mainly intended for field assessments under inherent soil conditions, including pH, we chose a buffer-free gel for our standard reaction plate. However, should optimum comparability among different studies be required, the method can be easily adapted by producing reaction plates with buffered gel.
Based on GLS and PHO rates in spiked sand and soils with increasing substrate concentrations, we chose 250 µM as the concentration of substrates for all tested hydrolytic enzymes in our standard reaction frame. In soils, GLS and PHO rates have been often found to be larger than those of most other hydrolytic enzymes (Sinsabaugh et al., 2008; Sinsabaugh and Shah, 2012), and thus we assume that the chosen concentration ensures substrate-saturated conditions for the enzymes included in our standard reaction plate under a wide range of soil properties and conditions. The concentration of 250 µM is also in the same range as is found for substrate saturated conditions in slurry-based assays (e.g., German et al., 2011). Nevertheless, should particular soil properties or conditions require higher substrate concentrations, the method can be easily adapted, considering the good solubility of substrates in the gel, tested up to 500 µM (Figure 3).
The total incubation time of 40 min was sufficiently long to achieve a robust linear increase of product for all enzymes, soils and conditions tested. It is also short enough to minimize the potential effect of microbial growth or reactions on the number of detectable enzymes (Dick W. A., 2011), and thus, there is no need for adding an antiseptic reagent, as has been often done in classical slurry-based assays (Tabatabai, 1994). Considering the measurements of sterilized soils as negative controls, the potential contribution of abiotic hydrolysis of substrates to the measured signals cannot be larger than the LODs derived from these measurements.
Overall, the variability of replicate measurements of EEA was within the range found for fluorometric microplate assays (Creamer et al., 2009). The effect of inherent soil moisture on reproducibility was small, which might also be related to the equalizing wetting effect upon contact with the gel. The variability of EEA measurements for particularly inhomogeneous soils with SEAR can potentially be decreased by further increasing the number of replications and/or establishing a protocol for identifying and removing outliers.
5 Conclusion
The SEAR is a device that allows fast measurements of EEA under field conditions without laboratory access and thus without need for storage and related sample pretreatments such as drying that may affect the results. The current SEAR instrument still needs access to high-voltage electrical power from either a wall socket or a generator, but with further improvements of the detection unit battery-power may be sufficient in future. Using reaction plates that are industrially manufactured to narrow specifications and applying an automated data analysis pipeline, allows for standardized measurements by operators without special laboratory skills and with coarse sieving as minimum sample pretreatment. This deems sufficient for treatment comparison in experimental frameworks, or for assessing spatial heterogeneity or dynamics in a well-constrained geographical and climatological setting.
Yet, SEAR can easily be adapted to more standardized conditions in terms of temperature or pH if needed for better comparison among different studies. However, SEAR with its standard set-up for the simultaneous assessment of five different hydrolytic enzymes, lends itself particularly well for evaluating enzymatic stoichiometries, based on ratios between specific enzymes (Bai et al., 2021; Sinsabaugh et al., 2008; 2009; Sinsabaugh and Shah, 2012), rather than for comparing individual enzymatic rates with other studies. Nevertheless, we are currently building-up a database containing measurements from an increasing number of sites and case studies. This database combined with a model that relates EEA to soil properties and environmental conditions, will potentially allow a better interpretation of individual EEA.
Data availability statement
The raw data supporting the conclusions of this article will be made available by the authors, without undue reservation.
Author contributions
JF: Conceptualization, Data curation, Funding acquisition, Investigation, Validation, Visualization, Writing – original draft, Writing – review and editing. SM: Conceptualization, Data curation, Funding acquisition, Investigation, Writing – review and editing. HI: Conceptualization, Funding acquisition, Writing – review and editing. DB: Data curation, Investigation, Writing – review and editing. PGR: Conceptualization, Data curation, Investigation, Writing – review and editing. AM: Data curation, Software, Writing – review and editing. JL: Conceptualization, Writing – original draft, Writing – review and editing.
Funding
The author(s) declare that financial support was received for the research and/or publication of this article. This work has received funding from the Swiss State Secretariat for Education, Research and Innovation (SERI). The AI4SoilHealth project has received funding from the European Union’s Horizon Europe research and innovation programme under grant agreement No. 101086179. Open access funding by Swiss Federal Institute for Forest, Snow and Landscape Research (WSL).
Acknowledgments
Many thanks to Martin Hartmann and Tania Galindo (ETH Zürich, Switzerland) for providing us Soil 1 and its measured characteristics. Further we want to thank Sebastian Löppmann (University of Kiel, Germany) for valuable input and feedback to the manuscript. Enzymatic data from the AI4SoilHealth project (Supplementary Data 9) were kindly provided by Fernando Blanco, Aitor Anitua, and Lur Epelde from NEIKER-Basque Institute for Agricultural Research and Development (Derio, Spain). Enzymatic data from the MODOEK facility at the Swiss Federal Research Institute WSL (Birmensdorf, Switzerland; Supplementary Data 9) were kindly provided by Frank Hagedorn and Yueqi Zhang.
Conflict of interest
Author JF, SM, HI, PGR, and AM were employed by Digit Soil.
The remaining authors declare that the research was conducted in the absence of any commercial or financial relationships that could be construed as a potential conflict of interest.
Generative AI statement
The author(s) declare that no Generative AI was used in the creation of this manuscript.
Any alternative text (alt text) provided alongside figures in this article has been generated by Frontiers with the support of artificial intelligence and reasonable efforts have been made to ensure accuracy, including review by the authors wherever possible. If you identify any issues, please contact us.
Publisher’s note
All claims expressed in this article are solely those of the authors and do not necessarily represent those of their affiliated organizations, or those of the publisher, the editors and the reviewers. Any product that may be evaluated in this article, or claim that may be made by its manufacturer, is not guaranteed or endorsed by the publisher.
Author disclaimer
Views and opinions expressed are however those of the author(s) only and do not necessarily reflect those of the European Union or European Research Executive Agency. Neither the European Union nor the granting authority can be held responsible for them.
Supplementary material
The Supplementary Material for this article can be found online at: https://www.frontiersin.org/articles/10.3389/fenvs.2025.1663635/full#supplementary-material
References
Acosta-Martinez, V., Cano, A., and Johnson, J. (2018). Simultaneous determination of multiple soil enzyme activities for soil health-biogeochemical indices. Appl. Soil Ecol. 126, 121–128. doi:10.1016/j.apsoil.2017.11.024
Aponte, H., Medina, J., Butler, B., Meier, S., Cornejo, P., and Kuzyakov, Y. (2020). Soil quality indices for metal(loid) contamination: an enzymatic perspective. Land Degrad. and Dev. 31 (17), 2700–2719. doi:10.1002/ldr.3630
Bai, X., Dippold, M. A., An, S., Wang, B., Zhang, H., and Loeppmann, S. (2021). Extracellular enzyme activity and stoichiometry: the effect of soil microbial element limitation during leaf litter decomposition. Ecol. Indic. 121, 107200. doi:10.1016/j.ecolind.2020.107200
Baldrian, P., and Větrovský, T. (2012). Scaling Down the analysis of environmental processes: monitoring enzyme activity in natural substrates on a millimeter resolution scale. Appl. Environ. Microbiol. 78 (9), 3473–3475. doi:10.1128/AEM.07953-11
Baldrian, P., Šnajdr, J., Merhautová, V., Dobiášová, P., Cajthaml, T., and Valášková, V. (2013). Responses of the extracellular enzyme activities in hardwood forest to soil temperature and seasonality and the potential effects of climate change. Soil Biol. Biochem. 56, 60–68. doi:10.1016/j.soilbio.2012.01.020
Bilyera, N., and Kuzyakov, Y. (2024). Soil zymography: a decade of rapid development in microbial hotspot imaging. Soil Biol. Biochem. 189, 109264. doi:10.1016/j.soilbio.2023.109264
Birch, H. F. (1958). The effect of soil drying on humus decomposition and nitrogen availability. Plant Soil 1 (1), 9–31. doi:10.1007/bf01343734
Bünemann, E. K., Bongiorno, G., Bai, Z., Creamer, R. E., De Deyn, G., De Goede, R., et al. (2018). Soil quality – a critical review. Soil 120, 105–125. doi:10.1016/j.soilbio.2018.01.030
Burns, R. G., DeForest, J. L., Marxsen, J., Sinsabaugh, R. L., Stromberger, M. E., Wallenstein, M. D., et al. (2013). Soil enzymes in a changing environment: current knowledge and future directions. Soil Biol. Biochem. 58 (March), 216–234. doi:10.1016/j.soilbio.2012.11.009
Creamer, R. E., Bellamy, P., Black, H. I. J., Cameron, C. M., Campbell, C. D., Chamberlain, P., et al. (2009). An inter-laboratory comparison of multi-enzyme and multiple substrate-induced respiration assays to assess method consistency in soil monitoring. Biol. Fertil. Soils 45 (6), 623–633. doi:10.1007/s00374-009-0374-y
DeForest, J. L. (2009). The influence of time, storage temperature, and substrate age on potential soil enzyme activity in acidic forest soils using MUB-Linked substrates and l-DOPA. Soil Biol. Biochem. 41 (6), 1180–1186. doi:10.1016/j.soilbio.2009.02.029
Deng, S., Kang, H., and Freeman, C. (2011). Microplate fluorimetric assay of soil enzymes,” in Methods of soil enzymology, Editor R. P. Dick (Madison, WI: Soil Science Society of America), 311–318. doi:10.2136/sssabookser9.c14
Dick, R. P. (1997). “Soil enzyme activities as biological indicators of soil health,” in Biological indicators of soil health Editor C. R. Pankhurst, B. M. Doube, and V. V. S. R. Gupta (Wallingford, United Kingdom: CAB International), 121–156. Available online at: https://www.degruyter.com/document/doi/10.1515/REVEH.2003.18.1.65/html.
Dick, W. A. (2011). “Development of a soil enzyme reaction assay,” in Methods of soil enzymology. Editor R. P. Dick (Madison, WI: Soil Science Society of America), 71–84. doi:10.2136/sssabookser9.c4
Dick, R. P., and Burns, R. G. (2011). “A brief history of soil enzymology research,” in Methods of soil enzymology. Editor R. P. Dick (Madison, WI: Soil Science Society of America), 1–34. doi:10.2136/sssabookser9.c1
European Commission (2021). EU soil strategy for 2030. Available online at: https://environment.ec.europa.eu/publications/eu-soil-strategy-2030_en.
Fanin, N., Mooshammer, M., Sauvadet, M., Meng, C., Alvarez, G., Bernard, L., et al. (2022). Soil enzymes in response to climate warming: mechanisms and feedbacks. Funct. Ecol. 36 (6), 1378–1395. doi:10.1111/1365-2435.14027
Fei, Y., Huang, S., Zhang, H., Tong, Y., Wen, D., Xia, X., et al. (2020). Response of soil enzyme activities and bacterial communities to the accumulation of microplastics in an acid cropped soil. Sci. Total Environ. 707, 135634. doi:10.1016/j.scitotenv.2019.135634
Fierer, N., and Schimel, J. P. (2003). A proposed mechanism for the pulse in carbon dioxide production commonly observed following the rapid rewetting of a dry soil. Soil Sci. Soc. Am. J. 67 (3), 798–805. doi:10.2136/sssaj2003.7980
Gee, G. W., and Bauder, J. W. (1986). “Particle-size analysis,” in Methods of soil analysis. 2nd ed. (American Society of Agronomy, Inc. Soil Science Society of America, Inc) 1149–1178.
Geng, Y., Dighton, J., and Gray, D. (2012). The effects of thinning and soil disturbance on enzyme activities under pitch pine soil in New Jersey pinelands. Appl. Soil Ecol. 62, 1–7. doi:10.1016/j.apsoil.2012.07.001
German, D. P., Weintraub, M. N., Grandy, A. S., Lauber, C. L., Rinkes, Z. L., and Allison, S. D. (2011). Optimization of hydrolytic and oxidative enzyme methods for ecosystem studies. Soil Biol. Biochem. 43 (7), 1387–1397. doi:10.1016/j.soilbio.2011.03.017
Gomez, E. J., Delgado, J. A., and Gonzalez, J. M. (2020). Environmental factors affect the response of microbial extracellular enzyme activity in soils when determined as a function of water availability and temperature. Ecol. Evol. 10 (18), 10105–10115. doi:10.1002/ece3.6672
Gomez, E. J., Delgado, J. A., and Gonzalez, J. M. (2021). Influence of water availability and temperature on estimates of microbial extracellular enzyme activity. PeerJ 9, e10994. doi:10.7717/peerj.10994
Guber, A., Kravchenko, A., Razavi, B. S., Uteau, D., Peth, S., Blagodatskaya, E., et al. (2018). Quantitative soil zymography: mechanisms, processes of substrate and enzyme diffusion in porous media. Soil Biol. Biochem. 127 (June), 156–167. doi:10.1016/j.soilbio.2018.09.030
Guber, A., Blagodatskaya, E., Juyal, A., Razavi, B. S., Kuzyakov, Y., and Kravchenko, A. (2021). Time-lapse approach to correct deficiencies of 2D soil zymography. Soil Biol. Biochem. 157, 108225. doi:10.1016/j.soilbio.2021.108225
Hoang, D. T. T., Pausch, J., Razavi, B. S., Kuzyakova, I., Banfield, C. C., and Kuzyakov, Y. (2016). Hotspots of microbial activity induced by earthworm burrows, old root channels, and their combination in subsoil. Biol. Fertil. Soils 52 (8), 1105–1119. doi:10.1007/s00374-016-1148-y
Houba, V. J. G., Temminghoff, E. J. M., Gaikhorst, G. A., and van Vark, W. (2000). Soil analysis procedures using 0.01 M calcium chloride as extraction reagent. Commun. Soil Sci. Plant Analysis 31 (9–10), 1299–1396. doi:10.1080/00103620009370514
ICH (2005). ICH: harmonised tripartite guideline - validation of analytical procedures: text and methodology Q2(R1). Available online at: https://database.ich.org/sites/default/files/Q2%28R1%29%20Guideline.pdf.
ISO/TS 22939 (2019). Soil quality-Measurement of enzyme activity patterns in soil samples using fluorogenic substrates in micro-well plates. Vernier, Switzerland: ISO copyright office. Available online at: www.iso.org.
King, W. L., Grandinette, E. M., Trase, O., Rolon, M. L., Salis, H. M., Wood, H., et al. (2024). Autoclaving is at least as effective as gamma irradiation for biotic clearing and intentional microbial recolonization of soil. msphere 9, e00476-24–24. doi:10.1128/msphere.00476-24
Kuzyakov, Y., and Blagodatskaya, E. (2015). Microbial hotspots and hot moments in soil: concept and review. Soil Biol. Biochem. 83, 184–199. doi:10.1016/j.soilbio.2015.01.025
Lang, F., Krüger, J., Amelung, W., Willbold, S., Frossard, E., Bünemann, E. K., et al. (2017). Soil phosphorus supply controls P nutrition strategies of beech forest ecosystems in central Europe. Biogeochemistry 136 (1), 5–29. doi:10.1007/s10533-017-0375-0
Lehmann, J., Bossio, D. A., Kögel-Knabner, I., and Rillig, M. C. (2020). The concept and future prospects of soil health. Nat. Rev. Earth and Environ. 1 (10), 544–553. doi:10.1038/s43017-020-0080-8
Lorenz, N., and Dick, R. P. (2011). “Sampling and pretreatment of soil before enzyme analysis,” in Methods of soil enzymology. Editor R. P. Dick (Madison, WI: Soil Science Society of America), 85–101. doi:10.2136/sssabookser9.c5
Marx, M.-C., Wood, M., and Jarvis, S. C. (2001). A microplate fluorimetric assay for the study of enzyme diversity in soils. Soil Biol. Biochem. 33 (12–13), 1633–1640. doi:10.1016/S0038-0717(01)00079-7
Meller, S., Frossard, E., Spohn, M., and Luster, J. (2020). Plant nutritional status explains the modifying effect of provenance on the response of beech sapling root traits to differences in soil nutrient supply. Front. For. Glob. Change 3, 535117. doi:10.3389/ffgc.2020.535117
Nannipieri, P., Giagnoni, L., Landi, L., and Renella, G. (2011). “Role of phosphatase enzymes in soil,” in Phosphorus in action. Editors E. Bünemann, A. Oberson, and E. Frossard (Springer Berlin Heidelberg), 215–243. doi:10.1007/978-3-642-15271-9_9
Nannipieri, P., Trasar-Cepeda, C., and Dick, R. P. (2018). Soil enzyme activity: a brief history and biochemistry as a basis for appropriate interpretations and meta-analysis. Biol. Fertil. Soils 54 (1), 11–19. doi:10.1007/s00374-017-1245-6
Razavi, B. S., Zhang, X., Bilyera, N., Guber, A., and Zarebanadkouki, M. (2019). Soil zymography: simple and reliable? Review of current knowledge and optimization of the method. Rhizosphere 11, 100161. doi:10.1016/j.rhisph.2019.100161
Riah, W., Laval, K., Laroche-Ajzenberg, E., Mougin, C., Latour, X., and Trinsoutrot-Gattin, I. (2014). Effects of pesticides on soil enzymes: a review. Environ. Chem. Lett. 12 (2), 257–273. doi:10.1007/s10311-014-0458-2
Schimel, J., Becerra, C. A., and Blankinship, J. (2017). Estimating decay dynamics for enzyme activities in soils from different ecosystems. Soil Biol. Biochem. 114, 5–11. doi:10.1016/j.soilbio.2017.06.023
Sinsabaugh, R. L., and Shah, J. J. F. (2012). Ecoenzymatic stoichiometry and ecological theory. Annu. Rev. Ecol. Evol. Syst. 43, 313–343. doi:10.1146/annurev-ecolsys-071112-124414
Sinsabaugh, R. L., Lauber, C. L., Weintraub, M. N., Ahmed, B., Allison, S. D., Crenshaw, C., et al. (2008). Stoichiometry of soil enzyme activity at global scale. Ecol. Lett. 11 (11), 1252–1264. doi:10.1111/j.1461-0248.2008.01245.x
Sinsabaugh, R. L., Hill, B. H., and Follstad Shah, J. J. (2009). Ecoenzymatic stoichiometry of microbial organic nutrient acquisition in soil and sediment. Nature 462 (7274), 795–798. doi:10.1038/nature08632
Skjemstad, J. O., and Baldock, J. A. (2007). Total and organic carbon,” in Soil sampling and methods of analysis. 2nd Edn, Editor M. R. Carter, and E. G. Gregorich (Boca Raton, FL: CRC Press), 225–237. doi:10.1201/9781420005271
Spohn, M., and Kuzyakov, Y. (2013). Distribution of microbial- and root-derived phosphatase activities in the rhizosphere depending on P availability and C allocation - coupling soil zymography with 14C imaging. Soil Biol. Biochem. 67, 106–113. doi:10.1016/j.soilbio.2013.08.015
Spohn, M., and Kuzyakov, Y. (2014). Spatial and temporal dynamics of hotspots of enzyme activity in soil as affected by living and dead Roots—A soil zymography analysis. Plant Soil 379 (1–2), 67–77. doi:10.1007/s11104-014-2041-9
Tabatabai, M. A. (1994). “Soil enzymes,” in Methods of soil analysis, part 2: microbiological and biochemical properties (wiley), Editors R. W. Weaver, S. Angle, P. Bottomley, D. Bezdicek, S. Smith, and A. Tabataba (Madison, WI: Soil Science Society of America), 775–833. doi:10.2136/sssabookser5.2.c37
Tegtmeier, J., Dippold, M. A., Kuzyakov, Y., Spielvogel, S., and Loeppmann, S. (2021). Root-o-Mat: a novel tool for 2D image processing of root-soil interactions and its application in soil zymography. Soil Biol. Biochem. 157, 108236. doi:10.1016/j.soilbio.2021.108236
Vargas, R., Carbone, M. S., Reichstein, M., and Baldocchi, D. D. (2011). Frontiers and challenges in soil respiration research: from measurements to model-data integration. Biogeochemistry 102 (1–3), 1–13. doi:10.1007/s10533-010-9462-1
Wallenstein, M. D., Burns, R. G., and Dick, R. P. (2011). “Ecology of extracellular enzyme activities and organic matter degradation in soil: a complex community-driven process,” in Methods of soil enzymology, 35–55. doi:10.2136/sssabookser9.c2
Xiao, W., Chen, X., Jing, X., and Zhu, B. (2018). A meta-analysis of soil extracellular enzyme activities in response to global change. Soil Biol. Biochem. 123, 21–32. doi:10.1016/j.soilbio.2018.05.001
Keywords: soil enzymatic activity, biological soil function indicator, method validation, mineralization, soil organic matter, nutrient cycling
Citation: Fetzer J, Meller S, Iven H, Baur D, García Rivera P, Meller A and Luster J (2025) Novel, laboratory-independent device to measure extracellular enzymatic activity in soils. Front. Environ. Sci. 13:1663635. doi: 10.3389/fenvs.2025.1663635
Received: 10 July 2025; Accepted: 09 September 2025;
Published: 24 September 2025.
Edited by:
Kaibo Wang, Chinese Academy of Sciences (CAS), ChinaReviewed by:
Iryna Loginova, University of Tübingen, GermanyChongyang Li, University of Illinois Urbana-Champaign, United States
Copyright © 2025 Fetzer, Meller, Iven, Baur, García Rivera, Meller and Luster. This is an open-access article distributed under the terms of the Creative Commons Attribution License (CC BY). The use, distribution or reproduction in other forums is permitted, provided the original author(s) and the copyright owner(s) are credited and that the original publication in this journal is cited, in accordance with accepted academic practice. No use, distribution or reproduction is permitted which does not comply with these terms.
*Correspondence: Jörg Luster, am9lcmcubHVzdGVyQHdzbC5jaA==