 Diaa Sheishah1,2*
 Ahmed Mohsen3,4
 Enas Abdelsamei1,2
 Izabella Babcsányi1
 Omar Alsenjar5
 Gergő Magyar1
 Viktória Blanka Végi1
 Karolina Solymos1
 György Sipos1*
- 1Department of Physical and Environmental Geography, University of Szeged, Szeged, Hungary
- 2Geomagnetic and Geoelectric Department, National Research Institute of Astronomy and Geophysics, Helwan, Egypt
- 3Department of Hydraulic and Water Resources Engineering, Faculty of Civil Engineering, Budapest University of Technology and Economics, Budapest, Hungary
- 4Department of Irrigation and Hydraulics Engineering, Tanta University, Tanta, Egypt
- 5Department of Agricultural Structures and Irrigation, Cukurova University, Adana, Türkiye
Remote sensing has become increasingly valuable for monitoring inland water quality across space and time. However, detecting key water quality parameters (WQPs) using satellite imagery in small water bodies remains challenging. This study aims to (1) develop regression models for estimating arsenic (As), ammonium (NH4+), chemical oxygen demand (COD), water hardness expressed as calcium oxide equivalent (CaOeq), and total suspended solids (TSS) using Sentinel-2 imagery and in situ measurements from 2019 to 2021 in Vadkert Lake, Hungary; and (2) assess the spatial and seasonal dynamics of these WQPs by applying the models to Sentinel-2 images from four key dates in 2024. The modified normalized difference water index (MNDWI) was applied to isolate water pixels, retaining bands B2 to B8a for their high spatial resolution and relevance. Mean reflectance values around 20 sampling sites were extracted and correlated with measured concentrations of the five WQPs. Stepwise multilinear regression models were developed for As, NH4+, and COD, which exhibited the strongest correlations with band reflectance (R2 = 0.91–0.99). These models were applied to four seasonal Sentinel-2 images from 2024 to map the spatial and temporal distribution of the WQPs. Results revealed that As levels peaked in summer (76.8 ± 20.7 μg/L) and were spatially uniform, while NH4+ and COD also peaked in summer (0.2 ± 0.3 mg/L and 7.3 ± 2.01 mg/L, respectively), with elevated values at the southern and eastern lake margins. These findings show that satellite-based seasonal water quality assessment is feasible in small lakes and supports cost-effective environmental management.
1 Introduction
Remote sensing serves as an effective tool for providing economical and dependable water quality data for aquatic ecosystems, particularly due to advancements in the spatial, spectral, and temporal capabilities of satellite constellations (Mohsen et al., 2023b). It mitigates the constraints of in situ measurements by providing extensive spatiotemporal coverage and accessibility for unreachable aquatic systems, especially under severe weather conditions. This data is essential for identifying pollution hotspots and suggesting real-time solutions (Ma et al., 2023). The concept is based on the interaction between water and incident light, as various water constituents reflect and absorb wavelengths to differing extents (Mohsen et al., 2023a). Clear water generally reflects blue light and absorbs infrared radiation, but the addition of organic and/or inorganic substances enhances reflectivity in the infrared spectrum. The magnitude of growth can be utilised to deduce its concentration via empirical (Matthews, 2011), semi-empirical (Wang and Yang, 2019), and analytical (Jaywant and Arif, 2024) methodologies.
Sentinel-2 images have recently been shown to be highly useful for monitoring lake and reservoir water quality parameters. With high accuracy, researchers have estimated chlorophyll-a, coloured dissolved organic matter, dissolved organic carbon, turbidity, and other parameters using Sentinel-2 data (Toming et al., 2016; Elhag et al., 2019; Xu et al., 2019). To improve the retrieval of water quality information (Ciężkowski et al., 2022; Kokal et al., 2024; Toming et al., 2024), a variety of techniques, including band ratio algorithms, spectral indices, and machine learning approaches, have been employed. For some parameters, particularly chlorophyll-a (Xu et al., 2019), studies have found that Sentinel-2 performs better than Landsat 8. Complementing conventional field sampling approaches, remote sensing technologies allow quick, meticulous, and cost-effective monitoring of inland waters (Llodrà-Llabrés et al., 2023). Still, difficulties with atmospheric correction and algorithm adaptation to local conditions (Jaelani and Ratnaningsih, 2018; Ciężkowski et al., 2022) are numerous. In the Carpathian Basin there is a long tradition of inland excess water (“belvíz”) mapping with optical remote sensing, providing regional methodological context for our water-surface delineation (Rakonczai et al., 2001; Csendes and Mucsi, 2016).
Several remote sensing platforms and regression methodologies have been utilised to quantify specific water quality parameters (WQPs), including suspended sediment concentration (SSC), chlorophyll-a (Chl-a), and nutrient concentrations. Dekker et al. (1996) utilized the Airborne CASI platform over small lakes in the Netherlands, employing linear regression to estimate chlorophyll-a, total suspended solids (TSS), and turbidity, resulting in an R2 range of 0.81–0.95. In a similar vein, Mohsen et al. (2020) established empirical models employing stepwise multiple linear regression to predict Chl-a, TSS, pH, iron (Fe), zinc (Zn), chromium (Cr), and ammonium (NH4+) in Burullus Lake, Egypt, utilising Landsat 7 imagery, obtaining a R2 range of 0.6–0.86. Furthermore, Sentinel-2 MSI was used to determine Chl-a, TSS, turbidity, and total nitrogen (TN) in Lake Manyame, Zimbabwe, by multiple regression analysis, attaining an R2 range of 0.63–0.95 (Chawira et al., 2013).
While remote sensing, primarily through Sentinel-2 imagery, has become a prevalent method for monitoring water quality in lakes and reservoirs—facilitating the estimation of parameters like chlorophyll-a, turbidity, and dissolved organic content with high spatial and temporal resolution—numerous studies have employed spectral indices, band ratio algorithms, and machine learning models to retrieve water quality indicators accurately. However, a significant gap persists, as few studies have focused on employing Sentinel-2 data to detect and model non-optically active water quality parameters such as arsenic (As), ammonium (NH4+), chemical oxygen demand (COD), Calcium oxide equivalent (CaOeq), and total suspended solids (TSS) particularly in small, shallow lakes. We focused especially on these five WQPs; As, NH4+, COD, TSS, CaOeq because they represent key management concerns in small, shallow Hungarian lakes. TSS controls light attenuation and water clarity; COD captures oxidizable organic load, often linked to colored dissolved organic matter that affects reflectance. NH4+ is an indicator of nitrogen loading and potential toxicity under warm, low-oxygen conditions typical of summer; As is a toxic trace element of screening interest; and CaOeq characterizes the carbonate system in this alkaline, shallow lake, informing interpretation of optical background and buffering capacity. Together, these analytes align with routine regional monitoring and provide a practical set for testing whether lake-specific empirical models from Sentinel-2 can support targeted sampling, early-warning screening, and mitigation prioritization at Lake Vadkert.
Also, These variables are crucial for comprehending human-caused impacts and ecological hazards, although they are inadequately investigated due to their feeble or indirect spectral fingerprints. Furthermore, most prior research emphasizes single-time or annual assessments, neglecting the seasonal variability that might substantially affect parameter concentrations. Research combining in situ data with regression-based techniques for localised calibration and validation in Central European lake systems is somewhat scarce. Therefore, the objectives of our study are as follows:
• Create and evaluate regression models applying Sentinel-2 imaging and in situ data to estimate key water quality metrics (As, NH4+, COD, CaOeq, and TSS) in Vadkert Lake, by determining suitable spectral bands and verifying model efficacy against field measurements.
• Evaluate the seasonal and local variances in water quality in 2024 by using established models based on multi-season Sentinel-2 imagery, highlighting temporal trends and pollution hotspots to promote informed lake management.
From a water-management standpoint, generating lake-wide maps of As, NH4+, and COD from freely available Sentinel-2 Level-2A data provides decision-ready evidence for small, shallow lakes where grab sampling is spatially sparse. These seasonal products help managers (i) prioritize when and where to sample, (ii) implement early-warning screening after heatwaves or low-flow periods that are expected to become more frequent under climate change, and (iii) target source control and remediation in sub-catchments and shoreline zones under the greatest pressure. Because the workflow relies on simple, locally calibrated empirical models applied to routine satellite acquisitions, it is low-cost, repeatable, and readily transferable to nearby lakes—supporting more sustainable and adaptive water-quality management within real monitoring budgets.
2 Study area
Lake Vadkerti is a saline (alkaline) lake located in the sandy area of the Danube-Tisza Interfluve (Figure 1), on the Kiskunság sand ridge, roughly 3 km northwest of Soltvadkert, within the deepest section of an 8–10 km long northwest-southeast directed depression. The lake basin is situated 1–2 m below its immediate surroundings, at an elevation of 110 m above sea level. This enables the passage of groundwater as well as surface waters into the lake basin. The lake’s surface area is 67.3 ha (at an elevation of 108.5 m above sea level), with 43.7 ha of open water and 23.6 ha of reed coverage in the eastern region. The lake often has an average depth of 1–2 m throughout its entire length.
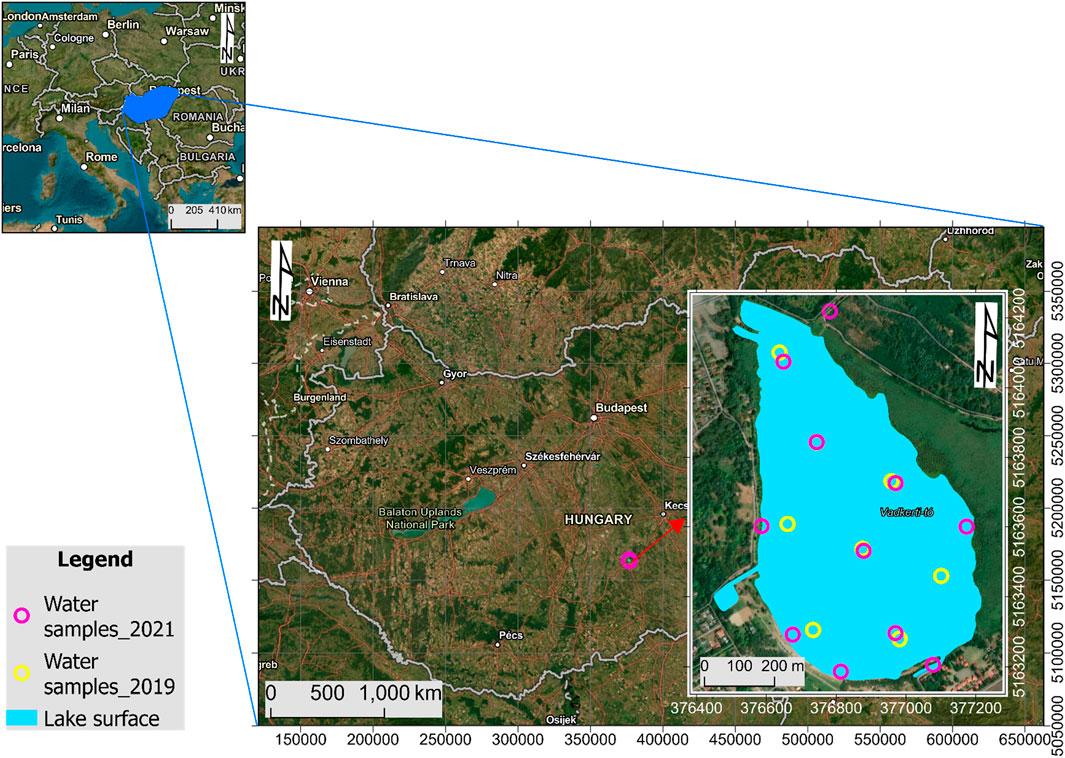
Figure 1. Location map of the study area, showing the positions of water sampling sites collected over 2 years (2019 and 2021) during monitoring surveys.
The lake’s hydrological equilibrium is influenced by both natural and human factors, significantly affecting its long-term water level stability. Atmospheric precipitation directly onto the lake surface contributes around 350,000 m3 per year, signifying a substantial intake with a stabilizing impact. This intake, despite interannual variability, does not affect the decrease in water levels. Surface runoff from the adjacent catchment is negligible; however, subsurface inflow from aquifers contributes around 245,000 m3 per year. This is contingent upon the comparative height of the lake’s water surface and the adjacent aquifers. Evaporative losses are the predominant and enduring adverse element of the lake’s water budget, estimated at roughly 440,000 m3, with model forecasts suggesting an additional increase of 15,000–30,000 m3 for the 21st century (Keve and Nováky, 2011; Csáki et al., 2018). Infiltration into the sandy subsoil leads to supplementary losses, estimated at approximately 130,000 m3 per year. This infiltration process is gradual yet regularly diminishes the lake’s volume. To mitigate these deficiencies, nearly 400,000 cubic meters of groundwater are artificially replenished annually. Nevertheless, this artificial water supply is inadequate to counteract the prolonged decline. The combined impact of elevated evaporation rates, restricted natural inflows, and comparatively ineffective artificial replenishment has resulted in a consistent and quantifiable decrease in the lake’s water level, notwithstanding annual fluctuations (Sipos et al., 2021). This geomorphological and use context informed the sampling design and the choice of target parameters and retrieval bands detailed in Section 3.
3 Materials and methods
We combined two in-situ campaigns (2019, 2021) with multi-date Sentinel-2 Level-2A processing to delineate open water (MNDWI), extract cloud-free surface reflectance (B2–B8a), calibrate lake-specific empirical models for As, NH4+, and COD against laboratory measurements, and produce seasonal maps for 2024 with associated uncertainty.
3.1 Sampling design and handling
Surface-water sampling was conducted on two campaigns: October 2019 (n = 8) and June 2021 (n = 12), with sites uniformly distributed across the lake (Figure 1). An additional channel site was included to characterize inflow from the long-water region. Samples were collected at 0.30 m depth; at very shallow locations, surface grabs were taken. Immediately after collection, samples were placed in clean containers, stored on ice, transported under refrigeration, and held at 4 °C in the laboratory until analysis according to accredited holding-time procedures.
3.2 Laboratory analyses
All determinations were performed at the Soil and Water Testing Laboratory, Department of Physical and Environmental Geography, University of Szeged (accredited laboratory NAH-1-1437/2018) under standard operating procedures. Methods were as follows: total suspended solids (TSS)—gravimetric determination after filtration through 0.45 µm pre-weighed membrane filters and drying to constant mass; total water hardness (reported as CaOeq)—EDTA titration with Eriochrome Black T, results expressed as mg L-1 CaOeq; chemical oxygen demand (COD)—permanganate oxidation with 10 min boiling and oxalic-acid back-titration; ammonium (NH4+)—flow-injection spectrophotometry (FOSS FIAstar 5000); arsenic (As)—ICP-OES after 0.45 µm filtration (PerkinElmer Optima 7000 DV).
3.3 Quality assurance and quality control (QA/QC)
All measurements were performed in triplicate with analytical precision ≤10% (laboratory records). Sampling, preservation, and analysis followed accredited SOPs, including refrigerated handling, analysis within prescribed holding times, and metals measured on filtered aliquots. Instrument performance was verified through the laboratory’s QA/QC program (calibration standards, blanks, and continuing checks). Detection limits are reported where relevant (e.g., NH4+ < 0.25 mg L-1 in 2021).
3.4 Acquisition and pre-processing of remote sensing data
Google Earth Engine (GEE), specifically the “COPERNICUS/S2-SR-HARMONIZED” dataset, was utilized to identify Sentinel-2 images covering Vadkert Lake during the in situ measurements conducted in 2019 and 2021. The images were filtered to include only those with less than 20% cloud cover. The closest images to the in situ campaigns were acquired on 13 August 2019, and 9 May 2021, corresponding to the 34TCS tile and a relative orbit 36. Additionally, four images representing different seasons in 2024 were selected: January 29, May 13, July 17, and November 09. All scenes were used in Level-2A surface reflectance (SR) form produced by the ESA Sen2Cor atmospheric-correction processor. We used the Scene Classification Layer (SCL) to remove pixels flagged as cloud shadow, cloud (high and medium probability), cirrus, and snow/ice. We selected L2A/Sen2Cor—rather than per-scene empirical corrections such as QUAC—to ensure sensor-consistent, physically based SR across dates and to leverage the integrated SCL for masking. The modified normalized difference water index (MNDWI), developed by Xu (2006) (Equation 1), was applied with a threshold of 0 to mask water pixels, and the lake area was subsequently clipped. Predictor bands for retrieval were B2–B8a (10–20 m). Bands B1, B9, B10, and B12 were excluded due to lower spatial resolution and/or limited sensitivity to the targeted WQPs. Band B11 (SWIR, 1610 nm) was used only for MNDWI (Equation 1) and was not included in the regression models.
where MNDWI: modified normalized difference water index; RB3: surface reflectance in the green band (B3, ≈560 nm); RB11: surface reflectance in the shortwave-infrared band (B11, ≈1610 nm).
3.5 Derivation of water quality parameter models
A window of 2 × 2 pixels was placed around the sampling sites (8 sites in 2019 and 12 sites in 2021), and the reflectance values of bands (B2 to B8a) were extracted and averaged. The correlation between band reflectance and measured WQPs (i.e., COD, CaOeq, TSS, As, and NH4+H was assessed through the Pearson correlation coefficient. Regression models were subsequently developed for parameters with strong correlations, employing the stepwise multilinear regression technique. These models were applied to historical images from 2024 to investigate the spatial and temporal dynamics of the selected water quality parameters. The analysis was conducted using a combination of Sentinel Application Platform (SNAP, version 8.0), Python 3.0, and Quantum GIS (QGIS 3.34). Our choice of WQPs therefore spans parameters with direct optical coupling (TSS, COD) and indirect, management-relevant indicators (NH4+, As, CaOeq), reflecting both the monitoring priorities for Hungarian small lakes and the environmental pressures pertinent to Lake Vadkert.
3.6 Retrieval algorithms and equations
We retained Sentinel-2 Level-2A bands B2–B8a as predictors and used B11 only for water masking via MNDWI (Equation 1). Around each in-situ sample (2019: n = 8; 2021: n = 12), we extracted mean surface reflectance from a 2 × 2-pixel window and fitted stepwise multiple linear regressions for parameters that showed strong band–WQP relationships. The following lake-specific empirical models Equations 2–4 were used to generate maps:
For As (µg L-1):
For NH4+ (mg L-1):
For COD (mg L-1):
We explored models for CaOeq and TSS; however, these did not generalize reliably (weak to moderate correlations, limited variability and range-coded values for TSS).
4 Results
4.1 Water quality of Lake Vadkerti
A comparative analysis of five water quality parameters—COD, CaOeq, TSS, As, and NH4+—between 2019 and 2021 reveals notable temporal variations that reflect changes in the lake’s hydrological and biogeochemical conditions. Varying precipitation patterns, surface and subsurface inflows, and seasonal dynamics likely influence the observed differences. This section analyzes the specific trends and implications associated with each parameter, highlighting potential sources of pollution and shifts in water quality status over the 2 years (Table 1).
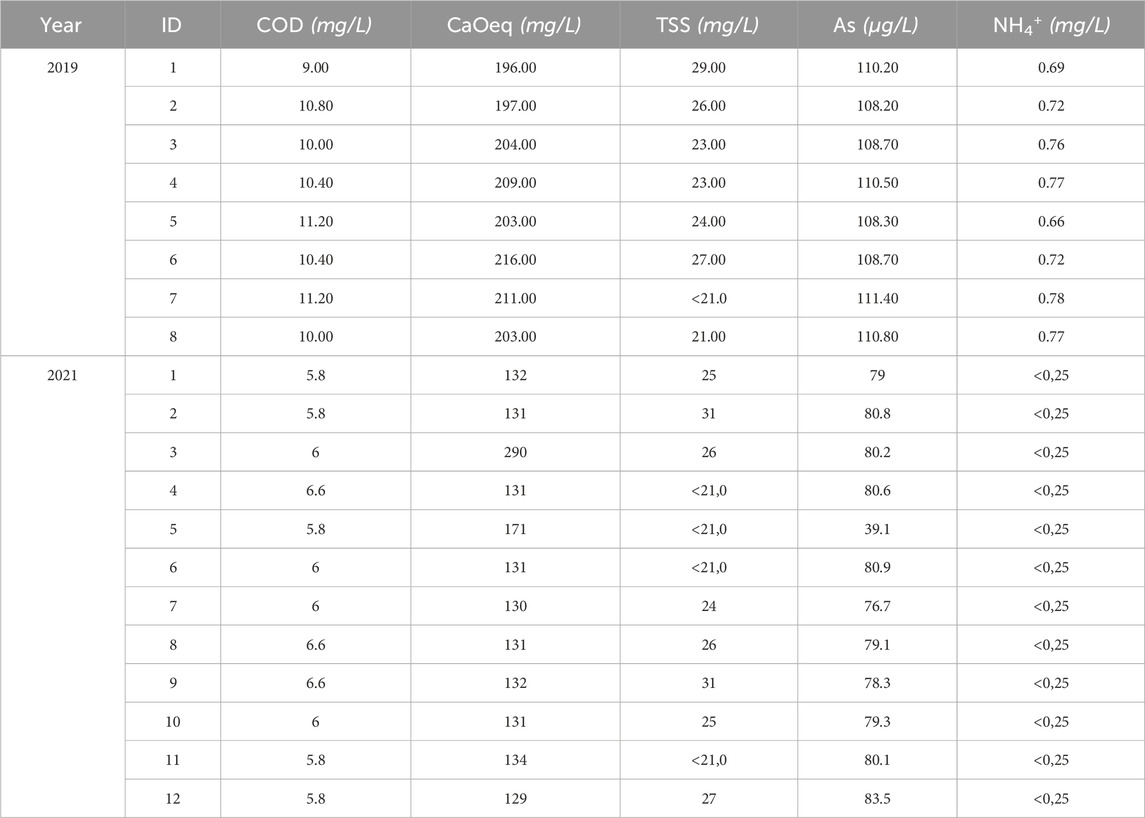
Table 1. Measured water quality parameters in Lake Vadkerti during two sampling campaigns in October 2019 and June 2021. Parameters include COD, CaOeq, TSS, As, and NH4+.
In 2019, the COD values ranged between 9.00 and 11.20 mg/L, indicating relatively elevated levels of organic matter. In contrast, the COD values in 2021 significantly decreased, ranging from 5.8 to 6.6 mg/L. This decline suggests an overall improvement in water quality and a reduction in organic pollution, potentially due to changes in land use, wastewater input, or hydrological conditions. Similarly, total hardness (CaOeq) values showed a notable reduction from 196 to 216 mg/L in 2019 to 129–171 mg/L in 2021, except for one outlier (290 mg/L in 2021). This reduction could be attributed to dilution effects from increased precipitation or surface inflow, supporting the hypothesis of wetter conditions in 2021.
The TSS values were generally lower in 2021 compared to 2019. While 2019 values ranged between 21.0 and 29.0 mg/L, most 2021 samples were below 21 mg/L, with only a few reaching 31 mg/L. This decrease indicates reduced erosion, sediment resuspension, or runoff, possibly due to calmer hydrodynamic conditions. NH4+ concentrations further support this pattern: values in 2019 ranged from 0.66 to 0.78 mg/L, while all 2021 samples were below the detection limit (<0.25 mg/L). This dramatic reduction implies lower levels of nutrient pollution or improved nitrification, both of which are signs of better ecological status.
Concentrations showed a marked decline between the 2 years. In 2019, As ranged from 108.2 to 111.4 μg/L, but it dropped to 39.1–83.5 μg/L in 2021. The lower As levels suggest a potential change in geochemical dynamics, input sources, or mobilization processes, possibly influenced by hydrological conditions or seasonal shifts.
Overall, the comparison reveals a consistent trend of improving water quality from 2019 to 2021. This improvement may be driven by climatic factors (e.g., increased rainfall and dilution), reduced anthropogenic input, or internal lake processes stabilizing over time.
4.2 Correlation analysis and water quality models
The correlation analysis demonstrated a very strong relationship between band reflectance and As, NH4+, and COD, a moderate correlation with CaOeq, and a weak correlation with TSS (Table 2). Focusing on the correlation among the WQPs, As, NH4, and COD were the most correlated parameters, showing the highest correlation magnitude (r = 0.962–0.994), while CaOeq and TSS were less correlated with these parameters, and they showed the highest correlation with NH4+ (r = 0.585) and COD (r = −0.218), respectively. In terms of band reflectance, typically, B2 and B4 showed negative correlations with WQPs, while the other bands showed positive correlations. COD showed its highest correlation with B7, CaOeq with B2, TSS with B4, and both As and NH4+ with B5.

Table 2. Pearson correlation coefficient among water quality parameters (WQPs) and reflectance of Sentinel-2 bands (B2–B8a).
Regression models were developed for the most correlated WQPs with Sentinel-2 bands—namely, As, NH4+, and COD. The models demonstrated promising accuracy, with R2 values ranging from 0.91 (COD) to 0.99 (As). The analysis revealed that specific Sentinel-2 bands, particularly B4 (red) and B5 (red edge), were the most influential contributors to the three WQPs. Besides, B3 (green) showed a notable contribution to the models for As and NH4+.
The three models used for mapping (As, NH4+, and COD) are reported in materials and methods (Equations 2–4) and are applied to the seasonal Sentinel-2 scenes described below.
4.3 Spatiotemporal distribution of water quality parameters in the lake
The spatiotemporal distribution of the three WQPs was depicted across seasons by applying the developed models to Sentinel-2 images acquired on specific dates in 2024 (Figure 2). The maps in Figure 2 were generated using the retrieval equations listed in materials and methods (Equations 2–4). The seasonal variability of the parameters was evident, especially when comparing summer with the other seasons. The As concentration slightly increased from 64.7 ± 9.1 μg/L in winter to 66.3 ± 10.2 μg/L in spring, then surged by 15% (76.8 ± 20.7 μg/L) in summer, before recording the lowest concentration in autumn (63.9 ± 8.3 μg/L). Notably, the spatial distribution of As was almost uniform across seasons (Figures 2A,D,G,J). A similar temporal trend was noticed for NH4+ since it slightly increased from 0.001 ± 0.0 mg/L in winter to 0.008 ± 0.0 mg/L, reached its peak in summer (0.2 ± 0.3 mg/L), and declined again in autumn to return to winter’s mean value of 0.001 ± 0.0 mg/L. However, its spatial distribution was non-uniform in winter and autumn, with relatively higher concentrations observed in the southern and eastern peripheries of the lake (Figures 2B,K). In contrast, a uniform distribution occurred in spring and summer (Figures 2E,H). The COD declined slightly from 5.6 ± 0.67 mg/L in winter to record its lowest concentration in spring (5.5 ± 0.48 mg/L). Then, it peaked in summer (7.3 ± 2.01 mg/L) and recorded a relatively high concentration in autumn (5.75 ± 0.79 mg/L). The spatial distribution of COD mirrored that of NH4+, with higher concentrations observed in the southern and eastern lake peripheries (Figures 2C,L), and a more uniform distribution in spring and summer (Figures 2F,I).

Figure 2. Seasonal Sentinel-2 maps of water-quality parameters for Lake Vadkerti (Hungary). Columns show parameters: arsenic (As, μg L-1), ammonium (NH4+, mg L-1), and chemical oxygen demand (COD, mg L-1). Rows show seasons/dates: winter (29 January 2024), spring (13 May 2024), summer (17 July 2024), and autumn (9 November 2024). Panels: (A–C) winter As, NH4+, COD; (D–F) spring As, NH4+, COD; (G–I) summer As, NH4+, COD; (J–L) autumn As, NH4+, COD. Open water was delineated with MNDWI (threshold = 0) and a 10 m shoreline buffer; retrieval equations are given in Methods (Equations 2–4). Color scales are fixed by parameter across seasons; north arrow and 100 m scale bar shown. Lake-wide mean values for each date are annotated in the panels.
5 Discussion
5.1 Drivers of seasonal water-quality dynamics
Integrating Sentinel-2 MSI surface reflectance with in-situ WQPs via regression yielded spatially explicit, multi-date maps that enable continuous lake monitoring, with high predictive accuracy (R2 = 0.91–0.99) across the study period. The seasonal patterns align with established process controls: wind-driven resuspension and shoreline disturbance episodically elevate TSS, while organic loading and in-lake production/decay shape COD, particularly in warm months. Although As and NH4+ are not directly optically active, they display strong associations with the red/red-edge bands (B5, B7), indicating indirect coupling through co-variation with optically active constituents and shoreline/inflow influences. These dynamics are consistent with observations from other systems (e.g., Mohsen et al., 2022; Mallick et al., 2014).
5.2 Human pressures and management implications
The spatiotemporal variability mapped for 2024 highlights localized impacts from both natural and anthropogenic activities. Elevated As, NH4+, and COD in summer likely reflect increased evaporation, intensified microbial activity, and heightened agricultural/urban pressures around peak season aligned with Li et al. (2019). These maps enable managers to prioritize sampling, deploy early-warning screening after heatwaves or low-flow periods, and target mitigation at shoreline and inflow hotspots.
5.3 Climate-change sensitivity of seasonal fluctuations
In our study, summer increases in NH4+ and COD and the concentration of shoreline/inflow hotspots are consistent with climate-driven mechanisms that intensify water-quality stressors: warmer conditions and lake heatwaves strengthen stratification, extend residence time, and elevate oxygen demand, fostering ammonification and organic-matter processing that raise NH4+ and COD, while low water levels heighten resuspension along shallow margins. These pathways align with evidence of widespread lake deoxygenation under recent warming (Jane et al., 2021) and with projections that lake heatwaves are becoming more frequent and severe, shifting biochemical regimes at sub-seasonal scales (Woolway et al., 2021a; Woolway, Anderson and Albergel, 2021b). Within this context, our multi-date Sentinel-2 workflow functions as a repeatable early-warning screen, capturing within-season shifts—including post-heatwave rises in NH4+/COD—and guiding adaptive sampling toward emergent hotspots in small, shallow alkaline lakes like Vadkert.
5.4 Comparison with water-quality standards and guidelines (WFD context)
For management context, we benchmarked our observations against typical EU Water Framework Directive (WFD) “good status” ranges: As ≤ 10 μg L-1, NH4+ ≈ ≤ 0.5 mg L-1 (type-specific), COD ≈ ≤ 25 mg L-1 (noting method alignment, CODMn vs. CODCr, and TSS typically < 25–50 mg L-1; CaOeq is not directly regulated under WFD and is used contextually as alkalinity/hardness (commonly ∼20–200 mg L-1 as CaCO3 equivalents) (ERA-COMM EU Water Law training; Austrian Federal Ministry—BMLUK, WFD guidance).
5.5 Methodological limitations and future directions
Our lake-specific stepwise multilinear regressions on Sentinel-2 L2A reflectance achieved high predictive skill for As, NH4+, and COD in a small, shallow alkaline lake—matching or exceeding accuracies often reported for band-ratio or machine-learning schemes in comparable settings (Ciężkowski et al., 2022; Kokal et al., 2024). The linear framework remains transparent and reproducible, with performance confirmed by k-fold cross-validation and by-year (withheld-year) tests. Because As and NH4+ are inferred indirectly via co-variation with optically active constituents, model validity is context-dependent and can weaken under domain shift (e.g., atypical hydrology or loading). As with MSI data generally, multicollinearity among red/red-edge bands and limited sample size can inflate apparent fit; our diagnostics mitigate but cannot eliminate this risk. Potential saturation at high concentrations and adjacency/atmospheric residuals near shorelines also warrant caution; using L2A/Sen2Cor and explicit QA/QC reduces, but does not remove, these effects (cf. Jaelani and Ratnaningsih, 2018). Overall, the results indicate that well-calibrated linear baselines can deliver strong, interpretable performance for management use, while future work should broaden seasonal/hydrologic coverage, test non-linear learners against these baselines under rigorous external validation, and incorporate pH/temperature to contextualize ammonia risk. Future work should quantify high-stage groundwater–lake exchange using Hungary-proven geophysical levee-diagnostic techniques to test seepage-driven inputs to Lake Vadkert (Sheishah et al., 2022; 2023; Abdelsamei et al., 2024).
5.6 Comparison with recent Sentinel-2 work
Our findings align with recent demonstrations of Sentinel-2 capability for inland-water WQPs. Studies such as Toming et al. (2016) and Xu et al. (2019) reported accurate retrievals of chlorophyll-a and turbidity, and our R2 = 0.91–0.99 for As, NH4+, COD indicate that—when locally calibrated—even indirect indicators can be mapped credibly. In line with Kowe et al. (2023), who achieved strong regressions for optically active parameters (OAPs) in Lake Manyame (TSM R2 = 0.90; turbidity R2 = 0.95) and a moderate fit for the non-optically active TN (R2 = 0.63), our Sentinel-2–based, locally calibrated models for a small, shallow alkaline lake similarly deliver high performance (As, NH4+, COD: R2 = 0.91–0.99) despite these targets being largely non-optically active. This contrast underscores two points: (i) Sentinel-2 consistently retrieves OAPs well across systems, and (ii) with careful local calibration and validation, indirect red/red-edge relationships can also support credible mapping of selected non-OAPs. Where our TSS correlations were weak—likely due to range-coded field values—Kowe’s strong TSM/turbidity results highlight the importance of rigorous in-situ characterization for particulate metrics. Together, the studies indicate complementary strengths across reservoir (Manyame) and small-lake (Vadkert) settings, while emphasizing the need for site-specific models and quality-controlled field data. We extend OAP-focused work by showing that locally calibrated red/red-edge proxies can map selected non-OAPs (As, NH4+, COD) in a small alkaline lake. We also note the practical advantage of Sentinel-2 over coarser platforms such as Landsat-8 for small, shallow lakes like Vadkert due to its finer spatial resolution.
5.7 TSS and CaOeq retrievals
Despite TSS being optically active, we observed low correlations with Sentinel-2 bands, likely due to in-situ methodological constraints (range-type TSS values at some sites rather than precise measurements). For CaOeq, correlations were moderate (strongest single-band with B2), and candidate multi-band fits failed withheld-year checks; consequently, we did not produce lake-wide retrievals for CaOeq or TSS.
6 Conclusion
This study confirms the utility of integrating Sentinel-2 satellite imagery with in situ measurements to monitor seasonal dynamics of water quality in small, shallow lakes. By applying the modified normalized difference water index (MNDWI) and focusing on high-resolution spectral bands (B2–B8a), we successfully isolated water bodies and extracted meaningful reflectance data. Multilinear regression models developed for As, NH4+, and COD showed strong predictive performance (R2 = 0.91–0.99), enabling accurate estimation of these parameters across different seasons. The results revealed distinct seasonal trends, with all three parameters peaking in summer—As reaching 76.8 ± 20.7 μg/L, NH4+ at 0.2 ± 0.3 mg/L, and COD at 7.3 ± 2.01 mg/L—highlighting the influence of seasonal processes such as temperature and biological activity. Spatial analysis identified consistent hotspots in the southern and eastern peripheries, suggesting areas of potential concern. This remote sensing-based approach provides a scalable, repeatable, and cost-effective method for monitoring water quality in inland lakes, thereby reducing the reliance on frequent field campaigns. It holds significant potential for supporting environmental management, early warning systems, and policymaking, particularly in regions with limited monitoring infrastructure or where climate change and land use intensification threaten freshwater ecosystems.
Data availability statement
The raw data supporting the conclusions of this article will be made available by the authors, without undue reservation.
Author contributions
DS: Conceptualization, Data curation, Formal Analysis, Investigation, Methodology, Software, Validation, Visualization, Writing – original draft, Writing – review and editing. AM: Conceptualization, Data curation, Formal Analysis, Methodology, Software, Validation, Visualization, Writing – original draft, Writing – review and editing. EA: Conceptualization, Formal Analysis, Investigation, Resources, Software, Writing – review and editing. IB: Conceptualization, Data curation, Investigation, Methodology, Project administration, Validation, Visualization, Writing – review and editing. OA: Formal Analysis, Methodology, Resources, Validation, Writing – review and editing. GM: Data curation, Investigation, Resources, Visualization, Writing – original draft. VV: Conceptualization, Investigation, Methodology, Resources, Writing – review and editing. KS: Conceptualization, Formal Analysis, Investigation, Writing – review and editing, Methodology, Project administration, Validation. GS: Conceptualization, Data curation, Formal Analysis, Funding acquisition, Investigation, Resources, Supervision, Writing – original draft, Writing – review and editing.
Funding
The author(s) declare that financial support was received for the research and/or publication of this article. This research was financially supported by the Interreg IPA Hungary-Serbia Programme (HUSRB/23R/11/006 – ADAPTisa). The publication was financially supported by the University of Szeged Open Access Fund, Grant ID: 7940.
Conflict of interest
The authors declare that the research was conducted in the absence of any commercial or financial relationships that could be construed as a potential conflict of interest.
Generative AI statement
The author(s) declare that no Generative AI was used in the creation of this manuscript.
Any alternative text (alt text) provided alongside figures in this article has been generated by Frontiers with the support of artificial intelligence and reasonable efforts have been made to ensure accuracy, including review by the authors wherever possible. If you identify any issues, please contact us.
Publisher’s note
All claims expressed in this article are solely those of the authors and do not necessarily represent those of their affiliated organizations, or those of the publisher, the editors and the reviewers. Any product that may be evaluated in this article, or claim that may be made by its manufacturer, is not guaranteed or endorsed by the publisher.
References
Abdelsamei, E., Tímár, A., Sheishah, D., Blanka-Végi, V., Hegyi, A., Runa, B., et al. (2024). Detection of seepage zones in artificial levees: a case study at the körös river, Hungary. Open Geosci. 16 (1), 20220744. doi:10.1515/geo-2022-0744
Chawira, M., Dube, T., and Gumindoga, W. (2013). Remote sensing-based water quality monitoring in chivero and manyame lakes of Zimbabwe. Phys. Chem. Earth 66, 38–44. doi:10.1016/j.pce.2013.09.003
Ciężkowski, W., Frąk, M., Kardel, I., Popielarski, P., and Chormański, J. (2022). Głuszyńskie Lake water quality assesment using Sentinel-2 data. GIS ostrava. GIS Ostrava 2022 Earth Observation Smart City Smart Region. doi:10.31490/9788024846026-16
Csáki, P., Szinetár, M. M., Herceg, A., Kalicz, P., and Gribovszki, Z. (2018). Climate change impacts on the water balance - case studies in Hungarian watersheds. Időjárás 122 (1), 81–99. doi:10.28974/idojaras.2018.1.6
Csendes, B., and Mucsi, L. (2016). Inland excess water mapping using hyperspectral imagery. Geogr. Pannonica 20 (4), 191–196. doi:10.5937/geopan1604191c
Dekker, A. G., Zamurović-Nenad, Ž., Hoogenboom, H. J., and Peters, S. W. M. (1996). Remote sensing, ecological water quality modelling and in situ measurements: a case study in shallow lakes. Hydrological Sci. J. 41 (4), 531–547. doi:10.1080/02626669609491524
Elhag, M., Gitas, I., Othman, A., Bahrawi, J., and Gikas, P. (2019). Assessment of water quality parameters using temporal remote sensing spectral reflectance in arid environments, Saudi Arabia. Water 11 (3), 556. doi:10.3390/w11030556
European Commission (2025). EU water law—Surface water status (WFD implementation training). ERA-COMM. Available online at: http://www.era-comm.eu/eu_water_law/part_3/part_3_12_surface_water.html.
Federal Ministry of Agriculture, Forestry, Regions and Water Management (2025). The EU water framework directive. Available online at: https://www.bmluk.gv.at/en/topics/water/water-management/the-eu-water-framework-directive.html.
Jaelani, L. M., and Ratnaningsih, R. Y. (2018). Spatial and temporal analysis of water quality parameter using Sentinel-2A data; case Study: lake matano and towuti. Int. J. Adv. Sci. Eng. Inf. Technol. 8 (2), 547. doi:10.18517/ijaseit.8.2.4345
Jane, S. F., Hansen, G. J. A., Kraemer, B. M., Leavitt, P. R., Mincer, J. L., North, R. L., et al. (2021). Widespread deoxygenation of temperate lakes. Nature 594 (7861), 66–70. doi:10.1038/s41586-021-03550-y
Jaywant, S. A., and Arif, K. M. (2024). Remote sensing techniques for water quality monitoring: a review. Sensors Basel, Switz. 24 (24), 8041. doi:10.3390/s24248041
Keve, G., and Nováky, B. (2011). “Investigation of climate change effect on Bácsbokodi-kígyó basin with Budyko’s model,” in XXVth conference of the Danubian countries on the hydrological forecasting and hydrological bases of water management. Editors G. Bálint, and M. Domonkos (Budapest, Hungary: VITUKI), 85.
Kokal, A. T., Kacikoc, M., Musaoglu, N., and Tanik, A. (2024). Remote sensing application in water quality of Lake Burdur, Türkiye. Photogrammetric Eng. and Remote Sens. 90 (2), 85–87. doi:10.14358/pers.23-00040r2
Kowe, P., Ncube, E., Magidi, J., Ndambuki, J. M., Rwasoka, D. T., Gumindoga, W., et al. (2023). Spatial-temporal variability analysis of water quality using remote sensing data: a case study of Lake manyame. Sci. Afr. 21, e01877. doi:10.1016/j.sciaf.2023.e01877
Li, C., Feng, W., Chen, H., Li, X., Song, F., Guo, W., et al. (2019). Temporal variation in zooplankton and phytoplankton community species composition and the affecting factors in Lake Taihu—A large freshwater Lake in China. Environ. Pollut. 245, 1050–1057. doi:10.1016/j.envpol.2018.11.007
Llodrà-Llabrés, J., Martínez-López, J., Postma, T., Pérez-Martínez, C., and Alcaraz-Segura, D. (2023). Retrieving water chlorophyll-a concentration in inland waters from Sentinel-2 imagery: review of operability, performance, and ways forward. Int. J. Appl. Earth Observation Geoinformation 125, 103605. doi:10.1016/j.jag.2023.103605
Ma, T., Zhang, D., Li, X., Huang, Y., Zhang, L., Zhu, Z., et al. (2023). Hyperspectral remote sensing technology for water quality monitoring: knowledge graph analysis and frontier trend. Front. Environ. Sci. 11, 1133325. doi:10.3389/fenvs.2023.1133325
Mallick, J., Hasan, M. A., Alashker, Y., and Ahmed, M. (2014). Bathymetric and geochemical analysis of Lake al-saad, abha, Kingdom of Saudi Arabia using geoinformatics technology. J. Geogr. Inf. Syst. 6 (5), 440–452. doi:10.4236/jgis.2014.65038
Matthews, M. W. (2011). A current review of empirical procedures of remote sensing in inland and near-coastal transitional waters. Int. J. Remote Sens. 32 (21), 6855–6899. doi:10.1080/01431161.2010.512947
Mohsen, A., Elshemy, M., and Zeidan, B. (2020). Water quality monitoring of Lake burullus (egypt) using landsat satellite imageries. Environ. Sci. Pollut. Res. 28 (13), 15687–15700. doi:10.1007/s11356-020-11765-1
Mohsen, A., Zeidan, B., and Elshemy, M. (2022). Water quality assessment of Lake burullus, Egypt, utilizing statistical and GIS modeling as environmental hydrology applications. Environ. Monit. Assess. 195 (1), 93. doi:10.1007/s10661-022-10710-8
Mohsen, A., Kiss, T., and Kovács, F. (2023a). Machine learning-based detection and mapping of riverine litter utilizing Sentinel-2 imagery. Environ. Sci. Pollut. Res. 30 (25), 67742–67757. doi:10.1007/s11356-023-27068-0
Mohsen, A., Kovács, F., and Kiss, T. (2023b). Riverine microplastic quantification: a novel approach integrating satellite images, neural network, and suspended sediment data as a proxy. Sensors 23 (23), 9505. doi:10.3390/s23239505
Rakonczai, J., Mucsi, L., Szatmári, J., Kovács, F., and Csató, Sz. (2001). “Methodological aspects of inland excess water mapping,” in The results of geography on the threshold of the new millennium: hungarian geographical conference. Editors G. Dormány, F. Kovács, M. Péti, and J. Rakonczai (Szeged), 25–27.
Sheishah, D., Sipos, G., Hegyi, A., Kozák, P., Abdelsamei, E., Tóth, C., et al. (2022). Assessing the structure and composition of artificial levees along the lower tisza river (hungary). Geogr. Pannonica 26 (3), 258–272. doi:10.5937/gp26-39474
Sheishah, D., Kiss, T., Borza, T., Fiala, K., Kozák, P., Abdelsamei, E., et al. (2023). Mapping subsurface defects and surface deformation along the artificial levee of the lower tisza river, Hungary. Nat. Hazards 117 (2), 1647–1671. doi:10.1007/s11069-023-05922-1
Sipos, Gy., Kiss, T., Farsang, A., Csáki, B., Murányi, G., and Kiss, S. (2021). Soltvadkert, Vadkerti-tó állapotfelmérése és állapotmegőrzésre tett javaslatok kidolgozása további turisztikai fejlesztések céljából (in Hungarian). Sci. Rep., 134.
Toming, K., Kutser, T., Laas, A., Sepp, M., Paavel, B., and Nõges, T. (2016). First experiences in mapping Lake water quality parameters with Sentinel-2 MSI imagery. Remote Sens. 8 (8), 640. doi:10.3390/rs8080640
Toming, K., Liu, H., Soomets, T., Uuemaa, E., Nõges, T., and Kutser, T. (2024). Estimation of the biogeochemical and physical properties of Lakes based on remote sensing and artificial intelligence applications. Remote Sens. 16 (3), 464. doi:10.3390/rs16030464
Wang, X., and Yang, W. (2019). Water quality monitoring and evaluation using remote sensing techniques in China: a systematic review. Ecosyst. Health Sustain. 5 (1), 47–56. doi:10.1080/20964129.2019.1571443
Woolway, R. I., Jennings, E., Shatwell, T., Golub, M., Pierson, D. C., and Maberly, S. C. (2021a). Lake heatwaves under climate change. Nature 589 (7843), 402–407. doi:10.1038/s41586-020-03119-1
Woolway, R. I., Anderson, E. J., and Albergel, C. (2021b). Rapidly expanding Lake heatwaves under climate change. Environ. Res. Lett. 16 (9), 094013. doi:10.1088/1748-9326/ac1a3a
Xu, H. (2006). Modification of normalised difference water index (NDWI) to enhance open water features in remotely sensed imagery. Int. J. remote Sens. 27 (14), 3025–3033. doi:10.1080/01431160600589179
Keywords: Sentinel-2, water quality parameters, remote sensing, multilinear regression, seasonal variations
Citation: Sheishah D, Mohsen A, Abdelsamei E, Babcsányi I, Alsenjar O, Magyar G, Végi VB, Solymos K and Sipos G (2025) Remote sensing-based modeling and mapping of seasonal water quality dynamics in Vadkert Lake, Hungary. Front. Environ. Sci. 13:1665776. doi: 10.3389/fenvs.2025.1665776
Received: 14 July 2025; Accepted: 19 August 2025;
Published: 22 September 2025.
Edited by:
Changchun Huang, Nanjing Normal University, ChinaReviewed by:
Pedzisai Kowe, Midlands State University, ZimbabweDung Ngo, Joint Russian-Vietnamese Tropical Scientific and Technological Center, Vietnam
Copyright © 2025 Sheishah, Mohsen, Abdelsamei, Babcsányi, Alsenjar, Magyar, Végi, Solymos and Sipos. This is an open-access article distributed under the terms of the Creative Commons Attribution License (CC BY). The use, distribution or reproduction in other forums is permitted, provided the original author(s) and the copyright owner(s) are credited and that the original publication in this journal is cited, in accordance with accepted academic practice. No use, distribution or reproduction is permitted which does not comply with these terms.
*Correspondence: György Sipos, Z3lzaXBvc0BnZW8udS1zemVnZWQuaHU=; Diaa Sheishah, Z2VvX2RpYWFAbnJpYWcuc2NpLmVn