In the published article, there was an error in Figures 2, 6 as published. In Figure 2, the arrow going from “Mineral Nutrient Content” to “Plant Nutrient Uptake” was red with a minus sign; it should be blue with a plus. Similarly, the arrow going from “Plant Nutrient Uptake” to “Mineral Nutrient Uptake” was blue with a plus sign; it should be red with a minus. In Figure 6, the arrow going from “Soil Water” to “Soil Oxygen” was blue with a plus sign; it should be red with a minus.
FIGURE 2
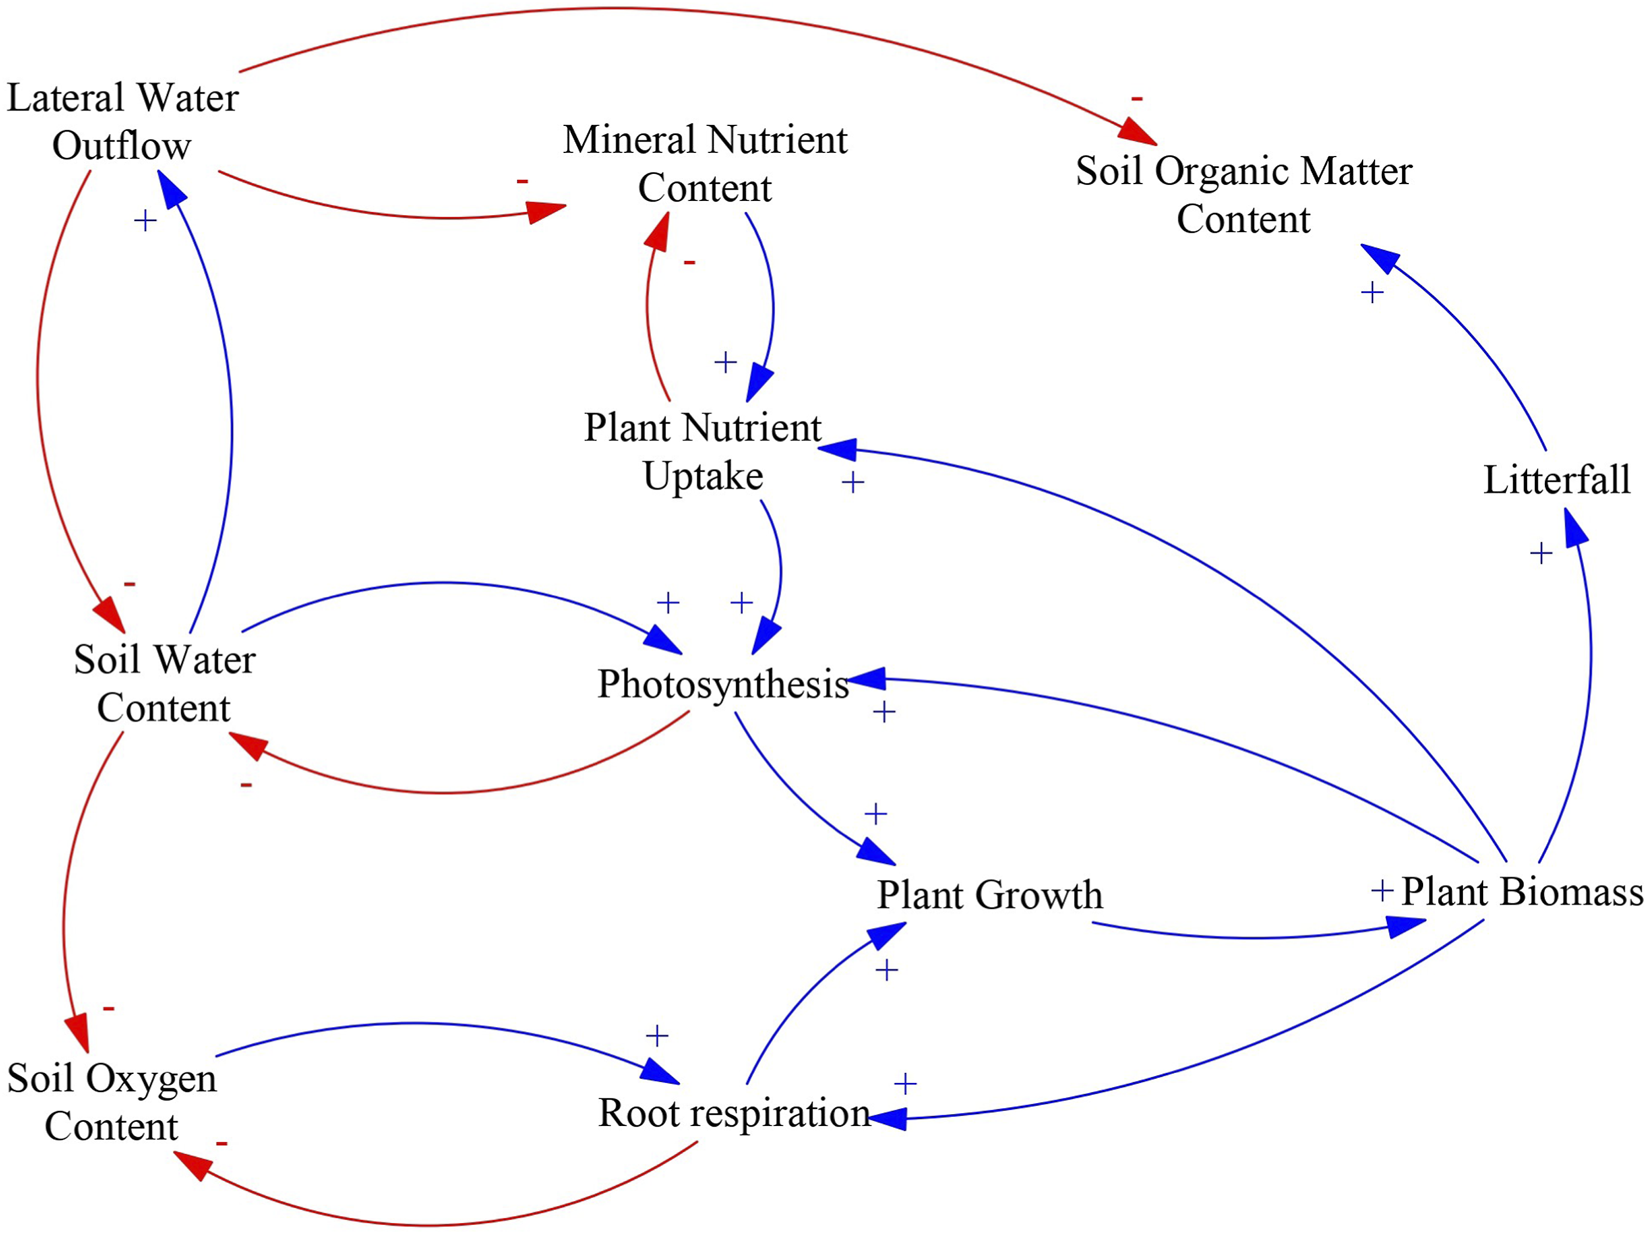
Causal loop diagram of the main effects of water table management on plant biomass and litterfall. An arrow with a plus sign (blue) indicates a change in the variable affected that is in the same direction as the change in the driving variable, an arrow with a minus sign (red) indicates a change in variable affected that is in the opposite direction as the change in the driving variable.
FIGURE 6
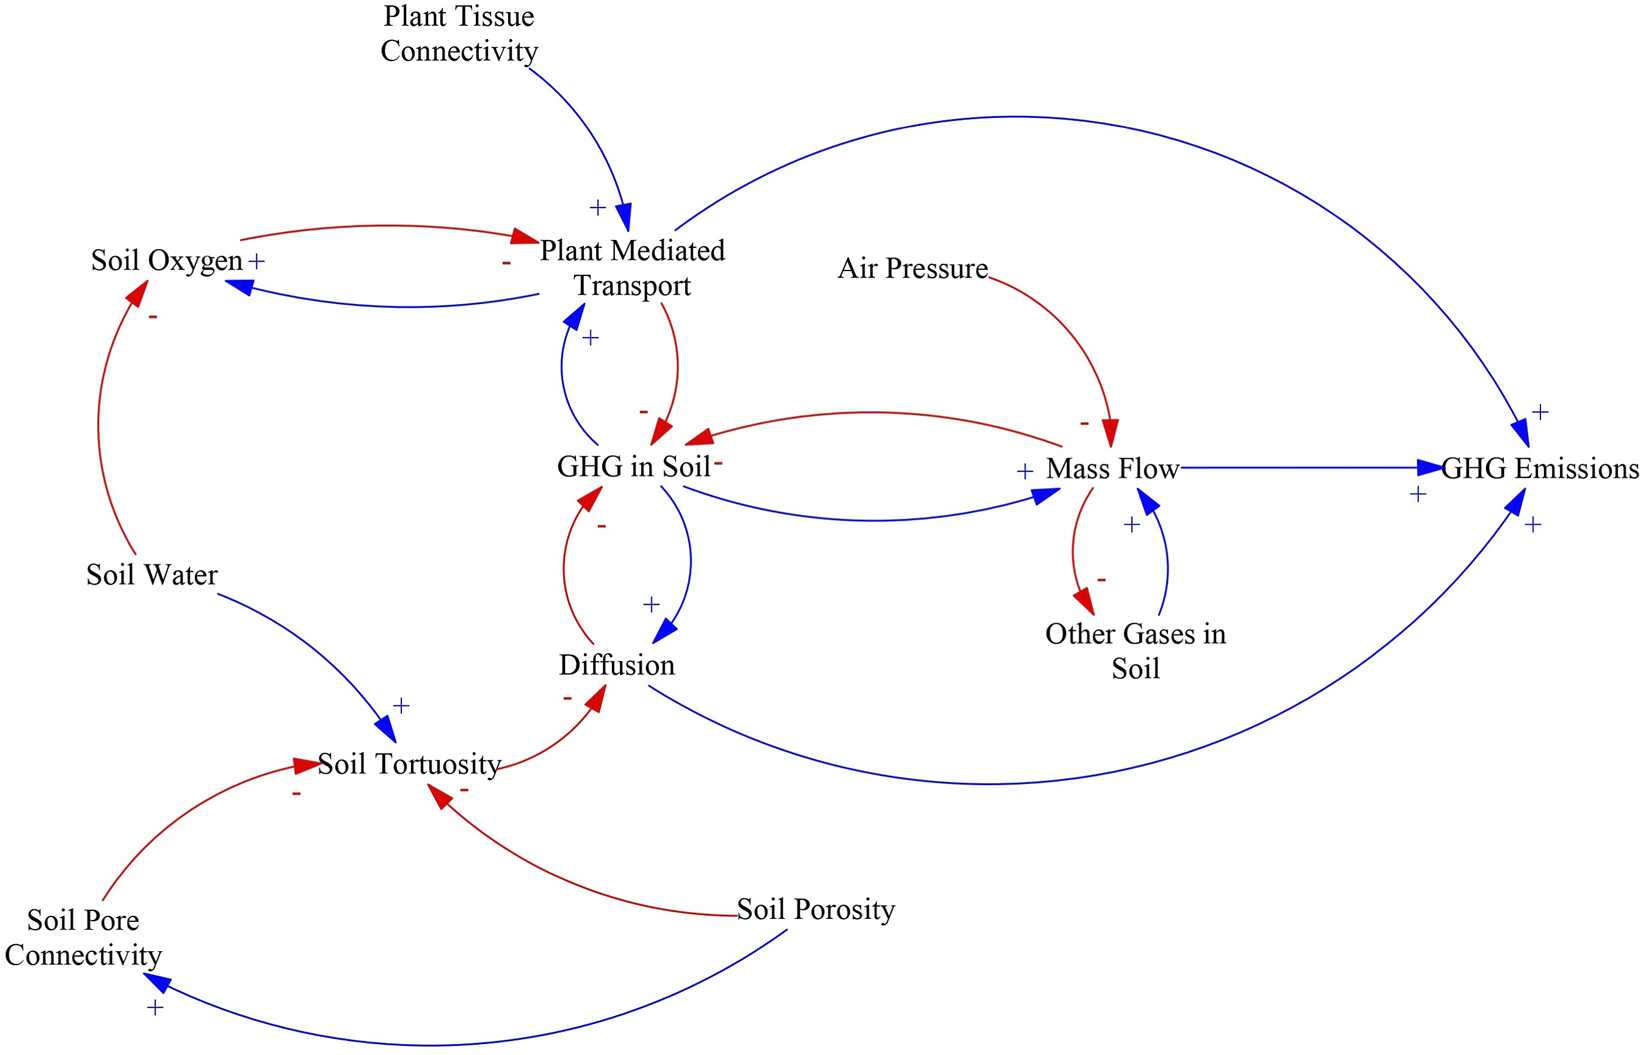
Causal loop diagram of the main effects of water table management in carbon mineralization pathways. An arrow with a plus sign (blue) indicates a change in the variable affected that is in the same direction as the change in the driving variable, an arrow with a minus sign (red) indicates a change in variable affected that is in the opposite direction as the change in the driving variable.
The corrected Figure 2 and Figure 6 and their captions appear below.
The original article has been updated.
Statements
Generative AI statement
Any alternative text (alt text) provided alongside figures in this article has been generated by Frontiers with the support of artificial intelligence and reasonable efforts have been made to ensure accuracy, including review by the authors wherever possible. If you identify any issues, please contact us.
Publisher’s note
All claims expressed in this article are solely those of the authors and do not necessarily represent those of their affiliated organizations, or those of the publisher, the editors and the reviewers. Any product that may be evaluated in this article, or claim that may be made by its manufacturer, is not guaranteed or endorsed by the publisher.
Summary
Keywords
peatland, restoration, rewetting, GHG balance, forest, land-use, management
Citation
Escobar D, Belyazid S and Manzoni S (2025) Correction: Back to the future: restoring northern drained forested peatlands for climate change mitigation. Front. Environ. Sci. 13:1677825. doi: 10.3389/fenvs.2025.1677825
Received
01 August 2025
Accepted
08 August 2025
Published
22 August 2025
Volume
13 - 2025
Edited and reviewed by
Rosa Francaviglia, Council for Agricultural Research and Agricultural Economy Analysis (CREA), Italy
Updates
Copyright
© 2025 Escobar, Belyazid and Manzoni.
This is an open-access article distributed under the terms of the Creative Commons Attribution License (CC BY). The use, distribution or reproduction in other forums is permitted, provided the original author(s) and the copyright owner(s) are credited and that the original publication in this journal is cited, in accordance with accepted academic practice. No use, distribution or reproduction is permitted which does not comply with these terms.
*Correspondence: Daniel Escobar, dscovar90@gmail.com
†These authors have contributed equally to this work and share senior authorship
Disclaimer
All claims expressed in this article are solely those of the authors and do not necessarily represent those of their affiliated organizations, or those of the publisher, the editors and the reviewers. Any product that may be evaluated in this article or claim that may be made by its manufacturer is not guaranteed or endorsed by the publisher.