 Susan Hegarty
 Laura Ribero
 Fiona Regan
- 1DCU School of History and Geography, Dublin City University, Dublin, Ireland
- 2DCU Water Institute, Dublin City University, Dublin, Ireland
- 3DCU School of Chemical Sciences, Dublin City University, Dublin, Ireland
Citizen science can considerably assist researchers in collecting environmental data, expanding the scope of projects and serving an educational purpose. However, there has been considerable debate on the importance of establishing proper methods to ensure data quality, and providing adequate training and engagement of volunteers, to maximise their participation. In this paper, we present the framework that we developed during Urban Citizen’s 6.3.2, a citizen science project monitoring water quality and macroinvertebrate biodiversity of urban rivers and streams in Dublin, Ireland. This framework was utilized for establishing the surveying methodology, recruiting our volunteers, training them as citizen scientists, engaging and supporting them during the data collection, and communicating results. We provide an overview of the citizens’ participation, their background and motivation, and their feedback on our training and engagement methods. Finally, we present a discussion of lessons learnt, including choosing proper methodologies, ensuring flexibility to maximise participation, the role of local community groups and of a multi-directional knowledge transfer, and the social impact of the project. The innovative aspects of this methodology include engaging with existing networks, and the ethical considerations of citizen science.
1 Introduction
Citizen science has been increasingly utilized as a tool to monitor the status of natural resources and ecosystems. By involving the public in gathering scientific data, this approach allows scientists to collect large amounts of data and expand the spatial and temporal scope of projects, while also serving an educational purpose and raising awareness on natural resources and existing issues (Jollymore et al., 2017; Bishop et al., 2021; Tricarico, 2022). In addition, it allows people to feel actively involved in monitoring activities and ultimately participating in policy-making and management of these natural resources (e.g., Conrad and Hilchey, 2011; Collins et al., 2023; Brooks et al., 2019; Loiselle et al., 2024).
However, the reliability of citizen science data has been an object of extensive debate, since citizens’ inexperience in collecting scientific data may significantly affect data quality, especially when increasing task difficulty (Metcalfe et al., 2022). Concerns about data quality are still a significant barrier for trusting and utilising evidence obtained by citizen science projects (Riesch and Potter, 2014), and this mistrust may hinder the incorporation of potentially useful findings, especially in policy and decision-making processes (e.g., Conrad and Hilchey, 2011).
Nonetheless, a number of studies have demonstrated how citizen science data can potentially achieve the same quality of professional studies, if the right approaches are utilised. Several authors have emphasised the importance of standardised and effective protocols that ensure proper training and engagement of volunteers, and thus achieve good quality results (e.g., Dickinson et al., 2010; Bonney et al., 2014; Balázs et al., 2021). For example, some projects have developed ad hoc frameworks and protocols, usually constraining experimental conditions to minimise the potential for bias and improper data collection, and adopting approaches for validating data (e.g., replicated sampling, expert review, screening of outlier data; Wiggins et al., 2011; Cigliano et al., 2015; Kelly-Quinn et al., 2022).
Both training and engagement of volunteers play a major role in optimising data quality, while at the same time they are crucial steps to retain volunteers and provide knowledge exchange and educational opportunities (Metcalfe et al., 2022). In fact, participation in citizen science projects does not necessarily result in an increased scientific knowledge and behavioural changes, stressing the importance of developing proper training and engagement approaches (see Jollymore et al., 2017). Jollymore and colleagues (2017) also pointed out a lack of discussion of best practices, frameworks and lessons learned, especially for citizen science projects investigating water quality and hydrological sciences.
Citizen science projects involving water quality and aquatic biodiversity in natural environments and urban areas have flourished in the past decades (e.g., see Metcalfe et al., 2022). In Ireland, several recent projects have engaged the general public in monitoring water quality of freshwater ecosystems (Roche et al., 2021; Weiner et al., 2022). Some of these projects were led by DCU Water Institute, and they have been focusing on either individual catchment areas (e.g., project BACKDROP, Hegarty et al., 2021), or on the whole country freshwater bodies (WaterBlitz events, Kelly-Quinn et al., 2022), collecting data on nutrients and visual observations, and joining the global initiative Freshwater Watch, coordinated by Earthwatch Europe.
Building from this experience, we have designed Urban Citizen’s 6.3.2, a 2-year project that involves citizen scientists in monitoring water quality and biodiversity of rivers and streams across Dublin and surrounding areas. This project aims at filling existing data gaps, especially in small water bodies that are often not included in official monitoring programmes. In Ireland, of the 116,794 water bodies, only 4,842 are monitored for water quality. While there are over 43,000 kms of first order streams in Ireland, there are only 402 monitoring stations on these. This compares with over 3,000 monitoring stations on the 15,000 kms of third and fourth order streams (EPA, 2022). If local communities can be engaged at monitoring the first and second order streams, these gaps can be filled. At the same time, Urban Citizen’s 6.3.2 aims at empowering local communities that are often already interested in and connected to their water bodies.
In this paper, we describe the framework and protocols that we developed and utilised for: a) establishing the surveying methodology, b) recruitment of volunteers, c) training of citizen scientists, d) engagement and support during the data collection, and e) communicating results. We provide a summary of the dynamics of recruitment, training and participation of volunteers throughout the project’s lifespan, and we present an overview of the volunteers’ background, motivation and feedback, obtained through an anonymous survey. Finally, we discuss the main lessons learned from our experience, and how we fine-tuned the project to maximise results, both in terms of ensuring retention of volunteers and obtaining reliable scientific data.
2 Materials and methods: the project’s framework
2.1 Project scope, study area and objectives
Urban Citizen’s 6.3.2 aims at involving the public in monitoring Indicator 6.3.2, that is, the ‘proportion of bodies of water with good ambient water quality’, under the UN Sustainable Development Goal (SDG) 6 - ‘Clean Water and Sanitation’. SDG indicators are parameters utilised to measure the progress made towards achieving the SDGs, and the United Nations have highlighted the significant potential role of citizen science in measuring Indicator 6.3.2 (UNEP, 2018).
In Ireland, only 55% of the freshwater bodies are in good ambient water quality conditions (EPA, 2024). However, of the 116,794 rivers and streams in Ireland, only 4842 are surveyed for water quality (EPA, 2024). Therefore, there is a need to fill data gaps if we are to deliver on the commitment to have good water quality for all water bodies, as part of the Water Framework Directive. A recent report by the Irish Environmental Protection Agency (EPA) has highlighted how water quality of natural water bodies in the country has not improved in the past years, despite the considerable efforts made by local authorities in fulfilment of the Water Framework Directive (EPA, 2024).
We chose to involve citizen scientists in measuring Indicator 6.3.2 in rivers and streams across Dublin because we believe and we have experienced that citizens can play an important role in filling existing data gaps, detecting unnoticed issues, and ultimately acting as river stewards (Hegarty et al., 2021; Kelly-Quinn et al., 2022). This research intends to test that potential and, using the framework of Kelly-Quinn and colleagues (2022), to create a scalable model that can be exported to other geographic areas. In the long run, the project aims at building local human capital, establishing an early warning system, where community scientists can provide valuable information to local authorities and traditional scientists about water quality, and which can, in turn, lead to community stewardship and restoration of these freshwater bodies.
Volunteers from the public were recruited as community or citizen scientists, and were trained to conduct surveys on rivers’ ecological, chemical, and biological conditions, including: 1) visual observations (i.e., information on ecology, land use, hydrology, pollution and human interactions); 2) nutrients test (nitrates and phosphates); and 3) macroinvertebrate monitoring.
To examine geographical and temporal patterns, data collection spanned 16 months (Month(M)7 - M22 of project, i.e., July 2023 - October 2024) and involved four different catchments within the urban and suburban area of Dublin, Ireland (Figure 1), which were surveyed monthly. These catchments were: 1) Santry River, 2) Tolka River, 3) Dodder River, 4) Loughlinstown streams (Kill-of-the-Grange, Carrickmines and Shanganagh streams). The chosen catchments included a network of rivers and streams crossing Dublin and discharging water into Dublin Bay, and were chosen to represent the diversity of the greater Dublin area, with two being to the north of the city centre, and two to the south. The catchments also cover a diversity of land use types and of socioeconomic areas. Dublin Bay itself hosts a diversity of coastal ecosystems, including wetlands of outstanding international importance, and for this reason it has been designated as a UNESCO Biosphere (Brooks et al., 2016). Frost (2001) highlighted how biospheres including or bordering large urban areas can be utilised “as testing grounds for the re-integration of people with the natural environment”. Dublin hosts a range of community groups that are actively involved in outdoor recreational activities and nature conservation, and they are very keen on participating in citizen science initiatives (Brooks et al., 2016; Hegarty et al., 2021; personal observation). Therefore, we chose to collaborate with these local communities, to investigate the water quality and biodiversity of the main catchments discharging water into the bay.
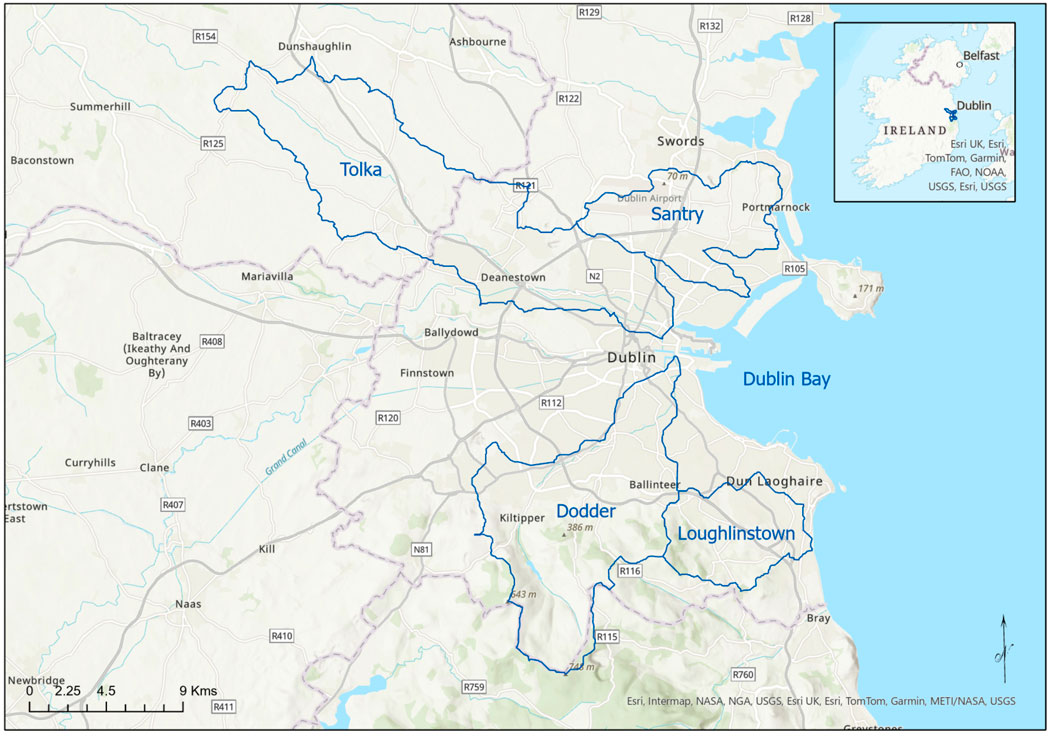
Figure 1. Study area. The study area includes 4 different catchment areas across Dublin: Santry, Tolka, Dodder and Loughlinstown. Each catchment area discharges water into Dublin Bay and includes a network of tributaries and smaller streams. The inset shows the location of the study area within Ireland. Alt Text: Geographical map of the study area (Dublin, Ireland), showing the investigated catchment areas (Santry, Tolka, Dodder, Loughlinstown) and the location of Dublin Bay.
For the choice of the sampling sites, we utilised a co-creative approach (sensu Bonney et al., 2009). During the training sessions, printed A0 maps of the catchment areas were presented to the various groups of citizen scientists. This promoted discussion of the issues around water quality within the catchments, and enabled those present to suggest where should be targeted for surveys. It also permitted volunteers to choose their own survey locations, in a collaborative setting with others from the community as well as with the project team.
2.2 Sampling methodology
As mentioned above, citizen scientists chose their survey locations collaboratively at the various training sessions. The volunteers were asked to take samples ideally once a month, over a 16-month period during 2023–2024 (M7 - M22, Figure 2). Due to the volunteering nature of the project, and the length of the project, it was deemed not appropriate to request all the volunteers to sample at the same time and day. This was because flexibility was deemed important to maintain engagement of the community group throughout the project.
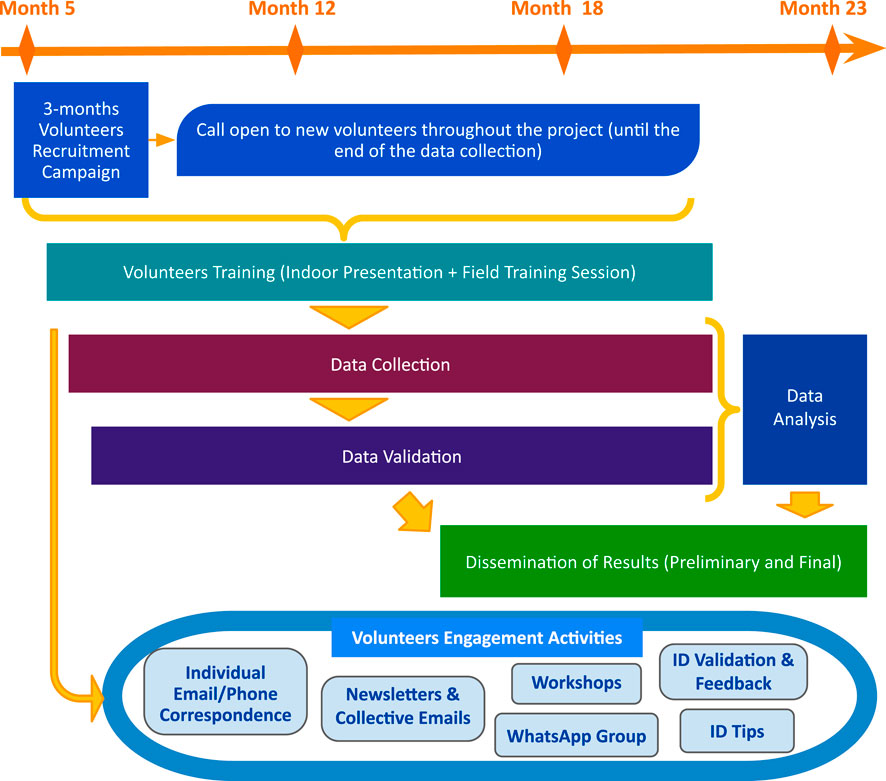
Figure 2. Project structure. Graphical representation of the project structure, showing timeline of various project phases. Results are being disseminated through different channels. Different engagement activities have been in place throughout the project. Alt Text: Graphical representation of the project structure, showing the timeline of the different phases (recruitment, training, data collection and validation, data analysis, dissemination of results, and engagement activities).
During sampling, volunteers answered a series of questions, organised in three different sections (Supplementary Table S1). The data were submitted through ESRI’s ArcGIS Survey123 Application (ESRI, 2015) or website (https://survey123.arcgis.com/), that hosted the survey form and was GDPR compliant. Surveys were completely anonymised after being verified by the research team, and no personal identifiers appeared on the web-version of the maps.
The survey began with a series of questions relating to health and safety, encouraging the volunteer to consider whether it is safe to approach the river or stream at that particular time (see also 2.7). Following this, the survey questions included questions from the Freshwater Watch methodology (Hegarty et al., 2021; Loiselle et al., 2024), and from the methodology developed for the Citizen Science Stream Index (CSSI).
1. Visual Observations. Volunteers were asked to note the surrounding land use, the presence of visible pollution (e.g., foam and oily sheen on the water surface, trash and plastic pollution in or around the water body), the presence and type of bank vegetation, algae and aquatic wildlife, any human activities occurring in the area, the presence of three high-impact invasive flowering plant species colonising river banks, hydrological information, water colour and turbidity (measured using a Secchi tube).
2. Nutrients Test. Volunteers were asked to measure the concentrations of nitrates and phosphates in situ, by collecting water samples and utilising colour-based Freshwater Watch kits, manufactured by Kyoritsu Chemical-Check Lab. Corp., and provided by EarthWatch Europe. These colorimetric kits record levels of nitrates (N as NO3−) and phosphates (P as PO43-), and results are recorded on the spot by the citizen scientists (Hegarty et al., 2021). Nitrates (NO3−) and phosphates (PO43-) are essential nutrients for plants and algae, and they are naturally present in soils and water bodies. However, their concentrations in natural ecosystems can be significantly increased by human activities, especially those releasing untreated sewage and wastewater, agricultural fertilisers and animal waste, and industrial by-products. In aquatic ecosystems, an excess of these nutrients can potentially lead to eutrophication, a domino-effect starting with excessive proliferation of algae, that ultimately results in the depletion of oxygen levels and die-offs of fishes and other aquatic wildlife (Chislock et al., 2013; Lemley and Adams, 2019).
3. Macroinvertebrate Monitoring. Volunteers were asked to monitor the macroinvertebrate community, when it was safe to enter the stream and do so. Macroinvertebrates include a diverse range of invertebrate taxonomic groups that are large enough to be seen without the aid of a microscope (Michaluk, 2024). In riverine ecosystems, this community includes several taxonomic groups, including juvenile and adult insects, crustaceans, molluscs, arachnids, annelids and other worms. Many of these taxonomic groups can provide information on water quality and ecosystem health, due to their different levels of sensitivity and tolerance to anthropic disturbance, especially organic pollution and environmental degradation. For this reason, macroinvertebrates have been widely utilised in biomonitoring programmes in riverine ecosystems around the world, and several biotic indices are based on them (see e.g., Herman and Nejadhashemi, 2015).
The Citizen Science Stream Index (CSSI) methodology is a biotic index developed in Ireland by researchers at University College Cork (McSorley, 2022). This index has been specifically developed for citizen science projects in the Irish context, and it is based on the presence/absence of 6 key taxonomic groups. Three groups (called “The Good Guys” within the CSSI methodology, and used here for ease) indicate good water quality, as they are very sensitive especially to organic pollution and habitat degradation. These are stoneflies (Order Plecoptera), flattened mayflies (Order Ephemeroptera, Family Heptageniidae), and green caddisflies (Order Trichoptera, Family Rhyacophilidae). The other three groups (“The Bad Guys” in CSSI methodology and in this paper) are, instead, very tolerant and they can survive and thrive in polluted conditions. These “bad guys” are snails (Class Gastropoda), leeches (Sub-Class Hirudinea), and the waterlouse (Genus Asellus spp., Order Isopoda).
In each survey, volunteers were asked to collect three 30 s kick-samples from a shallow (<0.2–0.3 m) and gravelly part of the stream (riffles), utilising a D-frame pond net (250 mm wide on the flat side, mesh size = 1 mm). While the original methodology used a 0.5 mm mesh size, we chose a 1 mm mesh as it is easier to clean (so less risk of biosecurity breaches) and is easier to use for the volunteers. It was also more economical, although this was not the primary concern. Each sample was placed in a white tray containing around 0.01 m depth of water, and the volunteers recorded the presence or absence of the six key taxa. After each tray had been sorted, the samples were released back into the river (McSorley, 2022).
Volunteers utilised an official form transferred to the Survey123 platform to calculate the CSSI (McSorley, 2022). Scores were assigned to any of the recorded taxa, assigning a +1 score to any of the good guys, and −1 to any of the bad guys. For each sample, these scores are summed together to obtain a “sample score”, which can range from +3 (all three ‘good guys’ and no ‘bad guys’ present) to −3 (all three ‘bad guys’ and no ‘good guys’ present). The sum of the three sample scores provides a final CSSI score, which can range from −9 (all ‘bad guys’ and no ‘good guys’ are found in all three samples), to +9 (all ‘good guys’ and no ‘bad guys’ are found in all three samples). These scores provide information about water quality, with scores ranging from −9 to −5 indicative of poor water quality, ranges from −4 to +4 indicative of moderate water quality and scores ranging from +5 to +9 indicate good water quality (McSorley, 2022). This tripartite classification can allow for a traffic-light system to facilitate communication of results to the public, with red indicating poor water quality and lower scores, amber indicating moderate and green indicating high water quality and high scores.
2.3 Recruitment of volunteers
To recruit volunteers, a 3-months recruitment campaign was launched in June 2023 (M6), where the project was introduced to the public and relevant stakeholders (Figure 2). During this phase, volunteers were recruited by utilising different approaches, including:
1. Media outlets news and social media posts, containing a presentation of the project and a call for volunteers, including outreach to those who may have participated in similar projects in the past;
2. Engagement with local community groups and NGOs through personalised emails to these public groups;
3. Advertisement through I-VOL - The National Volunteering Database (https://www.i-vol.ie/), a national searchable database of volunteering opportunities in Ireland, managed by Volunteer Ireland, part-funded by the Government of Ireland through the Department of Rural and Community Development;
4. Engagement of schools, through a pre-existing collaboration with the GLOBE Programme of An Taisce - The National Trust for Ireland. This group engaged a primary school in gathering data.
To account for potential new volunteers, the call was kept open, allowing people to join the project at any time up to M21 of the project, and scheduling training sessions at targeted times. This allowed us to maximise the intake of volunteers, as we noticed the potential of personal communication and “word of mouth” in recruiting volunteers. Dublin hosts an established network of community groups that play an active role in spreading information about citizen science projects, and this worked to the advantage of the project. This ‘rolling recruitment’ safeguarded against the fall-off of volunteers, as will be discussed later.
To further understand the background and motivation of the citizen scientists, a questionnaire was circulated to the volunteers at M14. This gathered anonymous information on the age bracket of the citizen scientists, how they had heard about the project, how long they had lived in the area that they were surveying, as well as their motivation for getting involved in the project and their previous experiences of environmental monitoring.
2.4 Training protocols
Once recruited, each volunteer was trained to be a citizen scientist for the project, learning how to accurately conduct surveys and submit the obtained data (Figure 2). We adopted a gradual learning approach, designed to allow non-specialists to build the knowledge necessary to collect reliable data.
The training included:
1. An indoor presentation, where the project was introduced, explaining the goal and the background, and the central role of citizen scientists. The survey was explained in detail, and volunteers were informed about what kind of information these data can provide, and how this information can help to increase the understanding of local ecological conditions and ultimately improve the status of these freshwater ecosystems. Potential issues related to an excess of nutrients were explained, and the CSSI method and the 6 key taxonomic groups were described in detail.
This indoor presentation also contained a Health & Safety section, which will be described further below.
2. A field training session, where the methods were demonstrated in the field. In this session, volunteers were shown how to choose a suitable location and how to collect data, and they were taught how to utilise the Secchi tube and the nutrients kits, and how to conduct the kick-sampling for the macroinvertebrate monitoring. Furthermore, volunteers learned how to utilise the Survey123 App and submit their results.
After the field training session, citizen scientists were provided with:
1. A Volunteer Pack, containing a series of printouts, including a summary of the survey questions, detailed instructions of the methods, macroinvertebrates’ ID sheets, the CSSI form for calculating the CSSI score, an “Is it safe?” checklist (containing the questions of the risk assessment), identification tips for the three invasive plant species;
2. The equipment needed to conduct the surveys, including: a Secchi tube, nutrients kits (nitrates and phosphates), a sample cup, a kick-net and a white tray (CSSI).
Once they attended the indoor presentation and the field training session, volunteers were ready to start conducting their surveys and submitting their data.
2.5 Assistance, feedback and engagement during the data collection
During the data collection, citizen scientists were provided with an array of support and engagement activities (Table 1; Figure 2), which included:
1. Individual email/phone correspondence and assistance. During the training, volunteers were encouraged to contact the research team by email or phone, to ask questions and assistance during the data collection, and to resolve any issues (e.g., sorting out technical issues with the App). This led to a constant correspondence that was vital throughout the overall project’s development, and in establishing and strengthening the collaboration between research team and citizen scientists.
2. Regular newsletters and collective emails. Throughout the project lifespan, collective emails were sent to all the trained volunteers through Mailchimp, to ensure that personal data (i.e., email addresses) were not shared with the group of citizen scientists. These emails included updates on the progress (e.g., how many surveys have been carried out, pollution events recorded), upcoming events (e.g., workshops), further information about topics of interest (e.g., macroinvertebrates, pollution, freshwater ecosystems, websites, and books of interest), practical tips (e.g., magnifying App and photographic tips).
3. A series of supplementary identification (ID) tips, provided in pdf files. These tips were developed in response to the first results of the data collection by the citizen scientists. After data validation and verification, those macroinvertebrate groups which could be confused and misidentified were identified, and the project team developed a series of tips to improve the identification. This material included diagnostic characteristics, pictures, and links to videos, and was sent to volunteers over email using Mailchimp.
4. Macroinvertebrate ID validation and feedback. To validate the macroinvertebrate data, citizen scientists were asked to submit pictures of the sorting trays and of the CSSI groups that they encountered during the surveys. These pictures were used to validate the data. Validation of each photograph was done by one of the authors with the necessary expertise. Volunteers were also encouraged to submit pictures of any non-CSSI taxonomic group that they may find. In this way, t additional data was collected, and at the same time, volunteers have been able to gradually expand their knowledge, becoming increasingly familiar with these faunal communities. This validation technique also facilitated feedback to the volunteers, as common mistakes in identification were clarified and additional tips given in regular feedback.
5. Workshops. During the data collection period, we organised and conducted a series of workshops aimed at improving existing skills and building extra knowledge. These included an introduction to macroinvertebrate diversity, where citizen scientists were introduced to the different phyla found in freshwater ecosystems beyond those within the CSSI methodology, and a mid-term presentation on results.
6. Instant Messaging (WhatsApp) group. Following suggestions from individual volunteers and members of the community groups involved in the project during one of the workshops, a WhatsApp group was created. Citizen scientists involved in the project could opt in to this WhatsApp group. The group had 45 members at the end of the sampling period. This forum proved a useful tool to exchange information, ask questions, maintain momentum, and discuss relevant topics. It led to citizen scientists supporting each other, and answering questions that came up, sometimes before the project team had a chance to respond. We chose to communicate clearly the scope of the group to any new group members, utilising personal messages if needed, in order to avoid off-topic conversations, offensive tones and unnecessary tensions, and Whatsapp fatigue. We provided a list of what was acceptable to post, i.e., discussions about surveys, macroinvertebrate IDs, any assistance needed, coordination and updates about surveying and engagement events, news specifically related to the investigated topics and study areas.
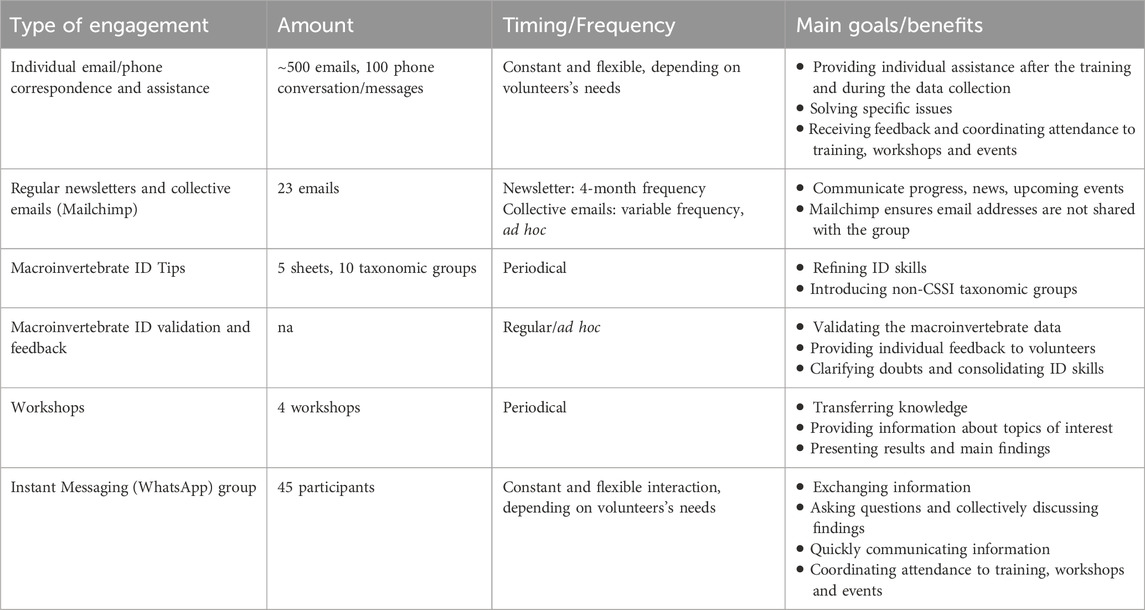
Table 1. Engagement and support methods. A range of methods have been utilised to engage and assist volunteers during the project lifespan.
2.6 Communicating results
As is appropriate for research projects which involve local communities, during the project results were disseminated and made available to the public, relevant stakeholders and the scientific community. This was done using a series of channels. A project website (www.urbancitizens632.ie) was set up, which contained a series of pages providing different information, including a News page containing periodic updates, a Results page that hosts maps of the collected data and a photo gallery of the macroinvertebrates found by the citizen scientists. A Social media channel (Twitter, later X) was used by the project to give updates to the broader public, and was used to channel traffic to the project website.
The citizen scientists were invited to a number of presentations of the results. A first report was presented in July 2024 (M19), to mark 1 year of data collection. This event coincided with the presentation of certificates of participation to citizen scientists who participated in the first year of the project, as a gesture to acknowledge their work.
2.7 Ensuring health and safety standards
Working with water and conducting field surveys involve potential risks, including adverse weather conditions, physical hazards (e.g., slippery surfaces, strong currents, unstable footing), exposure to chemical pollution and exposure to biological pathogens. Citizen scientists involved in river monitoring must be made aware of the risks associated with working near water (Walker et al., 2021).
The citizen scientists involved in this project received comprehensive training on health and safety protocols, both indoors and in the field before participating in the data collection activities. These included a Health & Safety section during the indoor training, where the main risks associated with conducting the surveys were outlined and which was made available to all in the form of slides after the training and a printed ‘Is it safe?’ checklist containing a series of questions addressing potential risks. In addition, the checklist was included at the beginning of the Survey on the Survey123 App, and the citizen scientists needed to complete this before they could submit data. This ensured sufficient cognisance was taken of the conditions at the sampling site, and that risks were effectively minimised to a reasonable level of safety.
All participants were required to sign an informed consent form, and a participant agreement form, which included a declaration that they had participated in the training, and understood the importance of the health and safety training. In addition, an Emergency Response Document listed resources, including potential emergency care facilities, police stations, fire stations, and basic information about the sites. In addition, citizen scientists were provided with a Safety Concern Form and an Accident Report Form, that could be utilised in case of an emergency to provide the project team with details about what occurred. These were not utilised by the citizen scientists over the course of the project.
2.8 Ethical considerations
Collaborating with community groups and with individuals requires researchers to be aware of the ethical implications of this work. Resnik and colleagues (2015) suggest that ethical considerations of data quality and integrity, data sharing and intellectual property, conflict of interest, and exploitation of volunteers need to be addressed from the outset and throughout research projects involving citizen scientists. To this we could add holding of personal data and environmental ethics (embedding the principle of ‘do no harm’ into the research with the citizen scientists). The measures put in place to address these issues are mentioned below.
2.8.1 Personal data
Prior to the start of recruitment of citizen scientists and the collection of data, ethical approval for the project was granted by Dublin City University’s Research Ethics committee (DCUREC/2023/076). Becoming part of this research project required citizen scientists to provide email addresses for communication with the project team, and for the setting up of usernames on ArcGIS Online to facilitate collection of data through Survey123. Generic usernames were created for each of the citizen scientists (in the format Urban_Citizen#, where # is a number) within the university’s Organisation on ArcGIS Online. Each citizen scientist set up their own password and security questions. Therefore, initially the only personal data collected by the research team was the email address of the citizen scientists. All records of surveys carried out by the citizen scientists on Survey123 were anonymised once they had been verified by the research team. In addition, citizen scientists could choose not to log in to Survey123, and could contribute their data anonymously (rather than with their generic username of, for example, Urban_Citizen17). Most preferred to log in, as this also enabled better support of the citizen scientists by the research team.
As mentioned earlier, several citizen scientists requested that an Instant Messaging Service (WhatsApp) be used to facilitate communication among the community of practice. This was facilitated by the research team, and was opt-in for citizen scientists.
2.8.2 Data quality and integrity
If citizen scientists are spending time from their leisure time gathering data for a research project, this data must be used. From a scientific perspective, if the data is to be used, it needs to be accurate. Therefore, data quality and integrity become an ethical issue.
In this research, citizen scientists were trained in the field to gather data. As described above, after their initial data submission, the project team validated the data collected by the citizen scientists, and supported citizen scientists in upskilling in macroinvertebrate identification through ID tips and workshops. All submissions on the app were accompanied by photographs of the macroinvertebrates that volunteers found in their trays. These photographs were used to validate the data, and to provide feedback and tips to the citizen scientists. In order to ensure the quality of the data validation, these photographs were screened by the second author, who is a freshwater ecologist and has taxonomic expertise on riverine macroinvertebrate groups. The availability of taxonomic expertise is a potential limiting factor in citizen science projects, since it can hamper data quality. In the future, it may be possible to use an AI tool to aid validation of the macroinvertebrate data, with expert identification only needed for a minority of samples.
2.8.3 Data sharing and intellectual property
It was important to the project team that the citizen scientists and community groups have access to the verified data, and could use it for any purpose that was required within the local community. Examples of the use of this data by the various community groups, independent of the research team, will be given below (see 4.3, 4.5). The community groups have also reached out to the project team if there was anything in the data that required further clarification. Data collected by the citizen scientists, once verified, is open source, and is available through the project website.
2.8.4 Conflict of interest
Within this study, many of the citizen scientists involved were committed to the environment, involved in local environmental community groups, with some having been involved in lobbying local authorities for improvements to freshwater quality. For some, this was the motivation in getting involved in the research project.
The objective of this research project was not to lobby local authorities. Rather, it was to create a framework for engaging local communities in monitoring of freshwater quality, to promote stewardship of urban rivers and streams. The research was funded through an Irish Research Council Coalesce grant, whose aim is to create collaborative alliances for social change. This scheme ‘aims to integrate the knowledge and evidence borne through robust research into the sphere of public policy, creating tangible and enduring links between the publicly funded research system and policymakers’ (Taighde Eireann, 2024). The use of the data and knowledge gathered by community groups to engage with policymakers falls within the remit of this call, and is not considered a conflict of interest.
2.8.5 Exploitation
With all that has been said heretofore, it should be clear that the citizen scientists have been at the centre of this research project. Engagement with the community has been the driving force behind what has been done. We explicitly called out the roles and responsibilities of the citizen scientists, mentoring them throughout the project. All those who participated have access to the data collected, and were involved in workshops which upskilled them, and enhanced the environmental knowledge of participants, citizen scientists and project leads alike. To acknowledge the participation of citizen scientists in the project, all those who gathered data were awarded a certificate of participation at an in-person event.
2.8.6 Environmental ethics
The impact of multiple, non-expert sampling teams on the urban rivers across the study area requires consideration within any citizen science project where people are getting into rivers, as aquatic habitats can be disturbed. During the setting up of this project, considerable consideration was given to the effect of kick-sampling on the urban rivers, due to some of the streams being potential spawning grounds for fish. After discussion with the team who developed the CSSI methodology, it was decided to continue sampling throughout the seasons, when river depth permits and as long as the numbers sampling at each of the sites, and at sites in proximity to each other, remained small. In addition to this, during training, citizen scientists were trained on biosecurity techniques including the washing of nets and other equipment.
3 Results: overview of citizens’ participation in the project
The remainder of this paper will examine the success of the training and engagement protocols outlined above. The importance of continuous recruitment, training and support of the research community will be highlighted, and the innovative aspects of the project will be commented on.
Over the lifespan of the project, 148 people expressed interest in participating as citizen scientists. Of these, 91 people completed the training outlined above. This training was carried out between July 2023 (M7) and September 2024 (M21), with multiple sessions being held in each of the months (Figure 3A). Each session included 2–14 people.
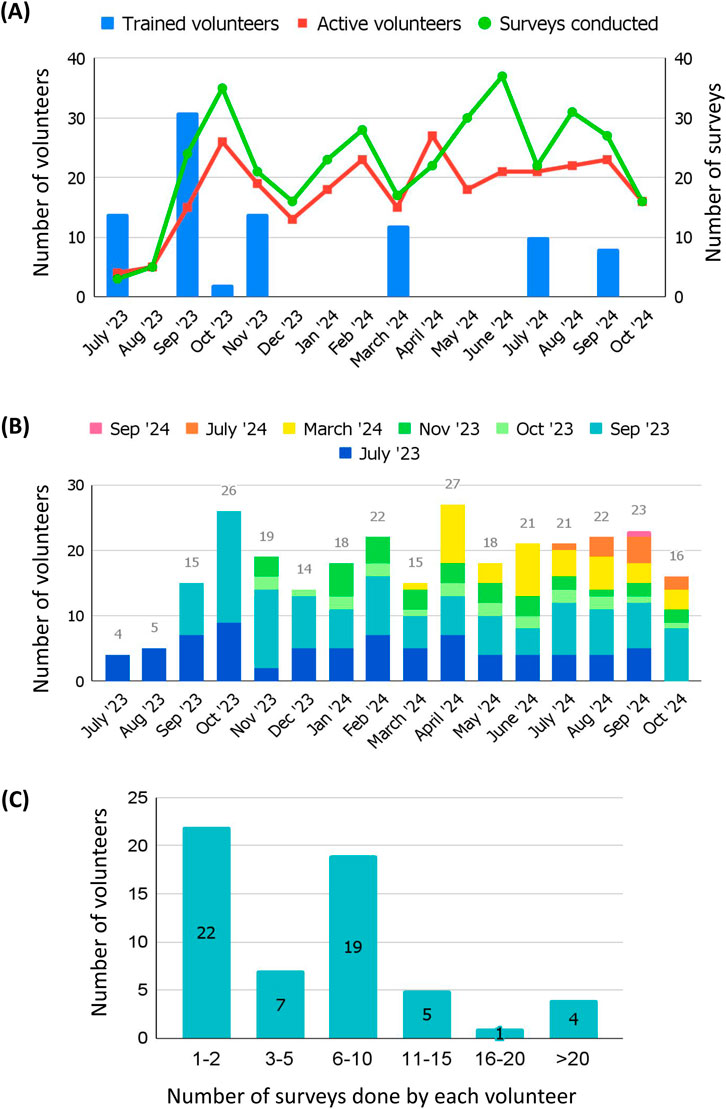
Figure 3. Trained and active volunteers throughout the project lifespan. (A) Number of volunteers trained (blue bars) with number of surveys conducted each month (green line) and number of active citizen scientists each month (red line), showing monthly variations (B) Total of monthly active volunteers, with when they completed training sessions. (C) The number of surveys conducted by each volunteer throughout the data collection period. Alt Text: Graphs labelled (A–C). Graph (A) plots months versus number of trained volunteers, number of active volunteers and number of surveys conducted per month. Graph (B) is a stacked histogram plotting months versus number of volunteers. Each column shows the number of volunteers that were trained in different training sessions, coded in different colours. Graph (C) is an histogram plotting the number of surveys done by each volunteer versus the number of volunteers.
From July 2023 to October 2024 (M7 - M22; 16 months), 58 volunteers conducted surveys and submitted data (hereafter called “active volunteers”). The number of active volunteers per month ranged from 4 to 27 (mean = 18, SD = 6.54, median = 19; Figures 3A,B), and the number of surveys conducted by each volunteer throughout the 16-month data collection period ranged from 1 to 66 (mean = 7, SD = 9.64, median = 5.5). Twenty-nine volunteers conducted less than 5 surveys each, while 19 volunteers conducted 6 to 10 surveys each, and 10 volunteers conducted more than 11 surveys each (Figure 3C). There were also ‘super volunteers’, such as the citizen scientist who recorded 66 samples on the app–sampling frequently in the areas they chose, and in other areas if they had the opportunity to do so. This will be discussed further later.
A brief questionnaire was distributed to the participants, to understand their background and motivation. 36.3% of trained volunteers completed the survey, and the data is useful to form an idea of the demographics of the communities who took part in this project. Data obtained from the questionnaire indicates a diverse group of citizens, in terms of age group, social background, previous experience with citizen science, environmental science and volunteering (Figure 4). Among the volunteers that completed the survey, there was an indication of gender balance, with the male/female split being 51.5/48.5%. While volunteers could choose a third category (‘prefer not to say’), nobody who answered the survey chose this option (Figure 4A).
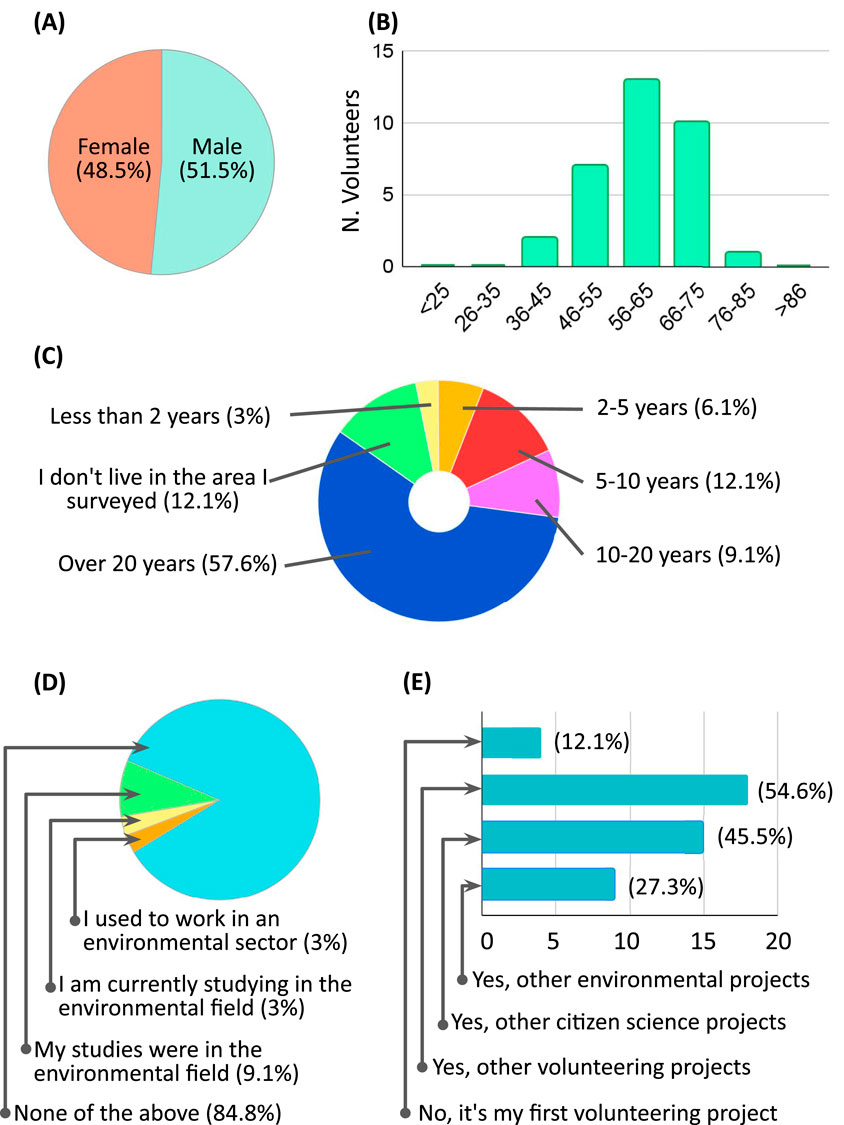
Figure 4. Background of citizen scientists. (A) gender, (B) age group, (C) how long volunteers have been living in their surveyed area, (D) professional experience and background in the environmental sector, (E) previous experience in volunteering projects. Alt Text: Graphs showing different aspects of the volunteers’ background, labelled (A–E). Graph (A) is a pie chart showing the percentage of male and female participants. Graph (B) is an histogram showing the age groups of the volunteers, divided in 5-year intervals. Graph (C) is a pie chart showing how long the volunteers have been living in their surveyed area, and it is divided into the following categories: ‘less than 2 years’, ‘2–5 years’, ‘5–10 years’, ‘10–20 years’, ‘more than 20 years’, ‘I do not live in the area I surveyed’. Graph (D) is a pie chart showing if volunteers have any previous professional experience in the environmental sector, and it is divided into the following categories: ‘I used to work in an environmental sector’, ‘I am currently studying in the environmental field’, ‘My studies were in the environmental field’, ‘None of the above’. Graph (E) is a histogram showing whether volunteers have been involved in volunteering projects before, and it is divided into the following categories: ‘Yes, other environmental projects’, ‘Yes, other citizen science projects’, ‘Yes, other volunteering projects’, ‘No, it’s my first volunteering project’.
Over 70% of respondents were over 56 years of age (Figure 4B), with 33% of respondents being of retirement age or over (>65 years old). 21% were aged 46–55. Nobody who completed the survey indicated that they were under 35 years of age, although anecdotally there were volunteers who were under 35 years of age but did not complete the survey. People of retirement age and over may have more time to enable them to participate in projects that require a regular time commitment. However, most respondents to the questionnaire (two-thirds) were not of retirement age.
Over half of the volunteers (57.6%, Figure 4C) had lived in their surveyed areas for more than 20 years, while 12.1% and 9.1% have moved there in the past 5–10 years and 10–20 years, respectively. Almost 10% of respondents have moved to their surveyed area in the previous 5 years, while 12.1% of the volunteers are not living in the area that they are surveying. Some of those who moved to the location more recently cited a desire to become more familiar with the place as a reason for getting involved in the project. This attachment to place, and the willingness to travel to gather data and be part of this project, will be discussed later.
While most volunteers had not worked and/or studied in the environmental sector and werenon-specialists, the research project did attract some volunteers who had studied or are studying environmental science, or who have worked in an environmental sector and are now retired (15.1% in total, Figure 4D). This is interesting as the project has given some a vehicle to use their skills within the community. Most volunteers (88%) had been involved in previous volunteering projects (Figure 4E), such as other local citizen science projects (27.3%), other environmental projects (45.5%, e.g., river clean-ups, tree planting), or other types of volunteering activities (54.6%). 12% of the respondents had no previous experience in volunteering.
The questionnaire indicated that volunteers had heard about the project through a diversity of sources (Figure 5A), including their existing community groups (31.3%), news and social media (21.9%), the existing network of previous DCU citizen science projects (21.9%), I-VOL - The National Volunteering Database (12.5%), and word of mouth (12.5%).
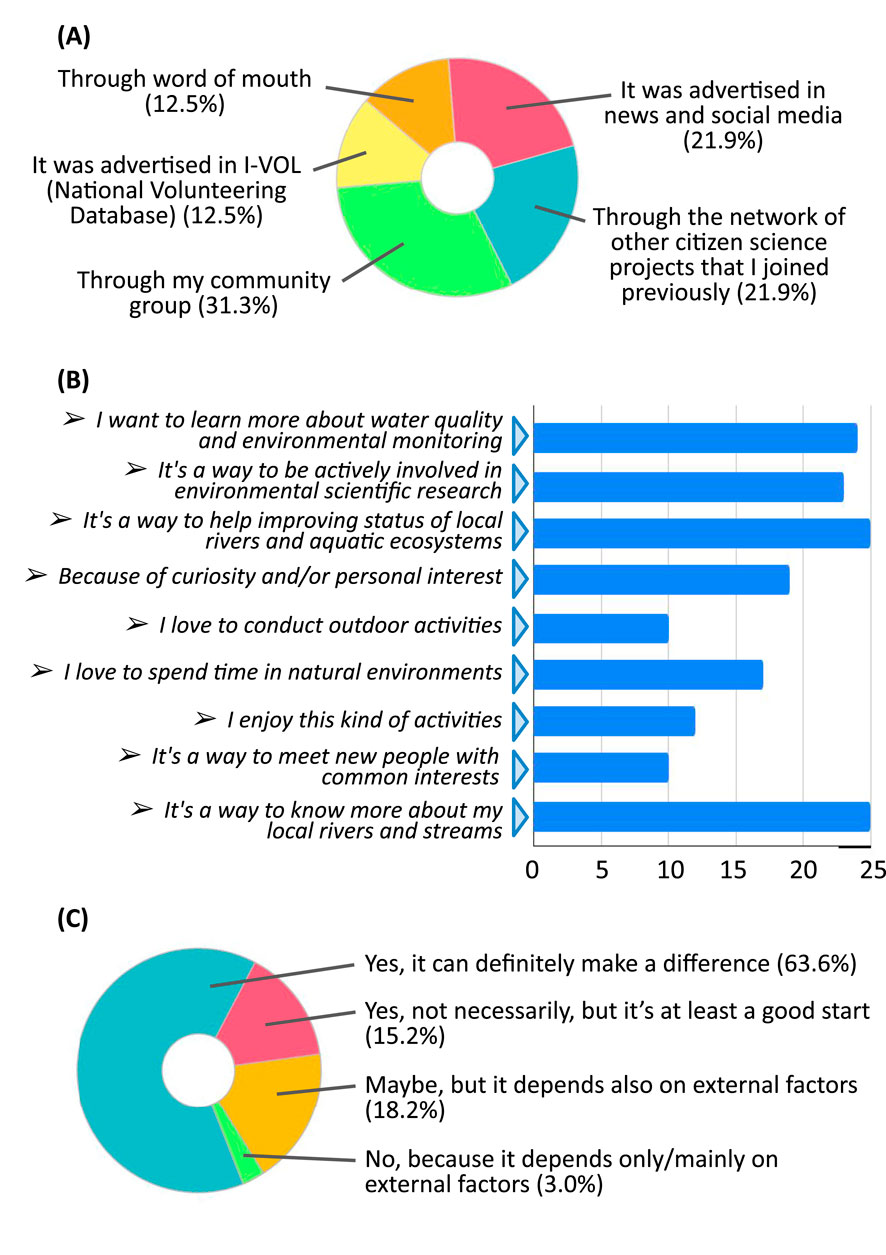
Figure 5. Motivation of citizen scientists. (A) how volunteers got to know about the project, (B) why volunteers chose to participate, (C) do volunteers think that this kind of project can help the status of the environment. Alt Text: Graphs showing different aspects of the volunteers’ motivation, labelled (A–C). Graph (A) is a pie chart showing how volunteers heard about the project, and it is divided into the following categories: ‘Through word of mouth’, ‘It was advertised in news and social media’, ‘It was advertised in I-VOL (The NationalVolunteering Database)’, ‘Through my community group’, ‘Through the network of other citizen science projects that I have joined previously’. Graph (B) is an histogram showing why volunteers decided to participate in this project, and it includes the following categories: ‘I want to learn more about water quality and environmental monitoring’, ‘It's a way to be actively involved in environmental scientific research’, ‘It's a way to help improving status of local rivers and aquatic ecosystems’, ‘Because of curiosity and/or my own personal interest’, ‘I love to conduct outdoor activities’, ‘I love to spend time in natural environments’, ‘I enjoy this kind of activities’, ‘It's a way to meet new people with common interests’, ‘It's a way to know more about my local rivers and streams’. Graph (C) is a pie chart showing whether volunteers think that this kind of project can help improve the status of our environment, and it is divided into the following categories: ‘Yes, it can definitely make a difference’, ‘Yes, not necessarily, but it’s at least a good start’, ‘Maybe, but it depends also on external factors’, ‘No, because it depends only/mainly on external factors’.
Aligning participant motivation with project outcomes is one of the key aspects to maintain interest and momentum in citizen science projects. In the questionnaire, participants could choose more than one motivation for why they got involved in the project. Most (Figure 5B) stated that they saw the project as a way to know more about their local waterways (75.6%), and they were interested in learning more about water quality and environmental monitoring (72.7%). A large group of volunteers joined because they thought that the project could help improve the status of local aquatic ecosystems (75.6%), and it is a way to be actively involved in environmental scientific research (70.0%). Also, among the reasons motivating them, several volunteers cited personal interest and curiosity (57.6%) and an interest in spending time in natural environments (51.5%). Interestingly, the community aspect, ‘meeting new people with common interests’, was not highly cited as a motivating factor in taking part, with 30% of people mentioning this. This aligns with the finding that most of those who completed the questionnaire had been living in the area they were surveying for over 5 years. Anecdotally, the volunteers included those who had come into the local area more recently, including those who had been displaced due to conflicts in Ukraine.
Many of the participants mentioned that they valued the knowledge that the project provided them with, and were interested in learning more about aspects such as macroinvertebrates. Also, most of the participants stated that they believe that the project can help to improve the current status of local ecosystems (Figure 5C), either strongly (63.6%) or partially (15.2%).
Overall, the citizen scientists were satisfied with the level of training provided (Figure 6A), and with the assistance and feedback during data collection (Figure 6B). Citizen scientists reported being very satisfied with email/phone correspondence (75.8% very good, 15.2% good), macroinvertebrates ID tips and feedback (69.7% very good, 21.2% good), and the news and updates communication through email (75.8% very good, 24.2% good). This ongoing communication with the community groups and citizen scientists is key to maintaining momentum within the project.
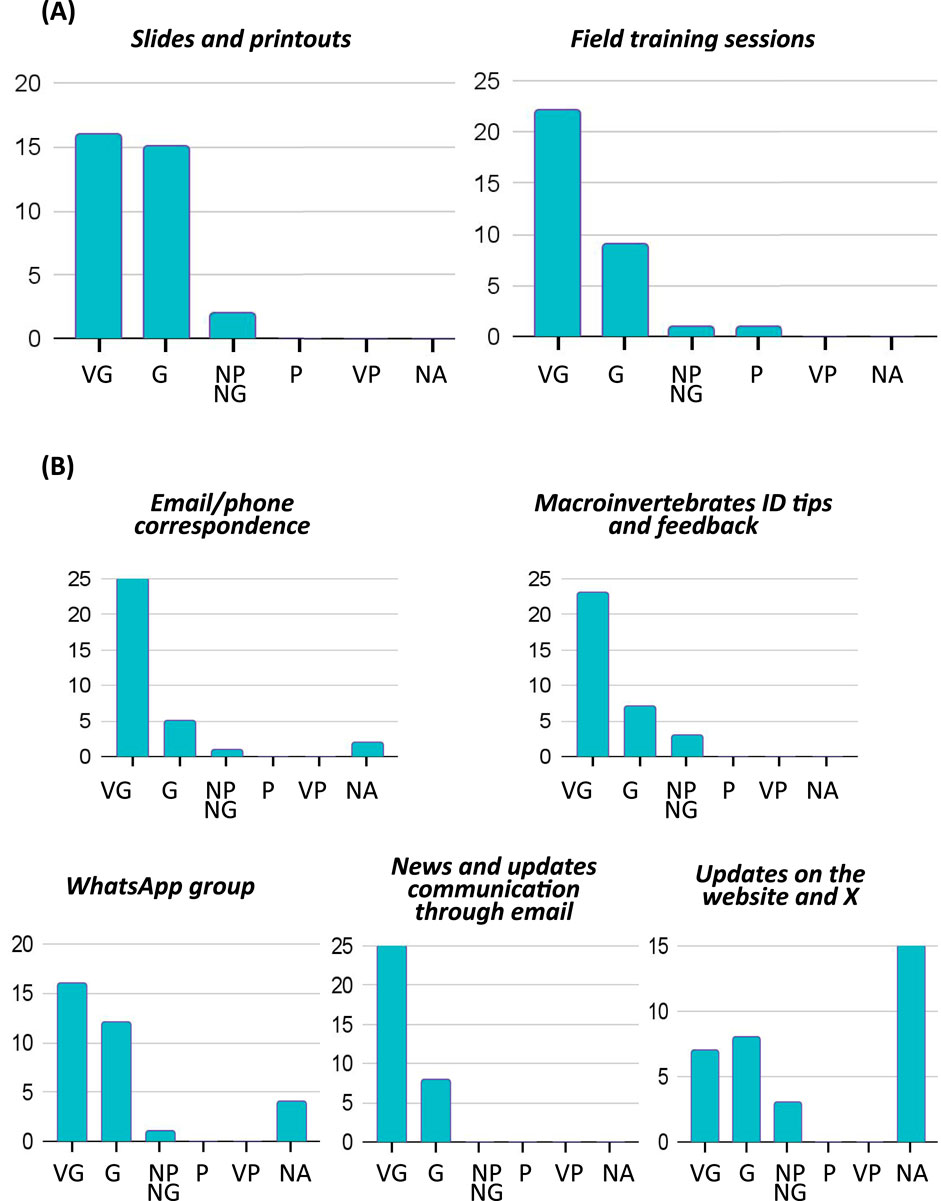
Figure 6. Citizen scientists’ feedback on methods. (A) feedback on the training activities and materials, including slides and printouts, and field training sessions, (B) feedback on the assistance and engagement during the data collection, including email/phone correspondence, macroinvertebrate ID tips and feedback, WhatsApp group, news and update communication through email, updates on the website and X. Alt Text: Histograms showing the volunteers’ feedback on the training and engagement methods, divided in two sections, labelled (A) and (B). Each bar plots the number of volunteers versus a range of feedback categories, including ‘Very Good’, ‘Good’, ‘Neither Good Nor Poor’, ‘Poor’, ‘Very Poor’. Section (A) shows the feedback on the training activities and materials, and it includes two histograms, showing the feedback on ‘Slides and printouts’ and ‘Field training sessions’. Section (B) shows the feedback on assistance and engagement during the data collection, and it includes 5 histograms, showing the feedback on ‘Email/phone correspondence’, ‘Macroinvertebrates ID tips and feedback’, ‘WhatsApp group’, ‘News and updates communication through email’, ‘Updates on the website and X’.
4 Discussion: lessons learnt
For the remainder of this paper, we will focus on the lessons learnt, and include some reflections on why this project may be an effective roadmap for engaging citizen scientists in freshwater monitoring.
4.1 Choosing appropriate methods
Overall, the methods utilized were chosen because they are relatively simple to learn, and they can be executed by people from different backgrounds and expertise. At the same time, they enabled the gathering of relevant scientific data and accurate information, covering a wide geographic area (four different catchments across Dublin county) and spanning 16 months.
The visual observations included a series of questions elaborated from the experience gained during previous projects, including DCU WaterBlitz events (held in association with Earthwatch Europe’s Freshwater Watch programme) and the BACKDROP project (Hegarty et al., 2021; Kelly-Quinn et al., 2022; Bishop et al., 2021). These citizen science projects have proven useful in providing information about the ecological status of riverine environments and the anthropic interactions. In particular, FWW is a well-established citizen science programme that has been gathering data since 2012 from an increasing number of countries worldwide, using the same universal method (Hegarty et al., 2021; Bishop et al., 2021). However, for the current research, the questions were modified, to include information about width of the channel, the presence of key invasive plant species and the occurrence of recent rainfall events.
The main advantage of the nutrients’ testing kits is that they can be utilised in situ, allowing non-experts to easily and quickly obtain accurate measurements. These kits have been developed for citizen science projects, being relatively simple and straightforward to use, and requiring minimal training. Studies have tested these kits for their reliability, and found that they can provide good quality data, comparable to other more traditional methods (e.g., Biggs et al., 2016; Quinlivan et al., 2020). The results returned by using the kits are within a range, which allows for the variation that can occur between non-experts. These kits were also validated within DCU’s Water Institute laboratory, to ensure accuracy.
The limitations of this method lie in potential inaccuracies in the judgement of the colour change by the volunteers, especially at lower concentrations. To minimise this risk, we made sure that every volunteer attended a field demonstration of the test during the training sessions (i.e., not only providing a written testing protocol but also showing how the kits work in practice), and we stressed out the importance of reading the colour change outside of direct sunlight, to ensure that readings were done in similar light conditions and minimise lighting biases. While other methods (e.g., pocket colorimetres) avoid this risk, the cost of these instruments would have been unsustainable for our project. This highlights how citizen science projects often need to strike a balance between accuracy of measuring tools (and associated data quality) and practical considerations, which may lead to trading off data accuracy for citizen engagement (Jalbert and Kinchy, 2016). At the same time, volunteers may abandon the project if they consider the methods to be too difficult or technical. In our case, some of our volunteers expressed an interest in utilising more complex measuring instruments and extending the monitoring to other types of pollutants (e.g., “forever chemicals”), while other volunteers were finding the current methods quite difficult (especially the macroinvertebrate ID). This suggests that the diversity of citizen scientists has to be taken into account when designing sampling methods, to optimise the number of volunteers involved without compromising data quality.
The CSSI method was chosen primarily because it allows people to approach macroinvertebrates gradually, without being overwhelmed by the diversity and taxonomic complexity of these faunal groups. Learning to identify taxa can take a long time for specialists that have a formal training and previous experience in zoological and taxonomical subjects. For instance, while discussing the potential role of citizen science in monitoring macroinvertebrate diversity of streams and other small water bodies, Kelly-Quinn and colleagues (2022) highlighted how this activity is currently hampered by the level of taxonomic skills required to apply standard biological assessment methods. These authors pointed out the importance of identifying key taxonomic groups that can be utilised by citizens as indicators of impacts. The six taxonomic groups of the CSSI have been selected because they are relatively easy to identify, they are good indicators of water quality, and they are commonly found in Irish rivers and streams (McSorley, 2022; Simon Harrison, personal communication, June 2023). It is recognised that there is a trade-off between obtaining detailed data and involving non-specialists in research projects. Jalbert and Kinchy (2016) outline that monitoring tools must be compatible with non-specialist skills. In this research, the training undertaken by citizen scientists, and the ongoing support of the citizen scientists by the project team, through regular newsletters, tips, workshops and the WhatsApp group described above, ensured that the macroinvertebrate data collected was of high quality and the citizen scientists supported throughout.
The ease of use of the CSSI methodology, and the quality of the training provided can be seen in the accuracy with which the citizen scientists identified the target macroinvertebrates. 81% of the macroinvertebrates within the samples were correctly identified by the citizen scientists [N = 786], with a further 4% of samples partially correctly identified. 9% of samples were incorrectly identified. In all instances where macroinvertebrates were incorrectly identified, the data was corrected by the project team using the photographs supplied, and the citizen scientists received feedback. In 6% of the CSSI samples, either no photograph was provided, or the quality of the photographs provided was too poor to be useful for verification. In those cases, the CSSI results were not used. The citizen scientists had more difficulty in correctly identifying those macroinvertebrates in the ‘good guys’ (79.5% correctly identified, and 10.66% partially correctly identified) than the ‘bad guys’ (82.8% correctly identified, with 15.66% partially correctly identified). In many instances of incorrect identification among those taxa within the ‘good guys’, the citizen scientists correctly identified the order but not the family [for example, in 12 samples, citizen scientists identified other mayflies (Ephemeroptera) as flattened mayflies (Heptageniidae)]. In these instances where there was a repeated difficulty in identification, the tip sheet for identification was updated and circulated to the citizen scientists to aid identification.
At the same time, while collecting and sorting the samples, citizen scientists came across other taxonomic groups and slowly became familiar with them. Through workshops, ID tips, and regular feedback, they were taught more and more about such groups (see also 2.5), gradually building confidence and expertise among the citizen scientists.
The data collected by the citizen scientists through these methodologies has been valuable in contributing to our knowledge of freshwater quality in the catchments, and has led to the early identification of pollution events, which could then be investigated in a timely manner.
4.2 Flexibility as key to maximising participation
In order to maximise participation and engagement of the general public, we choose to maintain a flexible approach throughout the project, especially regarding 1) recruitment, 2) training, 3) survey dates and frequency, and 4) choice of sites.
Although an initial 3-month recruitment campaign was launched once the project received ethical approval from the host institution, we chose to allow people to join the project at any time during the research. We experienced how new volunteers contacted the project throughout the lifespan of the project, as they became aware of the research through different channels, especially by word of mouth from existing volunteers, and news in social media, local media outlets and external events. For example, in July 2024 (M19) the project team were invited to give a talk to the local NGO Green Foundation Ireland, and the project was also mentioned at the launch of an independent documentary about the River Dodder, created in collaboration with Dodder Action, one of the partnering community groups, and funded by Local Authority Waters Programme (LAWPRO). These two events prompted several people to contact the project, asking to join as citizen scientists. It was therefore decided to conduct further training sessions (July and September 2024, i.e., M19 and M21), where 18 people were trained (Figure 3A).
Training sessions were organised in order to maximise the participation. A first session was held in July 2023 (M7), to allow the initial group of recruited volunteers to start their surveys during the summer months (14 volunteers, Figure 3A). A second batch of training sessions was held in September 2023 (M9), at the end of the 3-month recruitment campaign (Figure 3A). In this case, four sessions (4 indoor and 4 field sessions) were conducted in two different locations, one in the north of the study area, the other in the south. We choose to offer alternative dates, timing, and locations, to account for differences in people’s availability and location.
We also encouraged people to let us know in case they were not able to attend during these dates, but they were nonetheless interested in joining the project. We utilised this feedback to set up new training dates, in October 2023 (M10), November 2023 (M11) and March 2024 (M15), and we corresponded with the interested volunteers to find a suitable date. These sessions also included newly recruited volunteers that had contacted the project in the meantime.
While some volunteers attended the indoor presentation in the early sessions, they were not able to attend the field training for a number of months. However, some of these volunteers ended up conducting several surveys, showing the importance of providing multiple opportunities to attend the training at different stages of the project. The importance of flexibility in recruitment and training of volunteers throughout the project can be seen in Figure 3B, which shows the numbers of active citizen scientists each month and the time of training of these citizens. To maintain momentum of the research, the natural falloff of volunteers was counterbalanced by new volunteers coming onstream during the research. This ensured that all catchments and streams were sampled each month with a spatial frequency that enabled future analysis of data.
Flexibility was also important in adjusting proposed training dates, due to the influence of weather conditions and water level in the rivers. Rainy weather conditions can hamper field training sessions, and macroinvertebrate monitoring requires sufficiently low water levels (<30 cm), for both practical and safety reasons. Therefore, while we could choose field training dates weeks in advance, we had to check weather conditions and water levels during the week of each proposed date, and in some cases we had to move the training sessions due to adverse conditions. This adjustment required an extra collaboration effort between the project team and the recruited citizen scientists, due to the last-minute rescheduling of the training sessions.
Compared to previous citizen science projects within DCU Water Institute, (BACKDROP, Water Blitz; Hegarty et al., 2021; Kelly-Quinn et al., 2022), this project required considerable commitment from the volunteers, in terms of time employed to complete the survey (up to 1 hour if the citizen scientists were doing the kick-sampling element), length of the data collection (16 months), and surveys’ frequency (monthly). To ensure that citizen scientists did not feel overwhelmed by the required tasks, they were encouraged to choose the sampling frequency according to their personal availability, emphasising how any data collected (even if only one survey is done) will be a valuable source of information for the study. We chose this approach because we wanted to involve people with different social backgrounds and different time availability. In fact, participants showed a very diverse range of survey frequency, with most volunteers conducting either 1-2 or 6–10 surveys (Figure 3C). Five citizen scientists conducted more than 15 surveys each (i.e., at least one sampling survey per month), while 33 of the 91 trained citizen scientists were inactive on the application (although they may have accompanied others to survey). The flexibility of sampling frequency will be discussed further below.
Finally, while the study catchments were identified by the project team, citizen scientists were asked to choose their survey sites, in a process of co-creation. Although this project has been mainly collaborative (sensu Bonney et al., 2009), we wanted to include elements of co-creation, involving the general public in the choices of the survey sites. In fact, Jollymore and colleagues (2017) pointed out that while allowing people to choose their sites may lead to geographical biases and uneven distribution of the sampling sites, this process can boost participation, since people would be more likely to survey areas that they can actively choose and with which they are more familiar. This ties in with the questionnaire results mentioned above, where people got involved to learn more about their particular freshwater bodies and the local area. Allowing this ownership over the sampling location enabled this sense of being river stewards for their local area.
Citizen scientist retention varies widely on environmental projects. Parrish et al. (2019) reported 71% retention on a coastal observation project based in Washington State (USA) after 1 survey, with 40% retention of volunteers after 1 year. Retention in Urban Citizen’s 6.3.2 after 1 year was 51.7% of citizen scientists. The level of support required to retain over half the citizen scientists is significant, as can be seen in this project, but the benefits to community groups, to data quality, and to our understanding of the catchments benefits greatly from these committed citizen scientists. Boakes et al. (2016) identified three separate profiles of citizen scientists in projects which required more active engagement, such as sample collections, similar to Urban Citizen’s 6.3.2 - dabblers (those who collected one or two records); enthusiasts (those who are long term and persistent); and steady (those whose profile is between dabblers and enthusiasts). The profile of those citizen scientists within Urban Citizen’s 6.3.2 is similar to this profile, with 22 citizen scientists in the ‘dabbler’ category (with 1 - 2 surveys recorded), 10 in the ‘enthusiasts’ (over 10 surveys) and 26 in the ‘steady’ category over the monitoring period.
There is a balance to be struck between the flexibility (to maximise participation) and the need for consistent data, including repeated data collection at particular locations. Within Urban Citizen’s 6.3.2, the data gathered by both ‘enthusiasts’ and ‘steady’ citizen scientists collected data at 54 locations, with the ‘dabblers’ adding occasional data at 93 other sites in between the more consistent monitored sites. In future work, having a contingency for the handing-on of sites which have occasional monitoring may be useful by, for example, encouraging new citizen scientists to take over sites that had been monitored initially.
4.3 Importance of community groups and champions and building a network of collaborators - social impact
Ireland has a strong track record in volunteering. In the 2022 census, 14% of the Irish population reported volunteering in general, with 4% of the population volunteering within their local community (CSO, 2025). Dublin hosts several active community groups which have been involved in environmental initiatives and educational activities for years. In some cases their role in improving local water bodies has been recognised (e.g., Thompson, 2024). Some of these are centred around a specific river (such as the aforementioned Dodder Action group, which was set up by individuals who live near the River Dodder in 2009, initially to organise the picking out of rubbish from the river) or a specific suburban or urban area, such as local groups connected to the Tidy Towns network - an initiative with roots in the 1950s, when the Irish Tourism Board (An Bord Fáilte) initiated a National Spring Festival, which included initiatives to make Irish towns and villages more attractive for tourism, including a National Spring Clean Campaign. This evolved in 1958 into an annual national competition for the tidiest town or village in Ireland, and local committees are present in the many towns and villages who compete in the competition each year. The competition is currently administered by the Irish Department of Rural and Community Development, and has incorporated ‘Nature and Biodiversity’ into the categories of the competition over the past number of years. This category includes ‘Actions for nature and biodiversity’ as a consideration in the adjudication. Therefore, projects such as Urban Citizens’ 6.3.2 are ideally suited to community groups who are interested in the Tidy Towns initiative.
As mentioned above, in this project, we initially reached out to volunteer groups involved in our targeted catchments, and we established a collaboration with those who were interested in becoming involved. This has been highly beneficial to both sides, since these groups have been a catalyst in recruiting citizen scientists through their existing networks. In turn, one of the community groups involved in the Tidy Towns competition (Raheny TidyTowns) won the Climate Action Award in the Large Town & Large Urban Centre Category as well as the Pollinator Award and a Gold Medal in the 2024 Tidy Towns competition (Tidy Towns, 2024a). The involvement of the community in the research described in this paper was specifically called out in the published report on the area for the 2024 Tidy Towns competition for the urban areas of Raheny (Tidy Towns, 2024b), Ballymun (Tidy Towns, 2024c), Rathfarnham (Tidy Towns, 2024d) and Woodstown Village (Tidy Towns, 2024e). Furthermore, it is significant that the communities of citizen scientists chose to include information about the project within the submission for Tidy Towns - in some cases including details of the results obtained - all of this independently of the research team, as it shows ownership by the community groups over the results obtained, an ability to present the data to external stakeholders, and awareness of the importance of the research.
The project benefited from the established network of volunteers and community groups that Ireland hosts. This aspect has been a strong contextual enabler which has contributed to the project success. This aspect could be a limiting factor in different social settings, such as where communities are less interconnected and more individualistic.
Additionally, members of these community groups have acted as champions, helping to coordinate training sessions, and boosting communication amongst citizen scientists. Champions are people who have strong personal commitment to the project, as well as enthusiasm and persistence, and they draw others to join, providing support and advice. Their importance in citizen science has been widely recognized, not only during projects’ lifespan, but also after their completion (e.g., Taylor et al., 2011; Maccani et al., 2020).
In the case of this project, there were at least four citizen scientists that acted as champions during the research. These people were very active in involving and educating others, recruiting more than 30 new volunteers. They also played an important role in coordinating existing volunteers, helping the project team organise training sessions and distributing sampling equipment.
Both champions and community groups have expressed their interest and commitment to continue the surveys beyond the funded project, highlighting the importance of the sustainability of citizen science projects (see also Section 4.5). Similarly, previous projects have highlighted how champions can be crucial in supporting engagement of people and development of further initiatives once the initial project ends (Maccani et al., 2020).
4.4 Local ecological knowledge: knowledge transfer is multi-directional
Some authors pointed out that citizen science tends to be unidirectional in the exchange of knowledge, with the general public being provided with information and skills by the research team (‘knowledge deficit’ approach; Irwin, 2002). However, this approach does not take into account the existing Local Ecological Knowledge (LEK; see, e.g., Berkes, 2008), that is the body of knowledge developed by individuals, communities and stakeholders at the local scale, which is usually experienced-based, non-written and adaptive (Brook and McLachlan, 2008).
As can be seen in Figure 4C, most of the citizen scientists involved in this project had lived in the local area that they were sampling for a long time. This attachment to place was a motivation in getting involved in this project, while the knowledge of the local area provided the entire project team (established researchers and citizen scientists) with knowledge which assisted in the co-creation aspects of the project, and the choice of sampling sites. During this research, we have experienced how the personal knowledge of our citizen scientists has aided a better understanding of the history and dynamics of the investigated water bodies. For instance, some of the citizen scientists provided valuable insights about the rivers’ ecological conditions in past years, such as the occurrence of pollution events that they have directly witnessed. Others shared historical photographs dating back to the early 1900s, showing river changes, including the development of canalisation of the river, and land use over time.
Some of the citizen scientists were also anglers, and they possessed long-term knowledge on the occurrence of fish and macroinvertebrate species in local areas. For example, one citizen scientist informed the project team that the River Santry, one of the most degraded rivers in our study, used to thrive with eels just a few decades ago, suggesting that its ecological decline has been relatively recent. In another case, anglers informed us how the River Dodder used to be much more polluted and how it has largely recovered since then, mainly due to advocacy by these same anglers and other local community groups. This local knowledge has proven useful within this project, and part of this information is being integrated into a documentary currently in preparation about the river Tolka, one of the river catchments for this research.
On the other hand, citizen science can be a catalyst for people to form new attachments to place. Some of the volunteers have told the project team how joining the project has led them to connect better to their local water bodies, especially for people who have recently moved to the area. They mentioned being involved in the project as an opportunity to connect to others and form new groups, becoming local river stewards. In fact, the place-centrism of citizens has been cited as one of the main advantages of citizen science (Jollymore et al., 2017), since citizens can have better observational power than scientists, especially when it comes to detect short timescale events (e.g., pollution incidents) and long-term ecological changes (e.g., anglers observations).
4.5 The ripple effect: the project’s influence on society, beyond the project scope
While we designed this project with the main goal of collecting data to fill gaps in the statutory reporting on the ecological conditions of urban streams and rivers, and providing education opportunities to the involved citizen scientists, the project has evolved throughout its lifespan, and its influence has gone beyond the initial scope.
For example, during the data collection, a series of pollution events were detected across the four investigated catchments, ranging from macroinvertebrate die-offs and fish kills, to different compounds seen in suspension in the water column (i.e., cloudy, greyish or milky water), and even an oil spill event. Following each event, citizen scientists spread this information both through the project’s WhatsApp group and on their own personal social networks. Furthermore, they have alerted relevant local authorities (EPA, local county councils, Inland Fisheries Ireland), prompting these authorities to investigate and take action. In some cases, authorities managed to find the cause of such pollution events, and acted to remedy the issues, which were caused by sewage blockages and domestic misconnections.
Similar to the research described in this paper, previous studies highlighted the potential role of citizen scientists in alerting and assisting authorities, especially identifying pollution sources and events that would otherwise be undetected (e.g., Latimore and Steen, 2014; McKinley et al., 2015; Brooks et al., 2019; Loiselle et al., 2024). Through harnessing the local and scientific knowledge of the community of citizen scientists, local authorities received early notification of these events. Being involved in this research has fostered river stewardship, building human capital, knowledge and skills to empower communities to take an active role in protecting their local water courses. The project has created a scalable model that can be exported to other geographic areas.
The data collected through our project can also be utilised to complement official monitoring programmes, such as the EPA monitoring programme, routinely conducted in Ireland in fulfillment of the Water Framework Directive. These citizen-generated data can prove useful especially in case of smaller streams and tributaries, which are often overlooked due to limited resources (Kelly-Quinn et al., 2022). This kind of data may also be used for ground-truthing purposes, complementing large-scale data collections, such as satellite-based monitoring of land use, by providing details at a smaller spatial resolution.
While the WhatsApp group was created to facilitate exchanging of information regarding the project, it has become a useful tool to expand communication beyond the project scope, sharing external news and useful links. For example, information was shared about a domestic misconnections programme conducted by one of the local authorities within which a catchment fell (www.sdcc.ie/en/services/environment/dublin-urban-rivers-life/), and several volunteers took part in this programme, inspecting their own properties for potential misconnections, while involving also other people in doing so. On the other hand, it was important to define the scope and purpose of the WhatsApp group, which otherwise may end up being utilised for off-topic conversations, causing people to drop off the group, overwhelmed by unnecessary messages or from WhatsApp fatigue. Clear communication on what was acceptable to post at the outset, as well as personal communication (outside of the WhatsApp group) to clarify this if needed, was important in maintaining the focus and the effectiveness of this tool.
During the data collection period, some citizen scientists involved people from their social group, who joined them during their surveys and were taught basic ecological knowledge and monitoring skills. Some went on to advocate with local authorities and organise themselves in small networks, exchanging information and news about water quality and local freshwater ecosystems. Although not officially formalised, these can be seen as an early stage of a “train the trainer” approach, as some citizen scientists have shown an interest in becoming trained to help others, and being officially recognised as such.
5 Conclusion
The research project described in this paper, Urban Citizen’s 6.3.2, had as a tagline ‘Citizen stewardship of surface water bodies for SDG 6.3.2’. By effectively implementing a framework for citizen science, the project has maximised engagement and knowledge sharing among all participants (both the ‘established researchers’ and the ‘citizen scientists’). This has led to the community groups who were engaged in the research having ownership over the data, and becoming stewards of the freshwater bodies that flow through their local areas. Some of the innovative aspects of the project included the ethical considerations, and the depth of support provided to the citizen scientists. The project evolved to incorporate learnings as it progressed. These learnings have been shared here, in the hope that they may be of use also to other researchers who are considering undertaking similar projects in the future.
Data availability statement
The raw data supporting the conclusions of this article will be made available by the authors, without undue reservation.
Ethics statement
The manuscript presents research on animals that do not require ethical approval for their study.
Author contributions
SH: Conceptualization, Funding acquisition, Investigation, Methodology, Project administration, Supervision, Writing – original draft, Writing – review and editing, Data curation, Formal Analysis, Visualization. LR: Conceptualization, Data curation, Investigation, Methodology, Project administration, Writing – original draft, Writing – review and editing, Formal Analysis, Validation. FR: Funding acquisition, Investigation, Resources, Supervision, Writing – review and editing.
Funding
The author(s) declare that financial support was received for the research and/or publication of this article. The research was funded by the Irish Research Council COALESCE Scheme (COALESCE/2022/1661).
Acknowledgements
The authors would like to thank all citizen scientists and community groups who took part in this project, for their invaluable commitment and collective effort throughout. Thanks to Ruth Clinton for support during the initial stages. To Notre Dame undergraduate summer interns Lizzie Stifel and Christine Hruby, and DCU undergraduate summer interns Béibhínn Bonham, Róisín Gilligan, Jack Hamilton, and to Eimear Clowry-Delaney (University of Notre Dame - Dublin) for facilitating the ND internships. Those who provided guidance and feedback on the methodologies included Simon Harrison (University College Cork) and LAWPRO community water officers Justin Ivory and Ruth Gaj McKeever. We acknowledge the support given by Earthwatch Europe’s FreshWater Watch programme.
Conflict of interest
The authors declare that the research was conducted in the absence of any commercial or financial relationships that could be construed as a potential conflict of interest.
The author(s) declared that they were an editorial board member of Frontiers, at the time of submission. This had no impact on the peer review process and the final decision.
Generative AI statement
The author(s) declare that no Generative AI was used in the creation of this manuscript.
Any alternative text (alt text) provided alongside figures in this article has been generated by Frontiers with the support of artificial intelligence and reasonable efforts have been made to ensure accuracy, including review by the authors wherever possible. If you identify any issues, please contact us.
Publisher’s note
All claims expressed in this article are solely those of the authors and do not necessarily represent those of their affiliated organizations, or those of the publisher, the editors and the reviewers. Any product that may be evaluated in this article, or claim that may be made by its manufacturer, is not guaranteed or endorsed by the publisher.
Supplementary material
The Supplementary Material for this article can be found online at: https://www.frontiersin.org/articles/10.3389/fenvs.2025.1690383/full#supplementary-material
References
Balázs, B., Mooney, P., Nováková, E., Bastin, L., and Arsanjani, J. J. (2021). “Data quality in citizen science,” in The science of citizen science. Editors K. Vohland, A. Land-Zandstra, L. Ceccaroni, R. Lemmens, and J. Perelló, (Springer Nature), 139–157.
Biggs, J., McGoff, E., Ewald, N., Williams, P., Dunn, F., and Nicolet, P. (2016). Clean water for wildlife technical manual. Evaluating PackTest nitrate and phosphate test kits to find clean water and assess the extent of pollution. Freshw. Habitats Trust.
Bishop, I. J., Head, J., Shepherd, C., Hayes, S., Loiselle, S., Scott-Somme, K., et al. (2021). The role of citizen science in UK freshwater monitoring. Earthwatch Eur.
Boakes, E., Gliozzo, G., Seymour, V., Harvey, M., Smith, C., Roy, D. B., et al. (2016). Patterns of contribution to citizen science biodiversity projects increase understanding of volunteers’ recording behaviour. Sci. Rep. 6, 33051. doi:10.1038/srep33051
Bonney, R., Ballard, H., Jordan, R., McCallie, E., Phillips, T., Shirk, J., et al. (2009). “Public participation in scientific research: defining the field and assessing its potential for informal science education,” in A CAISE inquiry group report.
Bonney, R., Shirk, J. L., Phillips, T. B., Wiggins, A., Ballard, H. L., Miller-Rushing, A. J., et al. (2014). Next steps for citizen science. Science 343, 1436–1437. doi:10.1126/science.1251554
Brook, R. K., and McLachlan, S. M. (2008). Trends and prospects for local knowledge in ecological and conservation research and monitoring. Biodivers. Conservation 17, 3501–3512. doi:10.1007/s10531-008-9445-x
Brooks, P. R., Nairn, R., Harris, M., Jeffrey, D., and Crowe, T. P. (2016). Dublin port and Dublin Bay: reconnecting with nature and people. Regional Stud. Mar. Sci. 8, 234–251. doi:10.1016/j.rsma.2016.03.007
Brooks, S. J., Fitch, B., Davy-Bowker, J., and Codesal, S. A. (2019). Anglers’ riverfly monitoring initiative (ARMI): a UK-wide citizen science project for water quality assessment. Freshw. Sci. 38, 270–280. doi:10.1086/703397
Chislock, M. F., Doster, E., Zitomer, R. A., and Wilson, A. E. (2013). Eutrophication: causes, consequences, and controls in aquatic ecosystems. Nat. Educ. Knowl. 4, 10.
Cigliano, J. A., Meyer, R., Ballard, H. L., Freitag, A., Phillips, T. B., and Wasser, A. (2015). Making marine and coastal citizen science matter. Ocean and Coast. Manag. 115, 77–87. doi:10.1016/j.ocecoaman.2015.06.012
Collins, R., France, A., Walker, M., and Browning, S. (2023). The potential for freshwater citizen science to engage and empower: a case study of The Rivers trusts, United Kingdom. Front. Environ. Sci. 11, 1218055. doi:10.3389/fenvs.2023.1218055
Conrad, C. C., and Hilchey, K. G. (2011). A review of citizen science and community-based environmental monitoring: issues and opportunities. Environ. Monit. Assess. 176, 273–291. doi:10.1007/s10661-010-1582-5
CSO (2025). Census of population 2022 spotlight series: volunteering in Ireland. Available online at: https://www.cso.ie/en/releasesandpublications/ep/p-cpsv/censusofpopulation2022spotlightseriesvolunteeringinireland/(Accessed October 3, 2025).
Dickinson, J. L., Zuckerberg, B., and Bonter, D. N. (2010). Citizen science as an ecological research tool: challenges and benefits. Annu. Rev. Ecol. Evol. Syst. 41, 149–172. doi:10.1146/annurev-ecolsys-102209-144636
EPA (2022). Catchments data package - June 2022. Available online at: https://gis.epa.ie/GetData/Download (Accessed March, 2023).
ESRI (2015). ArcGIS Survey123. Available online at: https://play.google.com/store/apps?hl=en.
Frost, P. (2001). Urban biosphere reserves: re-integrating people with the natural environment. Town Ctry. Plan. 70, 213–215.
Hegarty, S., Hayes, A., Regan, F., Bishop, I., and Clinton, R. (2021). Using citizen science to understand river water quality while filling data gaps to meet united nations sustainable development goal 6 objectives. Sci. Total Environ. 783, 146953. doi:10.1016/j.scitotenv.2021.146953
Herman, M. R., and Nejadhashemi, A. P. (2015). A review of macroinvertebrate-and fish-based stream health indices. Ecohydrol. and Hydrobiology 15, 53–67. doi:10.1016/j.ecohyd.2015.04.001
Irwin, A. (2002). Citizen science: a study of people, expertise and sustainable development. London: Routledge.
Jalbert, K., and Kinchy, A. J. (2016). Sense and influence: environmental monitoring tools and the power of citizen science. J. Environ. Policy and Plan. 18, 379–397. doi:10.1080/1523908x.2015.1100985
Jollymore, A., Haines, M. J., Satterfield, T., and Johnson, M. S. (2017). Citizen science for water quality monitoring: data implications of citizen perspectives. J. Environ. Manag. 200, 456–467. doi:10.1016/j.jenvman.2017.05.083
Kelly-Quinn, M., Biggs, J. N., Brooks, S., Fortuno, P., Hegarty, S., Jones, J. I., et al. (2022). Opportunities, approaches and challenges to the engagement of citizens in filling small water body data gaps. Hydrobiologia 850, 3419–3439. doi:10.1007/s10750-022-04973-y
Latimore, J. A., and Steen, P. J. (2014). Integrating freshwater science and local management through volunteer monitoring partnerships: the Michigan clean water corps. Freshw. Sci. 33, 686–692. doi:10.1086/676118
Lemley, D. A., and Adams, J. B. (2019). “Eutrophication,” in Encyclopedia of ecology. Second Edition (Elsevier), 86–90.
Loiselle, S., Bishop, I., Moorhouse, H., Pilat, C., Koelman, E., Nelson, R., et al. (2024). Citizen scientists filling knowledge gaps of phosphate pollution dynamics in rural areas. Environ. Monit. Assess. 196, 220–15. doi:10.1007/s10661-024-12389-5
Maccani, G., Goossensen, M., Righi, V., Creus, J., and Balestrini, M. (2020). Scaling up citizen science - what are the factors associated with increased reach and how to lever them to achieve impact. Luxembourg: Publications Office of the European Union.
McKinley, D. C., Miller-Rushing, A. J., Ballard, H. L., Bonney, R., Brown, H., Evans, D. M., et al. (2015). Investing in citizen science can improve natural resource management and environmental protection. Issues Ecol. 19, 1–27.
McSorley, B. (2022). Establishing the citizen science stream index (CSSI) to monitor water quality in freshwaters. Cork: Master’s thesis. University College Cork.
Metcalfe, A. N., Kennedy, T. A., Mendez, G. A., and Muehlbauer, J. D. (2022). Applied citizen science in freshwater research. Wiley Interdiscip. Rev. Water 9, e1578. doi:10.1002/wat2.1578
Michaluk, S. (2024). macroinvertebrate. Encycl. Br. Available online at: https://www.britannica.com/animal/macroinvertebrate (Accessed June 25, 2024).
Parrish, J. K., Jones, T., Burgess, H. K., He, Y., Fortson, L., and Cavalier, D. (2019). Hoping for optimality or designing for inclusion: persistence, learning, and the social network of citizen science. Proc. Natl. Acad. Sci. U.S.A. 116 (6), 1894–1901. doi:10.1073/pnas.1807186115
Quinlivan, L., Chapman, D. V., and Sullivan, T. (2020). Validating citizen science monitoring of ambient water quality for the united nations sustainable development goals. Sci. Total Environ. 699, 134255. doi:10.1016/j.scitotenv.2019.134255
Resnik, D. B., Elliott, K. C., and Miller, A. K. (2015). A framework for addressing ethical issues in citizen science. Environ. Sci. and Policy 54, 475–481. doi:10.1016/j.envsci.2015.05.008
Riesch, H., and Potter, C. (2014). Citizen science as seen by scientists: methodological, epistemological and ethical dimensions. Public Underst. Sci. 23, 107–120. doi:10.1177/0963662513497324
Roche, J., Ni Shuilleabhain, A., Mooney, P., Barber, G. L., Bell, L., and Ryan, C. (2021). Citizen science in Ireland. Front. Commun. 6, 629065. doi:10.3389/fcomm.2021.629065
Taighde Eireann (2024). Coalesce call document 2025. Available online at: https://research.ie/assets/uploads/2024/10/COALESCE-Scheme-2025_Call-Document_Final.pdf.
Taylor, A., Cocklin, C., Brown, R., and Wilson-Evered, E. (2011). An investigation of champion-driven leadership processes. Leadersh. Q. 22, 412–433. doi:10.1016/j.leaqua.2011.02.014
Thompson, S. (2024). This is your river: a film underlining the importance of the dodder in the heart of Dublin. Ir. Indep. Available online at: https://www.irishtimes.com/environment/climate-crisis/2024/07/04/this-is-your-river-a-film-underlining-importance-of-the-dodder-in-the-heart-of-dublin/(Accessed October 14th, 2024).
Tidy Towns (2024a). Results booklet 2024. Available online at: https://www.tidytowns.ie/SuperValu-TidyTowns-Results-Booklet-2024.pdf.
Tidy Towns (2024b). Tidy towns competition 2024 adjudication report: raheny. Available online at: https://tidytowns.s3.eu-west-1.amazonaws.com/u_reports/2024/dublin/2024-Dublin-Raheny-176.pdf.
Tidy Towns (2024c). Tidy towns competition 2024 adjudication report: Ballymun. Available online at: https://tidytowns.s3.eu-west-1.amazonaws.com/u_reports/2024/dublin/2024-Dublin-Ballymun-854.pdf.
Tidy Towns (2024d). Tidy towns competition 2024 adjudication report: Rathfarnham. Available online at: https://tidytowns.s3.eu-west-1.amazonaws.com/u_reports/2024/dublin/2024-Dublin-Rathfarnham-775.pdf.
Tidy Towns (2024e). Tidy towns competition 2024 adjudication report: woodstown village. Available online at: https://tidytowns.s3.eu-west-1.amazonaws.com/u_reports/2024/dublin/2024-Dublin-Woodstown-Village-2172.pdf.
Tricarico, E. (2022). Many eyes on the water': the role of citizen science in freshwater conservation. Aquat. Conserv. 32, 1867–1871. doi:10.1002/aqc.3891
UNEP (2018). Progress on ambient water quality: piloting the monitoring methodology and initial findings for SDG indicator 6.3.2. UN environment.
Walker, D. W., Smigaj, M., and Tani, M. (2021). The benefits and negative impacts of citizen science applications to water as experienced by participants and communities. Wiley Interdiscip. Rev. Water 8, e1488. doi:10.1002/wat2.1488
Weiner, D., Bloomer, J., Conchúir, R. Ó., and Dalton, C. (2022). The role of volunteers and citizen scientists in addressing declining water quality in Irish river catchments. Citiz. Sci. Theory Pract. 7, 1–12. doi:10.5334/cstp.447
Wiggins, A., Newman, G., Stevenson, R. D., and Crowston, K. (2011). “Mechanisms for data quality and validation in citizen science,” in Paper presented at the 2011 IEEE Seventh international conference on e-Science Workshops, Stockholm, Sweden, 05-08 December 2011, 14–19. doi:10.1109/esciencew.2011.27
Keywords: citizen science, freshwater quality, training and engagement, community engagement, SDG Indicator 6.3.2, urban rivers, Ireland
Citation: Hegarty S, Ribero L and Regan F (2025) An effective roadmap for training and engagement of citizen scientists and community groups investigating freshwater quality: Urban Citizen’s 6.3.2 (Dublin, Ireland). Front. Environ. Sci. 13:1690383. doi: 10.3389/fenvs.2025.1690383
Received: 21 August 2025; Accepted: 16 October 2025;
Published: 14 November 2025.
Edited by:
James Kevin Summers, U.S. Environmental Protection Agency (EPA), United StatesReviewed by:
Shuvojit Nath, Monash University, AustraliaSimon Browning, The Rivers Trust, United Kingdom
Copyright © 2025 Hegarty, Ribero and Regan. This is an open-access article distributed under the terms of the Creative Commons Attribution License (CC BY). The use, distribution or reproduction in other forums is permitted, provided the original author(s) and the copyright owner(s) are credited and that the original publication in this journal is cited, in accordance with accepted academic practice. No use, distribution or reproduction is permitted which does not comply with these terms.
*Correspondence: Susan Hegarty, c3VzYW4uaGVnYXJ0eUBkY3UuaWU=