 Baoshi Tang
 Yu Zhong2*
- 1School of Finance, Central University of Finance and Economics, Beijing, China
- 2School of Public Finance and Taxation, Southwestern University of Finance and Economics, Chengdu, China
- 3Graduate School of Business Administration, Hitotsubashi University, Tokyo, Japan
- 4School of Economics, Yunnan University, Kunming, China
Using a panel dataset of Chinese cities from 2007 to 2020, this paper evaluates the impact of the Central Environmental Protection Inspection (CEPI) on urban Energy Utilization Efficiency by employing a staggered difference-in-differences design. The analysis yields four key findings. First, CEPI significantly improves cities’ Energy Utilization Efficiency, and this result remains robust across a battery of empirical checks, including sensitivity analyses for deviations from the parallel trends assumption, estimation using imperfect instrumental variables, and heterogeneous treatment effects. Second, mechanism analysis suggests that CEPI enhances urban innovation capacity, discourages the entry of pollution-intensive firms, and mitigates capital misallocation. Third, heterogeneity analysis reveals that the positive effects of CEPI on Energy Utilization Efficiency are more pronounced in resource-based cities, cities with weaker environmental enforcement, and those with higher levels of green financial development. Fourth, extending the analysis using a Double Machine Learning framework, we further find that CEPI contributes to improvements in cities’ inclusive green growth. Taken together, these findings offer new insights for developing economies—such as China—seeking to improve Energy Utilization Efficiency through institutionalized environmental regulatory mechanisms.
1 Introduction
Improving energy utilization efficiency in China is integral not only to the nation’s development strategy but also to the daily lives of its citizens. The problem of low energy utilization efficiency in China has long been entrenched. In 2020, the electricity consumption cost per unit of GDP in China (measured in 2015 US dollar prices) was $0.506 per kWh, considerably higher than the global average of $0.305 per kWh. In addition, in 2020, China’s energy self-sufficiency rate (calculated as the ratio of domestic energy production to total energy supply) was 0.799, significantly lower than the global average of 1.014. This situation reflects China’s long-standing reliance on coal, which accounted for 57% of primary energy consumption in 2020, leading to inefficiencies in energy use. In light of these issues, the 14th Five-Year Plan of China emphasizes the importance of advancing an energy revolution, to develop an energy system that is sustainable, low-emission, secure, and optimized. Improving energy efficiency and refining the composition of the energy structure are, therefore, widely acknowledged as vital factors in promoting high - caliber economic growth in China.
China’s conventional model of extensive growth has played a substantial role in causing environmental deterioration and inefficiencies in the way energy is used. As a countermeasure, the Chinese authorities enacted the “most stringent” Environmental Protection Law in 2015, aiming to tackle the dual task of promoting economic expansion while safeguarding ecological integrity. To bolster the enforcement of this law and oversee the conduct of local governments and businesses, the central government initiated the Central Environmental Protection Inspection (CEPI) program for the initial time during 2016–2017. The first round of these inspections was spearheaded by high-ranking members of the Standing Committee of the Political Bureau (SCPB), with ministerial-level officials from the central government leading the inspection teams. These teams carried out month-long inspections in different provinces in a phased manner. Academics have pointed out the positive spillover effects linked to the CEPI. They propose that it serves as a deterrent, effectively resolving local environmental problems and promoting green urban development (Qian et al., 2023; Razzaq et al., 2023). Although the CEPI stands as one of China’s most pivotal environmental regulatory policies, its possible influence on energy utilization efficiency is still an unresolved issue. In particular, investigating whether the CEPI can enhance energy efficiency, the underlying operational mechanisms, and whether its impacts spill over to neighboring cities not directly included in the pilot program is of significant importance. Answering these questions is vital for a thorough comprehension of the policy’s efficacy. Hence, this paper calculates urban energy utilization efficiency and uses a DID approach to determine the effect of CEPI on energy efficiency at the city level, providing a definitive response to the above - mentioned problem.
Despite the positive externalities associated with the CEPI, some studies suggest that it exhibits characteristics typical of campaign-style governance, with limited continuity in its policy effects (Wu and Hu, 2019). The existing literature generally acknowledges that the CEPI can promote China’s green transition, yet it overlooks the critical role that energy utilization efficiency plays in facilitating this transition (Liu et al., 2022; Lu, 2022). Furthermore, past studies have largely overlooked the effect of CEPI on the patterns of firm entry and exit, and have not addressed the efficiency of capital allocation. Moreover, a theoretical exploration of the connection between the CEPI and energy utilization efficiency is notably absent (Jia and Chen, 2019). Existing research mainly centers on governmental accountability and the incentive impacts on enterprises’ environmental actions, especially the repercussions of “enterprise - monitoring” regulatory policies within the framework of territorial management. Nevertheless, these studies offer limited attention to the constraints that the central government places on local governments, particularly concerning the effects and operational mechanisms of “government - supervision” style environmental regulation policies (Zhang et al., 2022). In light of this gap, this study employs a dataset comprising 283 cities at or above the prefecture - level in China to conduct an empirical analysis of the relationship between CEPI and urban energy efficiency. It also delves into the pathways and mechanisms by which CEPI affects energy efficiency, thus providing meaningful insights for a thorough comprehension of the policy implications of CEPI.
This paper makes several critical contributions to the existing literature. First, it examines the factors influencing urban energy utilization efficiency through the lens of the CEPI policy, thereby expanding the scope of research in this domain. Second, it provides an in-depth explanation of the heterogeneity in treatment effects within staggered difference-in-differences models, and employs robust estimators to enhance the reliability of policy identification. This ensures that the findings on the policy’s impact are more trustworthy and valid. Third, by applying Spatial Difference-in-Differences (SDID) to analyze the CEPI’s impact on urban energy efficiency, the study circumvents this assumption, effectively filling the gap in evaluating the comprehensive effects of environmental inspection policies. This approach offers a more complete and nuanced understanding of how such policies operate in real-world contexts.
The paper is structured in the following manner. In the second part, a comprehensive review of the pertinent literature is presented. The third section offers an overview of the institutional context and puts forward theoretical hypotheses. The fourth segment delineates the research methodology employed. The fifth part showcases the econometric findings along with an in - depth analysis. The sixth section undertakes an exploration of the underlying mechanisms and carries out supplementary analysis. Finally, the last section summarizes the conclusions and highlights the key takeaways.
2 Literature review
Improving energy utilization efficiency is crucial for high-quality economic development across all nations, with various factors influencing energy efficiency, including policies, technology, environmental regulation, industrial structure, institutional quality, and openness to foreign entities. Institutions can influence urban energy utilization efficiency. Hussain et al. (2021) found that institutional quality—specifically the rule of law and corruption control—significantly increases investment in renewable energy, thereby improving energy utilization efficiency. Lyu et al. (2022), through a quasi-natural experiment involving China’s Environmental Pollution Liability Insurance (EPLI) and employing a difference-in-differences approach, discovered that EPLI notably increases urban energy efficiency by stimulating corporate environmental investments and strengthening market regulation. Feng et al. (2023) observed that China’s new urbanization pilot policies enhance energy utilization efficiency by fostering technological progress and improving the efficiency of green technologies. Yang et al. (2023), utilizing a difference-in-differences model, found that China’s low-carbon city pilot policies contribute to a reduction in corporate energy consumption intensity, mainly by improving enterprise energy efficiency and promoting energy-saving attitudes among firms. Additionally, policies such as the Pilot Emissions Trading System Albrizio et al. (2017), the Electricity Marketization Pilot (Wang and Wang, 2023), and the Carbon Emissions Trading Pilot (Li et al., 2023) have similar effects, all contributing to the enhancement of urban energy efficiency. In addition, He et al. (2023) provide important empirical evidence on the environmental consequences of China’s green finance pilot policy. Exploiting panel data from 2009 to 2019 within a difference-in-differences framework, the authors document that the policy leads to a significant improvement in the joint reduction of carbon emissions and local pollutants. Their mechanism analysis indicates that these effects are primarily driven by industrial structure upgrading, advances in green technological innovation, and adjustments in the energy mix. Taken together, the findings highlight the pivotal role of financial policy in shaping the energy structure and advancing coordinated environmental objectives. Moreover, factors such as firm size, industry concentration, and corporate ownership structure significantly influence energy efficiency, though their effects differ by industry (Li and Shi, 2014). In energy-intensive industries, capital input, energy prices, and labor costs are key factors affecting energy efficiency (Li and Tao, 2017). In the context of technology and innovation, Sun et al. (2019) analyzed panel data from 71 developed and developing countries and concluded that green technological progress driven by policies plays a key role in restructuring the energy mix and enhancing energy efficiency. Wen et al. (2021), employing fixed effects analysis on panel data from South Asian developing countries, revealed that green innovation significantly enhances both environmental quality and energy efficiency in the region. Gao et al. (2022) observed that the digital economy can bolster energy efficiency through technological innovation and increased market vitality. Abbas et al. (2022) found that environmental innovation and energy structure adjustments improve energy efficiency in BRICS countries. Xu et al. (2023), utilizing the entropy weight method on World Bank data, constructed indices for Green Technological Innovation (GTI) and Environmental Regulation Intensity (ERI), discovering that both GTI and ERI effectively enhance energy efficiency and promote carbon neutrality. Luo et al. (2024) document that urban energy utilization efficiency is closely linked to the green development of strategically important national regions. Complementing this evidence, Jiang et al. (2024) find that the New-Type Urbanization Comprehensive Pilot Policy boosts urban energy efficiency.
Guo and Jin (2025) emphasize that the effects of policy interventions exhibit substantial spatial heterogeneity. Because inherent trade-offs often characterize development in core and peripheral regions, policy evaluation must consider spatial equilibrium.The degree of openness to international markets gives rise to two distinct effects: the pollution haven effect and the halo effect. A multitude of researchers have investigated its influence on energy utilization efficiency. Their findings revealed that trade liberalization, which represents openness to foreign trade, generally leads to a decline in energy utilization efficiency and an uptick in carbon dioxide emissions (Hu et al., 2021). Nevertheless, they also pointed out that innovation - focused policies, like patent safeguards, have the potential to enhance energy utilization efficiency. Ali et al. (2022) utilized the Augmented Mean Group (AMG) approach in their research. They found that Foreign Direct Investment (FDI) demonstrates a pollution haven effect within the BRICS nations. This effect results in a reduction of energy efficiency and an increase in carbon dioxide emissions. Simultaneously, they stressed that green innovation can boost energy efficiency and limit carbon emissions by facilitating the spread of knowledge and technology. Rauf et al. (2023) arrived at a similar conclusion. They discovered that FDI may reduce energy efficiency. Moreover, the energy rebound effect that often accompanies economic growth could further erode energy efficiency. External environmental elements, such as natural disasters and extreme weather occurrences, can also play a role in shaping energy utilization efficiency. Ali et al. (2021) carried out a comprehensive review of how the COVID-19 pandemic has affected environmental systems. This review encompassed the pandemic’s impact on energy utilization efficiency, carbon emissions efficiency, and the effectiveness of environmental regulatory policies. Wang and Tang (2023) found that extreme weather conditions in China compel cities to strengthen their technological innovation capacities. As a result, energy utilization efficiency improves, and this positive effect is more evident in peripheral cities.
The Chinese government introduced the CEPI policy to address the increasingly severe environmental challenges and to achieve its “dual carbon” goals. The policy is characterized by its dual focus on supervising both government and enterprises, with inspection teams endowed with significant authority and stringent enforcement powers, which enable them to effectively disrupt collusion between the government and businesses (Guo, 2023; Zeng et al., 2023). Several studies have examined the socio-economic effects of the CEPI. Economically, it strengthens environmental enforcement and promotes increased investments by firms in environmental protection (Qian et al., 2023). Furthermore, it stimulates corporate green innovation and enhances scientific and technological capabilities (Cheng and Yu, 2023). Pan et al. (2023) argued that the CEPI drives sustainable development by encouraging green innovation and enhancing industrial structure, contributing an average of 14.2% to urban green economic growth, with enduring policy effects. Conversely, some scholars have suggested that the CEPI might excessively intensify environmental regulations, leading to volatile capital market reactions and reduced efficiency in resource allocation (Zeng et al., 2021).
A considerable number of research efforts have underscored the social implications of the CEPI, especially its capacity to enhance the environmental conditions of Chinese cities, with a particularly prominent effect on air quality (Kou et al., 2022; Wu and Hu, 2019; Yuan et al., 2022). Nevertheless, they pointed out that this policy displays features akin to a campaign - style governance model, which gives rise to policy effects that are short - lived and lack sustainability. Wang S. et al. (2023) stressed that the CEPI contributes to the enhancement of urban air quality through multiple pathways. These include heightened government focus on environmental management, increased public awareness of environmental issues, and the promotion of industrial upgrading. Their research revealed that the inspections resulted in an average reduction of 3.709 μg/m3 in urban PM2.5 levels, and this positive impact persisted for as long as 5 years following the policy’s implementation. In addition to air quality improvements, environmental inspections have also been proven to reduce the quantity of polluting enterprises in cities and upgrade water quality. Wang et al. (2021) utilized microdata from 15,154 enterprises in a Chinese province and applied regression discontinuity analysis. Their findings indicated that the CEPI led to a 48% decrease in the number of local polluting enterprises and a 46.5% reduction in industrial Chemical Oxygen Demand (COD) emissions. This improvement in local environmental quality was mainly achieved through production control rather than efficiency enhancements. Lu (2022) made a further observation that the CEPI plays a significant role in reducing cross - border urban water pollution. This is accomplished by reinforcing government environmental regulations, encouraging green innovation, and elevating public environmental awareness. Yang et al. (2024) provide evidence that the Central Environmental Inspection program improves health outcomes among the elderly by mitigating air pollution. In contrast, Wei and Zhao (2024) find that, although the program significantly reduces overall pollution levels, the resulting environmental regulations exacerbate income inequality by shrinking the manufacturing sector’s share in the economy.
3 Background and research hypotheses
3.1 Background
To address its escalating environmental challenges, China established the ecological environment protection supervision system, designed to regulate the behavior of local governments and corporations through robust central government oversight. This system has evolved through three stages: “primarily supervising enterprises,” “supervising both enterprises and government,” and “shared responsibilities between the Party and the government.” In the initial stage, the State Environmental Protection Administration (SEPA) set up regional environmental protection inspection centers in South China and East China in June 2002, followed by similar establishments in Northwest, Southwest, and Northeast China by July 2006, and in North China by December 2008. These regional hubs have taken an active part in supervising the environmental management practices of local businesses. Nevertheless, although these centers were endowed with the power to conduct investigations, they were devoid of the legal authority necessary to enforce regulations. This shortcoming has consequently restricted the effectiveness of environmental oversight. In 2014, the central government issued the “Provisional Measures for Interviews by the Ministry of Environmental Protection” and the “Methods for Comprehensive Supervision of Environmental Protection,” which allowed regional inspection centers to publicly interview local governments failing to meet environmental protection standards. This marked a shift to “supervising both enterprises and government.” However, the environmental protection interview system was still in its early stages, and the outcomes of the interviews did not directly influence the promotion of officials. Additionally, the system’s enforcement power remained limited.
In 2015, the central government introduced the most stringent “Environmental Protection Law” in Chinese history, requiring party and government leaders at all levels of local government to assume “dual responsibilities in one post,” meaning they must balance their primary duties with environmental protection efforts. The new law stipulates that officials who fail to effectively manage environmental governance may face penalties, dismissal, or forced resignation. In July of that same year, with the aim of bolstering the enforcement of the “Environmental Protection Law,” the central authorities approved the “Environmental Protection Supervision Scheme (Trial).” This scheme mandated the launch of a nationwide supervision system for environmental protection initiatives starting in 2016. This move signified a transformation in China’s environmental supervision strategy, transitioning to a model where “both the Party and the government assume shared responsibilities.” Between 2016 and 2017, the central authorities conducted environmental protection inspections across four distinct phases, with each phase lasting for 1 month. These inspections were under the supervision of a member from the SCPB of the Central Committee. For each inspection team assigned to the provinces, a ministerial - ranked official was designated as the leader. The deputy minister in charge of environmental protection served as the deputy head of the inspection initiatives. Simultaneously, the top - tier local government leaders were entrusted with the responsibility of coordinating relevant operations. The first round of central environmental inspections represented a significant leap forward. It guaranteed that the administrative rank of the inspection units was superior to that of the inspected entities, and there was a clear - cut division of labor among departments. This particular organizational framework successfully mobilized the enthusiasm and involvement of local governments, leading to a high level of participation. As illustrated in Table 1, the process of environmental protection inspections contains three separate stages. The first stage is the preparation phase. During this period, the inspection team collects information through multiple channels 1 month prior to the start of the inspection. The second stage is the stationing phase, which also lasts 1 month. This stage is further segmented into “provincial - level inspection,” “municipal - level inspection,” and “summary of results.” Through a thorough investigation from the provincial level down to the local level, this phase identifies environmental problems and puts forward corrective measures.The third stage is the feedback phase. In this stage, the inspection team compiles a comprehensive report and mandates that local governments submit remedial plans. Additionally, local governments are required to provide progress reports every 6 months.
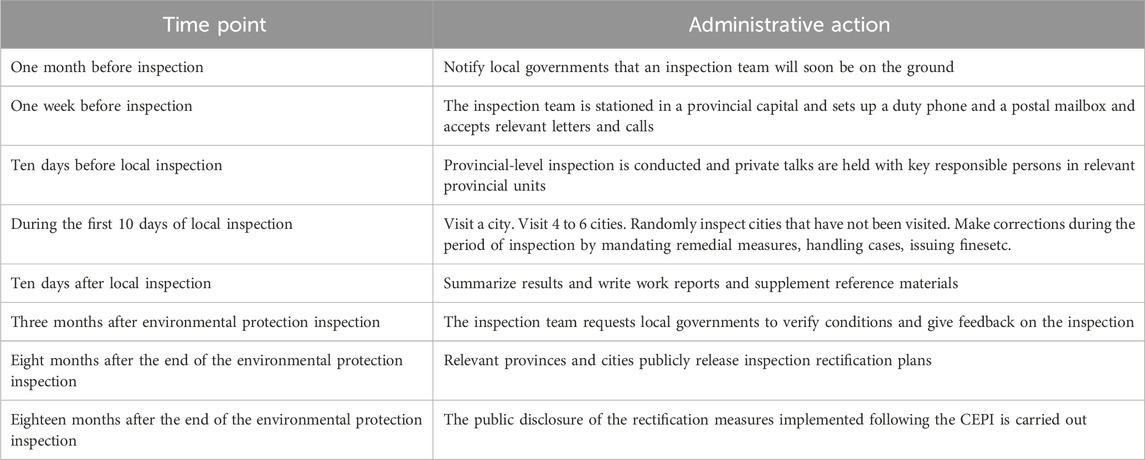
Table 1. Process and nodes of central environmental protection inspection.
The results stemming from the first wave of central environmental protection inspections unequivocally demonstrate their significant impact on governance practices. In total, 1,518 cases underwent investigation, which resulted in the detention of 1,527 people. Moreover, 29,000 individuals faced punishment, and the total fines imposed reached approximately 1.43 billion yuan. Throughout these inspections, various issues were uncovered. Subsequently, local governments formulated remedial plans, which were then made accessible to the public on provincial websites. This move significantly enhanced the impact of the inspections on public sentiment. In November 2017, the six regional inspection centers under the Ministry of Ecology and Environment were rebranded as inspection bureaus. This change represented a transformation from being mere “institutions” to functioning as “delegated authorities” under the Ministry of Ecology and Environment, indicating a pivot towards “government supervision.” Additionally, in 2019, China initiated the second round of central environmental protection inspections, with the objective of expanding the scope to encompass all provinces by 2022. Considering the significant authority, this paper seeks to investigate whether it has the potential to improve urban energy utilization efficiency.
3.2 Research hypothesis
Central environmental protection inspections can enhance urban innovation capabilities and improve energy efficiency through the “Porter Effect” (Porter and Linde, 1995; Sun et al., 2024; Zhang et al., 2024). First, these inspections impose substantial pressure on low-energy-efficiency enterprises by tightening the implementation of the Environmental Protection Law and enhancing corporate environmental governance obligations. This encourages companies to invest in technological innovation and bolster their competitive advantages. With the normalization and ongoing development of central environmental protection inspections, the opportunities for local enterprises to engage in rent-seeking behavior—through strategies such as “paying fines” or “temporarily suspending production”—have been markedly reduced. As a result, investors increasingly focus on corporate environmental performance. When an enterprise faces substantial environmental penalties, it risks losing investor confidence and damaging its reputation. By actively cooperating with inspectors, enterprises can improve their green transformation, which not only enhances their public image but also helps balance environmental governance with corporate profit objectives. Consequently, high-pollution, high-energy-consumption enterprises are incentivized to increase their environmental investments and improve their green innovation levels to survive and thrive in a competitive market (Qian et al., 2023).
Second, the central environmental protection inspection accomplishes its fundamental objective by guaranteeing that both the Party and the government assume joint responsibilities for environmental protection. This, in turn, imposes rigorous demands on local governments regarding environmental governance and the enhancement of energy efficiency. Local governments are obligated to submit various environmental governance and energy use policy reports to cooperate fully with inspections. These efforts aim to enhance clean production, foster eco-friendly innovation expectations among enterprises, and provide institutional support for adjustments in energy structures and production technology innovation. Moreover, central environmental protection inspections encourage local governments to implement innovative reward policies, increase subsidies for energy-saving technologies, and adopt other measures to stimulate innovation and improve local energy-saving technology research and development (Razzaq et al., 2023). Within the context of the Porter Hypothesis, central environmental protection inspections have the potential to spur both local governments and enterprises to bolster their innovation capacities and elevate production and management effectiveness, leading to an overall increase in energy efficiency. In conclusion, this study formulates the following hypothesis:
Hypothesis 1. CEPI enhances energy efficiency through the promotion of urban innovation capabilities.
One notable characteristic of the CEPI lies in its capacity to tighten environmental regulations in industries characterized by high pollution and high energy consumption. This tightening of regulations subsequently restricts the entry of new enterprises into these sectors, ultimately contributing to an improvement in energy utilization efficiency. First, the CEPI has raised the environmental protection standards for local governments. Local authorities now require high-energy consumption and high-pollution enterprises to replace outdated production equipment and optimize production processes, thereby reducing reliance on fossil fuels such as coal. This increase in environmental standards raises the fixed costs for newly established enterprises. Second, the theory of heterogeneous enterprises suggests that firms with different productivity levels tend to locate in areas with varying aggregation costs, resulting in spatial differences in industrial layouts (Melitz, 2003). The CEPI has tightened approval processes for new projects, raising the entry barriers for enterprises. As a result, firms with lower marginal productivity may opt to invest in cities with weaker environmental controls (i.e., cities with lower aggregation costs), while cities with stricter inspections are left with a higher concentration of more productive enterprises through a self-selection process (Jaffe et al., 2003). Third, the CEPI is characterized by stringent penalties and thorough inspections. For enterprises found to be responsible for serious environmental pollution during the inspection period, local governments often implement scale control measures, such as limiting or halting production, or even shutting down non-compliant businesses. These rigorous enforcement actions shape investor outlooks, dissuading them from investing in industries marked by high pollution and high energy consumption. Fourth, CEPI curtails the influx of new enterprises into sectors characterized by elevated pollution and energy use. Nevertheless, given the growing interconnectedness of production processes, the influence on particular industries ripples out to encompass associated upstream and downstream segments within the production network (Acemoglu et al., 2016). By curbing entry into energy - intensive industries, the CEPI also has repercussions on related productive services, including transportation, warehousing, and information transmission, leading to a further decline in the number of firms operating in these areas. From the vantage point of principal - agent theory, the CEPI functions as an efficient supervisory tool that diminishes information asymmetry between the superior and subordinate governments. By reinforcing the central government’s surveillance over local government activities, the CEPI reduces the propensity for local governments to engage in rent - seeking behavior. This process expedites market selection, compelling high - pollution, high - energy - consuming enterprises to leave the market and fostering the entry of more efficient and innovative firms into clean production sectors, ultimately enhancing urban energy utilization efficiency. To recap, this research proposes the subsequent hypothesis to be empirically tested:
Hypothesis 2. Environmental protection supervision enhances energy utilization efficiency by limiting the entry of enterprises with high energy consumption and high pollution levels.
The Central Environmental Protection Inspection (CEPI) mitigates capital misallocation and enhances energy efficiency by promoting the reallocation of financial resources and reducing information asymmetry in credit markets. Capital misallocation fundamentally reflects the inefficient distribution of capital across firms and industries—namely, the failure of capital to flow toward economic entities with higher marginal returns. Such distortions not only constrain aggregate productivity growth but also generate excessive investment in high-pollution, energy-intensive sectors. In contrast, firms characterized by higher energy efficiency and productivity often face resource crowding-out, which limits their expansion and results in greater resource consumption and lower output efficiency per unit of output (Hsieh and Klenow, 2009). In China, local governments frequently prioritize short-term economic growth and employment over environmental protection. High-pollution and energy-intensive enterprises, as major contributors to local GDP, fiscal revenue, and employment, often enjoy implicit protection and preferential treatment from local authorities, including lax environmental enforcement and favorable access to credit. As a result, these firms face lower capital costs, encouraging overinvestment and excess capacity that further exacerbate capital misallocation (Brandt et al., 2012; Chang et al., 2015; Zeng et al., 2023). Through its “supervising government” mechanism, CEPI integrates environmental performance into the evaluation system for local officials, thereby reshaping the growth incentives of local governments. By reducing administrative protection for polluting projects and promoting the reallocation of financial resources, CEPI contributes to a more efficient structure of capital flows. Simultaneously, it strengthens the capacity of financial institutions to assess environmental risks, curbing excessive lending to polluting firms and channeling credit toward environmentally compliant and more productive enterprises. In doing so, CEPI alleviates credit-distortion-induced capital misallocation. Stringent environmental policies also raise compliance costs for polluting firms, discouraging investment by low-efficiency enterprises and slowing their pace of capital renewal (Nelson et al., 1993). By enforcing the principle of “joint accountability of Party and government,” CEPI transmits environmental pressure to both local authorities and enterprises. Local governments must restrict the approval of high-energy projects and reduce credit support and fiscal incentives for polluting industries. Meanwhile, energy-intensive firms, anticipating higher environmental governance costs—such as investments in cleaner technologies and end-of-pipe treatment—tend to curtail capacity expansion and production. As financial institutions and local governments tighten credit supply to high-pollution industries, the relatively fixed pool of credit becomes increasingly available to more energy-efficient sectors, thereby mitigating capital misallocation from the supply side.
CEPI further reduces capital misallocation through its “supervising enterprises” function. In the absence of effective environmental regulation, firms tend to overinvest in tangible assets, such as heavy production equipment, while underinvesting in intangible assets, including energy-saving technologies and digital management systems (Andersen, 2017). CEPI reinforces corporate environmental accountability, compels financial institutions to tighten credit for energy-intensive projects, and—through real-time disclosure of inspection outcomes—encourages green finance and investment to shift toward environmentally responsible firms. This process corrects firms’ imbalance between tangible and intangible asset investments and incentivizes technological and managerial innovations that enhance energy efficiency (Zeng et al., 2021). Furthermore, CEPI enhances environmental information disclosure and risk assessment mechanisms, thereby improving financial institutions’ ability to evaluate credit risk and directing financial resources toward environmentally friendly and high-efficiency enterprises. In this way, it helps correct capital misallocation arising from information asymmetry. Therefore, we propose Hypothesis 3:
Hypothesis 3. The CEPI improves energy utilization efficiency through the reduction of improper capital allocation.
The theoretical framework for the impact of China’s CEPI on EUE is illustrated in Figure 1.
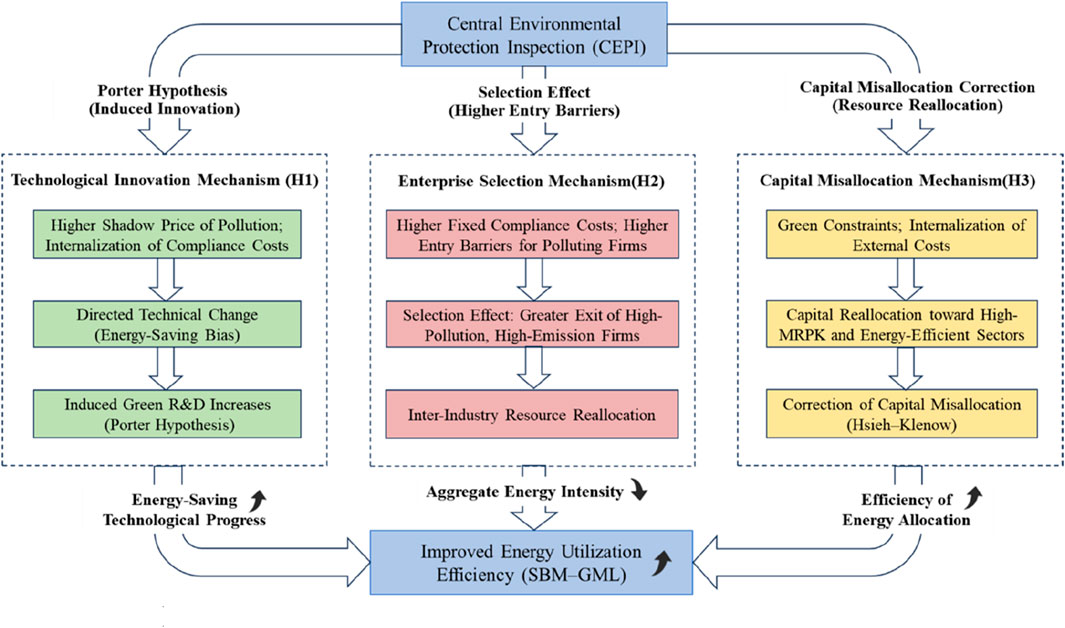
Figure 1. Influence mechanism of CEPI on EUE.
4 Empirical research design
4.1 Model
To explore the fundamental mechanisms and the magnitude of the CEPI’s impact on China’s energy utilization efficiency, this study utilizes data from 283 cities spanning the period from 2007 to 2020. The CEPI was launched in 2016 and has been implemented in multiple phases across 31 provinces, autonomous regions, and municipalities directly under the central government’s jurisdiction. The sample in this research exhibits a broad and seemingly random distribution, which offers suitable experimental and control groups. This characteristic makes the sample highly suitable for the application of a multi-period DID model. Drawing on the methodological frameworks used by Muhammad et al. (2022), the basic regression model is constructed as follows:
Here,
4.2 Variable selection
4.2.1 Dependent variable
Energy Utilization Efficiency (
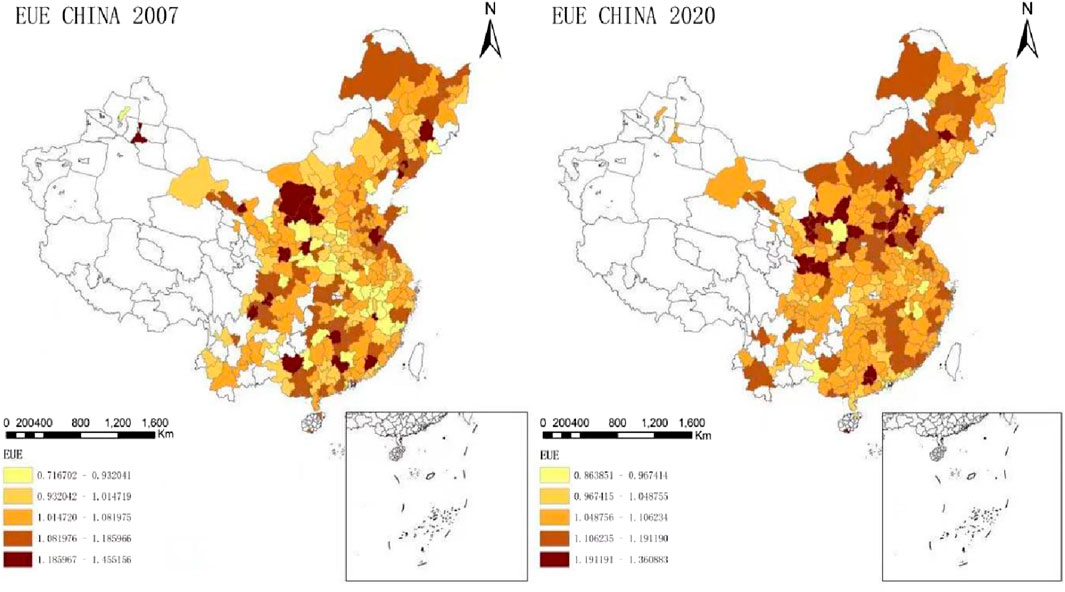
Figure 2. Distribution of EUE in 2007 and 2020.
4.2.2 Core explanatory variables
Central Environmental Protection Inspection (
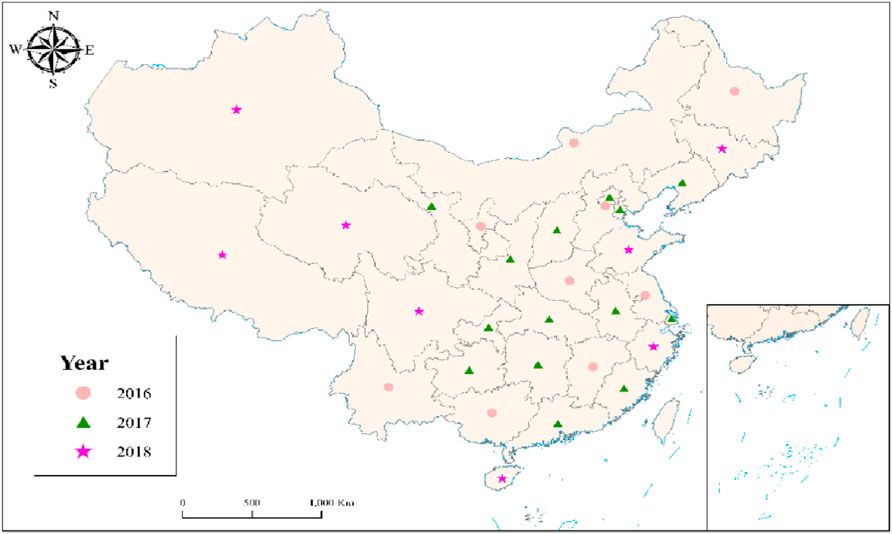
Figure 3. Geographical distribution of CEPI implementation graph.
In defining the treatment year, we classify a city as treated if the Central Environmental Inspection team arrives in the first half of the year (i.e., prior to July 31). Consistent with the timeline definition strategies used by (Wang J. et al., 2023), inspections initiated in the second half of the year are expected to generate a shorter intervention period and thus exert a relatively limited impact on annual energy utilization efficiency. For this reason, if the inspection begins in the second half of the year, the following year is designated as the start of the treatment period. In addition, as part of the robustness analysis, this paper redefines the treatment timing by designating the inspection year as the treatment year for any city that undergoes environmental inspection, regardless of whether the inspection occurs in the first or second half of the year. The main conclusions remain robust under this alternative specification. Moreover, this article regards cities under the jurisdiction of the provinces that underwent the first round of inspections as an experimental group and the control group consists of cities without inspections. In the event that city i undergoes a central environmental inspection in year t, the DID value assigned to city i for year t and subsequent years will be set to one; otherwise, it will be 0.
4.2.3 Control variables
The paper includes the following variables:
Urbanization Rate (urb): This variable is constructed as the ratio of the urban population to the total resident population. High-quality urbanization enhances agglomeration economies, including the sharing, matching, and learning processes, which accelerate the positive spillover of knowledge and technology in urban core areas. This, in turn, strengthens urban innovation capabilities (Duranton and Puga, 2004). At the same time, an increase in the urbanization rate, under the heterogeneity firm hypothesis, can guide high-skilled labor and high-productivity enterprises to migrate to core cities, drive the upgrading of urban industrial structures, and encourage enterprises to adopt cleaner and greener production methods, thereby enhancing the energy utilization efficiency of cities (Melitz, 2003).
Government intervention (gov):This paper measures government intervention by comparing a city’s fiscal expenditures to its gross regional product. Excessive government intervention may prevent markets from reflecting accurate price signals, distorting resource allocation. Furthermore, driven by “policy rents,” the government might crowd out corporate resources for innovation through excessive intervention, thereby reducing energy utilization efficiency (Chen et al., 2023).
Energy Structure (coal): The energy structure is measured by the share of coal in total energy consumption. For decades, China’s energy structure has been heavily reliant on coal, which has led to increased production costs for firms due to the high levels of pollution and fossil fuel consumption associated with coal use. This reliance on coal has contributed to relatively low total factor productivity across the Chinese economy. Transitioning to a more diverse and sustainable energy mix could significantly enhance energy efficiency and foster long-term economic growth in China (Xiong et al., 2019).
Environmental Regulation (env): The measurement of environmental regulation is achieved by calculating the ratio of the number of words concerning environmental protection in government work reports to the overall word count of those reports. Following the research strategy of Li et al. (2020) and Sun et al. (2023), we use the share of environment-related terms in local government work reports to measure the stringency of environmental regulation. The frequency of environmental keywords provides a meaningful proxy for the extent to which local governments prioritize environmental protection, reflecting both their policy attention and resource allocation preferences toward environmental governance2. This measure provides insight into the emphasis placed on environmental issues within governmental agendas and policy frameworks. Environmental regulations have the potential to stimulate firms’ technological innovation in response to more intense market competition, which is conducive to cleaner production and pollution reduction, thereby enhancing energy utilization efficiency (Jaffe and Palmer, 1997). However, following the cost theory, strict environmental regulations can increase firms’ operational costs by internalizing pollution costs, which could encroach on limited corporate resources, thus reducing production efficiency and profits detrimental to improving energy efficiency (Millimet et al., 2009).
Total energy consumption (nerg):Total energy consumption is measured by simulating night-time light data (log-transformed). Controlling total energy consumption and keeping it within a reasonable range can force firms to innovate technologically, raise consumer environmental awareness, and enhance energy utilization efficiency (Çam et al., 2022).
Industrial structure (ind):This particular variable is is measured by the proportion of the secondary industry in GDP. The more developed the urban industry, the stronger the city’s agglomeration economy and the higher the urban economic density. Cities with greater economic density have higher energy supply efficiency, correspondingly lower per capita energy consumption and emission levels, and therefore higher energy utilization efficiency (Glaeser, 2011).
Opening Up to the Outside World (fdi): The level of openness to the external world is measured by the volume of foreign direct investment (FDI) that a region attracts in a given year, and the data are subjected to a log - transformation. The pollution haven hypothesis suggests that FDI might lead to the concentration of energy - intensive and polluting industries in countries with lax environmental regulations, which could then weaken energy efficiency (Mani and Wheeler, 1998). On the contrary, the pollution halo hypothesis argues that FDI has the capacity to enhance energy efficiency. This is because it can promote the transfer of advanced technologies and management practices, thereby generating technological spillovers. The relationship between FDI and energy efficiency is relatively complex and depends on multiple factors (Eskeland and Harrison, 2003).
Economic Development (pgdp): Economic development is evaluated using the per - capita regional gross domestic product (GDP), which also undergoes a log - transformation. Economic development can improve energy utilization efficiency through both technological and structural effects (Grossman and Krueger, 1995). Regarding technological effects, economic development can drive up research and development (R&D) expenditure, stimulate technological progress, and enhance resource utilization efficiency, ultimately leading to a reduction in pollution emissions per unit of output. In terms of structural effects, economic development can facilitate a shift in the industrial structure towards knowledge - intensive and low - pollution tertiary industries, thereby enhancing urban energy utilization efficiency.
4.2.4 Data sources
I. Pilot City Data for Central Environmental Inspection: This set of data was collected manually from the official website of China’s Ministry of Ecology and Environment. It focuses on the cities that were chosen for the central environmental inspection pilot initiative.
II. City Energy Data: The primary source for this data is the China Energy Statistical Yearbook. All energy - related units have been standardized to tons of standard coal. Additionally, nighttime light data, which serves as a supplementary indicator, was obtained from the United States National Oceanic and Atmospheric Administration.
III. City Macroeconomic Data: These data are predominantly drawn from the China City Statistical Yearbook. They provide a comprehensive overview of the macroeconomic conditions of the cities under study.
IV. Newly - Established Enterprise Data at the City - Industry Level: The number of newly - established enterprises in each city and industry was sourced from the full - sample business registration data provided by Qiyan Data. This dataset offers detailed insights into the entrepreneurial activities within different cities and industries.
V. City Innovation Index and Patent Data: The city innovation index was sourced from the China City and Industry Innovation Report. Meanwhile, patent - related data were acquired from the official website of the National Intellectual Property Administration. These datasets play a crucial role in evaluating the innovation prowess of the cities.
VI. A- Share Listed Company Data: Data on A-share listed firms are obtained from the CSMAR database. When there were missing data points, the moving average approach was utilized to fill in the blanks, thereby guaranteeing the integrity and dependability of the dataset.
Table 2 presents descriptive statistics of sample variables.
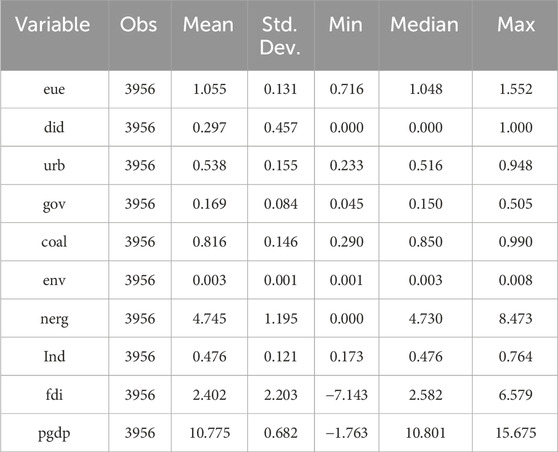
Table 2. Descriptive statistics.
5 Empirical results and analysis
5.1 Benchmark regression results
To clearly illustrate how adding control variables influences the estimated coefficients, we adopt a stepwise estimation approach. Column (1) of Table 3 presents the baseline regression without any control variables. Column (2) introduces controls for government intervention and industrial structure. Column (3) further adds the urbanization rate, and Column (4) augments the specification with controls for energy structure and environmental regulation. Finally, Column (5) reports the full specification, incorporating all control variables simultaneously. The first column of the table reports the fixed-effects regression results without any control variables. The coefficient for the variable did is 0.032 and is statistically significant at the 1% confidence level. As control variables are progressively added in columns (2) to (5), the coefficient of did remains consistently and significantly positive at the 1% level. Column (5) in Table 3 shows the standard regression results of this study. In this case, the coefficient of did is 0.035, indicating that cities that underwent central environmental inspections experienced a 3.5% increase in energy utilization efficiency compared to cities that were not inspected. Razzaq et al. (2023) conducted research with a similar theme. They found that central environmental inspections could reduce carbon emission intensity by improving energy efficiency and raising the environmental awareness of local governments. Their results showed that these inspections could lead to a 2.8% improvement in energy efficiency in pilot cities. In contrast, this paper demonstrates a 3.5% improvement in energy efficiency for the pilot cities. Furthermore, after conducting a series of robustness checks, the results of this paper remain consistent and reliable.
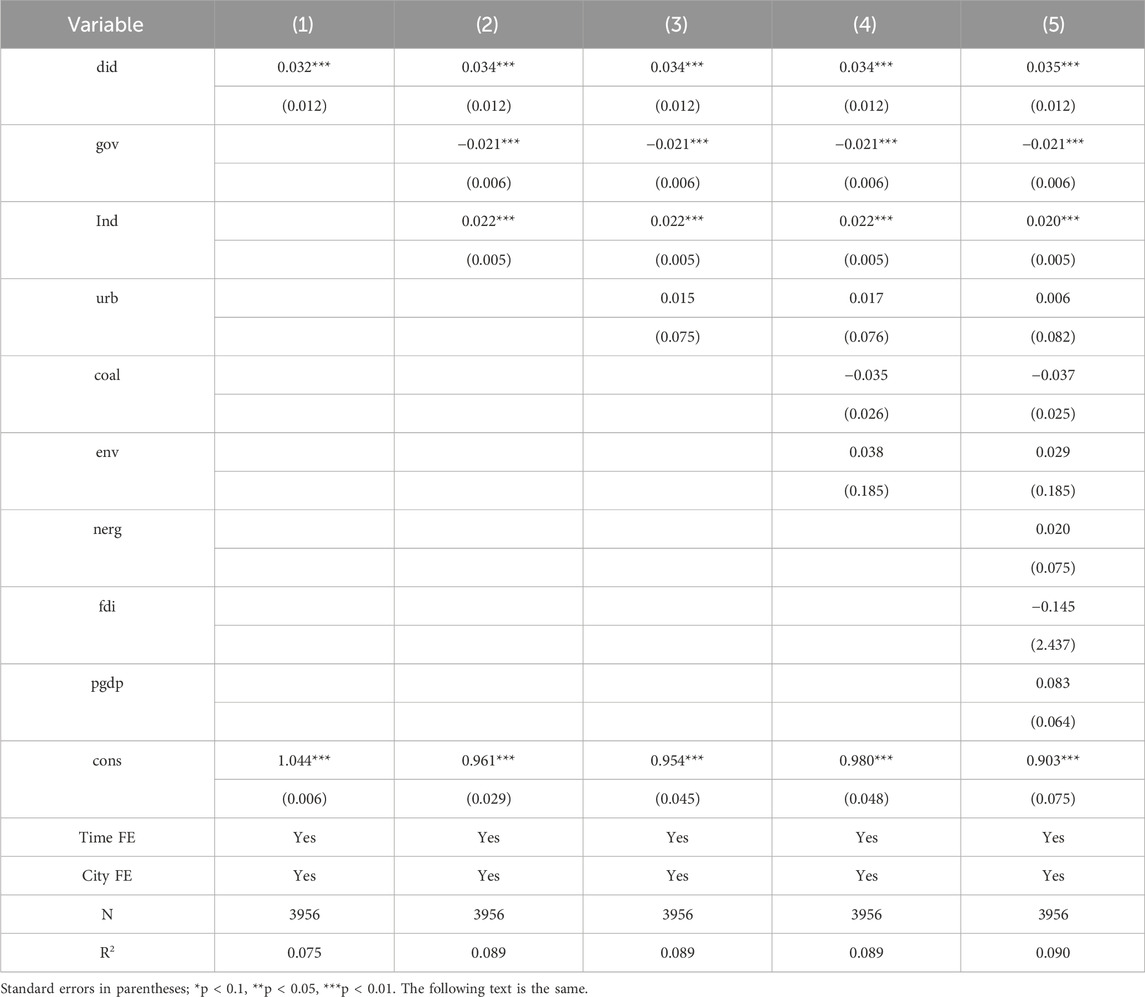
Table 3. The Baseline results.
A review of the control variables in column (5) of Table 3 reveals that government intervention (gov) has a negative effect on energy utilization efficiency. This suggests that excessive regulation may result in resource allocation distortions and a subsequent decline in overall efficiency (Hsieh and Klenow, 2009). Conversely, the industrial structure (ind) positively influences energy utilization efficiency, positing that developed secondary industries in cities can foster economic agglomeration, leading to energy conservation and emission reduction (Glaeser, 2011). While other control variables may not demonstrate significance, they align with the stipulated theoretical expectations.
5.2 Robust test
5.2.1 Parallel trend test
The DID methodology is based on the parallel trends hypothesis. This hypothesis posits that, in the absence of the treatment, the experimental group and the control group would have demonstrated similar trends over time. As recommended by Beck et al. (2010), event analysis and a regression model are commonly employed to assess the validity of this hypothesis. This paper constructs Equation 2 as follows:
To clarify, the
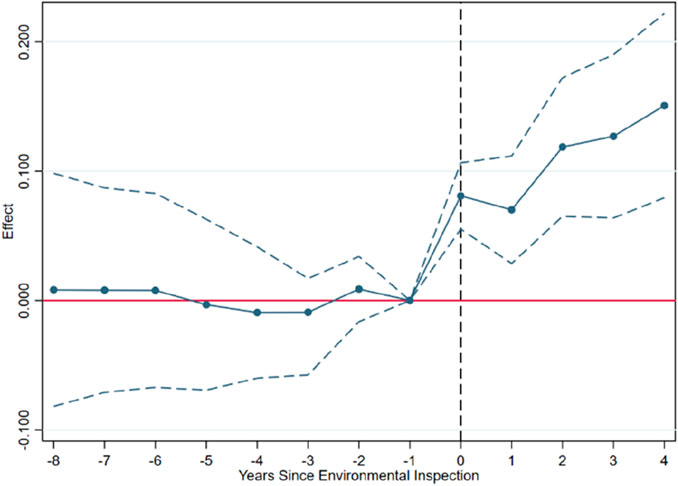
Figure 4. Parallel trend graph.
Recent studies suggest that standard pre-treatment trend tests provide limited empirical validation of the parallel trends assumption. Such tests often exhibit low statistical power and may generate biased estimates (Rambachan and Roth, 2023). To overcome these limitations, they develop a sensitivity analysis framework that evaluates the robustness of post-treatment estimates when the parallel trends assumption may be violated. Their approach involves two key steps: first, quantifying the maximum permissible deviation from parallel trends, denoted as Mbar; and second, constructing confidence intervals for post-treatment estimates that are valid under such deviations. Following this framework, we set the maximum deviation threshold to Mbar = 1 × standard error to examine the sensitivity of the estimated treatment effects of the CEPI policy. As illustrated in Figure 5, the confidence intervals for the post-treatment estimates do not include zero, even under this relaxed assumption. This finding implies that the results are robust.
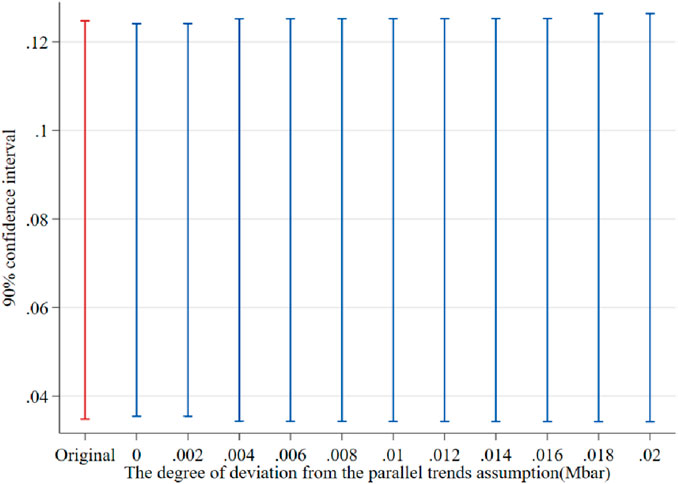
Figure 5. The Rambachan and Roth (2023) sensitivity test for the parallel trends assumption.
5.2.2 Replace the dependent and independent variables
The Epsilon-Based Measure–Global Malmquist–Luenberger (EBM–GML) index enhances efficiency estimation by combining the advantages of radial and non-radial approaches, accommodating undesirable outputs, and ensuring intertemporal comparability. It performs well under sample heterogeneity and outliers, serving as a useful complement to the SBM–GML index (Wang et al., 2019). Given its reliance on subjective parameters and complex interpretation, the EBM–GML index is employed here as a robustness check to validate the baseline estimates of energy efficiency. We adopted the methodology suggested by Tone and Tsutsui (2009) and applied the mixed - distance, non - oriented EBM - GML approach to re - compute the energy efficiency of various cities. The definitions of input, expected output, and unexpected output variables remain consistent with those in the baseline model. As shown in column (1) of Table 4, both the magnitude and significance of the did coefficient are virtually unchanged from the baseline results.
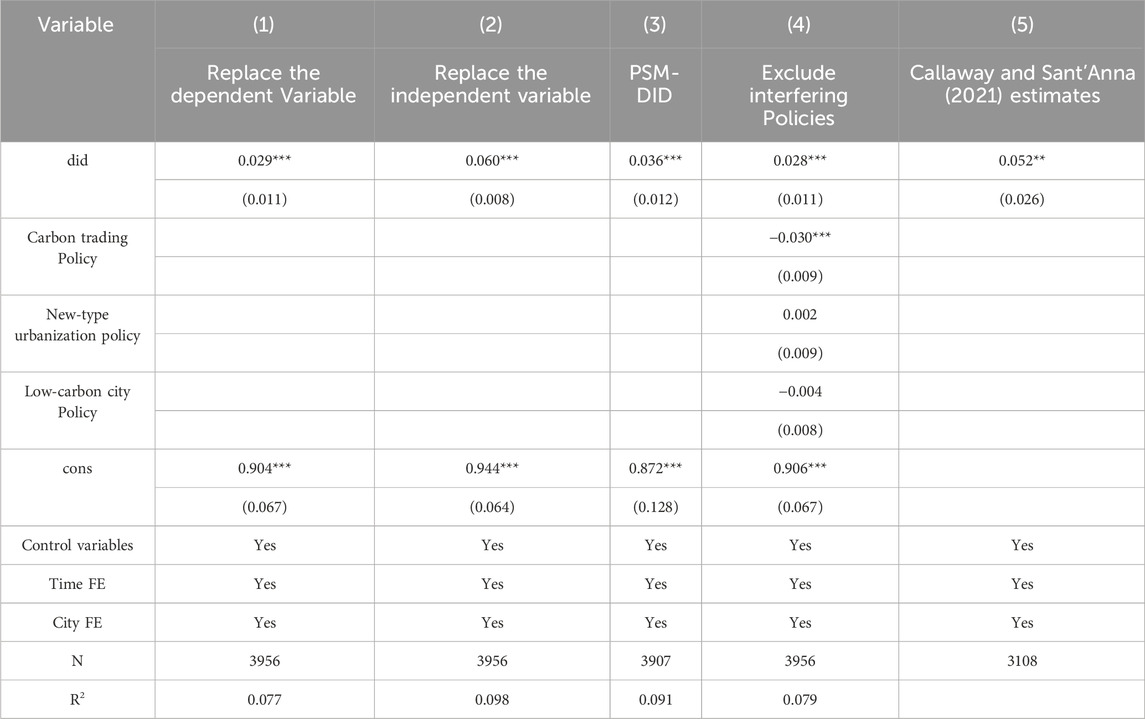
Table 4. Robustness check.
In addition, given the deterrence effect of the Central Environmental Inspection, some provinces may anticipate the arrival of the inspection team and undertake proactive environmental governance measures in advance. To account for this behavioral response, we redefine the treatment year such that a city is classified as treated in the year the inspection team arrives, irrespective of whether the entry occurs in the first or second half of the year. Based on this revised policy timing, we reconstruct the core explanatory variable and re-estimate Equation 1. As shown in Column (2) of Table 4, the coefficient on the core explanatory variable remains positive and statistically significant at the 1 percent level. This finding confirms that the estimated positive effect of the Central Environmental Inspection on energy efficiency is robust to alternative definitions of the treatment period.
5.2.3 PSM-DID
To mitigate potential sample selection bias and improve the precision of the DID estimates, we apply a propensity score matching (PSM) approach. Environmental regulation intensity, GDP, urbanization rate, and per capita GDP are used as matching covariates. Using the nearest-neighbor (1:2) algorithm, each treated city is matched with two control cities. Figure 6 illustrates the density distributions of propensity scores before and after matching. After matching, the distributions of the treated and control groups align closely, indicating effective matching and balance. Based on the matched sample, we re-estimate the DID model to assess the impact of CEPI. As shown in column (3) of Table 4, the coefficient on the did variable remains significantly positive.
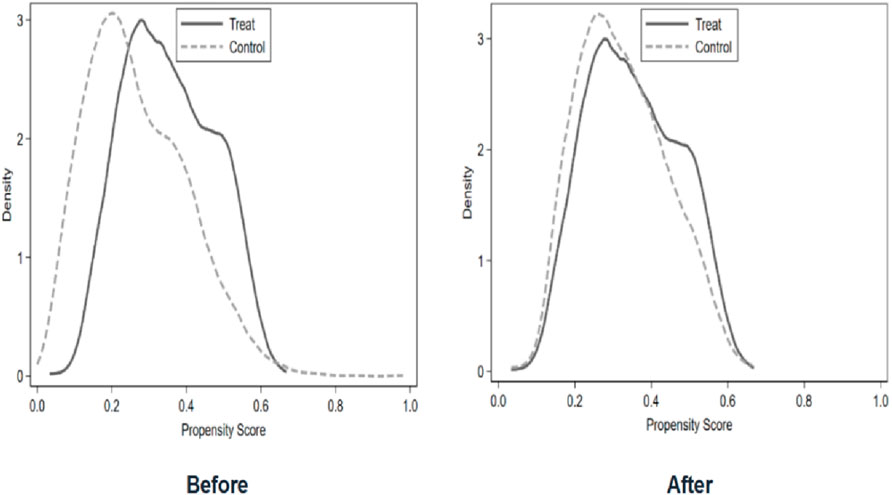
Figure 6. Propensity score value probability distribution density function graph.
5.2.4 Exclude interfering policies
The estimation results presented in this study might be affected by other environmental policies that were put into place during the same period. In particular, China’s National Development and Reform Commission launched the low - carbon city initiative in 2010, 2012, and 2017. The main goal of this program was to encourage the development of eco - friendly and low - carbon urban areas. Additionally, starting from 2013, the Chinese government implemented a range of carbon emissions trading policies in several cities, namely, Shenzhen, Shanghai, Beijing, Guangdong, Hubei, Tianjin, Chongqing, and Fujian. These policies were designed to expedite the adoption of environmentally friendly and energy - efficient technologies in urban regions. Additionally, in 2015, the State Council introduced the “National New Urbanization Integrated Pilot Program,” which sets forth resource - saving and environmentally friendly requirements for new urbanization. This program could also potentially impact energy utilization efficiency. To account for the possible effects of these concurrent policies, we incorporate three crucial policy dummy variables into the benchmark regression: the carbon emissions trading pilot, the new urbanization pilot, and the low - carbon city pilot. This enables us to control for the influence of these policies on the results. The estimation results are presented in column (4) of Table 4; the conclusions of this study are robust.
5.2.5 Instrumental variable method
To address potential endogeneity, we employ an IV strategy. Drawing on the approach of Moser and Voena (2012), we use the lagged number of days with severe air pollution in a city as an instrument for the central environmental inspection policy. A valid instrument must satisfy both the relevance and exclusion restrictions. In our context, local air pollution is closely tied to the stringency of local environmental governance: cities experiencing more polluted days are substantially more likely to be targeted by CEPI. This institutional feature ensures a strong first-stage relationship between the instrument and the endogenous policy variable. Given concerns over finite-sample bias and weak instruments, we implement the Limited Information Maximum Likelihood (LIML) estimator, which performs well under homogeneous treatment effects. The estimation yields a Kleibergen–Paap F-statistic of 29.76, far exceeding the conventional threshold of 10 and rejecting the null of weak instruments. In addition, the Kleibergen–Paap LM statistic is 23.17, allowing us to reject the null of underidentification at the 1% level. These diagnostics confirm the strength and relevance of the instrument. The exclusion restriction is plausibly satisfied: under the precisely identified specification, improvements in urban energy efficiency are primarily driven by technological upgrading and industrial restructuring, which lagged air pollution counts do not directly influence. Hence, the instrument is unlikely to affect the outcome variable except through the CEPI policy. As shown in the first panel of Figure 7, the estimated coefficient on CEPI is 0.169 and statistically significant, indicating that CEPI robustly improves urban energy efficiency after accounting for potential endogeneity. To further mitigate concerns about finite-sample bias, we additionally employ the Jackknife Instrumental Variables Estimator (JIVE). As shown in the second panel of Figure 7, the estimated coefficient remains significantly positive.
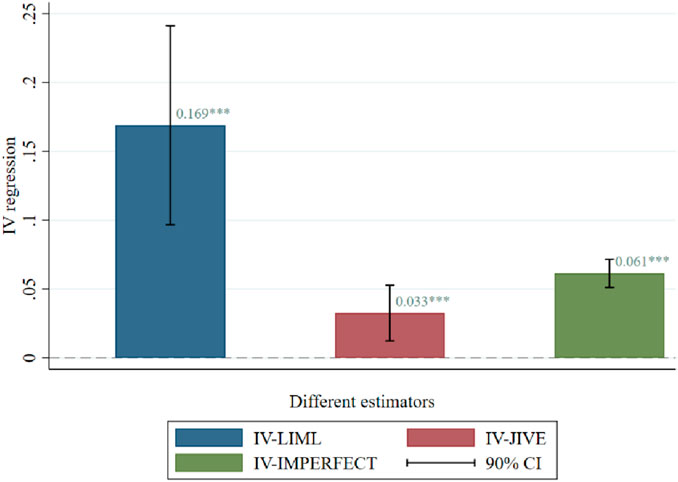
Figure 7. Instrumental variables regression.
As a further robustness check, we implement the recently developed imperfect instrumental variables (imperfect IV) approach. This method relaxes the conventional assumption of strict exogeneity by replacing it with two weaker and more plausible conditions. First, the instrument must be correlated with the structural error term in the same direction as the endogenous regressor. Second, the correlation between the instrument and the error term, denoted
5.2.6 Placebo test
This study performs a placebo test through the random generation of “pseudo” policy implementation years to control for the effects of omitted variables and random factors. Given that the “pseudo” policy timing is assigned randomly, the CEPI is expected to exhibit no significant influence on energy utilization efficiency. Consequently, the regression coefficient for the “pseudo” policy variable should be close to zero. To test this, the paper repeats random sampling and regression 500 times, generating a kernel density plot of the estimated coefficients for the “pseudo” policy variable. As shown in Figure 8, the estimated coefficients for the fictitious CEPI policy cluster near zero, with the baseline regression result (0.035) falling outside the entire distribution. The results indicate that the impact exerted by the CEPI on energy utilization efficiency is not a haphazard event. This, in turn, provides strong evidence to substantiate the reliability and robustness of the conclusions drawn in this paper.
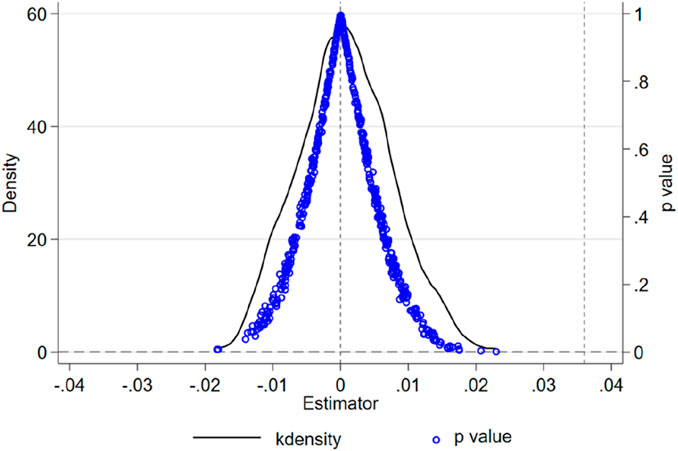
Figure 8. Placebo test graph.
5.2.7 Analysis of heterogeneity treatment effects
Variations in the exposure duration and initiation time of policy intervention among cities can lead to policy treatment effect heterogeneity. Due to treatment effect heterogeneity, traditional two-way fixed effects model results may not provide a valid estimation. Aiming to mitigate this bias, we utilize the heterogeneity-robust estimator formulated by Callaway and Sant’Anna (2021). This method classifies individuals who experienced changes in treatment status before and after policy enactment as the treatment group, whereas individuals who remain untreated or are awaiting treatment serve as controls. Average treatment effects (ATT) are calculated for each grouped interval and subsequently weighted to derive an average effect. Column (5) of Table 4 showcases that applying the Callaway and SantAnna estimator results in an estimated average treatment effect of 0.052, which is statistically significant at a 5% level. Additionally, we devised event paper graphs in Figure 9, illustrating that, despite treatment effect heterogeneity, pre-policy intervention trend consistency is maintained between cities in the experimental and treatment groups. This design still satisfies the hypothesis of parallel trends. Thus, our key findings remain consistent irrespective of treatment effect heterogeneity, bolstering the robustness of our benchmark regressions.
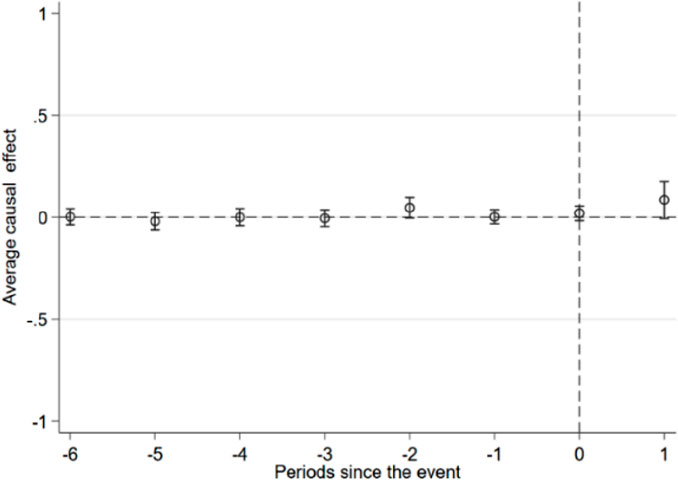
Figure 9. Heterogeneity estimation effect.
6 Further analysis
6.1 Mechanism results and discussion
This paper demonstrates that central environmental inspections improve energy utilization efficiency via multiple pathways, such as enhancing urban innovation capacity, restricting the entry of high-pollution and high-energy-consuming enterprises, and reducing capital misallocation. Following the methodology proposed by Dell (2010), the empirical model in this paper is specified as shown in Equation 3:
In this model,
Central environmental inspections are of vital importance in bolstering a city’s capacity for innovation, and this, consequently, leads to an improvement in energy utilization efficiency. To evaluate a city’s innovative potential, this paper makes use of the city innovation index from the “China City and Industry Innovation Report,” which is compiled by the Industry Development Research Center at Fudan University. The findings displayed in column (1) of Table 5 indicate that central environmental inspections have a positive and statistically significant impact on a city’s innovation capabilities. Since central environmental inspections mainly target the manufacturing sector and its associated service industries, we delve deeper into their influence on the innovation capacities of specific sectors. The industry - level innovation data, also obtained from the “China City and Industry Innovation Report,” demonstrates in columns (2) to (5) of Table 5 that central environmental inspections significantly enhance the innovation capabilities of the electric power, information, manufacturing, and mining sectors. These results offer additional evidence in support of the “Porter Hypothesis,” which posits that moderate environmental regulation can stimulate innovation within firms. The relatively low R2 values reported in Columns (2)–(4) of Table 5 are both reasonable and expected. This outcome primarily reflects the fact that the effects of the CEPI on industry-level innovation are not immediate but rather materialize gradually through medium- and long-term mechanisms, including industrial upgrading, technological advancement, and institutional adaptation. By contrast, the short-term control variables included in the specification are unlikely to fully capture these complex and dynamic channels, thereby constraining the model’s explanatory power. Furthermore, the magnitude of R2 does not inherently determine the validity of causal inference or the reliability of the model (Angrist and Pischke, 2010). After accounting for the relevant covariates and fixed effects, the estimated coefficient on the treatment variable (did) remains statistically significant and consistent with theoretical expectations, underscoring the robustness of CEPI’s impact on industrial innovation. Consequently, a relatively low R2 should not be interpreted as evidence against the validity of the findings; rather, it reflects the policy’s inherently gradual and multi-channel transmission process.
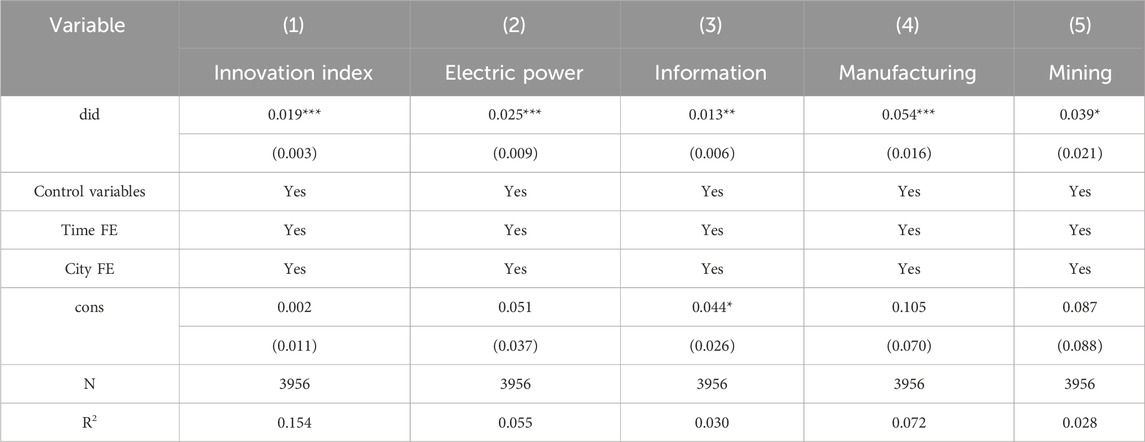
Table 5. Mechanisms for enhancing urban innovation capacity.
The central environmental inspections make it more difficult for high-energy-consuming and polluting industries to enter, reducing the number of enterprises and improving energy efficiency. The impact of central environmental inspections on firm entry is examined using business registration data. Firstly, we identified the industries of registered enterprises based on the 90 two-digit industries in the “2017 National Economic Industry Classification (GB/T4754-2017)”4 and compiled the number of new companies established from 2007 to 2020 at the city–industry level. Since power, manufacturing, and mining industries are typically highly polluting and high-energy consuming, central environmental inspection adopts strict regulatory measures for these industries, thereby significantly suppressing the entry of enterprises into these industries. Accordingly, the results in columns (1) to (3) of Table 6 show that central environmental inspection has significantly reduced the number of newly established enterprises in the power, manufacturing, and mining industries5. Moreover, the entry of the information industry, which is a supporting production service industry that is influenced by upstream and downstream supply chain demand entry, was also indirectly suppressed. As shown in column (4) of Table 6, the environmental inspection has reduced the number of new entries in the information industry.
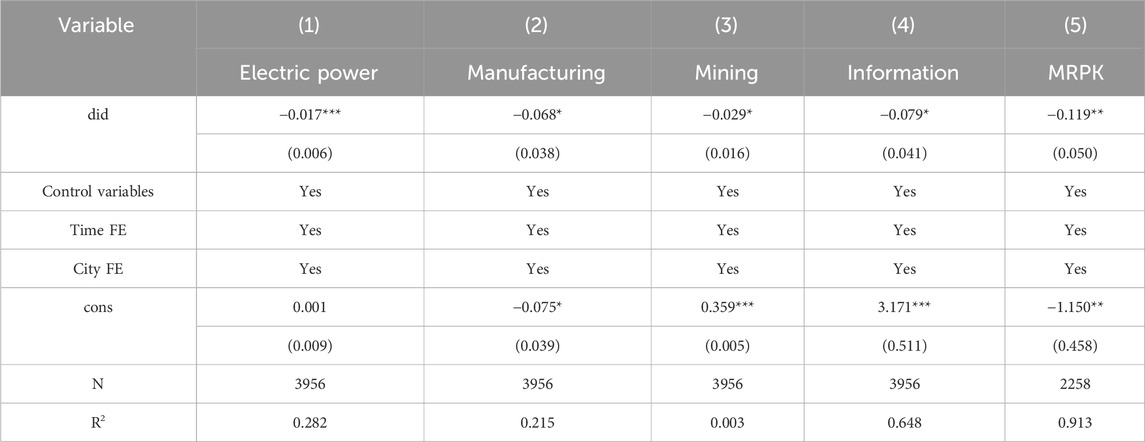
Table 6. Mechanisms for reducing enterprise entry and reducing capital misallocation.
Third, central environmental inspections drive capital reallocation from high-pollution, high-energy-consuming, low-productivity industries to clean, eco-friendly, high-productivity sectors. This process mitigates capital misallocation, thereby enhancing energy utilization efficiency. By raising entry and survival barriers for high-pollution and high-energy-consuming enterprises, and influencing corporate investment expectations through measures like enterprise-government supervision, central inspections curb overinvestment and overcapacity in targeted industries. Simultaneously, central environmental inspection provides developmental opportunities for clean, environmentally friendly, high-productivity industries, directing capital towards related industries, thereby preventing capital misallocation. Hsieh and Klenow (2009) demonstrate that the marginal revenue product of capital (MRPK) is positively correlated with capital misallocation. In this paper, we use the standard deviation of MRPK as a measure of capital allocation efficiency. The reduction in MRPK dispersion indicates an improvement in capital allocation efficiency, leading to a decrease in capital misallocation.
This paper calculates the standard deviation of MRPK for each city’s A-share listed companies using data from 2007 to 2020, aggregates the data at the city level, defining it as city capital misallocation. The results in column (5) of Table 6 show that at a 5% confidence level, central environmental inspection prevents city capital misallocation. The did estimate coefficient shows an average reduction of 11.9% in capital misallocation in inspected cities compared to uninspected cities.
6.2 Heterogeneity results and discussion
6.2.1 Resource-based and non-resource-based heterogeneity
Energy utilization efficiency varies significantly according to a city’s resource endowment. Historically, resource-dependent cities have relied on abundant natural resources to drive economic growth. However, central environmental inspections have inevitably disrupted this model of extensive economic development. In this study, we use the National Plan for Sustainable Development of Resource-dependent Cities to classify 283 prefecture-level cities into 115 resource-based cities and 168 non-resource-based cities. The results of the grouped regression are presented in columns (1) and (2) of Table 7. Both resource-based and non-resource-based cities showed improvements in energy efficiency following central environmental inspections. Notably, the regression coefficient for resource-based cities is significantly larger, indicating a more substantial policy effect in these urban areas. This outcome is likely due to the prevalence of high-energy-consuming, high-pollution, and high-emission industries in resource-based cities. Given the heavy reliance of local economies on natural resources, local governments have historically tended to adopt lenient environmental regulations and weak supervision. Yet, with the continuous progress of central environmental inspections, environmental supervision has been steadily reinforced. Local governments have been strongly motivated to actively engage in environmental governance. The inspection measures have compelled local governments to modify their economic development models, prompting enterprises in resource - based cities to focus on energy conservation and increase their investment in energy technology research. Consequently, this has effectively improved the energy utilization efficiency of cities.
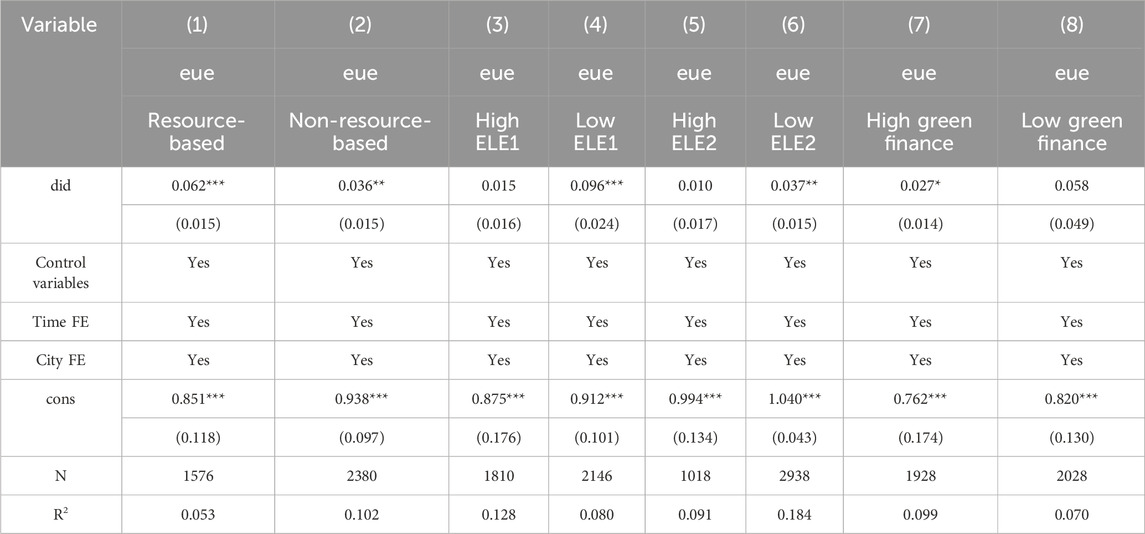
Table 7. Heterogeneity analysis.
6.2.2 Heterogeneity in environmental law enforcement intensity
Different cities have varying degrees of environmental law enforcement intensity. Our studies measure the intensity of regional environmental law enforcement based on the average pollution charge paid by enterprises across different regions in China. We use the average pollution charge paid by enterprises in different regions from 2007 to 2020 to categorize our sample: cities with pollution fees above the average are classified as having high environmental law enforcement intensity (High Environmental Law Enforcement, hereafter High ELE1), whereas those with fees below the average are classified as having low environmental law enforcement intensity (Low Environmental Law Enforcement, hereafter Low ELE1). Columns (3) and (4) of Table 7 reveal a pronounced improvement in energy efficiency due to central environmental inspections in cities with low law enforcement intensity. To ensure robustness, we employ the number of environmental enforcement cases as an exogenous grouping variable, as it is unlikely to exhibit bidirectional causality with urban energy utilization efficiency6. We measure the intensity of environmental law enforcement using the average number of environmental penalty cases in each city over the period from 2007 to 2020. Cities with values above the sample mean are classified as having high environmental law enforcement intensity (High Environmental Law Enforcement, hereafter referred to as High ELE2). In contrast, those with values below the mean are classified as having low environmental law enforcement intensity (Low Environmental Law Enforcement, hereafter referred to as Low ELE2). As shown in Columns (5) and (6) of Table 7, the energy efficiency gains induced by the Central Environmental Inspection are significantly larger in cities with lower levels of environmental law enforcement intensity (Low ELE2). This outcome has occurred because in regions with low levels of environmental regulation, it is easy to address environmental problems through “campaign-style” and “case-by-case” management methods in traditional governance. Central environmental inspections can effectively enhance the environmental governance abilities of governments in regions with low environmental enforcement intensity, diminishing the potential for government–business collusion through measures such as “party-and-government responsibility” and “supervising government and businesses.” These inspections encourage businesses to adjust their energy structures and curb “formalistic, one-size-fits-all” approaches in local government environmental management, thereby improving urban energy utilization efficiency. However, the compliance cost theory of environmental regulation suggests that excessive environmental regulation elevates production and operation costs for enterprises, crowds out resources for innovation, and hinders corporate innovation, which is unfavorable for improving energy utilization efficiency. In the first round of central environmental inspections, some local governments in China adopted a “one-size-fits-all” approach to limit production or halt operations among polluting businesses in their jurisdictions, which noticeably impacted manufacturing in third- and fourth-tier cities. Therefore, central environmental inspections may further intensify environmental regulation in cities with high law enforcement intensity, potentially surpassing a reasonable threshold and stymieing local innovation and exacerbating capital misallocation, consequently impeding improvements to energy utilization efficiency.
6.2.3 Heterogeneity in green finance
Green finance refers to financial activities and instruments that support environmental protection, energy conservation, clean energy, and related sectors, encompassing financing, project implementation, and risk management. Differences in the development of green finance may influence the effectiveness of the CEPI in improving energy efficiency. To examine this relationship, cities are classified based on their average green finance development index from 2007 to 2020. The Green Finance Development Index is constructed using the methodology outlined by Zhou et al. (2020). Three indicators are selected: the share of green credit balance, the scale of green bond issuance, and the amount of direct financing by environmental protection enterprises. A comprehensive index is then synthesized using the entropy method7. Cities with values exceeding the average are designated as high-green finance cities, whereas those below the average are classified as low-green finance cities. The findings, as shown in columns (7) and (8) of Table 7, reveal that the influence of central environmental inspections on energy efficiency is especially significant in regions with a well - established green finance system. The underlying reasons for this phenomenon are as follows: Firstly, regions with a high level of green finance development can provide effective green credit support, which is beneficial for capital accumulation. Central environmental inspections heighten the demand for the growth of green industries. Efficient green credit can lower the financing costs for enterprises focused on clean environments, enhance the efficiency of enterprise capital allocation, and subsequently boost productivity. Secondly, regions with extensive green finance can offer robust support for technological innovation across various enterprises through a comprehensive framework, thereby improving energy utilization efficiency (Flammer, 2021). Central environmental inspections reduce the entry barriers for enterprises into the clean energy and other related industries. Regions with substantial green finance can encourage enterprise innovation through efficient tax refunds and R&D subsidies, thereby enhancing energy utilization efficiency. Thirdly, regions with a strong green finance foundation can safeguard enterprise innovation through green insurance. Central environmental inspections drive local energy structure adjustments through strengthened supervision, enabling some firms to enter the energy sector. However, the energy industry is characterized by heavy investment, long investment cycles, and relatively low returns. Areas with advanced green finance can implement tailored green insurance mechanisms, mitigating the risks associated with technological progress and innovation, encouraging enterprises to innovate, and facilitating the entry of potential businesses into the clean energy industry. Therefore, the positive impact of central environmental inspections on energy enhancement is evident in cities with significant green finance development.
6.3 Spatial spillover effect analysis
When central environmental protection inspection teams were deployed in particular cities, they had the option to carry out unannounced, on - the - spot checks in nearby non - inspected cities. As a result, cities adjacent to those under inspection would also place greater emphasis on environmental management and energy utilization. Furthermore, the proactive collaboration of pilot cities with the inspections could enhance the political standing of local officials, potentially leading to their promotions. Additionally, these cities could serve as exemplary models for other regions in their efforts to implement environmental governance and adjust their energy structures. Consequently, central environmental protection inspections may generate a spatial spillover effect, contributing to the improvement of energy utilization efficiency.
The conventional DID approach is predicated on the SUTVA, which assumes the non - existence of spatial spillover effects. To overcome this limitation and as a complement to the standard double - difference method, this paper utilizes the SDID approach. Drawing on the spatial Durbin model, this paper examines the spillover impacts of central environmental inspections on energy efficiency. The detailed model specification is presented in Equation 4:
where
where
Columns (1) and (2) of Table 8 present the results on spatial spillover effects. The analysis of spatial spillover effects reveals that the “did “ coefficient is significantly positive, while the “Wdid” term is not significant. This suggests that central environmental supervision has a positive impact on energy efficiency within the city under direct observation, but there is no significant spillover effect on neighboring cities, as represented by the city adjacency matrix. This finding offers empirical support for the “pollution haven hypothesis.” The Central Environmental Inspection intensifies environmental regulatory pressure in inspected cities, thereby raising firms’ compliance costs and tightening production constraints related to emissions control, energy use, and technological upgrading. In the short run, higher regulatory costs alter firms’ marginal production costs, with energy-intensive industries particularly affected due to their heightened sensitivity to environmental constraints. When regulatory costs exceed a critical threshold, firms have greater incentives to relocate to jurisdictions with less stringent environmental standards and lower compliance costs (Yuan et al., 2022). Such relocation generates substantial externalities. On one hand, energy utilization efficiency improves within the inspected cities; however, industrial outflows create regulatory “havens” in neighboring regions, thereby weakening the effectiveness of cross-jurisdictional policy coordination. On the other hand, the agglomeration of energy-intensive firms may intensify energy consumption and pollution emissions in these recipient areas, ultimately reducing their energy utilization efficiency. This mechanism is consistent with the central prediction of the pollution haven hypothesis and underscores the spatial heterogeneity and negative externalities inherent in environmental regulation policies (Cai et al., 2016).
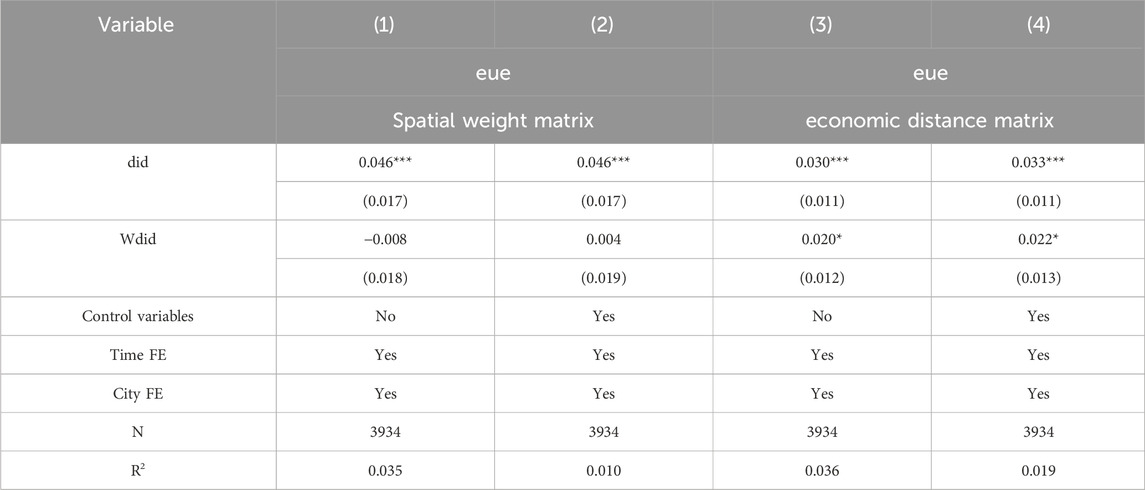
Table 8. Spatial spillover effect analysis.
Table 8, columns (3) and (4), present the spatial spillover effects based on the economic distance matrix, both with and without control variables. The did coefficient is significantly positive, and the interaction term “Wdid” is also significantly positive. This indicates that central environmental supervision not only improves energy efficiency in the city under direct supervision but also has a positive spatial spillover effect on neighboring cities. This pattern arises because cities in close economic proximity typically exhibit similar industrial structures, development models, and factor endowments. Their policy environments and development trajectories are thus more comparable and transferable, increasing the likelihood of cross-regional spillovers. When the Central Environmental Inspection induces cities to adjust their industrial policies and development strategies, these changes diffuse beyond local jurisdictions through multiple economic channels (Kopyrina et al., 2023). On the one hand, industrial linkages and value chain connections transmit shifts in technological standards, production structures, and governance models across upstream and downstream sectors, creating both external pressures and incentives for economically connected cities. On the other hand, factor mobility and capital market integration allow firms to reallocate investment, innovation activities, and production factors to neighboring cities with similar development conditions, thereby amplifying the spillover effects. In response, economically linked non-inspected cities often engage in policy learning and imitation in their industrial planning, technological pathways, and development strategies to minimize information and adjustment costs. This endogenous process of learning and coordination fosters deeper regional industrial collaboration, accelerating the diffusion of innovation and facilitating the spillover of green technologies and clean production practices. Ultimately, these dynamics contribute to faster energy structure optimization and technological advancement in non-inspected cities, thereby enhancing overall energy utilization efficiency. Furthermore, the results in Table 8 (3) (4) show that the impact of the spatial spillover effect is smaller compared to direct effects, indicating that the spillover effect will not cause excessive bias in the results estimated in this article.
6.4 Further analysis using double machine learning
This paper provides evidence that China’s Central Environmental Protection Inspection (CEPI) significantly enhance urban energy efficiency. A natural follow-up question is whether CEPI also generate broader, unintended policy spillovers. Specifically, given CEPI’s dual nature as both a disciplinary and incentive-compatible regulatory mechanism, do these inspections foster a more inclusive pattern of green growth? To address this question, we follow the approach of Zhang and Li (2023) and construct a composite index of inclusive green growth (IGG) that captures its multi-dimensional nature. The index integrates four key dimensions: economic growth (E.G.,), income distribution (ID), welfare benefits (WB), and pollution reduction (PR). This comprehensive framework allows us to evaluate how CEPI affect not only environmental outcomes but also equity and wellbeing at the city level.
To mitigate potential biases in model estimation and to address the high-dimensional nature of confounding variables, we adopt the Double Machine Learning approach (Chernozhukov et al., 2018). This method flexibly captures nonlinear relationships among covariates and, by leveraging orthogonalisation, ensures consistent estimation of the causal treatment effect even in the presence of complex confounders. The partially linear DML model used in this analysis is formally specified as follows:
In Equation 6, the dependent variable
Table 9 reports the estimated effects of the Central Environmental Protection Inspection (CEPI) on cities’ inclusive green growth using a Double Machine Learning (DML) framework. To test robustness, we employ several supervised learning algorithms—Lasso, Elastic Net, Support Vector Regression, and Ridge Regression—to flexibly capture high-dimensional controls and nonlinearities. Columns (1)–(4) present results under each specification. Across all models, the estimated treatment effect of CEPI on inclusive green growth remains positive and significant at the 1 percent level. These results suggest that, beyond its regulatory purpose, CEPI yields broader benefits by simultaneously advancing economic growth, environmental quality, and social equity, thereby serving as a policy instrument that integrates economic, social, and ecological objectives.
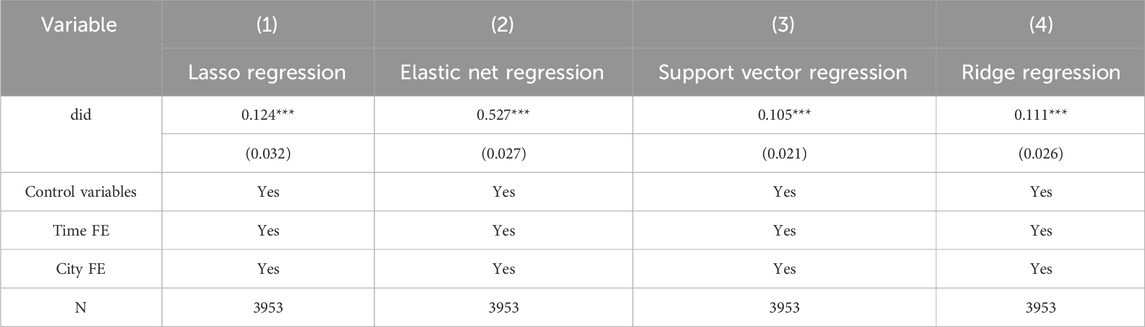
Table 9. Double machine learning regression.
The DML framework employs a suite of machine learning algorithms with regularization techniques to automatically select relevant covariates from a high-dimensional set of controls. This approach mitigates the “curse of dimensionality” arising from redundant controls while reducing estimation bias caused by omitted variables. Unlike conventional linear regression, which often yields unstable estimates in empirical settings, DML exploits the flexibility of machine learning to capture nonlinearities, thereby limiting model misspecification and improving the robustness of causal inference. This study applies the DML framework to evaluate the impact of the CEPI policy on inclusive green growth at the city level. By integrating DML with difference-in-differences and instrumental variable strategies, the analysis provides credible evidence that CEPI significantly enhances both urban energy utilization efficiency and inclusive green growth. These findings offer important policy implications for China and other developing economies aiming to improve energy efficiency and advance sustainable urban development.
7 Research conclusion and policy implications
7.1 Research conclusion
The Central Environmental Protection Inspection (CEPI), a pivotal program launched by the Chinese government, is designed to bolster environmental governance and facilitate economic restructuring. This paper assesses the influence of CEPI on energy utilization efficiency (EUE) by analyzing data from 283 cities spanning the period from 2007 to 2020. Utilizing a DID framework and the SBM - GML approach, our findings indicate that CEPI has a substantial positive impact on EUE. The results remain consistent and reliable after undergoing parallel trend tests, the exclusion of potentially confounding policies, placebo checks, instrumental variable estimation, and heterogeneous treatment analyses. An in - depth mechanism analysis reveals that CEPI enhances EUE through several channels. It encourages urban innovation, discourages the entry of firms with high levels of pollution and energy consumption, and corrects capital misallocation. The effect is more pronounced in resource - dependent cities, regions with initially lax environmental enforcement, and areas with a vibrant green finance sector. Furthermore, CEPI generates positive spillover effects in cities that are economically interconnected, although no such spillovers are observed in geographically proximate cities.
7.2 Policy advice
This study proposes three policy recommendations to strengthen the effectiveness of the Central Environmental Protection Inspection (CEPI) in China. First, CEPI should adopt more flexible and adaptive strategies across cities with different resource endowments. In resource-based cities, it should emphasize “constraint + transition” by tightening accountability and regulatory enforcement, prioritizing oversight of high-emission sectors, and aligning inspections with industrial restructuring and energy control objectives. This would facilitate the phased exit or upgrading of energy-intensive industries and foster a long-term mechanism for improving energy efficiency. In non-resource-based cities, CEPI should focus on “incentive + innovation,” linking environmental inspections with technological and financial incentives to encourage green upgrading through tools such as green credit, subsidies, and tax relief. Second, better coordination between CEPI and environmental law enforcement can improve policy targeting. Since CEPI’s efficiency gains are more substantial in cities with weaker enforcement, inspections in these areas should act as “hard constraints,” strengthening accountability and shifting governance from campaign-style to institutionalized regulation. In cities with more vigorous enforcement, a “soft governance” approach is preferable to avoid excessive regulation, relying on differentiated emission standards to limit innovation crowding-out and resource misallocation. Third, closer alignment between CEPI and green finance can enhance regulatory effectiveness. In cities with mature green finance systems, incorporating firms’ environmental performance into credit ratings and access can channel capital toward cleaner industries. Strengthened information disclosure and regulatory coordination can create a virtuous cycle between finance and energy efficiency. In less developed areas, targeted green finance mechanisms should improve project identification and incentives, foster local policy coordination, and align financing standards with CEPI requirements to reinforce policy complementarities.
7.3 Discussion
This study has several limitations that point to clear avenues for future research. First, it does not fully examine the long-term and dynamic effects of the CEPI policy. Because CEPI is implemented periodically, the analysis focuses on short-to medium-term impacts and does not assess long-term incentives or heterogeneity in policy effects during the feedback and rectification phase. Second, the reliance on city-level data, while informative for average regional impacts, limits the ability to identify micro-level mechanisms. Aggregation may obscure the firm heterogeneity, the industry structure, and the key transmission channels. Future work could link firm-level data on emission permits, green patents, investment, and credit to estimate firm-level DID models, enabling more precise mechanism analysis. In addition, future research could employ local projection DID methods to examine dynamic impacts across inspection phases and assess the persistence or attenuation of policy effects.
Data availability statement
The raw data supporting the conclusions of this article will be made available by the authors, without undue reservation.
Author contributions
BT: Investigation, Methodology, Writing – original draft. YZ: Data curation, Formal Analysis, Supervision, Writing – review and editing. ZZ: Conceptualization, Investigation, Project administration, Writing – review and editing. XX: Validation, Writing – review and editing.
Funding
The authors declare that financial support was received for the research and/or publication of this article. CUFE Postgraduate students support program for the integration of research and teaching (2025104).
Conflict of interest
The authors declare that the research was conducted in the absence of any commercial or financial relationships that could be construed as a potential conflict of interest.
Generative AI statement
The authors declare that no Generative AI was used in the creation of this manuscript.
Any alternative text (alt text) provided alongside figures in this article has been generated by Frontiers with the support of artificial intelligence and reasonable efforts have been made to ensure accuracy, including review by the authors wherever possible. If you identify any issues, please contact us.
Publisher’s note
All claims expressed in this article are solely those of the authors and do not necessarily represent those of their affiliated organizations, or those of the publisher, the editors and the reviewers. Any product that may be evaluated in this article, or claim that may be made by its manufacturer, is not guaranteed or endorsed by the publisher.
Supplementary material
The Supplementary Material for this article can be found online at: https://www.frontiersin.org/articles/10.3389/fenvs.2025.1695673/full#supplementary-material
References
Abbas, S., Gui, P., Chen, A., and Ali, N. (2022). The effect of renewable energy development, market regulation, and environmental innovation on CO2 emissions in BRICS countries. Environ. Sci. Pollut. Res. 29 (39), 59483–59501. doi:10.1007/s11356-022-20013-7
Acemoglu, D., Akcigit, U., and Kerr, W. (2016). Networks and the macroeconomy: an empirical exploration. NBER Macroecon. Annu. 30 (1), 273–335. doi:10.1086/685961
Albrizio, S., Kozluk, T., and Zipperer, V. (2017). Environmental policies and productivity growth: evidence across industries and firms. J. Environ. Econ. Manage. 81, 209–226. doi:10.1016/j.jeem.2016.06.002
Ali, N., Hu, X., Hussain, J., and Nilofar, M. (2021). Assessing the environmental impacts of COVID-19: a review. Pol. J. Environ. Stud. 30 (5), 4401–4403. doi:10.15244/PJOES/130337
Ali, N., Phoungthong, K., Techato, K., Ali, W., Abbas, S., Dhanraj, J. A., et al. (2022). FDI, green innovation and environmental quality nexus: new insights from BRICS economies. Sustainability 14 (4), 2181. doi:10.3390/su14042181
Andersen, D. C. (2017). Do credit constraints favor dirty production: theory and plant-level evidence. J. Environ. Econ. Manage. 84, 189–208. doi:10.1016/j.jeem.2017.04.002
Angrist, J. D., and Pischke, J. S. (2010). The credibility revolution in empirical economics: how better research design is taking the con out of econometrics. J. Econ. Perspect. 24 (2), 3–30. doi:10.1257/jep.24.2.3
Beck, T., Levine, R., and Levkov, A. (2010). Big bad banks? The winners and losers from bank deregulation in the United States. J. Finance 65 (5), 1637–1667. doi:10.1111/j.1540-6261.2010.01589.x
Brandt, L., Van Biesebroeck, J., and Zhang, Y. (2012). Creative accounting or creative destruction? firm-Level productivity growth in Chinese manufacturing. J. Dev. Econ. 97 (2), 339–351. doi:10.1016/j.jdeveco.2011.02.002
Cai, H., Chen, Y., and Gong, Q. (2016). Polluting thy neighbor: unintended consequences of China’s pollution reduction mandates. J. Environ. Econ. Manage. 76, 86–104. doi:10.1016/j.jeem.2015.01.002
Callaway, B., and Sant’Anna, P. H. (2021). Difference-in-differences with multiple time periods. J. Econ. 225 (2), 200–230. doi:10.1016/j.jeconom.2020.12.001
Çam, S., Karataş, A. S., and Lopcu, K. (2022). The puzzle of energy efficiency in Turkey: combining a multiple criteria decision making and the time series analysis. Energy Sources Part B 17 (1), 2136791. doi:10.1080/15567249.2022.2136791
Chang, C., Chen, K., Waggoner, D., and Zha, T. (2015). Trends and cycles in China's macroeconomy. NBER Macroecon. Annu. 30 (1), 1–84. doi:10.1086/685949
Chen, Y., Zhang, M., Wang, C., Lin, X., and Zhang, Z. (2023). High-tech industrial agglomeration, government intervention and regional energy efficiency: based on the perspective of the spatial spillover effect and panel threshold effect. Sustainability 15 (7), 6295. doi:10.3390/su15076295
Cheng, Z., and Yu, X. (2023). Can central environmental protection inspection induce corporate green technology innovation. J. Clean. Prod. 387, 135902. doi:10.1016/j.jclepro.2023.135902
Chernozhukov, V., Chetverikov, D., Demirer, M., Duflo, E., Hansen, C., Newey, W., et al. (2018). Double/debiased machine learning for treatment and structural parameters. Econ. J. 21 (1), C1–C68. doi:10.1111/ectj.12097
Dell, M. (2010). The persistent effects of Peru's mining mita. Econometrica 78 (6), 1863–1903. doi:10.3982/ECTA8121
Duranton, G., and Puga, D. (2004). Micro-foundations of urban agglomeration economies. Handb. Regional Urban Econ. 4, 2063–2117. doi:10.1016/S1574-0080(04)80005-1
Eskeland, G. S., and Harrison, A. E. (2003). Moving to greener pastures? Multinationals and the pollution haven hypothesis. J. Dev. Econ. 70 (1), 1–23. doi:10.1016/S0304-3878(02)00084-6
Feng, Y., Yuan, H., Liu, Y., and Zhang, S. (2023). Does new-type urbanization policy promote green energy efficiency? Evidence from a quasi-natural experiment in China. Energy Econ. 124, 106752. doi:10.1016/j.eneco.2023.106752
Flammer, C. (2021). Corporate green bonds. J. Financ. Econ. 142 (2), 499–516. doi:10.1016/j.jfineco.2021.01.010
Gao, D., Li, G., and Yu, J. (2022). Does digitization improve green total factor energy efficiency? Evidence from chinese 213 cities. Energy 247, 123395. doi:10.1016/j.energy.2022.123395
Glaeser, E. (2011). Cities, productivity, and quality of life. Science 333 (6042), 592–594. doi:10.1126/science.1209264
Grossman, G. M., and Krueger, A. B. (1995). Economic growth and the environment. Q. J. Econ. 110 (2), 353–377. doi:10.2307/2118443
Guo, S. (2023). Tackling China's local environmental policy implementation gap: an evolutionary game analysis of China's environmental protection inspection system. J. Clean. Prod. 416, 137942. doi:10.1016/j.jclepro.2023.137942
Guo, B., and Jin, G. (2025). Heterogeneity of urban‒rural responses to multigoal policy from an efficiency perspective: an empirical study in China. Habitat Int. 158, 103341. doi:10.1016/j.habitatint.2025.103341
He, N., Zeng, S., and Jin, G. (2023). Achieving synergy between carbon mitigation and pollution reduction: does green finance matter? J. Environ. Manage. 342, 118356. doi:10.1016/j.jenvman.2023.118356
Hsieh, C.-T., and Klenow, P. J. (2009). Misallocation and manufacturing TFP in China and India. Q. J. Econ. 124 (4), 1403–1448. doi:10.1162/qjec.2009.124.4.1403
Hu, X., Ali, N., Malik, M., Hussain, J., Fengyi, J., and Nilofar, M. (2021). Impact of economic openness and innovations on the environment: a new look into ASEAN countries. Pol. J. Environ. Stud. 30 (4), 3601–3613. doi:10.15244/pjoes/130898
Hussain, J., Zhou, K., Muhammad, F., Khan, D., Khan, A., Ali, N., et al. (2021). Renewable energy investment and governance in countries along the belt and road initiative: does trade openness matter. Renew. Energy 180, 1278–1289. doi:10.1016/j.renene.2021.09.020
Jaffe, A. B., and Palmer, K. (1997). Environmental regulation and innovation: a panel data study. Rev. Econ. Stat. 79 (4), 610–619. doi:10.1162/003465397557196
Jaffe, A. B., Newell, R. G., and Stavins, R. N. (2003). “Technological change and the environment,” in Handbook of environmental economics. Editors K. G. Mäler, and J. R. Vincent (Elsevier), 461–516.
Jia, K., and Chen, S. (2019). Could campaign-style enforcement improve environmental performance? Evidence from China's central environmental protection inspection. J. Environ. Manage. 245, 282–290. doi:10.1016/j.jenvman.2019.05.114
Jiang, T., Feng, T., and Bi, S. (2024). Towards urban sustainable development: the effect of new type urbanization on energy utilization efficiency. Pol. J. Environ. Stud. 33 (6), 6181–6194. doi:10.15244/pjoes/184635
Kopyrina, O., Wu, K., and Ying, Z. (2023). Greening through central inspection: the role of legitimacy pressure and risk-taking. Pac.-basin Finance J. 77, 101894. doi:10.1016/j.pacfin.2022.101894
Kou, P., Han, Y., and Qi, X. (2022). The operational mechanism and effectiveness of China's central environmental protection inspection: evidence from air pollution. Socioecon. Plann. Sci. 81, 101215. doi:10.1016/j.seps.2021.101215
Li, H., and Shi, J. F. (2014). Energy efficiency analysis on chinese industrial sectors: an improved super-SBM model with undesirable outputs. J. Clean. Prod. 65, 97–107. doi:10.1016/j.jclepro.2013.09.035
Li, M. J., and Tao, W. Q. (2017). Review of methodologies and polices for evaluation of energy efficiency in high energy-consuming industry. Appl. Energy. 187, 203–215. doi:10.1016/j.apenergy.2016.11.039
Li, P., Lu, Y., and Wang, J. (2020). The effects of fuel standards on air pollution: evidence from China. J. Dev. Econ. 146, 102488. doi:10.1016/j.jdeveco.2020.102488
Li, G., Gao, D., and Li, Y. (2023). Impacts of market-based environmental regulation on green total factor energy efficiency in China. China World Econ. 31 (3), 92–114. doi:10.1111/cwe.12485
Liu, X., Zhong, S., Li, S., and Yang, M. (2022). Evaluating the impact of central environmental protection inspection on air pollution: an empirical research in China. Process Saf. Environ. Prot. 160, 563–572. doi:10.1016/j.psep.2022.02.048
Lu, J. (2022). Can the central environmental protection inspection reduce transboundary pollution? Evidence from river water quality data in China. J. Clean. Prod. 332, 130030. doi:10.1016/j.jclepro.2021.130030
Luo, K., Lee, C. C., and Zhuo, C. (2024). A pathway to coordinated regional development: energy utilization efficiency and green development—evidence from China's major national strategic zones. Energy Econ. 131, 107402. doi:10.1016/j.eneco.2024.107402
Lyu, C., Xie, Z., and Li, Z. (2022). Market supervision, innovation offsets and energy efficiency: evidence from environmental pollution liability insurance in China. Energy Policy 171, 113267. doi:10.1016/j.enpol.2022.113267
Mani, M., and Wheeler, D. (1998). In search of pollution havens? Dirty industry in the world economy, 1960 to 1995. J. Environ. Dev. 7 (3), 215–247. doi:10.1177/107049659800700302
Melitz, M. J. (2003). The impact of trade on intra-industry reallocations and aggregate industry productivity. Econometrica 71 (6), 1695–1725. doi:10.1111/1468-0262.00467
Millimet, D. L., Roy, S., and Sengupta, A. (2009). Environmental regulations and economic activity: influence on market structure. Annu. Rev. Resour. Econ. 1 (1), 99–118. doi:10.1146/annurev.resource.050708.144100
Moser, P., and Voena, A. (2012). Compulsory licensing: evidence from the trading with the enemy act. Am. Econ. Rev. 102 (1), 396–427. doi:10.1257/aer.102.1.396
Muhammad, S., Pan, Y., Agha, M. H., Umar, M., and Chen, S. (2022). Industrial structure, energy intensity and environmental efficiency across developed and developing economies: the intermediary role of primary, secondary and tertiary industry. Energy 247, 123576. doi:10.1016/j.energy.2022.123576
Nelson, R. A., Tietenberg, T., and Donihue, M. R. (1993). Differential environmental regulation: effects on electric utility capital turnover and emissions. Rev. Econ. Stat. 75 (2), 368–373. doi:10.2307/2109447
Nevo, A., and Rosen, A. M. (2012). Identification with imperfect instruments. Rev. Econ. Stat. 94 (3), 659–671. doi:10.1162/REST_a_00171
Pan, D., Yu, Y., Hong, W., and Chen, S. (2023). Does campaign-style environmental regulation induce green economic growth? Evidence from China's central environmental protection inspection policy. Energy Environ. 35 (5), 2382–2406. doi:10.1177/0958305X231152483
Porter, M. E., and Linde, C. v. d. (1995). Toward a new conception of the environment-competitiveness relationship. J. Econ. Perspect. 9 (4), 97–118. doi:10.1257/jep.9.4.97
Qian, X., Ding, H., and Ding, Z. (2023). Governmental inspection and firm environmental protection expenditure: evidence from China. Econ. Model. 123, 106284. doi:10.1016/j.econmod.2023.106284
Rambachan, A., and Roth, J. (2023). A more credible approach to parallel trends. Rev. Econom. Stud. 90 (5), 2555–2591. doi:10.1093/restud/rdad018
Rauf, A., Ali, N., Sadiq, M. N., Abid, S., Kayani, S. A., and Hussain, A. (2023). Foreign direct investment, technological innovations, energy use, economic growth, and environmental sustainability nexus: new perspectives in BRICS economies. Sustainability 15 (18), 14013. doi:10.3390/su151814013
Razzaq, A., Sharif, A., Ozturk, I., and Yang, X. (2023). Central inspections of environmental protection and transition for low-carbon chinese cities: policy intervention and mechanism analysis. Energy Econ. 124, 106859. doi:10.1016/j.eneco.2023.106859
Shah, W. U. H., Zhu, N., Hao, G., Yan, H., and Yasmeen, R. (2024). Energy efficiency evaluation, technology gap ratio, and determinants of energy productivity change in developed and developing G20 economies: DEA super-SBM and MLI approaches. Gondwana Res. 125, 70–81. doi:10.1016/j.gr.2023.07.017
Sun, H., Edziah, B. K., Sun, C., and Kporsu, A. K. (2019). Institutional quality, green innovation and energy efficiency. Energy Policy 135, 111002. doi:10.1016/j.enpol.2019.111002
Sun, J., Yue, L., Li, X., and Dai, M. (2023). Environmental governance in China: the effects of policy clarity, career concerns, and new appointed officials on pollution control. Policy Stud. J. 51 (2), 397–417. doi:10.1111/psj.12490
Sun, X., Zhang, R., Yu, Z., Zhu, S., Qie, X., Wu, J., et al. (2024). Revisiting the porter hypothesis within the economy-environment-health framework: empirical analysis from a multidimensional perspective. J. Environ. Manage. 349, 119557. doi:10.1016/j.jenvman.2023.119557
Tone, K., and Tsutsui, M. (2009). Network DEA: a slacks-based measure approach. Eur. J. Oper. Res. 197 (1), 243–252. doi:10.1016/j.ejor.2008.05.027
Wang, H. J., and Tang, K. (2023). Extreme climate, innovative ability and energy efficiency. Energy Econ. 120, 106586. doi:10.1016/j.eneco.2023.106586
Wang, J., and Wang, S. (2023). The effect of electricity market reform on energy efficiency in China. Energy Policy 181, 113722. doi:10.1016/j.enpol.2023.113722
Wang, C. N., Nguyen, T. D., and Yu, M. C. (2019). Energy use efficiency past-to-future evaluation: an international comparison. Energies 12 (19), 3804. doi:10.3390/en12193804
Wang, H., Fan, C., and Chen, S. (2021). The impact of campaign-style enforcement on corporate environmental action: evidence from China’s central environmental protection inspection. J. Clean. Prod. 290, 125881. doi:10.1016/j.jclepro.2021.125881
Wang, J., Zhang, W., Zou, G., and Li, Y. (2023a). Strengthened enforcement, weakened efficiency: the effect of environmental inspection on corporate investment. Econom. Lett. 232, 111324. doi:10.1016/j.econlet.2023.111324
Wang, S., Zhang, R., Wan, L., and Chen, J. (2023b). Has central government environmental protection interview improved air quality in China. Ecol. Econ. 206, 107750. doi:10.1016/j.ecolecon.2023.107750
Wei, X., and Zhao, C. (2024). Does chinese environmental policy affect income inequality? Evidence from the central environmental protection inspection. China World Econ. 32 (3), 130–161. doi:10.1111/cwe.12534
Wen, J., Ali, W., Hussain, J., Khan, N. A., Hussain, H., Ali, N., et al. (2021). Dynamics between green innovation and environmental quality: new insights into south asian economies. Econ. Polit. 39 (2), 543–565. doi:10.1007/s40888-021-00248-2
Wu, R., and Hu, P. (2019). Does the “miracle drug” of environmental governance really improve air quality? Evidence from China’s system of central environmental protection inspections. Int. J. Environ. Res. Public Health. 16 (5), 850. doi:10.3390/ijerph16050850
Xiong, S., Ma, X., and Ji, J. (2019). The impact of industrial structure efficiency on provincial industrial energy efficiency in China. J. Clean. Prod. 215, 952–962. doi:10.1016/j.jclepro.2019.01.095
Xu, D., Abbas, S., Rafique, K., and Ali, N. (2023). The race to net-zero emissions: can green technological innovation and environmental regulation be the potential pathway to net-zero emissions? Technol. Soc. 75, 102364. doi:10.1016/j.techsoc.2023.102364
Yang, S., Jahanger, A., and Hossain, M. R. (2023). Does China's low-carbon city pilot intervention limit electricity consumption? An analysis of industrial energy efficiency using time-varying DID model. Energy Econ. 121, 106636. doi:10.1016/j.eneco.2023.106636
Yang, J., Deng, J., Ye, L., Liu, L., and Hu, X. (2024). Study on the impact of central environmental protection inspection on the health of the older adult population—a quasi-natural experiment in China. Front. Public Health 12, 1290192. doi:10.3389/fpubh.2024.1290192
Yuan, F., Zhai, Y., Sun, X., and Dong, Y. (2022). Air pollution mitigation: evidence from China's central environmental inspection. Environ. Impact Assess. Rev. 96, 106835. doi:10.1016/j.eiar.2022.106835
Zeng, H., Dong, B., Zhou, Q., and Jin, Y. (2021). The capital market reaction to central environmental protection inspection: evidence from China. J. Clean. Prod. 279, 123486. doi:10.1016/j.jclepro.2020.123486
Zeng, M., Zheng, L., Huang, Z., Cheng, X., and Zeng, H. (2023). Does vertical supervision promote regional green transformation? Evidence from central environmental protection inspection. J. Environ. Manage. 326, 116681. doi:10.1016/j.jenvman.2022.116681
Zhang, T., and Li, J. C. (2023). Network infrastructure,inclusive green growth, and regional inequality: from causal inference based on double machine learning. Quant. Econ. Tech. Econ. Res. 40 (4), 113–135. doi:10.13653/j.cnki.jqte.20230310.005
Zhang, Z., Peng, X., Yang, L., and Lee, S. (2022). How does chinese central environmental inspection affect corporate green innovation? The moderating effect of bargaining intentions. Environ. Sci. Pollut. Res. 29 (28), 42955–42972. doi:10.1007/s11356-022-18755-5
Zhang, W., Zhu, B., Li, Y., and Yan, D. (2024). Revisiting the porter hypothesis: a multi-country meta-analysis of the relationship between environmental regulation and green innovation. Humanit. Soc. Sci. Commun. 11, 232. doi:10.1057/s41599-024-02671-9
Keywords: central environmental protection inspection, energy utilization efficiency, difference-in-differences, imperfect instrumental variables, double machine learning
Citation: Tang B, Zhong Y, Zuo Z and Xie X (2025) Can the central environmental protection inspection improve urban energy utilization efficiency?. Front. Environ. Sci. 13:1695673. doi: 10.3389/fenvs.2025.1695673
Received: 30 August 2025; Accepted: 30 October 2025;
Published: 17 November 2025.
Edited by:
Mirela Panait, Petroleum and Gas University of Ploieşti, RomaniaReviewed by:
Gui Jin, China University of Geosciences Wuhan, ChinaYongshan Du, China University of Petroleum Beijing, China
Copyright © 2025 Tang, Zhong, Zuo and Xie. This is an open-access article distributed under the terms of the Creative Commons Attribution License (CC BY). The use, distribution or reproduction in other forums is permitted, provided the original author(s) and the copyright owner(s) are credited and that the original publication in this journal is cited, in accordance with accepted academic practice. No use, distribution or reproduction is permitted which does not comply with these terms.
*Correspondence: Yu Zhong, MjY2MjY5NzM3OUBxcS5jb20=; Zhizhao Zuo, Y2hhbmdqaWFuZ19iZWlAb3V0bG9vay5jb20=