 Thibaut Fréjaville
 Marta Benito Garzón
- Biodiversité Gènes et Communautés (UMR 1202), Institut National de la Recherche Agronomique, Université de Bordeaux, Pessac, France
Introduction
Climate drives many ecological and evolutionary processes on Earth (Parmesan, 2006). The spatial and temporal variations of climate determine the velocity of climate change and its impacts on terrestrial ecosystems (Loarie et al., 2009). Climate variation over the years has been one of the main drivers of changes in biodiversity (Garcia et al., 2014), vegetation growth (Ray et al., 2015) and the global carbon cycle (Poulter et al., 2014). Moreover, temporal climate variation including year-to-year variability can shape local adaptation and natural selection (Frank et al., 2017; Siepielski et al., 2017) and plays an important role in determining tree mortality thresholds (Neumann et al., 2017). In addition to its variation over time, climate varies spatially, which is very important to determine the capacity of species to acclimate across ranges (Valladares et al., 2014), the effects of climate on species distributions (Elith et al., 2006), the outcome of species interactions over large spatial scales (Gomez-Aparicio et al., 2011; Alexander et al., 2015), and the distribution of disturbances such as fire (Krawchuk et al., 2009).
Ecological science is therefore dependent on climate databases covering both time and space. The two climate databases most widely used in ecology to date are the WorldClim (Hijmans et al., 2005) and CRU TS datasets (Harris et al., 2014), which differ in their quality of data over time and space. WorldClim includes climatic means at high resolution (30 arc sec or ~1 × 1 km) over a reference period (e.g., 1960-1990), which precludes any study of climate variation as well as the study of recent climate change. CRU TS provides yearly climate data (from 1901 to the present day) at 0.5° longitude by 0.5° latitude resolution (~50 × 50 km), a low spatial resolution that limits our understanding of spatio-temporal processes at fine scales.
To fill this gap between spatial and temporal climate databases in order to study ecological processes, we present EuMedClim, a new climate dataset that provides high spatial and temporal resolution (30 arc sec including monthly, seasonal and yearly time steps) of gridded climatologies for the years 1901–2014 across Europe and the Mediterranean Basin. We used an anomaly approach to interpolate spatial yearly climate data of CRU TS (version 3.23) using the climate surfaces of WorldClim (version 1.4) at 1 km resolution. Evaluation of our downscaled data against individual weather station data show good agreement between EuMedClim and original databases (EuMedClim vs. WorldClim for spatial and EuMedClim vs. CRU for temporal) and weather observations, with a higher accuracy of EuMedClim for the temporal component. EuMedClim thus provides new perspectives for studying spatio-temporal patterns of ecological and evolutionary processes at high temporal and spatial resolution for Europe and the Mediterranean Basin.
Data Generation
Input Datasets
WorldClim version 1.4 (Hijmans et al., 2005) provides global grids of 1960–1990 average climate for monthly precipitation, mean, minimum and maximum daily temperatures, and 19 derived bioclimatic variables at 30 arc sec resolution (http://worldclim.org/version1). The grids were produced by spline surface fitting spatial interpolation using data on latitude, longitude and elevation from weather station (Hijmans et al., 2005).
CRU TS version 3.23 (Harris et al., 2014) provides global climate grids at 0.5 × 0.5° resolution of monthly precipitation, mean, minimum and maximum daily temperatures for the years 1901–2014 (http://data.ceda.ac.uk/badc/cru/data/cru_ts/cru_ts_3.23/). The CRU dataset was produced by spatial interpolation of yearly climate anomalies of weather station data relative to 1961-1990 means (Mitchell and Jones, 2005).
EuMedClim Anomaly Approach from CRU and Worldclim Climate Databases
The fine 30′ resolution WorldClim data were used to adjust the coarse spatial 0.5° resolution of CRU time series data following an anomaly approach (Zimmermann et al., 2013; Fréjaville and Curt, 2015; Moreno and Hasenauer, 2015). This approach combines the temporal information of CRU with the spatial information of WorldClim, by using climate grids derived from Wordclim as a reference for the spatial variation and yearly climate from 1901 to 2014 derived from CRU as a reference for temporal variation. The final resolution of EuMedClim is 30 arc sec resolution (~1 km) for yearly climate grids from 1901 to 2014. The spatial window of EuMedClim includes Europe and the Mediterranean basin (extent: −20° to 60° longitude E; 20° to 72° latitude N).
The particular procedure for the anomaly method is as follows: we first averaged yearly data from CRU over the period 1960-1990 (same reference period as WorldClim data) and then calculated the differences (anomalies) between CRU and WorldClim average values over this reference period. CRU average values were resampled at the WorldClim resolution (30 arc sec) using bilinear interpolation (we named this dataset the CRU interpolated reference period) for comparison of both databases. Finally, anomalies between the two datasets were added to the CRU yearly data to build the EuMedClim dataset at 30 arc sec resolution for the years 1901–2014. This approach uses the existing high-resolution grids (i.e., WorldClim) to interpolate coarse-resolution grids (i.e., CRU) with resampling techniques (bilinear interpolation), instead of using complex regression models with topography and geographical parameters that are generally used for the interpolation of irregularly distributed weather station data (e.g., Hijmans et al., 2005; Feidas et al., 2014).
We computed and applied the anomalies in different ways depending on the data characteristics. We used the difference method (Zimmermann et al., 2013) to downscale each temperature and water balance variable k: EuMedClimt,k,i = CRUt,k,i − (CRUref,k,i − WorldClimk,i), where CRUt,k,i is the CRU interpolated value at cell i for the year t, and CRUref,k,i − WorldClimk,i is the anomaly (difference) at cell i between CRU and WorldClim mean values of k over the reference period 1960-1990. The yearly grids of each variable k derived from CRU data were prior resampled (bilinear interpolation) to the resolution of WorldClim (30 arc sec). Similarly, we used the ratio of change method (Zimmermann et al., 2013) to downscale each precipitation and potential evapotranspiration variable k (that comprise only positive values): EuMedClimt,k,i = (CRUt,k,i + 1) × (WorldClimk,i + 0.001)/(CRUref,k,i + 1), where (CRUref,k,i + 1)/(WorldClimk,i + 0.001) is the anomaly (ratio) at cell i between CRU and WorldClim mean values of k over the reference period. An increment of 1 mm precipitation (or evapotranspiration) was added to both yearly and reference-period CRU data to avoid null values in cases where CRUref,k,i is null (no precipitation over the reference period at a given location). Similarly, an epsilon increment (0.001) was applied to WorldClim data to avoid any infinite values that could result if WorldClimk,i is null. Finally, downscaled precipitation and evapotranspiration values in EuMedClim were limited to values ≥0.
Eumedclim Database: Climate Variables
We computed the same bioclimatic variables available from Worldclim (bio1, 2, 5, 6, 12, 13, 14). In addition, monthly temperature and precipitation data from WorldClim were used to compute seasonal temperature and precipitation variables, potential evapotranspiration (PET) and water balance (precipitation minus PET) (Table 1). PET was calculated using Hargreaves' equations (1994) modified by Droogers and Allen (2002) in the R package SPEI (Beguería and Vicente-Serrano, 2013), from monthly precipitation, monthly temperature (minimum and maximum) and latitude coordinates.
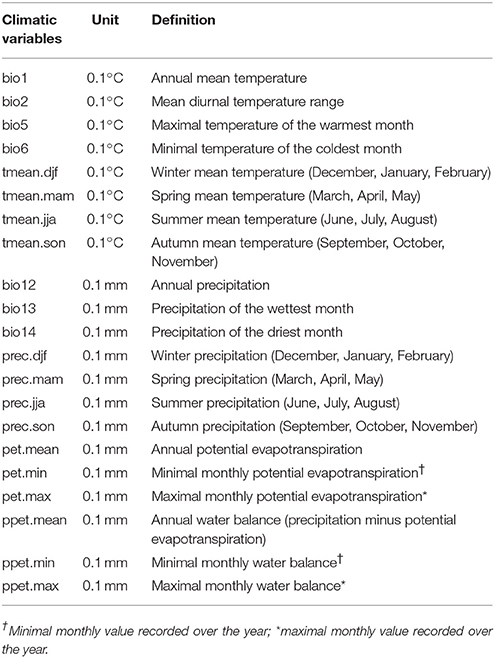
Table 1. List of yearly climatic variables provided by EuMedClim.
Data Validation
Technical validation of the spatial and temporal component of the EuMedClim database was carried out with weather station data collected by the Climate Research Unit (https://crudata.uea.ac.uk/cru/data/hrg/cru_ts_3.23/observation.v3.23/). We compute the annual mean temperature (bio1), precipitation (bio12), PET (pet.mean) and water balance (ppet.mean) for the years 1901–2014 using monthly data of temperature (daily mean, minimal and maximal values) and precipitation from weather stations. For the spatial component, we compared the 1960-1990 climatic means between individual station data and the corresponding grid cells of EuMedClim, CRU and WorldClim. For the temporal component, we first compared 1901–2014 yearly values averaged across stations and the corresponding grid cells of EuMedClim and CRU. Because monthly values over the period 1901–2014 were not available across all stations and years, we selected only the years without missing values for each station. Hence, each year was potentially represented by different stations. Second, we compared EuMedClim and CRU temporal data with each individual weather station.
Results show good agreement between EuMedClim and station data for both the spatial and temporal components (Figure 1, Supplementary Table 1, Supplementary Figure 1).
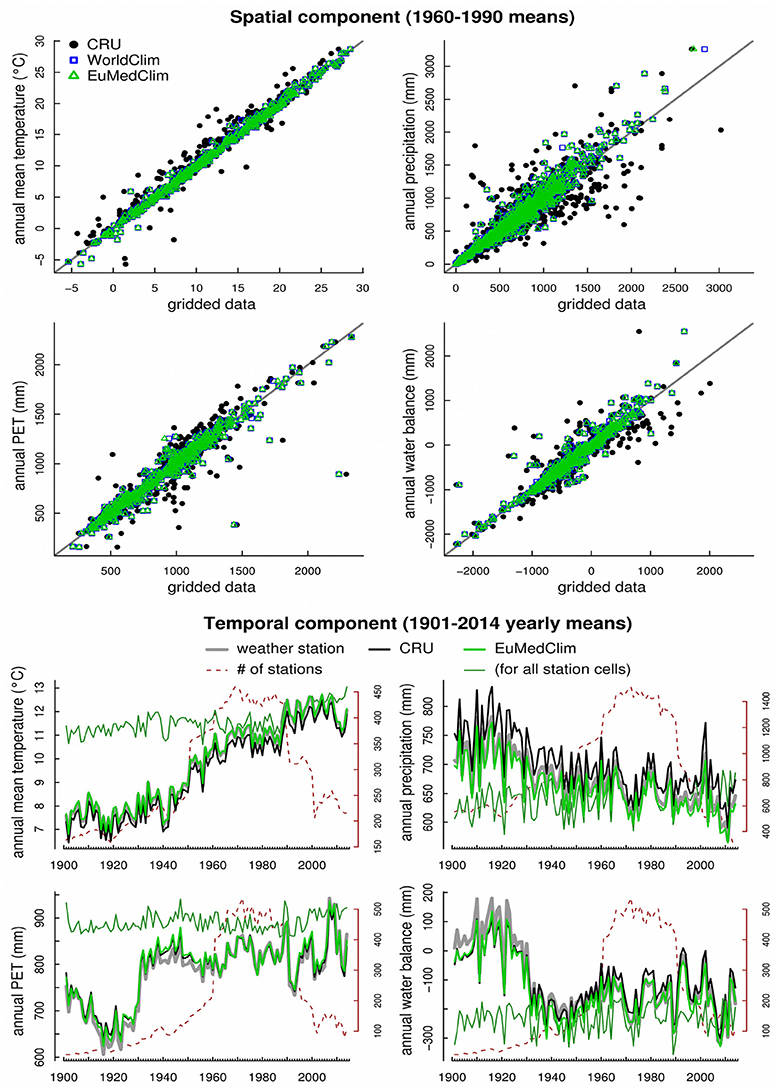
Figure 1. Evaluation of the spatial and temporal components of EuMedClim and original gridded datasets against weather station data across Europe and Mediterranean Basin. For the spatial component, the black line is the 1:1 line. For the temporal component, the number of station and corresponding grid cell (#) used to compute yearly mean values changes over time as illustrated by the brown dashed line; the dark green line indicates the mean temporal trend computed from EuMedClim across the cells corresponding to all stations (i.e., independent to station data availability over time and space). Coefficients of determination, errors and the number of station (and corresponding grid cell) used in evaluation for the spatial component, and Kendall's coefficients of correlation and errors for the temporal component are indicated in Supplementary Table 1. Evaluation at individual stations is presented in Supplementary Figure 1.
For the spatial component, the explained variance of weather observations (1960-1990 means) ranges from 91.4 to 99.4% and Mean Bias Error (MBE) ranges from −4.5 mm to <0.1°C for annual water balance and annual mean temperature respectively, with strong agreement for temperature and slight underestimation of precipitation (Figure 1, Supplementary Table 1). Obviously, similar errors are reported between WorldClim and station data (i.e., WorldClim was used to infer spatial information of EuMedClim) whereas CRU data shows higher errors that are inherent to its lower spatial resolution.
For the temporal component comparison, Kendall's coefficients indicate very high correlations between EuMedClim and station data for yearly mean values, ranging from 0.87 to 0.99 for annual PET and mean temperature respectively (Figure 1, Supplementary Table 1). MBE ranges from −23.6 mm to 8.9°C for annual water balance and PET respectively, showing once again a slight underestimation of precipitation. Root Mean Squared Error (RMSE) between station and gridded data are similarly low for EuMedClim and CRU, ranging from <0.5°C of annual temperature to 35 mm of annual water balance. Over time, both CRU and EuMedClim data tend to have higher discrepancies with station data at the beginning of the study period (1901–1930) that may be due to a lower number of available weather stations (red line, Figure 1).
Overall, the EuMedClim and individual station time series show good agreement across Europe and the Mediterranean Basin in terms of Kendall's coefficient and RSME values (Supplementary Figure 1). Kendall's correlations between EuMedClim and individual station time series are higher than 0.89 for 90% of individual stations (vs. 0.89 for CRU) for annual temperature (bio1), higher than 0.69 (vs. 0.65) for annual precipitation, higher than 0.71 (vs. 0.68) for annual PET and higher than 0.73 (vs. 0.70) for annual water balance. RMSE between EuMedClim and individual station time series are lower than 0.8°C for 90% of individual stations (vs. 2.23°C for CRU) for annual temperature, lower than 131 mm (vs. 252 mm) for annual precipitation, lower than 95 mm (vs. 171 mm) for annual PET and lower than 172 mm (vs. 385 mm) for annual water balance. The evaluation at individual stations shows that EuMedClim quantifies the temporal climatic variation over Europe and the Mediterranean Basin similarly to the CRU dataset, but with higher accuracy. Our evaluation indicates that CRU and EuMedClim have higher errors in arid areas of North Africa (particularly for precipitation), where there are the lowest density of stations.
For each variable provided by EuMedClim (Table 1), the spatial patterns, temporal trends and the quantification of errors relative to the original datasets are presented in Supplementary Figures 2–4 and Supplementary Table 2.
Data Files and R Scripts
The entire climate dataset and corresponding R scripts to manipulate it are available at http://gentree.data.inra.fr/climate (Fréjaville, 2017). For each climatic variable, gridded yearly data from 1901 to 2014 are provided by eight GeoTiff integer data files. Each file corresponds to one geographical tile, with longitude (°E) and latitude (°N) boundaries given in the file name. The format of each GeoTiff file is a multi-layer raster (raster brick) containing 114 layers, with the first and the last layer corresponding to the years 1901 and 2014, respectively. Data must be divided by 10 to get correct values (in °C or in mm).
Three R scripts are available along with the climate data. Extract_climate_time_series.R downloads yearly data of one or several climatic variables at the geographical location (WGS 84) specified by the user. Compute_climate_maps.R produces climate maps averaged over a given time period for a given geographical window specified by the user. Instead of computing average-climate maps, the user may choose to compute climatic extremes (minimal or maximal values) over the desired period to study patterns in climatic extremes. Climate_downscaling_using_anomaly_approach.R presents the generic R code used to downscale climate data.
Author Contributions
MB: Acquired funding; TF: Conceived, analyzed and produced the data; TF and MB: Wrote the manuscript; all authors gave approval of this manuscript to be published.
Funding
This study was funded by the Investments for the Future program IdEx Bordeaux (ANR-10-IDEX-03-02) and the European Union's Horizon 2020 research and innovation programme project GenTree (grant agreement No 676876).
Conflict of Interest Statement
The authors declare that the research was conducted in the absence of any commercial or financial relationships that could be construed as a potential conflict of interest.
Acknowledgments
We would like to thank Alain Bernard, Bruno Fady and Christophe Plomion, INRA, for their help and guidance in processing data storage.
Supplementary Material
The Supplementary Material for this article can be found online at: https://www.frontiersin.org/articles/10.3389/fevo.2018.00031/full#supplementary-material
References
Alexander, J. M., Diez, J. M., and Levine, J. M. (2015). Novel competitors shape species' responses to climate change. Nature 525, 515–529. doi: 10.1038/nature14952
Beguería, S., and Vicente-Serrano, S. M. (2013). SPEI: Calculation of the Standardised Precipitation-Evapotranspiration Index. R package version 1.6. Available online at: http://CRAN.R-project.org/package=SPEI
Droogers, P., and Allen, R. G. (2002). Estimating reference evapotranspiration under inaccurate data conditions. Irrigat. Drain. Syst. 16, 33–45. doi: 10.1023/A:1015508322413
Elith, J. H., Graham, C. P., Anderson, R., Dudík, M., Ferrier, S., Guisan, A., et al. (2006). Novel methods improve prediction of species' distributions from occurrence data. Ecography 29, 129–151. doi: 10.1111/j.2006.0906-7590.04596.x
Feidas, H., Karagiannidis, A., Keppas, S., Vaitis, M., Kontos, T., Zanis, P., et al. (2014). Modeling and mapping temperature and precipitation climate data in Greece using topographical and geographical parameters. Theor. Appl. Climatol. 118, 133–146. doi: 10.1007/s00704-013-1052-4
Frank, A., Howe, G. T., Sperisen, C., Brang, P., Clair, J. B. S., Schmatz, D. R., et al. (2017). Risk of genetic maladaptation due to climate change in three major European tree species. Glob. Change Biol. 23, 5358–5371. doi: 10.1111/gcb.13802
Fréjaville, T. (2017). Time series (1901–2014) of 1-km resolution climate grids for Europe and Mediterranean Basin - the EuMedClim dataset [Data set]. INRA. doi: 10.15454/1.505380010373349e12
Fréjaville, T., and Curt, T. (2015). Spatiotemporal patterns of changes in fire regime and climate: defining the pyroclimates of south-eastern France (Mediterranean Basin). Clim. Change 129, 239–251. doi: 10.1007/s10584-015-1332-3
Garcia, R. A., Cabeza, M., Rahbek, C., and Araújo, M. B. (2014). Multiple dimensions of climate change and their implications for biodiversity. Science 344:1247579. doi: 10.1126/science.1247579
Gomez-Aparicio, L., Garcia-Valdes, R., Ruiz-Benito, P., and Zavala, M. A. (2011). Disentangling the relative importance of climate, size and competition on tree growth in Iberian forests: implications for forest management under global change. Glob. Change Biol. 17, 2400–2414. doi: 10.1111/j.1365-2486.2011.02421.x
Harris, I., Jones, P. D., Osborn, T. J., and Lister, D. H. (2014). Updated high-resolution grids of monthly climatic observations – the CRU TS3.10 Dataset. Int. J. Climatol. 34, 623–642. doi: 10.1002/joc.3711
Hijmans, R. J., Cameron, S. E., Parra, J. L., Jones, P. G., and Jarvis, A. (2005). Very high resolution interpolated climate surfaces for global land areas. Int. J. Climatol. 25, 1965–1978. doi: 10.1002/joc.1276
Krawchuk, M. A., Moritz, M. A., Parisien, M. A., Van Dorn, J., and Hayhoe, K. (2009). Global pyrogeography: the current and future distribution of wildfire. PLoS ONE 4:e5102. doi: 10.1371/journal.pone.0005102
Loarie, S. R., Duffy, P. B., Hamilton, H., Asner, G. P., Field, C. B., and Ackerly, D. D. (2009). The velocity of climate change. Nature 462:08649. doi: 10.1038/nature08649
Mitchell, T. D., and Jones, P. D. (2005). An improved method of constructing a database of monthly climate observations and associated high-resolution grids. Int. J. Climatol. 25, 693–712. doi: 10.1002/joc.1181
Moreno, A., and Hasenauer, H. (2015). Spatial downscaling of European climate data. Int. J. Climatol. 36, 1444–1458. doi: 10.1002/joc.4436
Neumann, M., Mues, V., Moreno, A., Hasenauer, H., and Seidl, R. (2017). Climate variability drives recent tree mortality in Europe. Glob. Change Biol. 23, 4788–4797. doi: 10.1111/gcb.13724
Parmesan, C. (2006). Ecological and evolutionary responses to recent climate change. Annu. Rev. Ecol. Evol. Syst. 37, 637–669. doi: 10.1146/annurev.ecolsys.37.091305.110100
Poulter, B., Frank, D., Ciais, P., Myneni, R. B., Andela, N., Bi, J., et al. (2014). Contribution of semi-arid ecosystems to interannual variability of the global carbon cycle. Nature 509, 600–603. doi: 10.1038/nature13376
Ray, D. K., Gerber, J. S., MacDonald, G. K., and West, P. C. (2015). Climate variation explains a third of global crop yield variability. Nat. Commun. 6:6989. doi: 10.1038/ncomms6989
Siepielski, A. M., Morrissey, M. B., Buoro, M., Carlson, S. M., Caruso, C. M., Clegg, S. M., et al. (2017). Precipitation drives global variation in natural selection. Science 355, 959–962. doi: 10.1126/science.aag2773
Valladares, F., Matesanz, S., Guilhaumon, F., Araújo, M. B., Balaguer, L., Benito Garzón, M., et al. (2014). The effects of phenotypic plasticity and local adaptation on forecasts of species range shifts under climate change. Ecol. Lett. 17, 1351–1364. doi: 10.1111/ele.12348
Keywords: anomaly, bioclim, climatic extremes, CRU, interpolation, precipitation, temperature, WorldClim
Citation: Fréjaville T and Benito Garzón M (2018) The EuMedClim Database: Yearly Climate Data (1901–2014) of 1 km Resolution Grids for Europe and the Mediterranean Basin. Front. Ecol. Evol. 6:31. doi: 10.3389/fevo.2018.00031
Received: 19 December 2017; Accepted: 15 March 2018;
Published: 04 April 2018.
Edited by:
Tomas Halenka, Charles University, CzechiaReviewed by:
Prodromos Zanis, Aristotle University of Thessaloniki, GreeceMustafa M. Aral, Georgia Institute of Technology, United States
Copyright © 2018 Fréjaville and Benito Garzón. This is an open-access article distributed under the terms of the Creative Commons Attribution License (CC BY). The use, distribution or reproduction in other forums is permitted, provided the original author(s) and the copyright owner are credited and that the original publication in this journal is cited, in accordance with accepted academic practice. No use, distribution or reproduction is permitted which does not comply with these terms.
*Correspondence: Thibaut Fréjaville, dGhpYmF1dC5mcmVqYXZpbGxlQGdtYWlsLmNvbQ==