 Natalie K. Rideout
 Zacchaeus G. Compson
 Wendy A. Monk
 Meghann R. Bruce4
 Donald J. Baird
- 1Department of Biology, Canadian Rivers Institute, University of New Brunswick, Fredericton, NB, Canada
- 2Environment and Climate Change Canada @ Canadian Rivers Institute, Department of Biology, University of New Brunswick, Fredericton, NB, Canada
- 3Faculty of Forestry and Environmental Management, Environment and Climate Change Canada @ Canadian Rivers Institute, University of New Brunswick, Fredericton, NB, Canada
- 4Canadian Rivers Institute, University of New Brunswick, Fredericton, NB, Canada
Natural hydrological fluctuations within river floodplains generate habitat diversity through variable connections between habitat patches and the main river channel. Human modification of floodplains can alter the magnitude and frequency of large floods and associated sediment movement by interrupting these floodplain connections. The lower Wolastoq | Saint John River and its associated floodplain wetlands are experiencing anthropogenic disturbances arising from climate change, increased urbanization in the watershed, changing upstream agricultural landscape practices, and, most notably, major road and dam construction. By comparing digitized aerial images, we identified key periods of change in wetland extent throughout an ecologically significant component of the floodplain, the Grand Lake Meadows and Portobello Creek wetland complex, with significant erosion evident in coves and backwater areas across the landscape following dam construction and significant accretion around the Jemseg River following highway construction. Connectivity and hydrological regime also influenced other habitat components, namely nutrients and metals retention, as well as the composition of the local macrophyte community. These findings address two key aspects of floodplain management: (1) understanding how hydrological alteration has historically influenced floodplain wetlands can inform us of how the ecosystem may respond under future conditions, such as climate change, and (2) the mechanisms by which habitat diversity and disturbance regimes filter biological communities, with the potential for patches to host a rich biodiversity continuously supporting critical ecosystem functions.
Introduction
River floodplains are subjected to habitat shaping disturbances, and as a result, spatiotemporal creation of patch diversity can promote high biodiversity through niche differentiation and environmental filtering (Ward et al., 1999; Amoros and Bornette, 2002; Tockner and Stanford, 2002). This reflects the Intermediate Disturbance Hypothesis (i.e., few taxa can survive in habitats with high disturbance and many taxa are outcompeted by competitive dominants in habitats with low disturbance; Connell, 1978). Floodplains constitute dynamic habitats, exhibiting a complex and seasonally variable natural stress regime for floodplain species; anthropogenic alteration of the natural state of a floodplain wetland can impose additional stress on these naturally resilient communities, with potentially negative consequences for local biodiversity and ecosystem integrity (e.g., Arias et al., 2018).
Essential characteristics of floodplains, such as shifting boundaries between lentic, lotic and terrestrial habitats, are driven by flood pulses (Junk et al., 1989). Flood pulses cause the vertical and horizontal inundation of the land surrounding rivers, as fed by groundwater, rain, snowmelt or ice jams (Junk et al., 1989). Although it was historically thought that flooding was a stress, (i.e., a chronic drain on the ecosystem that cannot be overcome by species replacement or adaptation), it is now realized, on the contrary, that flood pulses are an essential ecological disturbance, hydrologically linking the river and its floodplain, and replenishing sediment, nutrients and biological propagules to floodplain wetlands (Tockner et al., 2010). Natural hydrological fluctuations within the wetlands of intact floodplain-river ecosystems create habitat diversity through altered connectedness of floodplain patches to the river’s main channel (Amoros and Bornette, 2002). Sediment deposition creates oxbows, swales, backwaters and levees in the wetlands (Venterink et al., 2006), while sediment composition and nutrient influx influence plant community structure (Rejmankova, 2011; Rooney et al., 2013). Varying degrees of hydrological connectedness of wetland patches also creates spatial heterogeneity in water temperature, suspended solids and turbidity, nutrient content, and substrate composition, all of which can influence biodiversity patterns (Amoros and Bornette, 2002).
The unpredictable timing of flood and drought years similarly creates a mosaic of patches at different stages of succession (Bayley and Guimond, 2008; Tockner et al., 2010). Water level directly influences submerged and emergent macrophyte dynamics. Deep, open water habitats are dominated by beds of submerged macrophytes and abundant planktonic communities (Brock et al., 1999). Comparatively, shallow wetlands, often protected from exposure, are characterized by diverse emergent plant communities, floating aquatic plants, and diverse associated vertebrate and invertebrate communities (Brock et al., 1999). As the floodplain shifts between flood and drought years, water levels in the associated wetlands create a changing mosaic of habitats, with the emergent edge community advancing on the submerged macrophyte beds as open water levels decrease (Brock et al., 1999).
Upstream water level manipulation of rivers by dam impoundment alters the natural dynamics of hydrological fluctuations within downstream floodplain wetlands. By reducing water flow through the system, dams and other impoundments can disconnect rivers from their floodplains, and consequently these floodplains no longer receive the seasonal inputs of sediment, nutrients and propagules required for healthy functioning (Kingsford, 2000; Tockner et al., 2008). For example, barriers, including dams, have been shown to impact dispersal of macrophytes (Jones et al., 2020) and migratory fish (Barbarossa et al., 2020), through altered longitudinal and lateral connectivity. Even when the connection between the river and the floodplain remains intact, water level manipulations can homogenize flows into wetlands (Tockner et al., 2008). Through hydropeaking, even run-of-the-river dams can significantly alter downstream hydrology; water may be released at regular intervals or steadily, unlike the variable flood pulses in a natural system (Almeida et al., 2020). In temperate rivers, where ice jams are an important driver of spring flood pulses (Tockner et al., 2010), dams can create physical barriers to ice, altering ice regimes by impacting the probability and location of ice jams, and thus the volume and timing of the spring freshet (Huokuna et al., 2020). Dams also change sediment dynamics in the river by trapping fine sediment behind impoundments, starving them of nutrients and leaving downstream riverbeds composed of greater proportions of gravel (Csiki and Rhoads, 2014). When water is released downstream, as in large flood years, the resulting flow can scour the floodplain (Galat et al., 1998; Csiki and Rhoads, 2014). In many rivers, hydrological isolation, or reduced connectivity of the river and its floodplain has drastically changed the landscape and reduced wetland extent (Galat et al., 1998; Tockner and Stanford, 2002). Altered flood regimes, a decrease in propagule rejuvenation, and a change in sediment composition and nutrient chemistry can create habitats where few species thrive, decreasing biodiversity within the ecosystem.
Due to lack of comparable global inventories, arising partly due to difficulty in determining wetland boundaries, a reliable pre-Anthropocene estimate of wetland extent has yet to be produced (Revenga et al., 2000). After an approximated loss of at least 50% of wetlands in the last century alone (Myers, 1997), current estimates put global coverage at 10% of the earth’s surface, with floodplains comprising 15% of this (Tockner et al., 2008). Over the last three decades, almost 90,000 km2 of permanent surface water has been lost, but overall, surface water has increased, due in large part to the creation of new permanent water bodies as hydropower reservoirs (Pekel et al., 2016). Our human footprint is most apparent in river floodplains; due to increasing human pressure and a desire to train rivers to meet our needs, almost 90% of floodplains in the Northern Hemisphere have been altered to the point of functional extinction (Tockner and Stanford, 2002). In fact, recent floodplain chronostratigraphy work by Brown et al. (2018) states that millenia-long interventions to river-floodplain systems in Europe have altered riverscapes to the point where it is no longer possible to identify their natural state. The prevailing model of lowland meandering channels with silt-clay floodplains may actually be a result of centuries of anthropogenic use, including the construction of weirs and water mills, channel maintenance, controlled flooding and grazing pressure (Varga et al., 2013; Brown et al., 2018). Comparatively, in North America, modifications to rivers and their floodplains have taken place more recently (Brown et al., 2018), suggesting that it could be possible to protect the remaining wild rivers that still maintain connectivity with their floodplains.
The lower Wolastoq | Saint John River watershed is one of the last examples of a largely intact Atlantic river floodplain, acting as a vital reservoir for rare and endangered species and as an important nursery, nesting habitat and flyway for migratory and transitional species (Washburn and Gillis Associates Ltd, 1996). Despite its outstanding conservation value, it has nevertheless been subjected to multiple anthropogenic disturbances in the form of upstream dam construction and major local highway construction against a background of anthropogenic climate warming (Washburn and Gillis Associates Ltd, 1996; Canadian Rivers Institute, 2011; Stantec Consulting Ltd., 2015). In the past century, the hydrologic alteration of the watershed has proceeded during the construction and operation of 11 hydroelectric dams, 3 of which are located on the mainstem of the river (Canadian Rivers Institute, 2011). The most significant of these are Beechwood Hydroelectric Station (“BHS”) and Mactaquac Generating Station (“MGS”). The construction of these run-of-the-river dams in the 1950s and 1960s created large reservoirs and altered downstream hydrology of the river (Canadian Rivers Institute, 2011; Stantec Consulting Ltd., 2015), and while the Wolastoq | Saint John River still maintains connectivity with its floodplain, alteration of water and sediment flows into its floodplain has almost certainly occurred. Like many floodplains globally, the lower Wolastoq | Saint John River and its associated floodplain wetlands, including the Grand Lake Meadows and Portobello Creek wetland complex (collectively denoted as the “GLM complex”) have experienced an increase in the magnitude and frequency of large floods (Canadian Rivers Institute, 2011), thought to be linked to the hydrological alteration of the flood pulse. Understanding the present and future consequences of these hydrological alterations is critical for future mitigation of human impacts on the floodplain in an era of global human-driven climate change.
This study aimed to determine if there are areas that have experienced significant change to floodplain wetland extent associated with major anthropogenic disturbance within the Wolastoq | Saint John River watershed, and to determine if these areas are responding similarly in terms of habitat structure and environmental stressors. This was done by (1) quantifying how wetland habitat has changed over the last 70 years and identifying areas of highest change, (2) examining habitat diversity across the GLM complex and classifying areas that potentially experience higher levels of disturbance, and (3) determining if those high disturbance areas remain protected by current conservation protection measures. In answering these questions, we can identify habitat diversity and disturbance regimes that may dictate how the ecosystem and its communities will respond to future disturbance events. A key outcome of this work is to provide a habitat template for future studies examining the response of biodiversity-ecosystem function relationships to disturbance regimes. This has important policy implications as well, as outcomes may inform policy makers on where best to prioritize conservation efforts.
Materials and Methods
Study Sites
This study was focused on Atlantic Canada’s largest freshwater wetland complex, the Grand Lake Meadows and Portobello Creek wetland complex (the GLM complex; Figure 1). The region is part of the Atlantic Maritime ecozone, with average annual temperature of 5.6 ± 2.9°C and average annual precipitation of 1077.7 mm (Canadian Climate Normals data for station 8101500, calculated between 1981 and 2010; Government of Canada, 2020). The GLM complex is part of the floodplain of the Wolastoq | Saint John River; in the spring, driven by ice jams and the spring freshet, water overflows the banks of the river into the floodplain (Washburn and Gillis Associates Ltd, 1996; Cunjak and Newbury, 2005). Within the floodplain, over 85% of the GLM complex’s 9,000 ha is flooded annually (Washburn and Gillis Associates Ltd, 1996), linking floodplain wetlands with the main river channel and allowing for the replenishment of sediment and nutrients. The annual flood pulse flows into the wetland complex through the westernmost streams and channels, draining from the floodplain back via the Jemseg River to the Wolastoq | Saint John River main channel (Figure 1; Washburn and Gillis Associates Ltd, 1996). Compared to other inland freshwater wetlands in the province, the GLM complex is extremely productive, fueled both by seasonal flooding from the spring freshest and an accelerated biogeochemical cycle from the process of wetting and drying (Washburn and Gillis Associates Ltd, 1996). The floodplain connects the Wolastoq | Saint John River to Grand Lake, the largest lake in the province; this lake is so large that it influences local climate, warming the surrounding area by several degrees, supporting the formation and maintenance of unique habitats for this region of the country, including extensive silver maple swamps (Washburn and Gillis Associates Ltd, 1996; Broster and Dickinson, 2015).
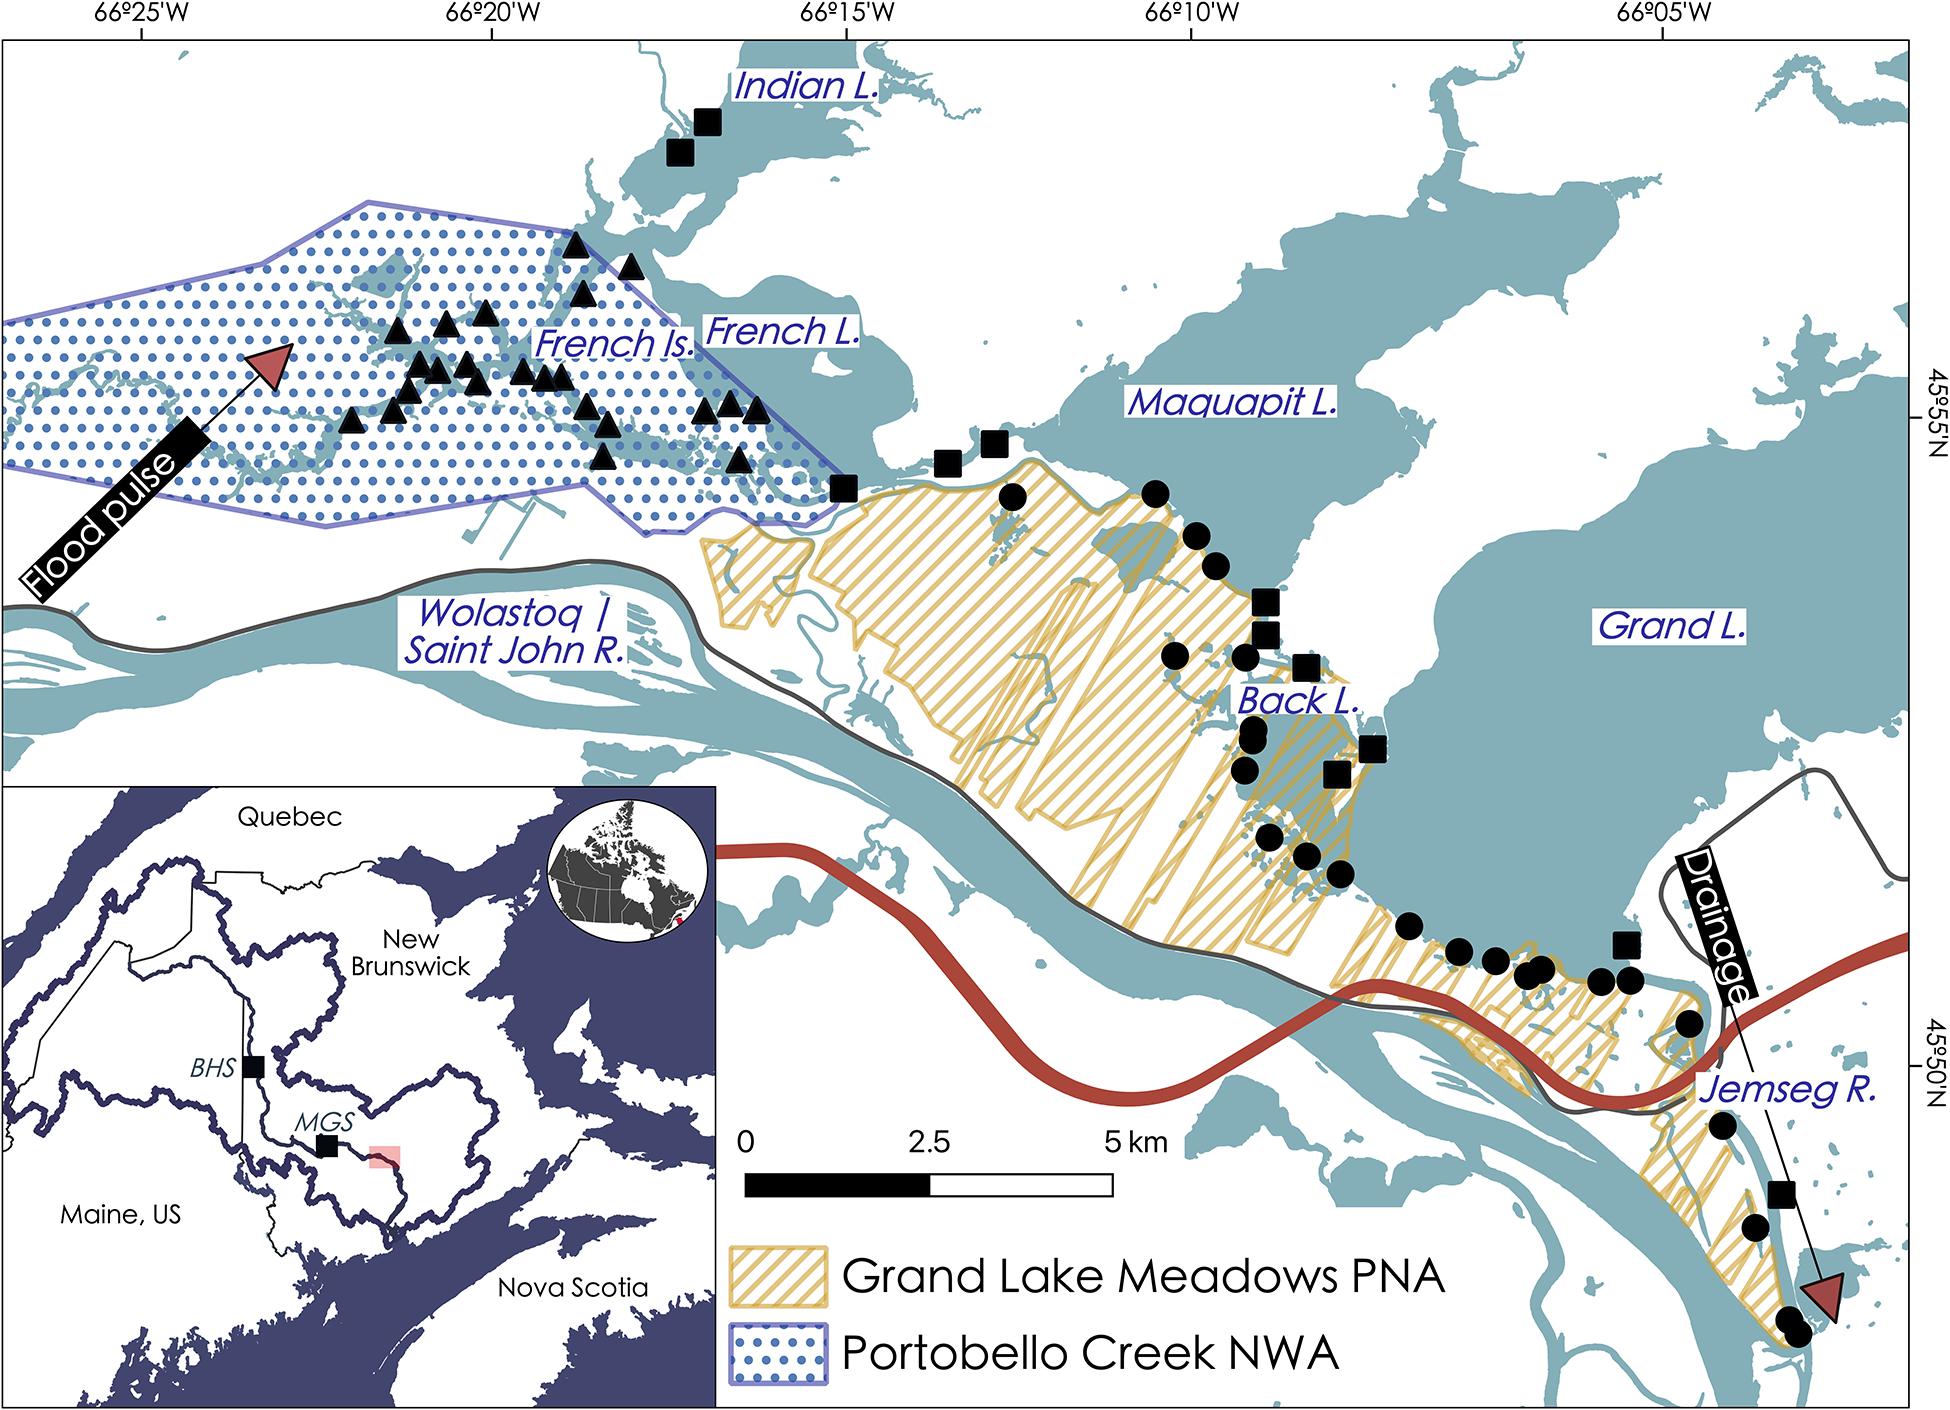
Figure 1. Study sites within the GLM complex relative to different protection strategies, including Portobello Creek NWA (blue) and Grand Lake Meadows PNA (orange). Key locations are labeled. Sites are grouping into Portobello Creek NWA sites (triangles), Grand Lake Meadows PNA sites (circles) and sites in areas of no known protection strategy (i.e., “unprotected”) (squares). The dominant flow of water into the wetland complex during the open water season is outlined by arrows. The old road (not raised and frequently overtopped) and the new Trans-Canada Highway (raised) are depicted in gray and red, respectively. Inset map shows location of sampling (red box) and upstream generation stations (BHS, Beechwood Hydroelectric Station; MGS, Mactaquac Generating Station) in relation to Wolastoq | Saint John River watershed and the mainstem of the river.
As part of the Wolastoq | Saint John River watershed, the GLM complex is subjected to the numerous anthropogenic influences that occur within the riverscape, including upstream dam construction (BHS is located 180 km upstream from the GLM complex and MGS is 45 km upstream), the construction of a new section of the Trans-Canada Highway through the downstream end of the wetland complex (constructed in 2001), agricultural activity, human settlement, and public recreational use. To minimize the potential impact of these threats, portions of these wetlands are protected by the New Brunswick Provincial Government, as the Grand Lake Meadows Protected Natural Area (GLM PNA) and by the Federal Government of Canada, as the Portobello Creek National Wildlife Area (PC NWA) (for more information on permitted activities within these protected areas see Supplementary Table 1). Across the edge of the GLM complex, 60 sites were sampled between June 2017 and August 2017 (Figure 1). Sites were distributed between three levels of protection: (1) unprotected (n = 12), (2) non-contiguous protection (GLM PNA; n = 24), and (3) contiguous protection (PC NWA; n = 24). All sites were accessible by boat from the lake edges but were disconnected from the main channel of the Wolastoq | Saint John River at the time of sampling. Each sampling site represented aquatic wetland habitat, consisting of emergent and submerged macrophytes, and extended from the edge of terrestrial high marsh vegetation to open water. A pair of bamboo poles marked the midpoints for each site and all biotic and abiotic samples were taken within 50 m of these poles for each site.
Determination of Historical Change in Wetland Extent
To determine change in wetland extent across the shoreline of the GLM complex since major human-driven change within the watershed, the historical shorelines were compared for pre- and post-construction of major dams (BHS, constructed in 1957, and MGS in 1968) and a portion of the Trans-Canada Highway (2001) in the Wolastoq | Saint John River watershed. Aerial photographs (processed at 1 m pixel resolution) from 3 years (1951, pre-dam construction; 1983, post-dam/pre-highway; 2014, post-highway; Figure 2) were obtained from the New Brunswick Department of Natural Resources and Energy Development, digitized, and georeferenced using ArcGIS (version 10.6.1; Environmental Systems Research Institute [ESRI], 2018) with a minimum of 10 control points per photograph. The shoreline for each year was digitized, closely following the wetland edge at a 1:25 scale, with a starting distance of 1.6 m between points, with quality control checks performed at regular intervals. An onshore baseline (Figure 2) from which to correct and measure historical shorelines was manually created with a new feature class in ArcGIS (version 10.6.1; Environmental Systems Research Institute [ESRI], 2018) following the recommendations of the USGS Digital Shoreline Analysis software protocol (Himmelstoss et al., 2018); subsequently, all measurement transects extended orthogonally from the baseline.
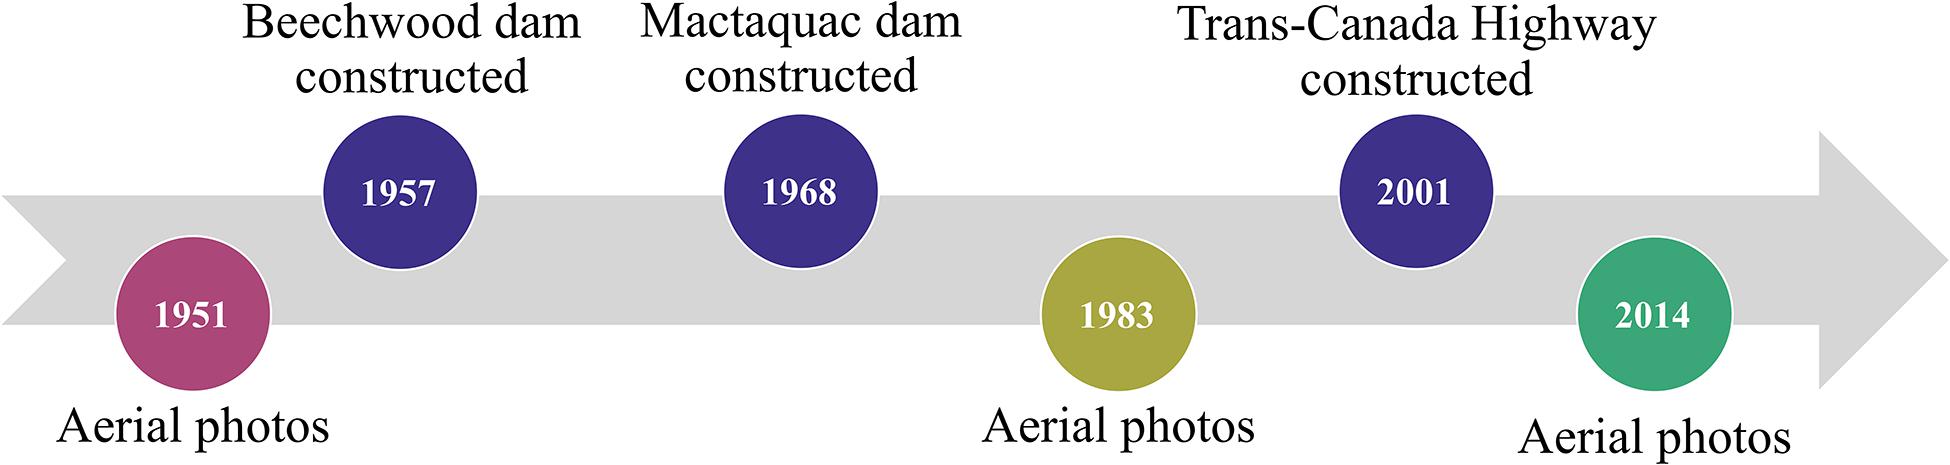
Figure 2. Timeline of local anthropogenic alteration within the lower Wolastoq | Saint John River and the aerial photographs of the GLM complex which were digitized and used to assess historical change to wetland extent.
Since the aerial photographs were taken in different seasons depending on the year, the water levels for all shorelines required correction to a common mean water level (MWL). Final points along these lines were adjusted using the one-line shift method developed by Chen and Chang (2009), which shifts extracted shorelines on three sequential images to the corresponding shorelines based on MWL. The MWL was calculated for the open water season (May– October) between 2001 and 2017 for the Jemseg River (01AO004; mean=1.734m) and Lakeville (01AO010; mean=1.810m) gauging stations; these data were accessed through the HYDAT database available from the Water Survey of Canada (2017). The 1950s photographs were taken before the Lakeville and Jemseg River gauges started recording so data were infilled using a regression between the two GLM complex gauges (01AO010 and 01AO004) and a nearby gauging station in Fredericton (01AK003) using all available open water data. Seventy percent of the data were randomly assigned to be used for calibration and 30% were saved for model validation, and the models were assessed using the Nash-Sutcliffe coefficient (Nash and Sutcliffe, 1970; 01AO010: calibration = 0.96, validation = 0.95; 01AO004: calibration = 0.94, validation = 0.93) and Root Mean Square Error (RMSE; 01AO010: calibration = 0.05 m, validation = 0.05 m; 01AO004: calibration = 0.03 m, validation = 0.04 m).
Perpendicular transects were generated every 25 m along the common onshore baseline and extended through all corrected historical shorelines (Figure 3). Shoreline change was measured for each perpendicular transect from the baseline to the shoreline and the change between 1951 and 1983, 1983 and 2014 and overall change (1951–2014) was calculated (Figure 3). For each set of measurements along a transect, the change was ranked from largest (1) to smallest (3) to compare during which period the most change occurred across a gradient of magnitudes. A categorical scatterplot (also known as a dot plot) was made with the resulting data to visualize how shoreline change was distributed across the time periods, with each measurement represented as an individual dot on the plot, and measurement classes grouped into bin sizes [plot made with the ggplot2 package (version 3.2.1; Wickham, 2016) in R (version 3.5.3; R Core Team, 2019)]. The y-axis was log-scaled for easier visualization of the extreme ends of the data. To visualize historical change across the time periods, ArcGIS (version 10.6.1; Environmental Systems Research Institute [ESRI], 2018) was used to extend the calculated differences were along the baseline, splicing the polyline at each transect and applying the calculated value to that section; no values were assigned outside of a 200 m buffer around a given transect and areas without available measurements were assigned as “no data.” Historical change values that were negative and positive were classified as “erosion” and “accretion,” respectively.
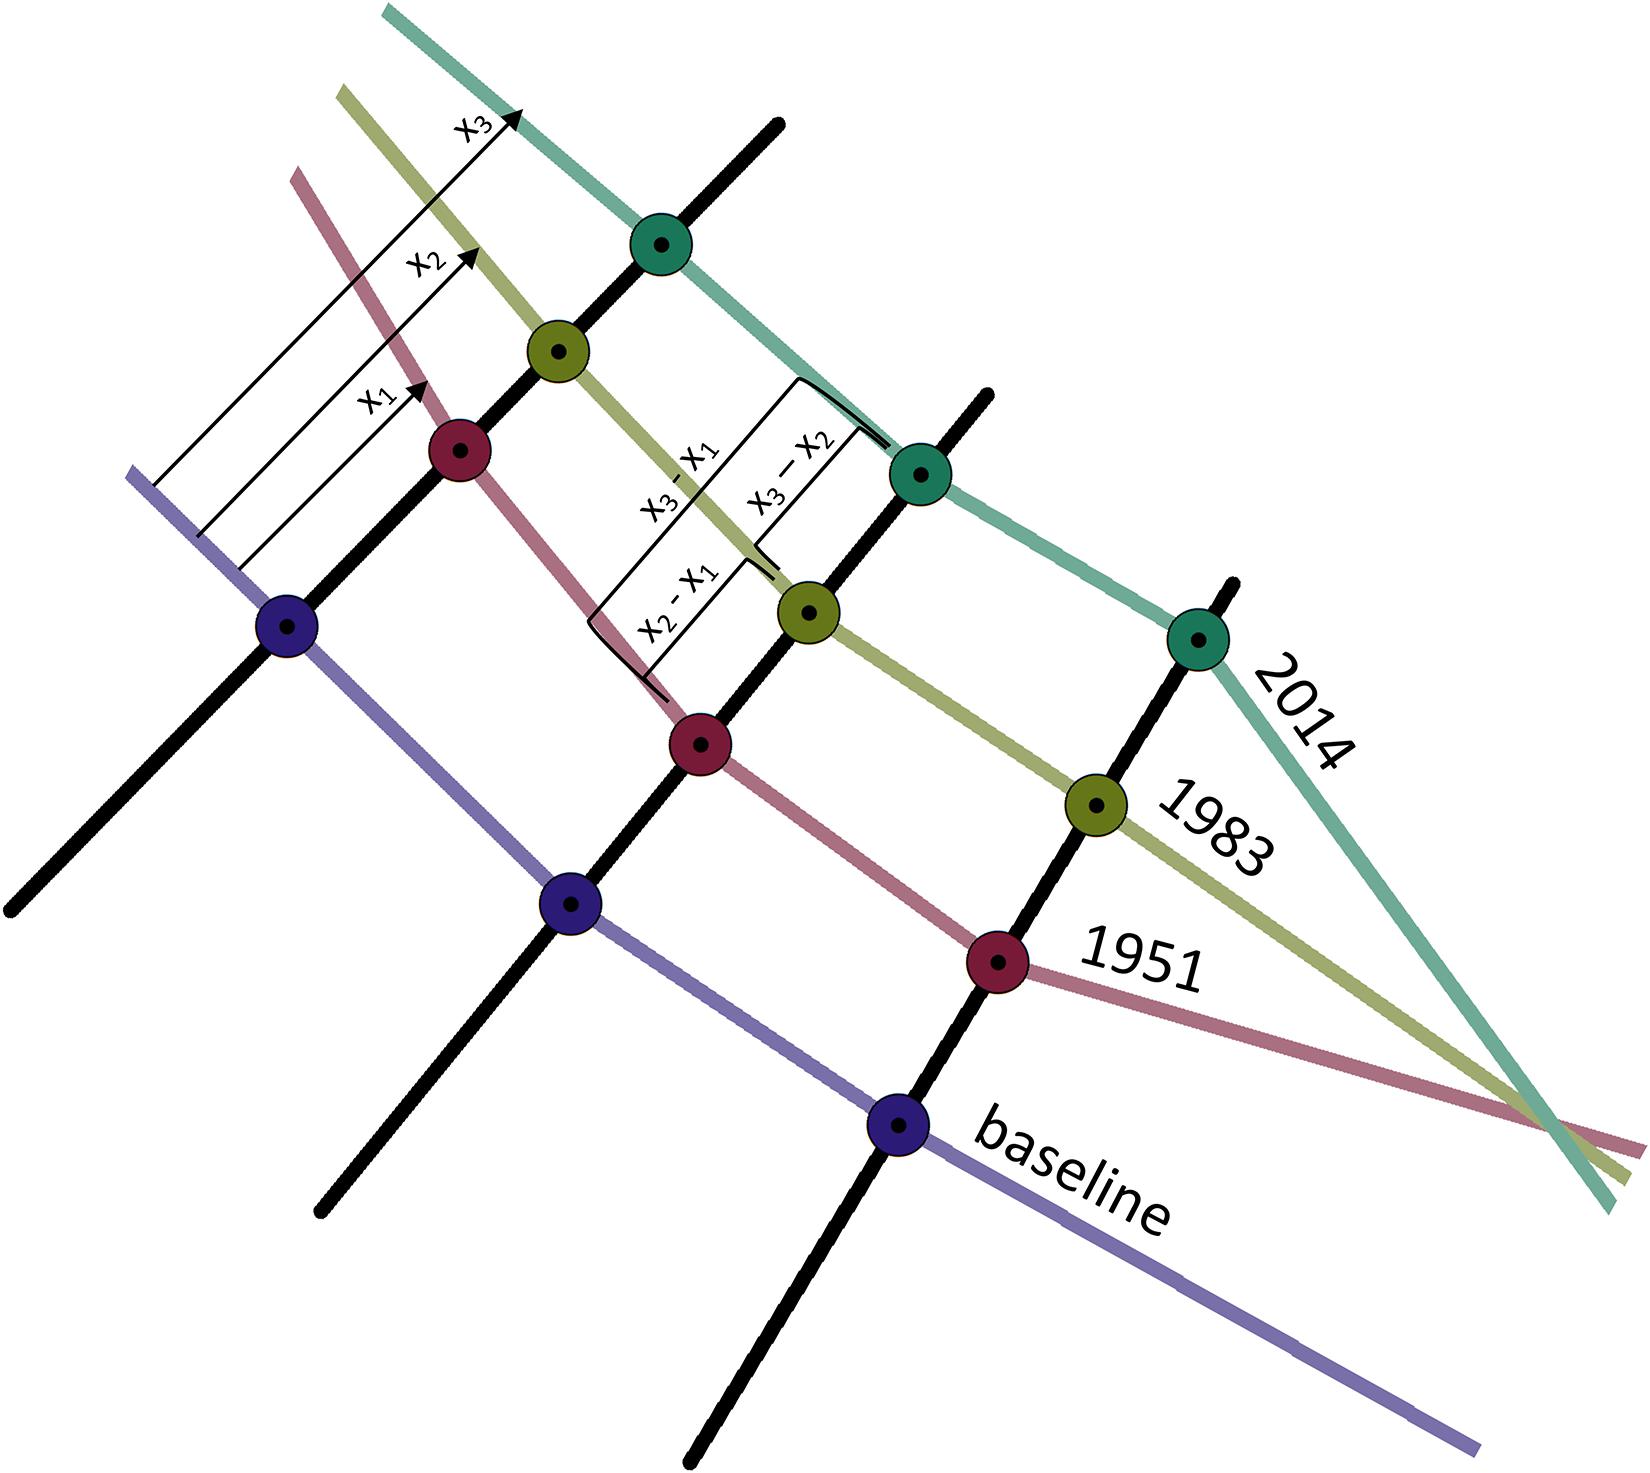
Figure 3. Diagram depicting how historical change of wetland extent within the GLM complex was measured from the corrected shorelines derived from aerial photographs. Shorelines were calculated for the edge of the wetland where sites are shown in Figure 1. Transects extended from a manually created baseline through shorelines, resulting in measurements between 1951 and 1983 (x2 – x1), 1983 and 2014 (x3 – x2), and overall change (x3 – x1).
Examination of plots of historical change across the time periods showed that extreme erosion or accretion events appeared to differ between time periods. To test this, the data were first filtered to areas that were exhibiting sensitivity to extreme change, defined as over 30 m of either erosion or accretion aligning with natural break points for at least one time period per transect. Data were separated for testing of erosion and accretion between the two periods, where erosion was hypothesized to be highest between 1951 and 1983 (n = 381 transects/period) and accretion was hypothesized to be highest between 1983 and 2014 (n = 459 transects/period) based on visual inspection of the plots of historical change. Both models violated parametric assumptions (Shapiro-Wilk normality tests: accretion p < 0.001, erosion p < 0.001; Levene’s Test for Homogeneity of Variance: accretion p = 0.0027, erosion p = 0.6345), and so a paired, one-tailed Wilcoxon Signed-Rank test was performed for each in R (version 3.5.3; R Core Team, 2019) to test if change differed between periods.
Abiotic Variables
Grab samples for water chemistry were collected using the Canadian Aquatic Biomonitoring Network (CABIN) wetland protocol standard operating procedures (Armellin et al., 2019) in June and July 2017, 1 month apart (N = 2 sets of water samples per site; triplicate samples collected at 10% of sites), and analyzed at the Environment and Climate Change Canada’s National Laboratory for Environmental Testing (NLET) for a standard suite of ions, metals, and nutrients (Environment and Climate Change Canada’s National Laboratory for Environmental Testing, 2013). Due to the likelihood of fluctuations of spot measurements across space and time, measurements for each site were averaged prior to analysis. For a full analyte list of measured abiotic variables (see Supplementary Tables 2, 5).
Grab samples of wetland sediment (N = 1 per site; triplicate samples collected at 10% of sites) were collected following CABIN wetland protocol standard operating procedures (Armellin et al., 2019) and stored in the refrigerator in glass containers until transferred to RPC laboratory- New Brunswick’s provincial research organization- in Fredericton, NB for analyses. Following EPA standards (United States Environmental Protection Agency, 1996) samples were analyzed for trace elements, total organic, and inorganic carbon, grain size, and composition (sand, silt, gravel, and clay).
The temperature profile of sites was measured over the sampling period using HOBO pendant temperature loggers (P/N UA 001 64) set to record every 5 min for the duration of the sampling period. Hourly water depth measurements were taken from HOBO water level loggers (range 0–4m, P/N 20-001-04) randomly assigned to 22 sites across the wetland complex; a total of 5 additional loggers were attached at known heights in the air in each lake or water body (corresponding to labeled water bodies in Figure 1) as calibration for air pressure. Water depth at sites without loggers was assigned from the nearest logger location. A suite of hydrologic variables was calculated from water depth data using the Indicators of Hydrologic Alteration software (Richter et al., 1996).
Macrophytes
Sampling for the submerged plant community (defined as aquatic vegetation that were either whole submerged or floating, and could be rooted or unrooted) was conducted by 2 observers for 15 min, sweeping in concentric rings around the poles (center of the site), as far as water depth allowed. If richness and abundance were so low that sampling had extended beyond the defined 50 m diameter of a site and no new morphotypes were found in 5 min, sampling was stopped, and the time and distance recorded. All unique morphotypes were collected for identification; the top three dominant species were designated, and the percent cover was estimated for each. Total percent cover was estimated by each observer and all numbers were compared for congruency. Emergent plant communities (comprising individuals with roots in the sediment, but the majority of the plant out of water) were assessed for the whole 50 m diameter site, focusing along the boundary between aquatic and terrestrial ecosystems. Specimens were collected of the top three dominant species, and their percent cover across the site was estimated.
Representative specimens of each macrophyte species present were collected and preserved as voucher specimens for subsequent taxonomic assessment. A subset of the voucher specimens collected were selected for subsequent genetic analysis to establish a reference specimen collection that was used to guide morphological based taxonomic identifications. For genetic analysis of reference specimens, dehydrated leaf tissue was sent to Canadian Centre for DNA Barcoding (CCDB) for DNA extraction, PCR amplification, and sequencing according to CCDB standardized protocols (Fazekas et al., 2012). To facilitate comparison of the genetic results with taxonomic data available on GenBank (NCBI Resource Coordinators, 2017) and the Barcoding of Life Data System (Ratnasingham and Hebert, 2007) two standard land plant DNA barcode markers, rbcLA and ITS2, were selected (Fazekas et al., 2012).
Visualizing Disturbance Regimes and Habitat Patches
All analyses and data visualization were completed in R (version 3.5.3; R Core Team, 2019). We reduced the number of abiotic variables based on Pearson correlation coefficients (R > 0.70; standard cutoff for a “strong correlation”; e.g., Dormann et al., 2013) retaining, among pairs, variables deemed the most ecologically relevant or having higher between-site variance. Variables were z-score standardized before Principal Components Analysis (PCA) using the FactoMineR package (version 2.3; Lê et al., 2008) to examine how environmental variables differed across the study area. PCA output was plotted on axes PC1 and PC2 as these had the most explanatory power with the factoextra package (version 1.0.5; Kassambara and Mundt, 2017). Hierarchical cluster analysis in vegan (version 2.5-4; Oksanen et al., 2019) was then performed to examine how environmental variables influenced the grouping of wetland sites, using the complete linkage method, which produces compact clusters with high similarities. Preliminary testing to determine the optimal clustering scheme was done using NbClust (version 3.0; Charrad et al., 2014), which tests all combinations of cluster numbers, distance measures and clustering methods; the majority of the produced metrics (8 out of 23) showed that the optimum number of clusters for analysis was three. A heatmap of the results, standardized to scale abiotic variables, was made to visualize results.
Habitat patches and spatial heterogeneity of patch quality in wetland habitat across the landscape was visualized by making individual radar plots for each site using the fmsb package (version 0.6.3; Nakazawa, 2018). Variables that were thought to have the most significant impact on biodiversity (e.g., Chipps et al., 2006) were chosen for the plot and z-score standardized to ensure that they were on the same scale; variables included in the plots were: silt, sediment and water metals (comprised of PCA axes as outlined below), overall change in shoreline location (absolute values), low pulse duration, the coefficient of variation for water temperature, macrophyte richness, macrophyte total percent cover, percent organic carbon in the sediment and total dissolved aquatic phosphorus. Sediment and water metal inputs were reduced for correlations above a Pearson correlation coefficient of 0.70 and condensed onto principal components axes (PC1 for each, with the sediment PC1 capturing 38.20% of the variance, and the water PC1 representing 44.87%) where higher values indicated increased metal concentrations. To examine differences among the three protection strategies, a separate radar plot was made using the mean values for each of the strategies.
Results
After adjusting for differences in water levels across the years of aerial imagery, change in wetland extent across the GLM complex ranged from accretion of 400 m to erosion of −1450 m (mean = −6.48, SD = 83.41, N = 2,500 transects; among all 1951–2014 data). If change had continued in the same direction over the measured time periods, then the overall change was ranked highest for each transect; indeed, this is the case for most measurements, as indicated by the plot’s teal coloring (Figure 4). High erosion (over 30 m) occurred between 1951 and 1983, which can be seen by the shift from yellow (lowest rank change) to dark blue (second rank; n = 381 transects, Z = −14.19, p < 0.001). The areas of highest erosion (depicted in shades of yellow to dark red according to magnitude) were located in backwater areas, such as in the coves off the west bank of the Jemseg River, Back Lake and Portobello Creek (Figure 5A).
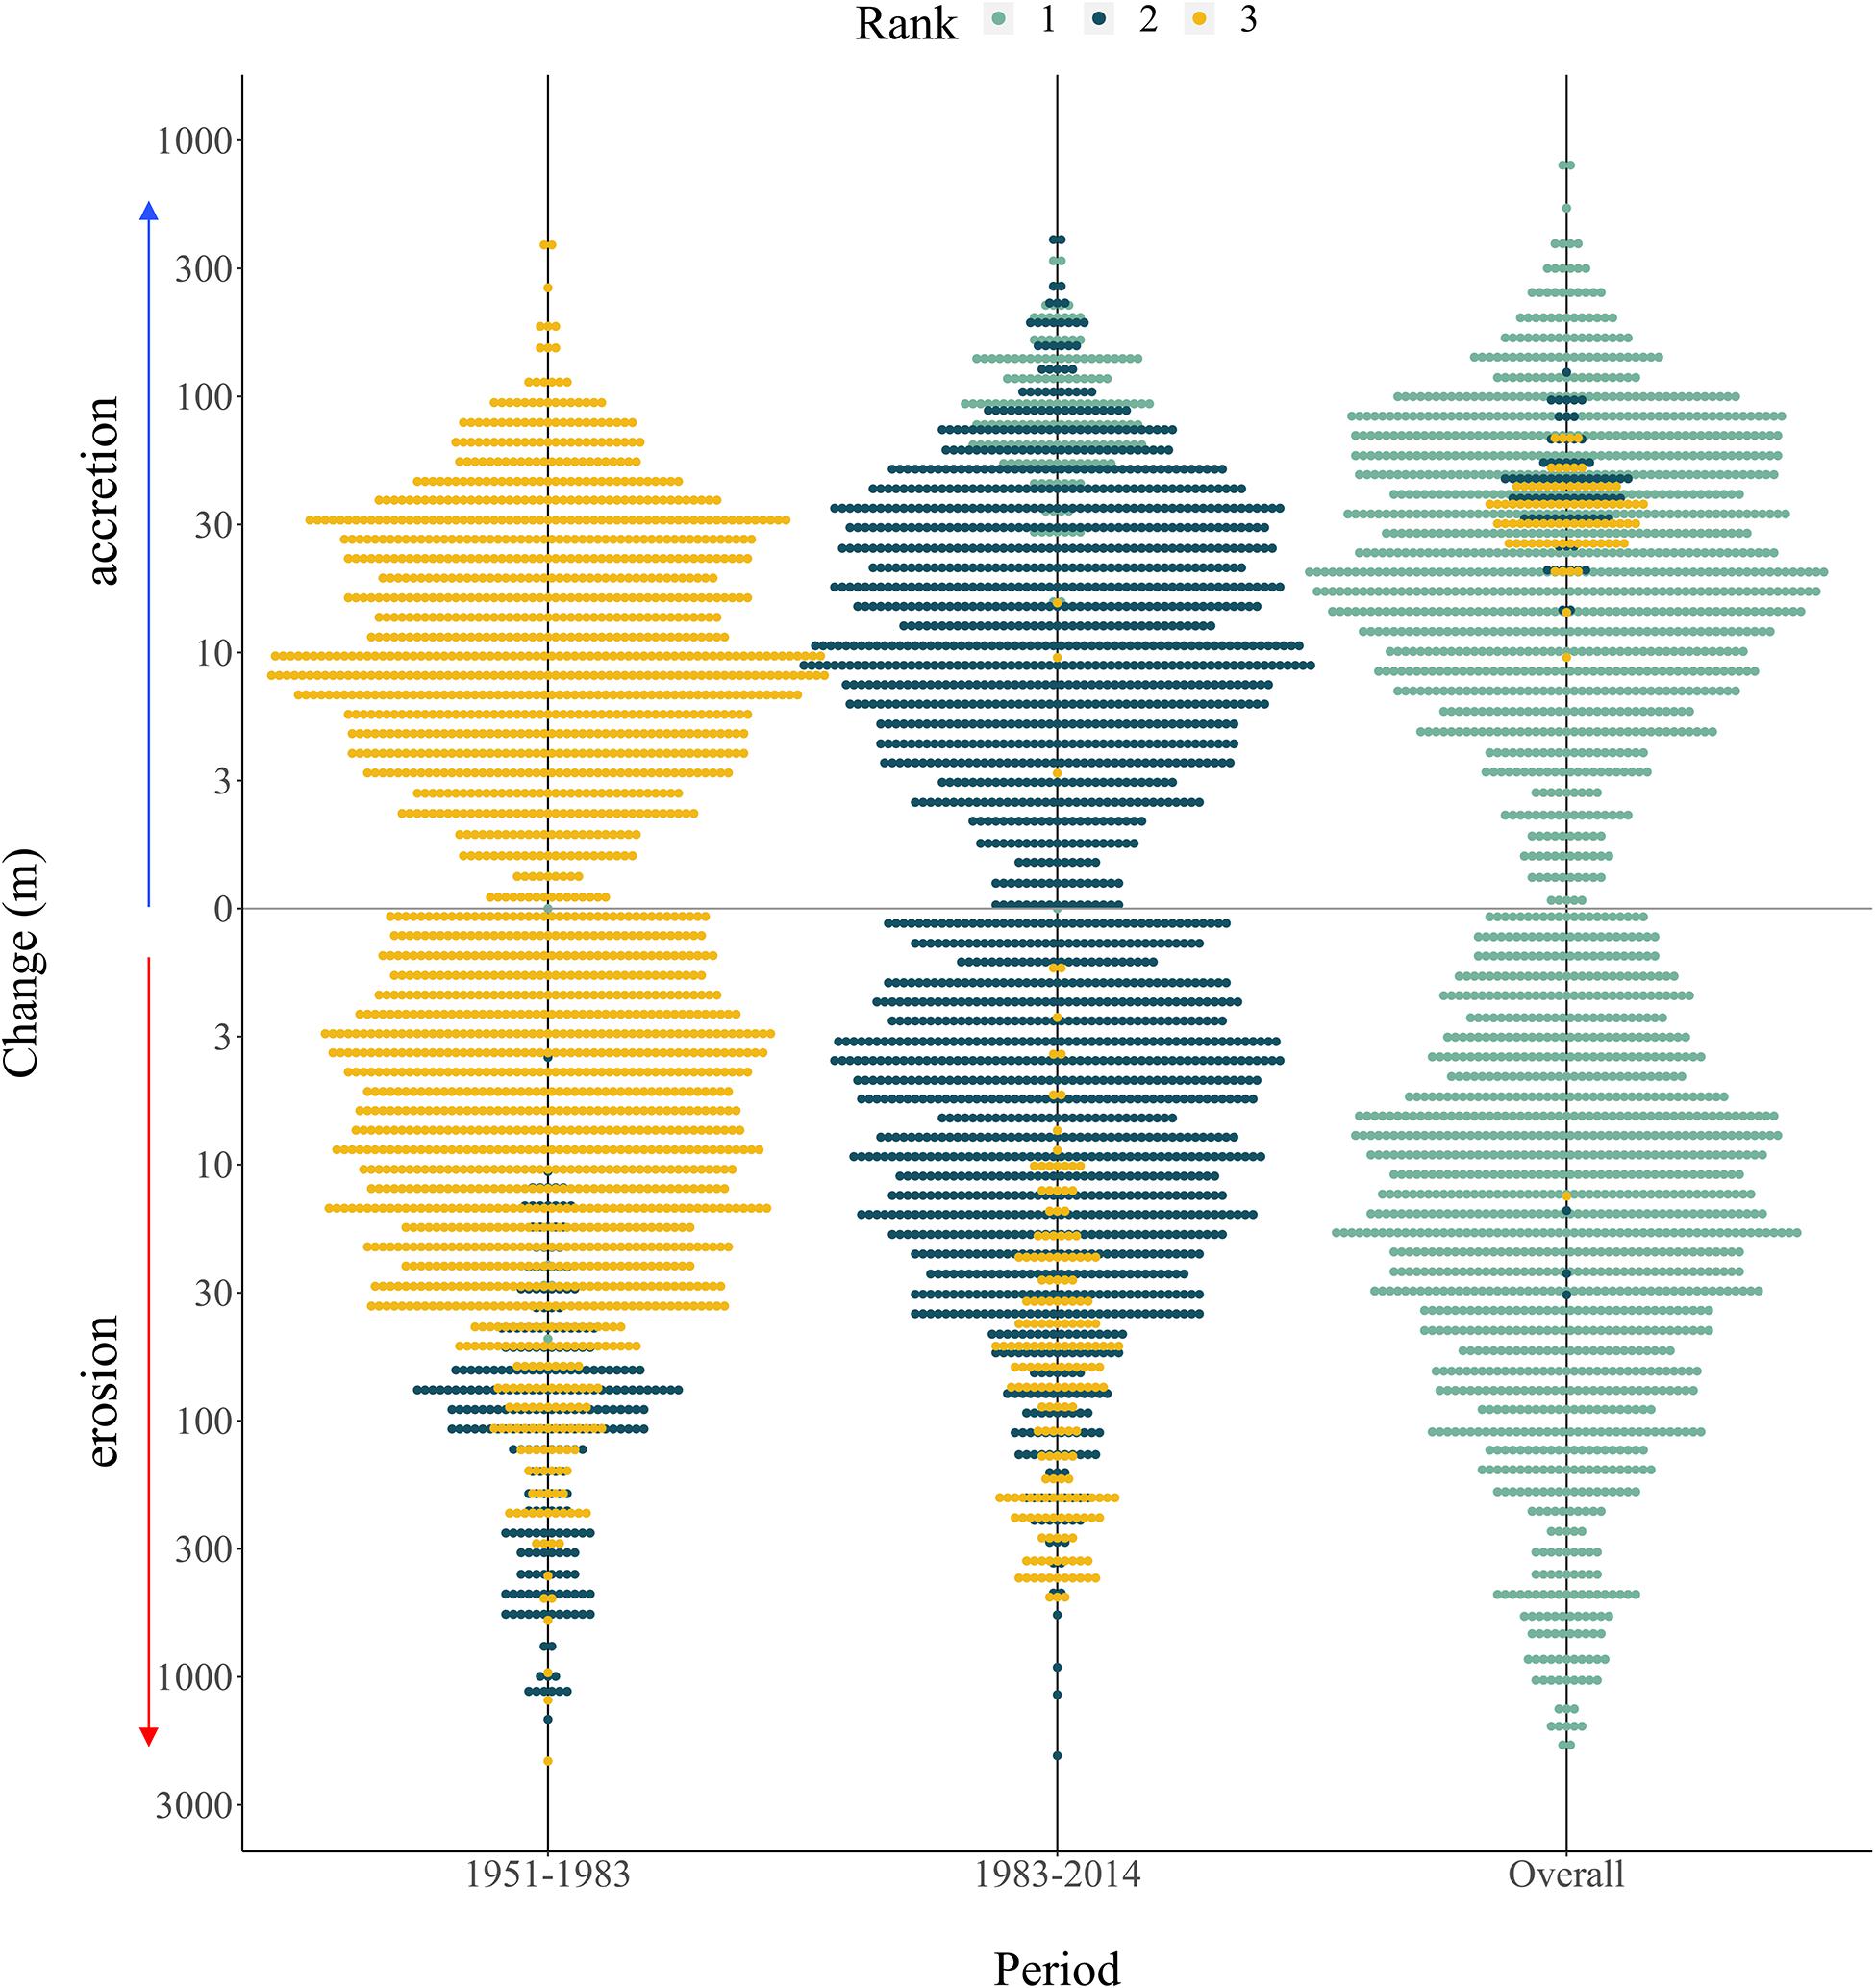
Figure 4. Categorical scatterplot summarizing change in wetland extent in the GLM complex across measured time periods, showing which periods experienced the most erosion and accretion. At each measured point, the change between the periods was ranked, with a rank of 1 assigned to the period with the highest change. If change magnitude increased in the same direction (either erosion or accretion) then “overall change” would have a rank of 1 (i.e., highest change). Each dot represents a single measurement between shorelines, with wider bars indicating more measurements for that size bin. The y-axis was log-scaled for easier visualization of the extreme ends of the data.
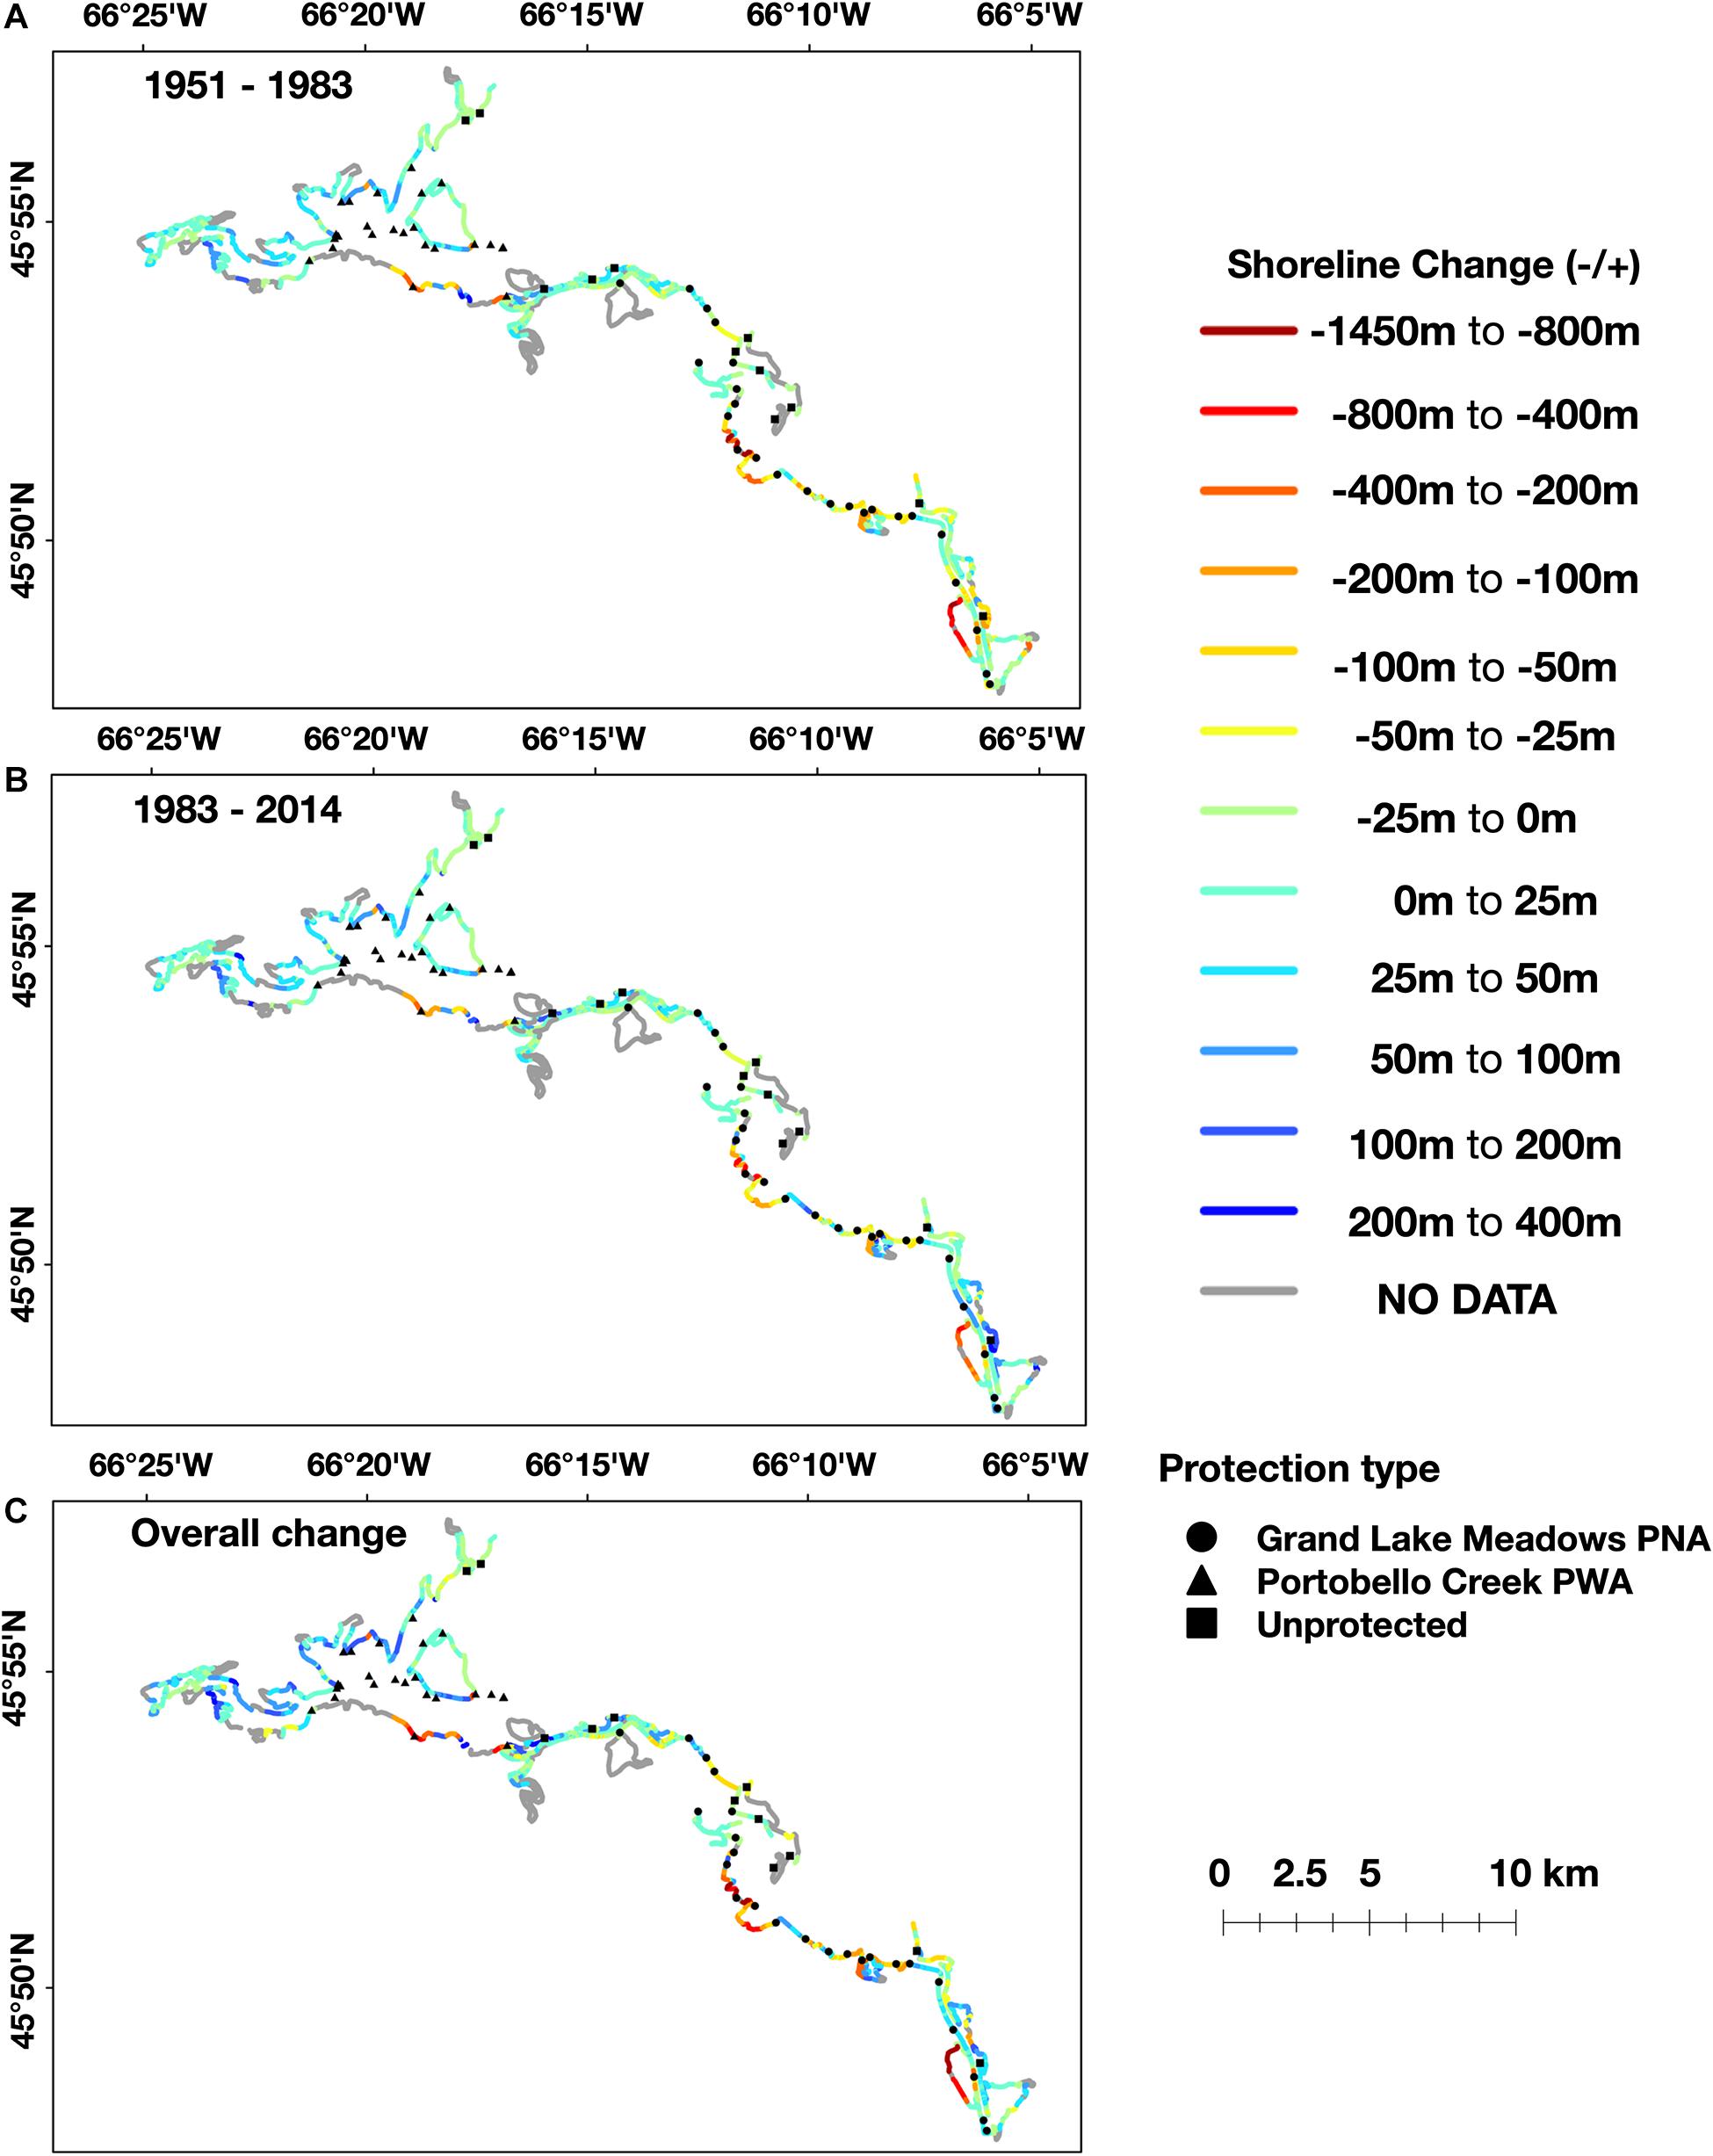
Figure 5. Visualization of measured change in wetland extent in the GLM complex across periods of major anthropogenic change within the watershed, showing the difference between 1951 and 1983 (A), 1983 and 2014 (B), and overall cumulative change (C). Sampling sites from 2017 are plotted on the maps to show distribution across different levels of historical change.
Small shoreline changes (30m) were greater between 1983 and 2014 than from 1951 to 1983, as shown by the measurements plotted in dark blue (Figure 4). These areas are plotted in shades of green on the maps and tend to extend over the edges of large lakes, such as Maquapit Lake and French Lake. Significant accretion (over 30 m) was evident through the period of 1983–2014, particularly across the Jemseg River area (Figure 5B; n = 459 transects, Z = −18.60, p < 0.001). During this period certain areas that had started to erode between 1951 and 1983, shifted and started to increase in their extent as they accreted sediment. This shift can be seen most clearly in the wetlands off the west bank of the Jemseg River, with shoreline changes from orange (erosion of −50–200 m) to dark blue (accretion of 100–400 m). Other areas of accretion, shown in shades ranging from aqua to dark blue, were evident across all time periods within the side channels of PC NWA (Figure 5C).
The first three axes of a Principal Components Analysis (PCA) explained 43.6% of the variation of abiotic variables among sites: PC1 explained 19.9%, PC2 explained 14.5%, and PC3 explained 8.3% of the variance (Figure 6). PC1 shows separation of samples based on micro- and macronutrients, with high scores aligning with increased dissolved nitrogen and total phosphorus concentrations in water samples, and increased molybdenum, potassium, aluminum and iron concentrations in sediment samples; low scores were associated with higher concentrations of barium (Figure 6). PC2 shows a separation of geographic regions of the GLM complex from east (low scores, areas plotted in shades of blue) to west (high scores, areas plotted in shades of pink; Figure 6). The variables most contributing to this axis were water temperature and metals, with low scores associated with maximum water temperature and high scores associated with alkalinity, minimum temperature, molybdenum and sodium concentrations in the water, and boron, magnesium and zinc concentrations in the sediment.
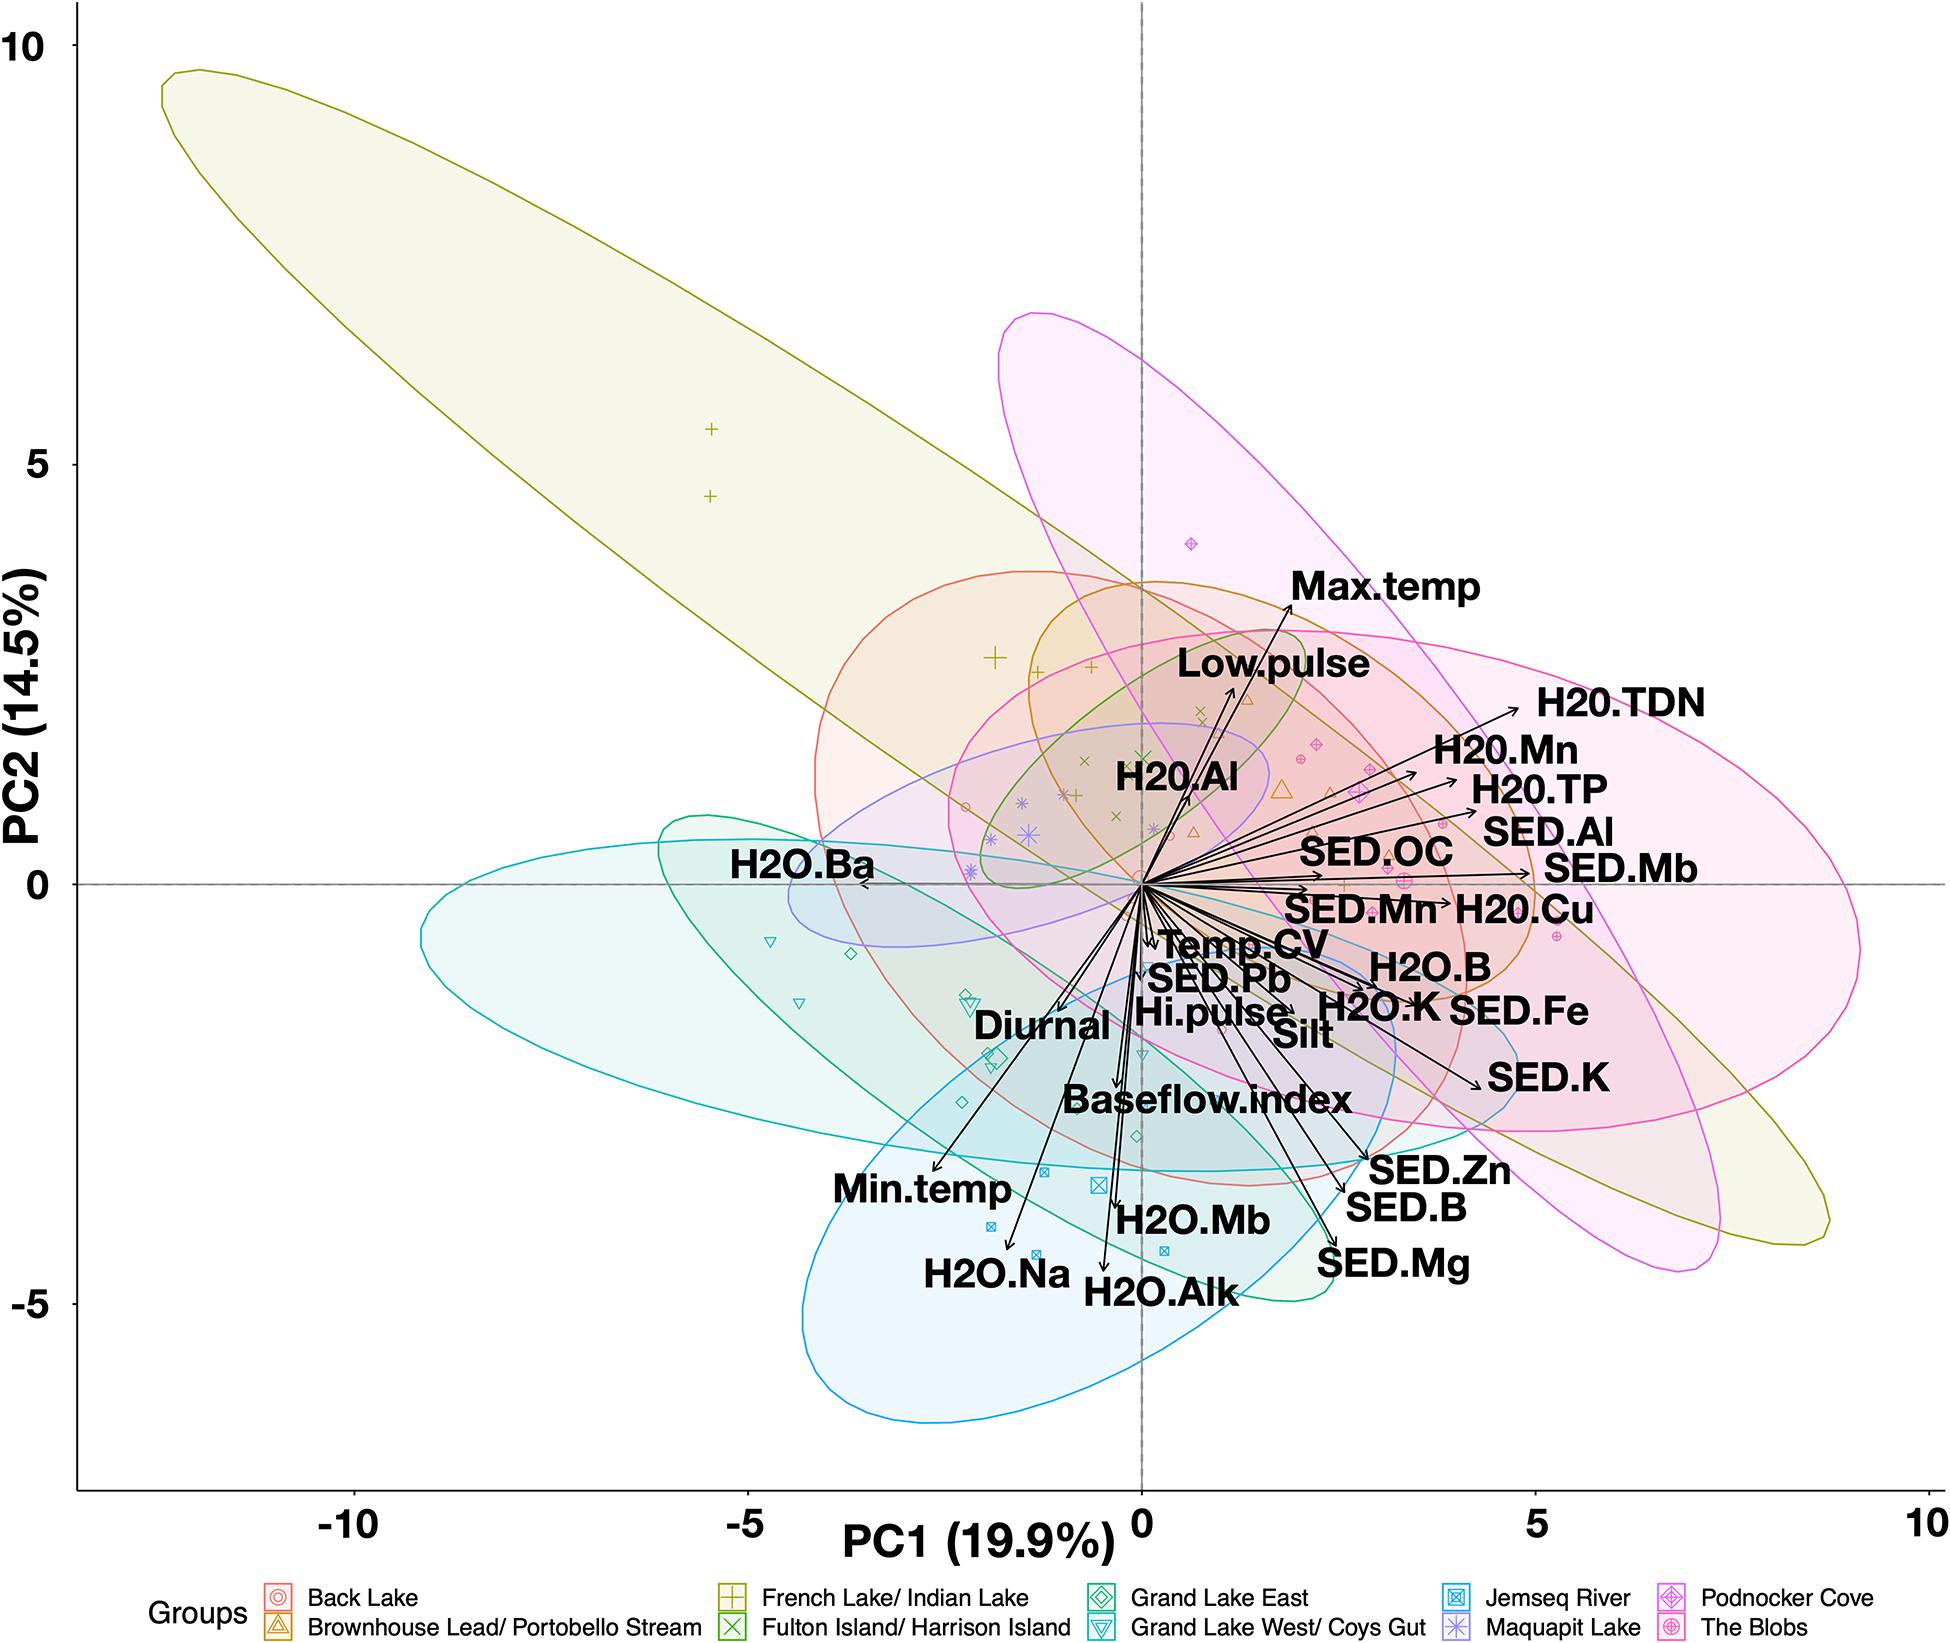
Figure 6. Principal Components biplot projecting axes PC1 and PC2 for abiotic variables across 2017 sampling sites in the GLM complex. All variables were reduced first from correlations for below 0.7 collinearity before being subjected to the PCA. Sites are colored by geographic area with pink sites located furthest west within Portobello Creek and blue sites located in the east toward Grand Lake and Jemseg River. Acronyms for specific input variables listed in Supplementary Table 6.
Cluster analysis grouped sites first by sediment iron, molybdenum and aluminum concentrations: sites located on French Island (P55 and P53) and two sites located at far ends of coves within PC NWA (P39 and P46) having the highest levels of the metals, shown in shades of blue near the bottom of the plot (Figure 7). The rest of the sites had generally lower concentrations, as depicted by the red coloring on the plot (Figure 7), with a sub-cluster of sites that were located along large lake edges and the edge of the Jemseg River consistently showing the lowest concentrations of sediment aluminum and molybdenum, visible as bands of dark orange (G17, G21, G23, G12, G05, U34, G19, G11, G16, U31, G10). The next significant cluster grouped the most northerly located sites, found in Indian Lake (U36 and U32) with the lowest levels of iron, aluminum, magnesium, potassium and boron in their sediment (shown in dark red and burgundy). These sites also had similar levels of other environmental variables, such as molybdenum, potassium, nitrogen, copper, and barium concentrations in the water, molybdenum concentration and percent organic carbon in the sediment, and alkalinity, base flow rate and high pulse duration. Sites appeared to be grouped more by their hydrology and connectivity within the floodplain, than by geographic relationship alone.
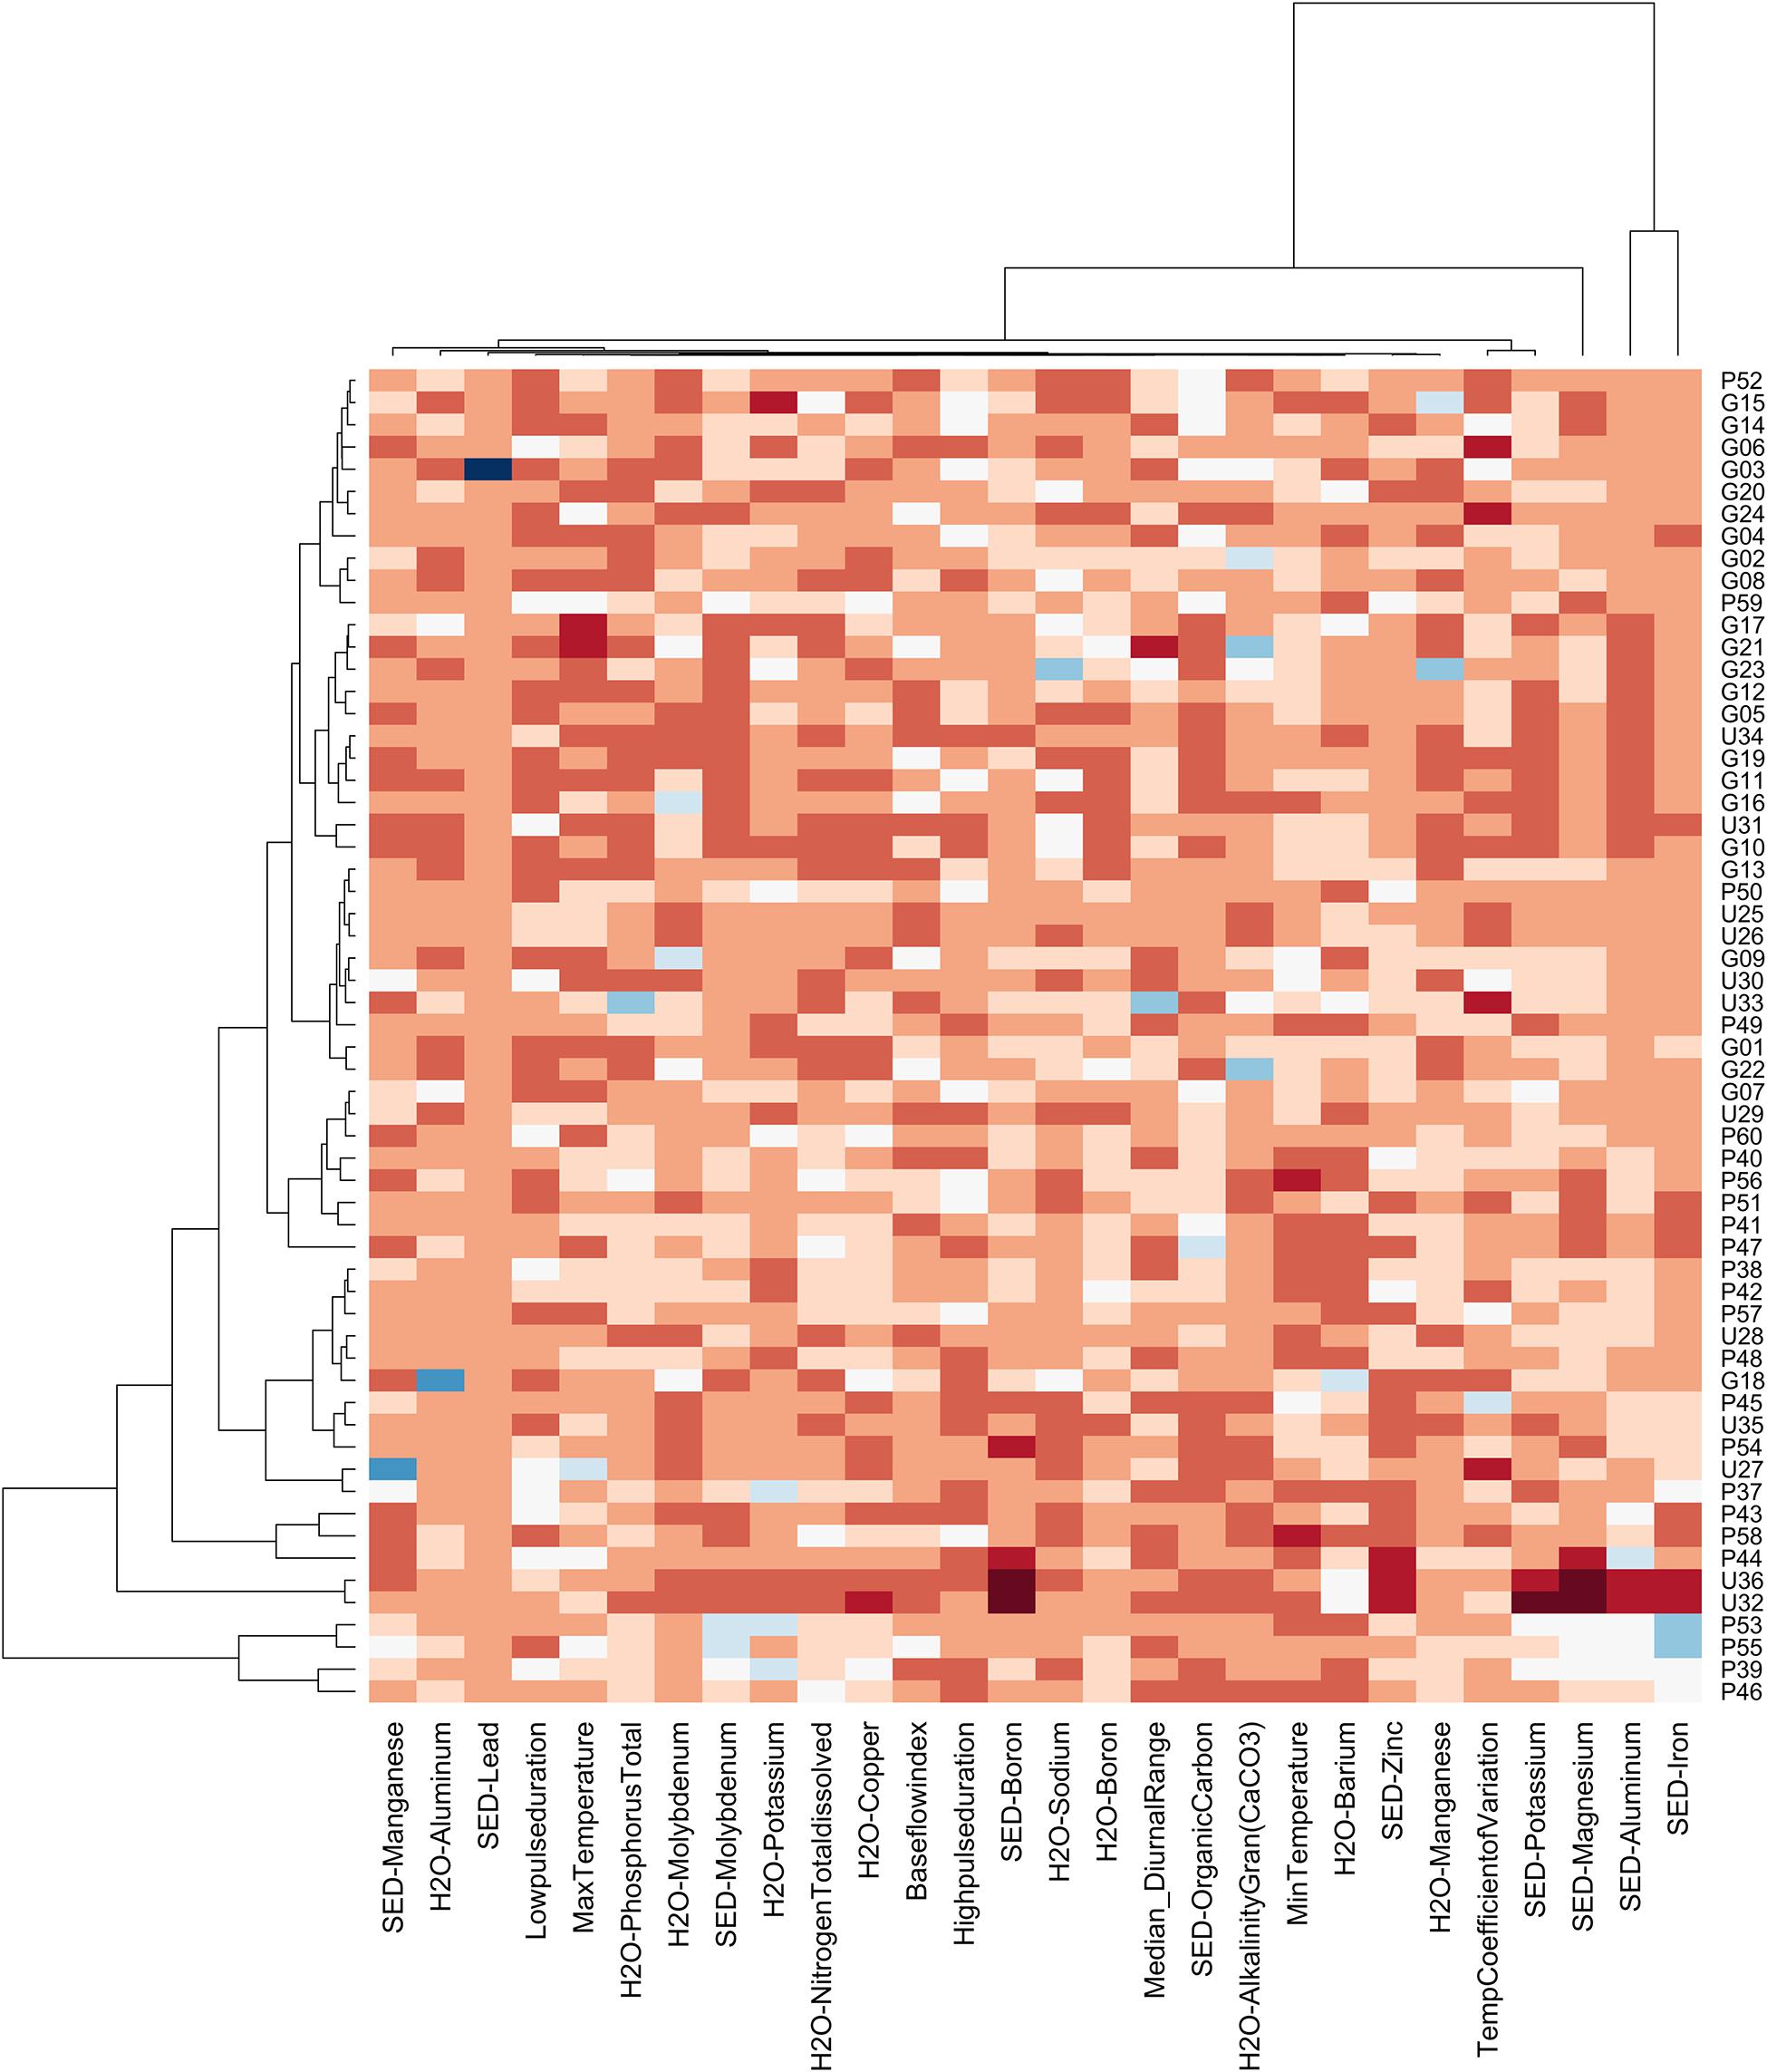
Figure 7. Heat Map showing natural groupings of sampling sites in the GLM complex by abiotic variables with cluster analysis. All abiotic variables were reduced for correlations above 0.7; cells are colored according to their standardized value with lowest values depicted in dark red and highest in dark blue.
Radar plots for each site are consistent with sites grouping by hydrologic connectivity (Figure 8). Sites in PC NWA had higher levels of most variables, particularly phosphorus, sediment and water metal and organic carbon, as indicated by the overall larger area of the individual radar plots, as well as the mean values for the whole protection level compared to GLM PNA and unprotected sites. The sites in PC NWA are more protected from wave exposure, as are the other sites that follow the same pattern of high overall levels of the chosen abiotic variables. Sites located along the edge of the large lakes, namely Indian Lake, Maquapit Lake and Grand Lake tended to have smaller radar plot areas overall, i.e., lower relative levels of measured variables. These sites tended to be located within the GLM PNA, where, compared to other protection levels, sites had on average lower levels of phosphorus, low pulse duration and silt. Unprotected sites, which were scattered throughout the study area, had a range of habitat patches, with the mean showing the lowest levels of water and sediment metals and organic carbon. Macrophyte richness and cover, overall historical change and the coefficient of variation of water temperature were similar across the GLM complex, regardless of protection level, suggesting that these variables are driven by the patchiness of flood pulse dynamics, rather than geographic proximity.
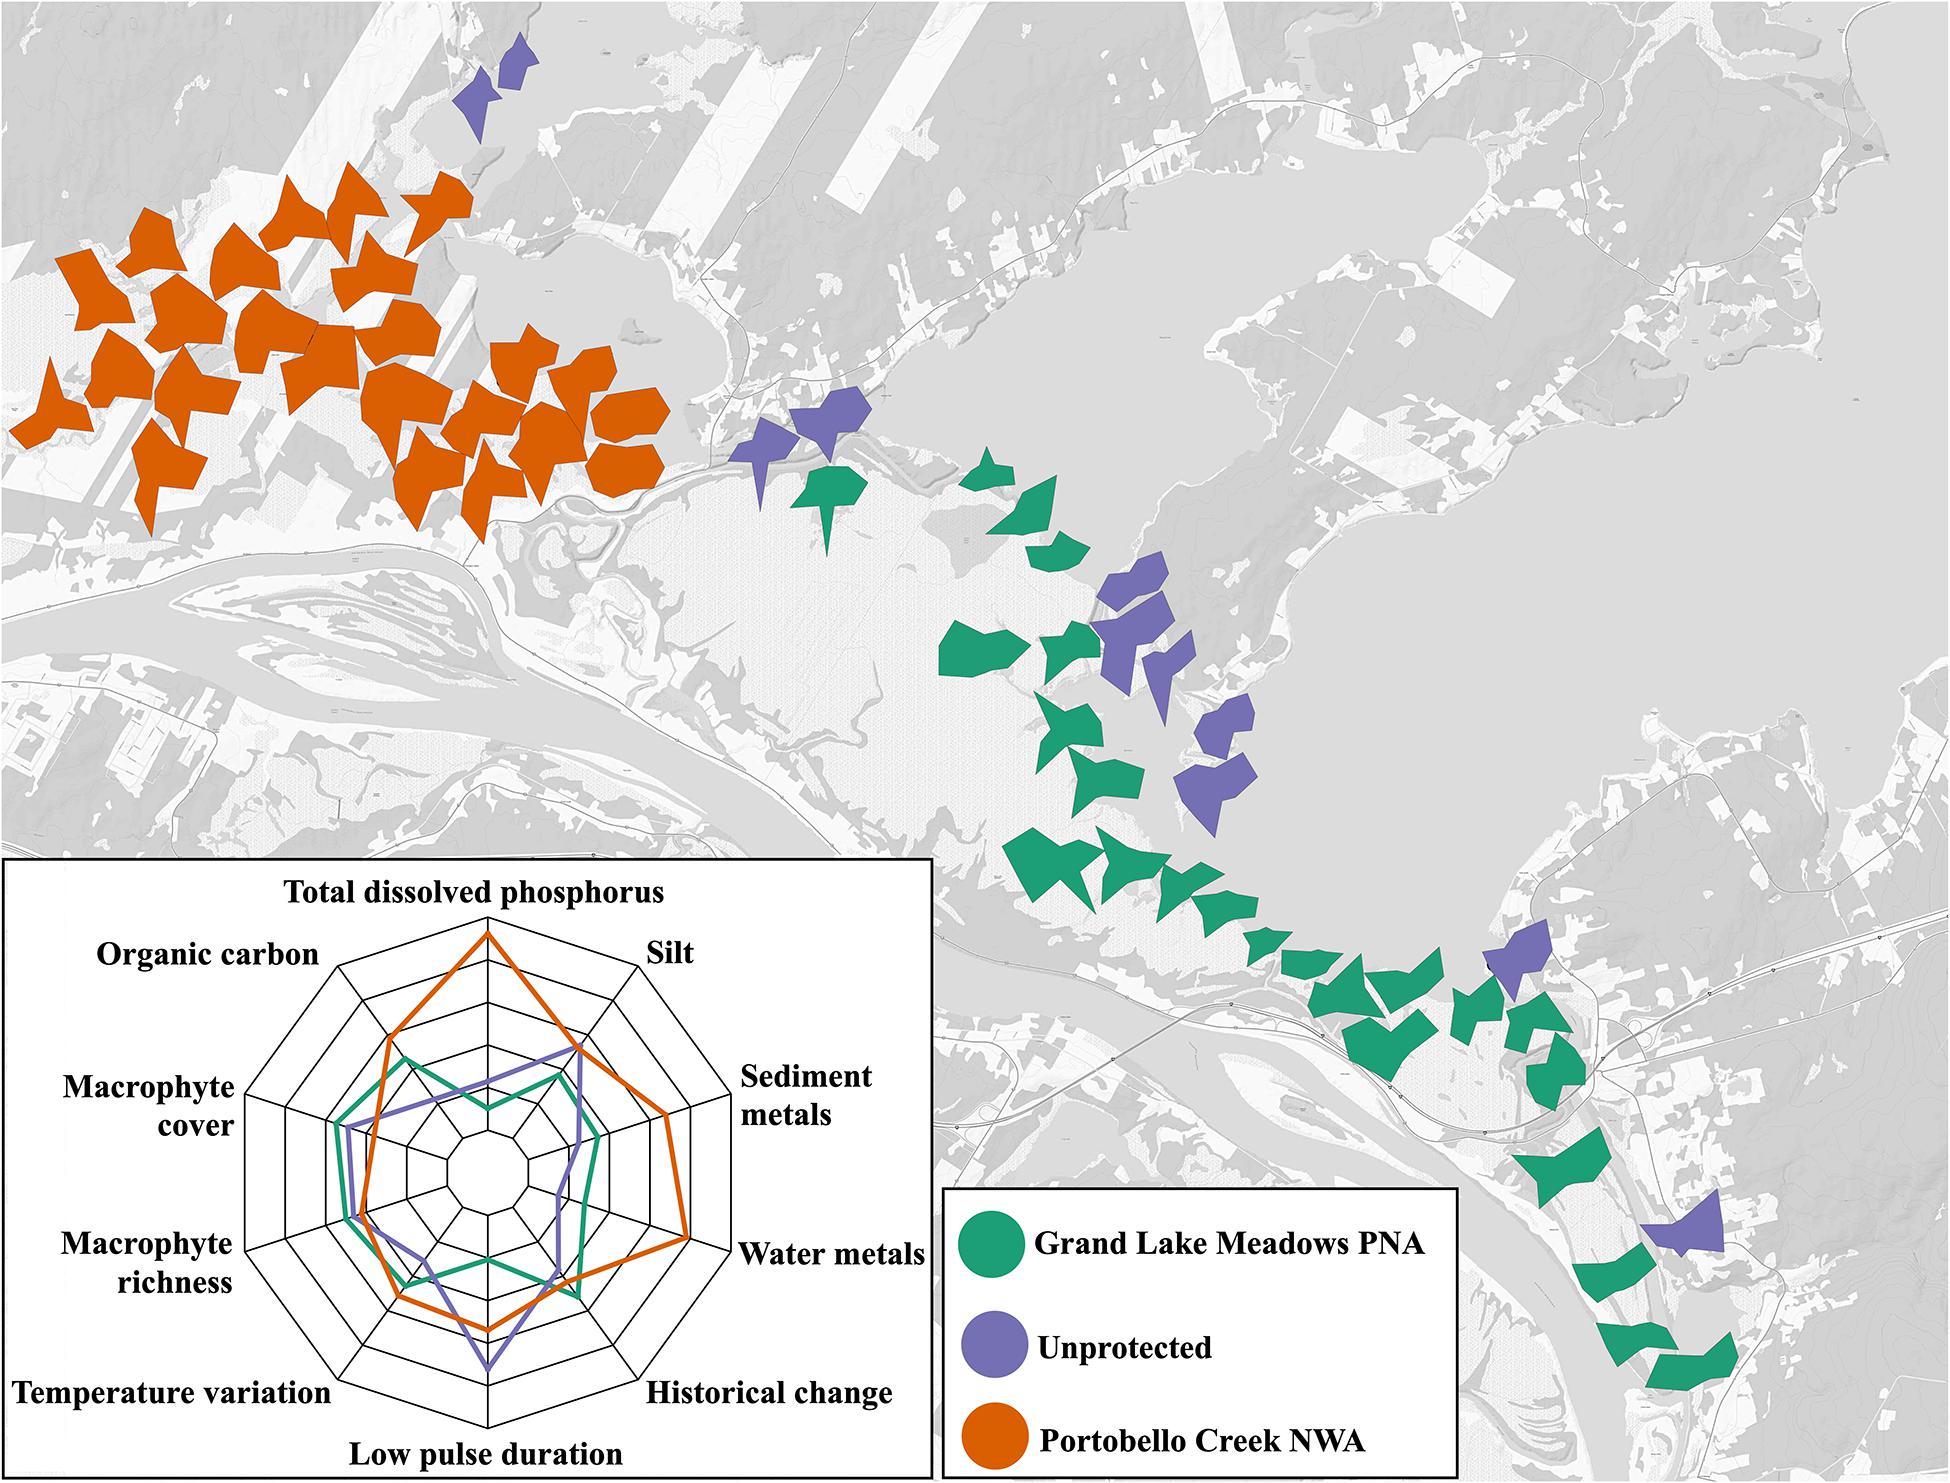
Figure 8. Map of distribution of variables that are thought to have the greatest impact on shaping aquatic biodiversity in the GLM complex. Each site is depicted by a radar plot, where input variables are standardized to a scale of (0,1), and greater area of the radar plot indicates higher values of measured variables. The plot in the insert shows the mean for all sites within a protection classification.
Discussion
Anthropogenic Alteration of Floodplain Wetlands
Floodplains naturally experience channel migration and a shifting of wetland habitat boundaries over time as flood pulses vary from year to year (Bayley and Guimond, 2008); however, recent significant changes of wetland extent within the GLM complex can be linked to periods of major anthropogenic alterations in the Wolastoq | Saint John River watershed, appearing to follow the upstream construction of run-of-the-river dams and the construction of a new Trans-Canada Highway within the wetland complex. Erosional change was highest immediately following the period when the Beechwood (1957) and Mactaquac (1968) dams were constructed, suggesting support for the hypothesis that altered flood pulse and sediment deposition into the floodplain triggered significant erosion of the wetland. This was also during the period when agricultural land practices in the potato farming region located upstream of both Beechwood and Mactaquac began to change, shifting away from losing significant amounts of topsoil each year (Harvey, 1976; Chow et al., 2000); this landscape change could result in lower amounts of sediment being deposited in the floodplain wetlands with the flood pulse each spring, aiding erosion.
Erosion has continued, albeit at a diminished level, until recently, implying that those wetlands continued to experience shoreline change over time due to a perpetuation of the altered hydrologic and sediment deposition regimes. While the postulated change relating to hydroelectric dam construction was most significant for areas that experienced erosion, the most substantial change in recent years was accretional. This was associated with the construction of a section of the Trans-Canada Highway along the edge of the GLM complex and through wetland habitat near the Jemseg River; in this area of floodplain wetlands adjacent to the Jemseg River the most significant accretion was evident, supporting the hypothesis that the hydrologic isolation from highway construction has contributed to significant shoreline change in the area compared to other protection levels.
Floodplains are ecosystems with high spatial heterogeneity, characterized by a mosaic of habitat patches with varying levels of connectivity to the main channel and each other; these patches may be at different levels of ecological succession depending on the shifting boundaries of annual flood pulses (Junk et al., 1989; Ward et al., 1999). Any alteration of the flood pulse, namely the inundation of wetland habitat by flood waters and sediment deposition, therefore affects habitat patches differently, even across relatively small spatial scales. Since the construction of the run-of the-river dam, Mactaquac Generating Station, the frequency and magnitude of large floods in the Wolastoq | Saint John River has increased, but this coincides with similar observations at the wider watershed scale (Canadian Rivers Institute, 2011). This suggests observed changes within the GLM complex are being compounded by other factors such as climate change and increased urbanization, and there is some evidence of limited sediment deposition behind Mactaquac Dam (Grace et al., 2017). Dam construction is, however, linked to the probability and location of ice jams, an important flood pulse mechanism in the Wolastoq | Saint John River (Canadian Rivers Institute, 2011; Huokuna et al., 2020). Although it is problematic to confirm without baseline measurements, the increased inundation period, as well as the sediment deprivation experienced in floodplains following upstream dam construction (Marren et al., 2014), likely had a role in the loss of wetland habitat that is evident in the GLM complex. The patches that experienced the most erosion were backwater and cove habitats, areas that tend to have more transient boundaries between wetland and high marsh habitat (unlike, for example, the edges of large lakes), where shallower slope facilitates amplified inundation and thus a transition to increasingly open water habitat.
In contrast, when the Trans-Canada Highway was constructed in 2001, 55 ha of floodplain wetland habitat adjacent to the Jemseg River was hydrologically isolated, thus no longer experiencing the same flood pulse dynamics (Washburn and Gillis Associates Ltd, 1996). Although an existing highway had already traversed the length of the GLM complex, it was frequently overtopped during flood pulse events, permitting transport of sediment, nutrients and biological propagules to the floodplain wetlands, albeit at a fraction of the level experienced in natural flood pulse events (Washburn and Gillis Associates Ltd, 1996). The new highway has a raised construction and was predicted to only be overtopped in a 1:20 years flood (Washburn and Gillis Associates Ltd, 1996); while the wetlands still flood, the transport of sediment and nutrients to certain habitat patches has been further diminished. The input and deposition of sediment and nutrients from flood pulses is particularly important in areas of sediment loss, such as the outflow from wetlands back into the main channel (e.g., the Jemseg River, which flows from Grand Lake into the Wolastoq | Saint John River) (Brinson, 1993). When the flow of the flood pulse into the wetlands was halted by the raised highway construction, these isolated areas were no longer inundated, transforming the aquatic wetland patches to terrestrial high marsh habitats. Trapped between two stretches of highway, accretional areas were most evident around the Jemseg River, where a combination of sediment loss and lack of hydrological connectivity led to an increase in upland habitat and a consequent loss of shallow aquatic wetlands.
Spatial Heterogeneity of Wetland Habitat Is Shaped by Connectivity
Depending on connectivity across the landscape, areas of accretion and erosion for all time periods were found across the entire GLM complex. Flood pulse dynamics were acting to both increase and decrease wetland extent, highlighting how significant the impact of connectivity and flow regimes are to these vital floodplain habitats. Connectivity and disturbance, subsequently, are important drivers of the biotic communities found within floodplain wetlands. Ward et al. (1999) hypothesized that biodiversity within floodplains would be highest at intermediate levels of both disturbance and connectivity, whereby at low connectivity, nutrients, sediment and organisms cannot be exchanged between communities, and at high connectivity, habitat heterogeneity is reduced, thus reducing niche availability. An updated model by Arias et al. (2018) combined principles from the Intermediate Disturbance Hypothesis (Connell, 1978) and the flood pulse concept (Junk et al., 1989), proposing that flooding patterns and disturbances within the watershed (both anthropogenic and natural) can create spatial interactions to form a disturbance regime, shaping floodplain diversity along any disturbance gradient. Our study identifies the connectivity and disturbance regimes within floodplain wetlands of the Wolastoq | Saint John River, laying the groundwork for an exploration of the resulting consequences for floodplain biodiversity and associated ecosystem functions.
Beyond flood pulse dynamics and habitat boundaries, the ability to retain nutrients, filter metals and support complex macrophyte beds serving as habitat for invertebrate and fish communities directly depends on the hydrology and associated connectivity between habitat patches within the floodplain wetland complex. In the GLM complex, Principal Components Analysis revealed a grouping of sites from east to west, where sites experienced an overall change both in connectivity and hydrology. PC NWA, located in the west, is the most upstream part of the wetland complex, and as such is the first to experience the annual flood pulse; sites to the east, along the Jemseg River, drain first as the flood pulse moves through the floodplain back to the Wolastoq | Saint John River via the Jemseg River (Washburn and Gillis Associates Ltd, 1996).
Cluster analysis also supported the importance of hydrology and connectivity as factors grouping sites, as did the visual representation of patch diversity by radar plots (Figure 7). Sites located on lakes, which are open (i.e., fully connected) and exposed, tended to have lower levels of metal and nutrient accumulation, whereas backwater coves with decreased connectivity showed evidence of metal accretion in their sediments. Together, these factors have multiple consequences for provisioning of floodplain wetland ecosystem services. For example, it demonstrates that backwater coves are acting as sinks of potentially toxic metals, as depositional environments sheltered from wave exposure. This is also associated with retention of organic carbon, which can enhance metal storage capacity (Du Laing et al., 2009). Cadmium concentrations in the sediment had a high positive correlation with the percentage of organic carbon in the sediment, supporting this explanation. Beltaos and Burrell (2016) also found evidence for a strong metal association with the suspended sediment raised during ice jams in the Wolastoq | Saint John River, suggesting that flood pulses facilitate metal transport throughout the watershed. Moreover, their research indicated that measured aquatic concentrations of aluminum, iron and copper could be orders of magnitude higher during breakup conditions than open-water conditions (Beltaos and Burrell, 2016). This said, across the GLM complex, very few metals were above aquatic toxicity guidelines (Canadian Council of Ministers for the Environment, 2014; for average concentrations see Supplementary Tables 2, 3), with the exception of those few (e.g., iron and aluminum) that are naturally abundant crustal elements in the underlying geology of the Wolastoq | Saint John River watershed and are therefore found at high concentrations (Canadian Rivers Institute, 2011).
Through nutrient retention, sheltered coves also allow for the formation of diverse macrophyte communities with high complexity (Hansson et al., 2005), providing a variety of niches to invertebrate communities, thus supporting increased richness (Kovalenko et al., 2012; Walker et al., 2013). Moreover, some metals, such as iron, copper, nickel and molybdenum act as plant micronutrients, and as such are important components of wetland ecosystems (Merchant, 2010). The combination of macro- and micro-nutrients, organic carbon storage, and protection from wave exposure should lead to abundant macrophyte growth, however, despite seemingly suboptimal conditions, macrophytes were found at all sites in our study, just in varying degrees of abundance and richness. Spatial heterogeneity of habitat patches within the floodplain wetlands has led to differences in the structure of macrophyte communities across the wetland complex, forming important habitats for aquatic invertebrates and thus helping to shape community composition.
Current Protections and Impacts for Biodiversity
Due to its ecological significance, the GLM complex is protected by the provincial and federal government, but the extent of the protection, as well as the ease of enforcement, has important consequences for its habitat patches. PC NWA, with the most complete protection, had higher levels of macro-nutrients (particularly phosphorus) and micro-nutrients (i.e., some metals), more sites that were protected from wave exposure, and a larger build-up of organic carbon. Much of this is likely due to connectivity and the geographic location, rather than its protection strategy. While there are, indeed, more restrictions for recreational and commercial use in PC NWA, it is also harder to access, meaning less people are using the area, and it is easier to enforce protections.
Sites within the PC NWA are located along small coves and channels, rather than the exposed edge of the lakeshore as found for many sites in the GLM PNA and unprotected areas, meaning they will naturally have differences in the retention of vital abiotic building blocks, leading to the formation of highly productive wetland habitat. These differences are so substantial that until now the two areas (Portobello Creek and the Grand Lake Meadows) have been studied separately. For example, the most recent previous plant surveys of the area were completed by two separate groups, with Environment Canada’s Canadian Wildlife Service performing a survey in the PC NWA (Blaney, 2003), and Papoulias et al. (2006) working on behalf of the New Brunswick Federation of Naturalists on an inventory of vascular plants within the Grand Lake Meadows (most of which is protected as the GLM PNA).
Historical change from erosion or accretion across the shoreline edge has put habitat patches at varying degrees of succession (Bayley and Guimond, 2008; Tockner et al., 2010). This implies that areas with significant change, found at a higher level within the GLM PNA (porous protection) and PC NWA (complete protection), are in earlier stages of succession (Lallias-Tacon et al., 2017), thus having a higher degree of disturbance. Sites within both protected areas had overall higher values for mean historical change, indicating that there are limitations to protection. While current protection can limit the introduction of invasive species, contamination and nutrient runoff from agricultural areas, it does not currently mitigate altered flood pulse dynamics.
Changes to ecological succession from shoreline change may also have positive effects on wetland communities; following the Intermediate Disturbance Hypothesis, diversity of the biota that inhabit these habitat patches could positively benefit from introduced disturbance (Connell, 1978). Within floodplains, the flood pulse serves as an essential, natural ecological disturbance, creating spatial and temporal heterogeneity, increasing niche diversity, and thus functional richness (Ward et al., 1999; Tockner et al., 2010; Arias et al., 2018). With many patches at different stages of succession across the landscape, and experiencing a different regime of abiotic filters, the GLM complex has the capacity to play host to a wide variety of taxa that have a rich suite of traits. Communities with a diverse set of traits should more effectively utilize the ecosystem’s resources as well as provide the ecosystem functions for which humans rely and floodplain wetlands provide.
Conclusion
A forthcoming study will examine how the relationships between biodiversity and ecosystem function are affected by the disturbance regimes operating on the Wolastoq | Saint John River floodplain wetland microhabitats. As climate change continues to bring increased levels of precipitation, earlier snow-melt and consequently flashier, potentially catastrophic flooding (Tockner and Stanford, 2002), understanding current disturbances and their effect on local communities is central in helping to predict the consequences for wetland communities. Although floodplain ecosystems are naturally resilient, communities that are already stressed due to anthropogenic disturbance may be ill-equipped to combat future climate-driven change. Furthermore, future studies within the GLM complex should examine how sediment deposition and erosion patterns have changed over time using sediment coring to more precisely link erosional and accretional wetland shoreline change with anthropogenic disturbances within the watershed. Although this is a complex system with multiple stressors potentially impacting flood pulse dynamics, more work in determining the role of upstream dam construction in historical habitat change is imperative as any decision that NB Power makes about the future of the failing Mactaquac Generating Station (Stantec Consulting Ltd., 2015) will have consequences for the downstream floodplain wetlands and their communities. Additional knowledge on how communities have already been affected by disturbance will help us to forecast how they will respond in the future, potentially aiding in the mitigation of lasting effects.
Data Availability Statement
The datasets presented in this study can be found in online repositories. The names of the repository/repositories and accession number(s) can be found below: Dryad (doi: 10.5061/dryad.547d7wm5h).
Author Contributions
NR, ZC, WM, and DB conceived and designed the experiment. NR and ZC conducted the field and lab work. MB led the identification of macrophytes. NR and WM performed the statistical analyses. NR wrote the first draft of the manuscript. All authors contributed to subsequent revisions.
Funding
Research support was provided by the Natural Sciences and Engineering Research Council of Canada Collaborative Research and Development Grant (NSERC CRD CRDPJ 462708-13) awarded to DB, WM and others, and a Natural Sciences and Engineering Research Council of Canada Discovery Grant awarded to DB and funding to DB from the federal Genomics Research and Development Initiative’s Ecobiomics project.
Conflict of Interest
The authors declare that the research was conducted in the absence of any commercial or financial relationships that could be construed as a potential conflict of interest.
Acknowledgments
We thank members of CRI, ECCC, and the MAES team for valuable discussions and feedback in developing our study and manuscript. Additionally, CRI affiliates Z. O’Malley, C. Brooks, and S. Stefani helped with the substantial effort of scanning and digitizing aerial images. We also thank J. Ogilvie for all his help in getting the GIS part of this project off the ground, K. Heard for her invaluable help in the field, and to those at the New Brunswick Department of Energy and Resource Development, including D. Wilson, A. Robinson, D. Pardis-Lacey, and H. Loomer, who gave us access to the historical images and associated metadata. This research originally appeared in a thesis written by NR, as cited below.
Supplementary Material
The Supplementary Material for this article can be found online at: https://www.frontiersin.org/articles/10.3389/fevo.2021.553094/full#supplementary-material
References
Almeida, R. M., Hamilton, S. K., Rosi, E. J., Barros, N., Doria, C. R. C., Flecker, A. S., et al. (2020). Hydropeaking operations of two run-of river mega-dams alter downstream hydrology of the largest Amazon tributary. Front. Environ. Sci. 8:120. doi: 10.3389/fenvs.2020.00120
Amoros, C., and Bornette, G. (2002). Connectivity and biocomplexity in waterbodies of riverine floodplains. Freshw. Biol. 47, 761–776. doi: 10.1046/j.1365-2427.2002.00905.x
Arias, M. E., Wittmann, F., Parolin, P., Murray-Hudson, M., and Cochrane, T. A. (2018). Interactions between flooding and upland disturbance drives species diversity in large river floodplains. Hydrobiologia 814, 5–17. doi: 10.1007/s10750-016-2664-3
Armellin, A., Baird, D. J., Curry, C., Glozier, N., Martens, A., and McIvor, E. (2019). CABIN Wetland Macroinvertebrate Protocol Draft Version 1.0. Canada: Environment and Climate Change Canada.
Barbarossa, V., Schmitt, R. J. P., Huijbregts, M. A. J., Zarfl, C., King, H., and Achipper, A. M. (2020). Impacts of current and future large dams on the geographic range connectivity of freshwater fish worldwide. Proc. Natl. Acad. Sci. U.S.A. 117, 3648–3655. doi: 10.1073/pnas.1912776117
Bayley, S. E., and Guimond, J. K. (2008). Effects of river connectivity on marsh vegetation community structure and species richness in montane floodplain wetlands in Jasper National Park, Alberta, Canada. Écoscience 15, 377–388. doi: 10.2980/15-3-3084
Beltaos, S., and Burrell, B. C. (2016). Characteristics of suspended sediment and metal transport during ice breakup, Saint John River, Canada. Cold Reg. Sci. Technol. 123, 164–176. doi: 10.1016/j.coldregions.2015.12.009
Blaney, S. (2003). A Reconnaissance Vascular Plant Inventory of the Portobello National Wildlife Area. Sackville, NB: Atlantic Canada Conservation Data Centre.
Brinson, M. M. (1993). Changes in the functioning of wetlands along environmental gradients. Wetlands 13, 65–74. doi: 10.1007/BF03160866
Brock, M. A., Smith, R. G. B., and Jarman, P. J. (1999). Drain it, dam it: alteration of water regime in shallow wetlands on the New England Tableland of New South Wales, Australia. Wetl. Ecol. Manag. 7, 37–46. doi: 10.1023/A:1008416925403
Broster, B. E., and Dickinson, P. C. (2015). Late Wisconsinan and Holocene development of Grand Lake Meadows area and southern reaches of the Saint John River Valley, New Brunswick, Canada. Atl. Geol. 51, 206–220.
Brown, A. G., Lespez, L., Sear, D. A., Macaire, J., Houben, P., Klimek, K., et al. (2018). Natural vs anthropogenic streams in Europe: history, ecology and implications for restoration, river-rewilding and riverine ecosystem services. Earth Sci. Rev. 180, 185–205. doi: 10.1016/j.earscirev.2018.02.001
Canadian Council of Ministers for the Environment (2014). Canadian Environmental Quality Guidelines. CCME. Available online at: http://ceqg-rcqe.ccme.ca/en/index.html#void (accessed June 19, 2019).
Canadian Rivers Institute (2011). in The Saint John River: a State of the Environment Report, eds S. D. Kidd, R. A. Curry, and K. R. Munkittrick (Fredericton, NB: Canadian Rivers Institute).
Charrad, M., Ghazzali, N., Boiteau, V., and Niknafs, A. (2014). NbClust: an R package for determining the relevant number of clusters in a data set. J. Stat. Softw. 61, 1–36.
Chen, W. W., and Chang, H. K. (2009). Estimation of shoreline position and change from satellite images considering tidal variation. Estuar. Coast. Shelf Sci. 84, 54–60. doi: 10.1016/j.ecss.2009.06.002
Chipps, S. R., Hubbard, D. E., Werlin, K. B., Haugerud, N. J., Powell, K. A., Thompson, J., et al. (2006). Association between wetland disturbance and biological attributes in floodplain wetlands. Wetlands 26, 497–508.
Chow, T. L., Rees, H. W., and Monteith, J. (2000). Seasonal distribution of runoff and soil loss under four tillage treatments in the upper St. John River valley New Brunswick, Canada. Can. J. Soil Sci. 80, 649–660. doi: 10.4141/S00-006
Csiki, S. J. C., and Rhoads, B. L. (2014). Influence of four run-of-river dams on channel morphology and sediment characteristics in Illinois, USA. Geomorphology 206, 215–229. doi: 10.1016/j.geomorph.2013.10.009
Cunjak, R. A., and Newbury, R. W. (2005). “Atlantic coast rivers of Canada,” in Rivers of North America, eds A. Benke and C. Cushing (Cambridge, MA: Academic Press), 939–982.
Dormann, C. F., Elith, J., Bacher, S., Buchmann, C., Carl, G., Carré, G., et al. (2013). Collinearity: a review of methods to deal with it and a simulation study evaluating their performance. Ecography 35, 027–046. doi: 10.1111/j.1600-0587.2012.07348.x
Du Laing, G., Rinklebe, J., Vandecasteele, B., Meers, E., and Tack, F. M. G. (2009). Trace metal behaviour in estuarine and riverine floodplain soils and sediments: a review. Sci. Total Environ. 407, 3972–3985. doi: 10.1016/j.scitotenv.2008.07.025
Environment and Climate Change Canada’s National Laboratory for Environmental Testing (2013). Certified Reference Materials. https://www.ec.gc.ca/inre-nwri/default.asp?lang=En&n=D3D76BEC-1 (Accessed July 7, 2013)
Environmental Systems Research Institute [ESRI] (2018). ArcGIS Desktop: Release 10.6.1. Redlands, CA: ESRI.
Fazekas, A. J., Kuzmina, M. L., Newmaster, S. G., and Hollingsworth, P. M. (2012). “DNA barcoding methods for land plants,” in DNA Barcodes. Methods in Molecular Biology (Methods and Protocols), Vol. 858, eds W. Kress and D. Erickson (Totowa, NJ: Humana Press), 223–252.
Galat, D. L., Fredrickson, L. H., Humburg, D. D., Bataille, K. J., Bodie, J. R., Dohrenwend, J., et al. (1998). Flooding to restore connectivity of regulated, large-river wetlands. BioScience 48, 721–733. doi: 10.2307/1313335
Government of Canada (2020). Canadian Climate Normals 1981-2020 Station Data. Available online at: https://climate.weather.gc.ca/climate_normals/results_1981_2010_e.html?stnID=6157&autofwd=1 (Accessed June 2020, 15).
Grace, M., Butler, K. E., Simpkin, P., and Yamazaki, G. (2017). Reservoir Siltation and Quaternary Stratigraphy Beneath The Mataquac Headpond, New Brunswick, Canada, As Revealed By Acoustic And Ground Penetrating Radar Sub-Bottom Imaging. Atlantic Geology 53, Atlantic Geoscience Society Abstracts- 43 Colloquium & Annual General Meeting 2017. doi: 10.4138/atlgeol.2017.006
Hansson, L. A., Brönmark, C., Nilsson, P. A., and Åbjörnsson, K. (2005). Conflicting demands on wetland ecosystem services: nutrient retention, biodiversity or both? Freshw. Biol. 50, 705–714. doi: 10.1111/j.1365-2427.2005.01352.x
Harvey, H. H. (1976). Aquatic environmental quality: problems and proposals. J. Fish. Res. Board Can. 33, 2634–2670. doi: 10.1139/f76-315
Himmelstoss, E. A., Henderson, R. E., Kratzmann, M. G., and Farris, A. S. (2018). Digital Shoreline Analysis System (DSAS) version 5.0 user guide: U.S. Geological Survey Open-File Report 2018–1179. Reston, VA: USGS, 110. doi: 10.3133/ofr20181179
Huokuna, M., Morris, M., Beltaos, S., and Burrell, B. C. (2020). Ice in reservoirs and regulated rivers. Int. J. River Basin Manag. doi: 10.1080/15715124.2020.1719120
Jones, P. E., Consuegra, S., Borger, L., Jones, J., and de Leaniz, C. G. (2020). Impacts of artificial barriers on the connectivity and dispersal of vascular macrophytes in rivers: a critical review. Freshw. Biol. 65, 1165–1180. doi: 10.1111/fwb.13493
Junk, W. J., Bayley, P. B., and Sparks, R. E. (1989). “The flood pulse concept in river-floodplain systems,” in Proceedings of the International Large River Symposium (LARS), Vol. 106, ed. D. P. Dodge (Honey Harbour, ONT: Canadian Special Publication of Fisheries and Aquatic Sciences), 110–127.
Kassambara, A., and Mundt, F. (2017). factoextra: Extract and Visualize the Results of Multivariate Data Analyses. R Package Version 1.0.5. Available online at: https://CRAN.R-project.org/package=factoextra (Accessed April 2020, 1).
Kingsford, R. T. (2000). Ecological impacts of dams, water diversions and river management on floodplain wetlands in Australia. Austral Ecol. 25, 109–127. doi: 10.1046/j.1442-9993.2000.01036.x
Kovalenko, K. E., Thomaz, S. M., and Warfe, D. M. (2012). Habitat complexity: approaches and future directions. Hydrobiologia 685, 1–17. doi: 10.1007/s10750-011-0974-z
Lallias-Tacon, S., Liébault, F., and Piégay, H. (2017). Use of airborne LiDAR and historical aerial photos for characterising the history of braided river floodplain morphology and vegetation responses. CATENA 149, 742–759. doi: 10.1016/j.catena.2016.07.038
Lê, S., Josse, J., and Husson, F. (2008). FactoMineR: an R package for multivariate analysis. J. Stat. Softw. 25, 1–18. doi: 10.18637/jss.v025.i01
Marren, P. M., Grove, J. R., Webb, J. A., and Stewardson, M. J. (2014). The potential for dams to impact lowland meandering river floodplain geomorphology. Sci. World J. 2014, 1–24. doi: 10.1155/2014/309673
Merchant, S. S. (2010). The elements of plant micronutrients. Plant Physiol. 154, 512–515. doi: 10.1104/pp.110.161810
Myers, N. (1997). “The rich diversity of biodiversity issues,” in Biodiversity II: Understanding and Protecting Our Biological Resources, eds M. L. Reaka-Kudla, D. E. Wilson and O. Wilson (Washington, DC: Joseph Henry Press), 125–138.
Nakazawa, M. (2018). fmsb: Functions for Medical Statistics Book With Some Demographic Data. R Package Version 0.6.3. https://CRAN.R-project.org/package=fmsb (accessed May 2021, 11).
Nash, J. E., and Sutcliffe, J. V. (1970). River flow forecasting through conceptual models. Part 1- A discussion of principals. J. Hydrol. 10, 282–290. doi: 10.1016/0022-1694(70)90255-6
NCBI Resource Coordinators (2017). Database resources of the national center for biotechnology information. Nucleic Acids Res. 45, D12–D14. doi: 10.1093/nar/gkw1071
Oksanen, J., Blanchet, F. G., Friendly, M., Kindt, R., Legendre, P., McGlinn, D., et al. (2019). vegan: Community Ecology Package. R Package Version 2.5-4. https://CRAN.R-project.org/package=vegan (Accessed November 2020, 28).
Papoulias, M. M., Chaplin, M., and Bishop, G. (2006). Flora of the Grand Lake Meadows: Results of a Vascular Plant Inventory and Community Ecology Study Of The Grand Lake Meadows Project Boundary Area. Fredericton, NB: New Brunswick Federation of Naturalists.
Pekel, J., Cottam, A., Gorelick, N., and Belward, A. S. (2016). High-resolution mapping of global surface water and its long-term changes. Nature 540, 418–422. doi: 10.1038/nature20584
Ratnasingham, S., and Hebert, P. D. N. (2007). BOLD: the barcode of life data system (www.barcodinglife.org). Mol. Ecol. Notes 7, 355–364. doi: 10.1111/j.1471-8286.2006.01678.x
Rejmankova, E. (2011). The role of macrophytes in wetland ecosystems. J. Ecol. Environ. 34, 333–345. doi: 10.5141/jefb.2011.044
Revenga, C., Brunner, J., Henninger, N., Kassem, K., and Payne, R. (2000). Pilot Analysis of Global Ecosystems: Freshwater Systems. Washington, DC: World Resources Institute.
Richter, B. D., Baumgartner, J. V., Powell, J., Braun, D. P., Richter, B. D., Baumgartner, J. V., et al. (1996). A method for assessing hydrologic alteration within ecosystems. Soc. Conserv. Biol. 10, 1163–1174. doi: 10.1007/s13361-012-0389-8
Rooney, R. C., Carli, C., and Bayley, S. E. (2013). River connectivity affects submerged and floating aquatic vegetation in floodplain wetlands. Wetlands 33, 1165–1177. doi: 10.1007/s13157-013-0471-4
Stantec Consulting Ltd. (2015). Mactaquac Project Comparative Environmental Review (CER) Report- Summary Document. Fredericton, NB: Stantec Consulting Ltd.
Tockner, K., Bunn, S. E., Gordon, C., Naiman, R. J., Quinn, G. P., and Stanford, J. A. (2008). “Flood plains: critically threatened ecosystems,” in Aquatic Ecosystems: Trends and Global Prospects, ed. N. Polunin (Cambridge: Cambridge University Press), 45–62.
Tockner, K., Pusch, M., Borchardt, D., and Lorang, M. S. (2010). Multiple stressors in coupled river-floodplain ecosystems. Freshw. Biol. 55, 135–151. doi: 10.1111/j.1365-2427.2009.02371.xR
Tockner, K., and Stanford, J. A. (2002). Riverine flood plains: present state and future trends. Environ. Conserv. 29, 308–330. doi: 10.1017/S037689290200022X
United States Environmental Protection Agency (1996). Method 3050B Acid Digestion of Sediments, Sludges, and Soils. Washington, DC: United States Environmental Protection Agency.
Varga, K., Dévai, G., and Tóthmérész, B. (2013). Land use history of a floodplain area during the last 200 years in the Upper-Tisza region (Hungary). Reg. Environ. Change 13, 1109–1118. doi: 10.1007/s10113-013-0424-8
Venterink, O., Vermaat, J. E., van der Lee, G. E. M., van den Hoorn, M. W., Pronk, M., Wiegman, F., et al. (2006). Importance of sediment deposition and denitrification for nutrient retention in floodplain wetlands. Appl. Veg. Sci. 9, 163–174. doi: 10.1111/j.1654-109X.2006.tb00665.x
Walker, P. D., Wijnhoven, S., and van der Velde, G. (2013). Macrophyte presence and growth form influence macroinvertebrate community structure. Aquat. Bot. 104, 80–87. doi: 10.1016/j.aquabot.2012.09.003
Ward, J. V., Tockner, K., and Schiemer, F. (1999). Biodiversity of floodplain river ecosystems: ecotones and connectivity. Regul. Rivers Res. Manag. 15, 125–139. doi: 10.1002/(SICI)1099-1646(199901/06)15:1/3<125::AID-RRR523<3.0.CO;2-E
Washburn and Gillis Associates Ltd. (1996). Environmental Impact Assessment Trans-Canada Highway Fredericton to Salisbury: Component Study Report Grand Lake Meadows Wetland. Fredericton, NB: Washburn and Gillis Associates Ltd.
Water Survey of Canada (2017). National Water Data Archive: HYDAT. Available online at: http://collaboration.cmc.ec.gc.ca/cmc/hydrometrics/www/ (Accessed July 2017, 5)
Wickham, H. (2016). ggplot2: Create Elegant Data Visualisations Using The Grammar Of Graphics. ISBN 978-3-319-24277-4. R Package. Available online at: https://ggplot2.tidyverse.org/ (accessed July 16, 2019).
Keywords: anthropogenic disturbance, multiple stressors, floodplain, wetlands, hydrological alteration, historical change
Citation: Rideout NK, Compson ZG, Monk WA, Bruce MR and Baird DJ (2021) The Beautiful and the Dammed: Defining Multi-Stressor Disturbance Regimes in an Atlantic River Floodplain Wetland. Front. Ecol. Evol. 9:553094. doi: 10.3389/fevo.2021.553094
Received: 17 April 2020; Accepted: 31 May 2021;
Published: 02 July 2021.
Edited by:
Matthias Peichl, Swedish University of Agricultural Sciences, SwedenReviewed by:
Richard Kingsford, Sydney Hospital, AustraliaMohammad Imam Hasan Reza, Independent Researcher, Chittagong, Bangladesh
Copyright © 2021 Rideout, Compson, Monk, Bruce and Baird. This is an open-access article distributed under the terms of the Creative Commons Attribution License (CC BY). The use, distribution or reproduction in other forums is permitted, provided the original author(s) and the copyright owner(s) are credited and that the original publication in this journal is cited, in accordance with accepted academic practice. No use, distribution or reproduction is permitted which does not comply with these terms.
*Correspondence: Natalie K. Rideout, bnJpZGVvdXRAdW5iLmNh
†Present address: Zacchaeus G. Compson, Department of Biological Sciences, Advanced Environmental Research Institute, University of North Texas, Denton, TX, United States