 Victor L. Barradas
 Manuel Esperon-Rodriguez
- 1Laboratorio de Interacción Planta Atmósfera, Departmento de Ecologia Funcional, Instituto de Ecologia, Universidad Nacional Autónoma de México, Mexico City, Mexico
- 2Hawkesbury Institute for the Environment, Western Sydney University, Penrith, NSW, Australia
Urban forests play an important role in regulating urban climate while providing multiple environmental services. These forests, however, are threatened by changes in climate, as plants are exposed not only to global climate change but also to urban climate, having an impact on physiological functions. Here, we selected two physiological variables (stomatal conductance and leaf water potential) and four environmental variables (air temperature, photosynthetically active radiation, vapor pressure deficit, and water availability) to compare and evaluate the ecophysiological vulnerability to climate change of 15 dominant tree species from Mexico City’s urban forest. The stomatal conductance response was evaluated using the boundary-line analysis, which allowed us to compare the stomatal response to changes in the environment among species. Our results showed differential species responses to the environmental variables and identified Buddleja cordata and Populus deltoides as the least and most vulnerable species, respectively. Air temperatures above 33°C and vapor pressure deficit above 3.5 kPa limited the stomatal function of all species. Stomatal conductance was more sensitive to changes in leaf water potential, followed by vapor pressure deficit, indicating that water is a key factor for tree species performance in Mexico City’s urban forest. Our findings can help to optimize species selection considering future climate change by identifying vulnerable and resilient species.
Introduction
Urbanization drastically changes the natural environment with significant land-use changes (Berry, 2008). Urban ecosystems are also exposed to pollutants, high CO2, nitrogen deposition, and elevated temperatures, which affect urban vegetation (Gregg et al., 2003, Zhao et al., 2016). Urban tree growth, for example, can be stimulated by warmer temperatures, particularly in temperate climates. However, high temperatures can also accelerate senescence and aging (Moser et al., 2017; Smith et al., 2019) and additional challenging conditions in cities, such as limited soil volume, modified soils, and reduced water and nutrient availability affect tree growth and performance (Day and Bassuk, 1994; Hauer et al., 2020).
The imposition of large concrete and asphalt slab restricts natural evapotranspiration in cities and considerably increases heat storage (Gui et al., 2007; Göbel et al., 2013). This redistribution of energy results in the urban heat island (UHI) effect. The UHI effect consists of an increase in the air temperature of the urban area with respect to the rural surroundings (Oke, 1995). The UHI in Mexico City, for example, can be as high as 7°C on average, but in some instances can reach intensities of up to 10°C (Ballinas, 2011).
Global climate change exacerbates urban temperature differences (Brazel and Quattrochi, 2005). In coming decades, heat shocks or waves will increase in frequency and severity and be enhanced by the UHI effect (Luber and McGeehin, 2008; Manoli et al., 2019). These predicted increases in air temperature around the world will affect the thermal balance with consequences on natural and urban ecosystems (IPCC, 2021). Undoubtedly, all organisms living in cities, including human populations, will experience more heat stress, which might decrease productivity and severely affect human health and mortality (Laschewski and Jendritzky, 2002).
With proper selection and strategic planning, urban vegetation can mitigate the UHI because of the cooling potential plants have via transpiration (Barradas, 1991, 2000; Susca et al., 2011; Ballinas and Barradas, 2016a; Kornaska et al., 2016). Some trees, for example, can transpire up to 5 L day–1 tree–1, which is equivalent to a heat dissipation of up to 12.62 W day–1 tree–1 (Ballinas and Barradas, 2016b). For this reason, urban vegetation has gained recognition for management of the UHI effect, along with other mechanisms that contribute to the improvement of the urban environment, such as the capture of atmospheric particulate material and improvement of human health (García-Sánchez et al., 2019; Keeler et al., 2019).
Plants, however, are exposed not only to global but also urban climate change, affecting key physiological functions. As a result, there are three possible plant responses to changes in climate: migration, adaptation, and extinction (Aitken et al., 2008). As cities are fragmented landscapes, species’ movement is limited (Dobbs et al., 2017); therefore, adaptation (i.e., evolutionary changes and/or physiological acclimatization) becomes crucial for species survival (Atkins and Travis, 2010).
Stomatal conductance (gS) is a key plant trait in photosynthesis and plant productivity (Jones, 1992; Jarvis and Davies, 1998). This trait also responds rapidly to climate and environmental changes (Jones, 1992; Ackerly, 2004; Buckley, 2005). Some climatic changes, such as elevated temperatures, can negatively affect plant functions by reducing transpiration, nutrient assimilation and photosynthesis (Farquhar and Sharkey, 1982; Atkin and Tjoelker, 2003; Mathur et al., 2014). Therefore, understanding how climatic and environmental changes affect species functional responses (e.g., gS response) becomes necessary in face of global and urban climate change.
Global climate change represents a threat to the persistence of urban forests globally (Esperon-Rodriguez et al., 2021) and these changes increase species’ vulnerability—i.e., the extent to which climate change (urban and global) can damage a system depending on its sensitivity and its ability to adapt itself to new climatic conditions (IPCC, 2001). Further, when these climate changes affect how species respond physiologically to the environment, their ecophysiological vulnerability increases, limiting their ability to adapt physiological functions to environmental changes (Esperon-Rodriguez and Barradas, 2015a). Thus, identifying vulnerable species in urban environments can help to improve species selection while ensuring the provision of desired ecosystem services toward sustainable development.
Here, we aimed to determine and evaluate the ecophysiological vulnerability of Mexico City’s urban forest to climate change. For this, we used gS as a vulnerability indicator and four environmental variables were selected to assess the species ecophysiological vulnerability: air temperature, photosynthetically active radiation, vapor pressure deficit, and water availability. The objectives of this study were to (1) identify more and less vulnerable species to environmental changes and (2) develop a model summarizing the gS response to the environment (i.e., the four aforementioned variables). We used the boundary-line analysis to predict stomatal responses. This analysis has great precision and uses meteorological data to assess ecophysiological responses to the environment (Jarvis, 1976; Lambers et al., 1998; Barradas et al., 2011; Ballinas and Barradas, 2016b) and can be used to identify vulnerable species (Esperon-Rodriguez and Barradas, 2015a,b).
Materials and Methods
Study Area
Data were collected in five parks of Mexico City (19°19′N, 99°11′W, 2230 m above sea level): España (EP), Mexico (MP), Luis G. Urbina (LGUP), Bombilla (BP), and Ciudad Universitaria (CU) (Figure 1). The city’s mean annual rainfall (average of 40 years) is 748 mm, where ∼94% occurs during the rainy season (June–November). Winds are light and predominantly from the Northeast. Extreme average temperatures occur in April (26°C) and January (5.3°C) and currently the annual average temperature ranges from 14.6 to 17.3°C (CONAGUA et al., 2021), with a distinct urban heat island effect (Jauregui, 1973) not only at night but also during daytime, with differences of up to 10°C (TU–R) compared to surrounding areas (Ballinas, 2011; Figure 1). The increase on average in air temperature since 1990 has been 0.052°C per year and predictions of temperature suggest an increase to 24.5°C by 2050 (Ballinas, 2011).
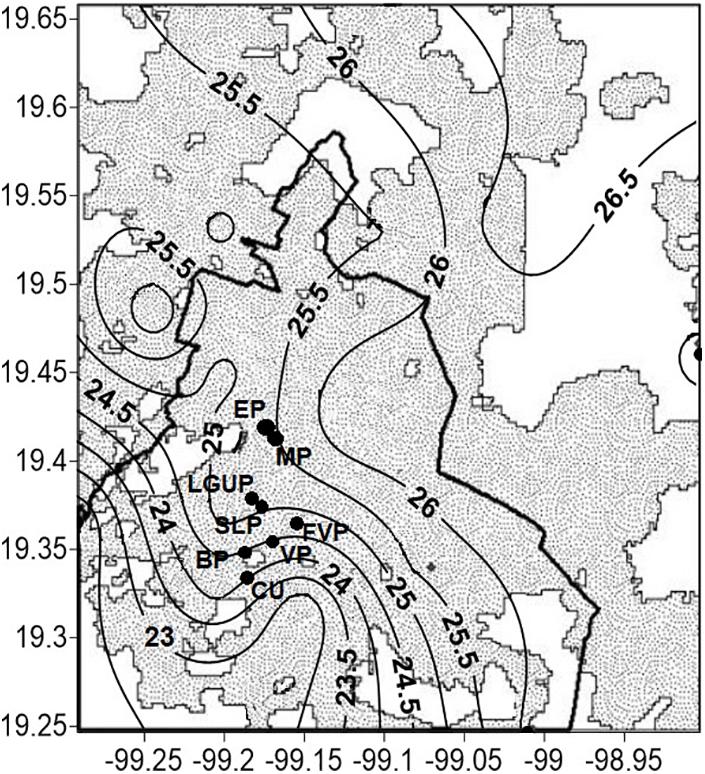
Figure 1. Location of five study sites of Mexico City where measurements were carried out and included the parks: (1) España (EP); (2) Mexico (MP); (3) Luis G. Urbina (LGUP); (4) Bombilla (BP); and (5) Ciudad Universitaria (CU). The shaded area shows distribution of air temperature (°C) in the metropolitan area of Mexico City. The wide, solid line represents the division between the state of Mexico and Mexico City.
Selected Species
Fifteen dominant tree species were selected based on their presence and abundance in five parks from Mexico City and included: Acacia longifolia, Acer negundo, Alnus acuminata, Buddleja cordata, Celtis occidentalis, Dodonaea viscosa, Eucalyptus camaldulensis, Erythrinia americana, Fraxinus uhdei, Ligustrum lucidum, Liquidambar styraciflua, Populus alba, Populus deltoides, Quercus rugosa, and Ulmus parvifolia. Species selection included 12 native and three exotic and eight deciduous and seven evergreen species. Diameter at standard height (DSH), height (H) and crown diameter (CD) varied across species, with E. camaldulensis (DSH and CD) and A. acuminata (H) presenting the highest values, whereas D. viscosa had the lowest values for all three metrics (DSH, H, and CD) (Table 1).
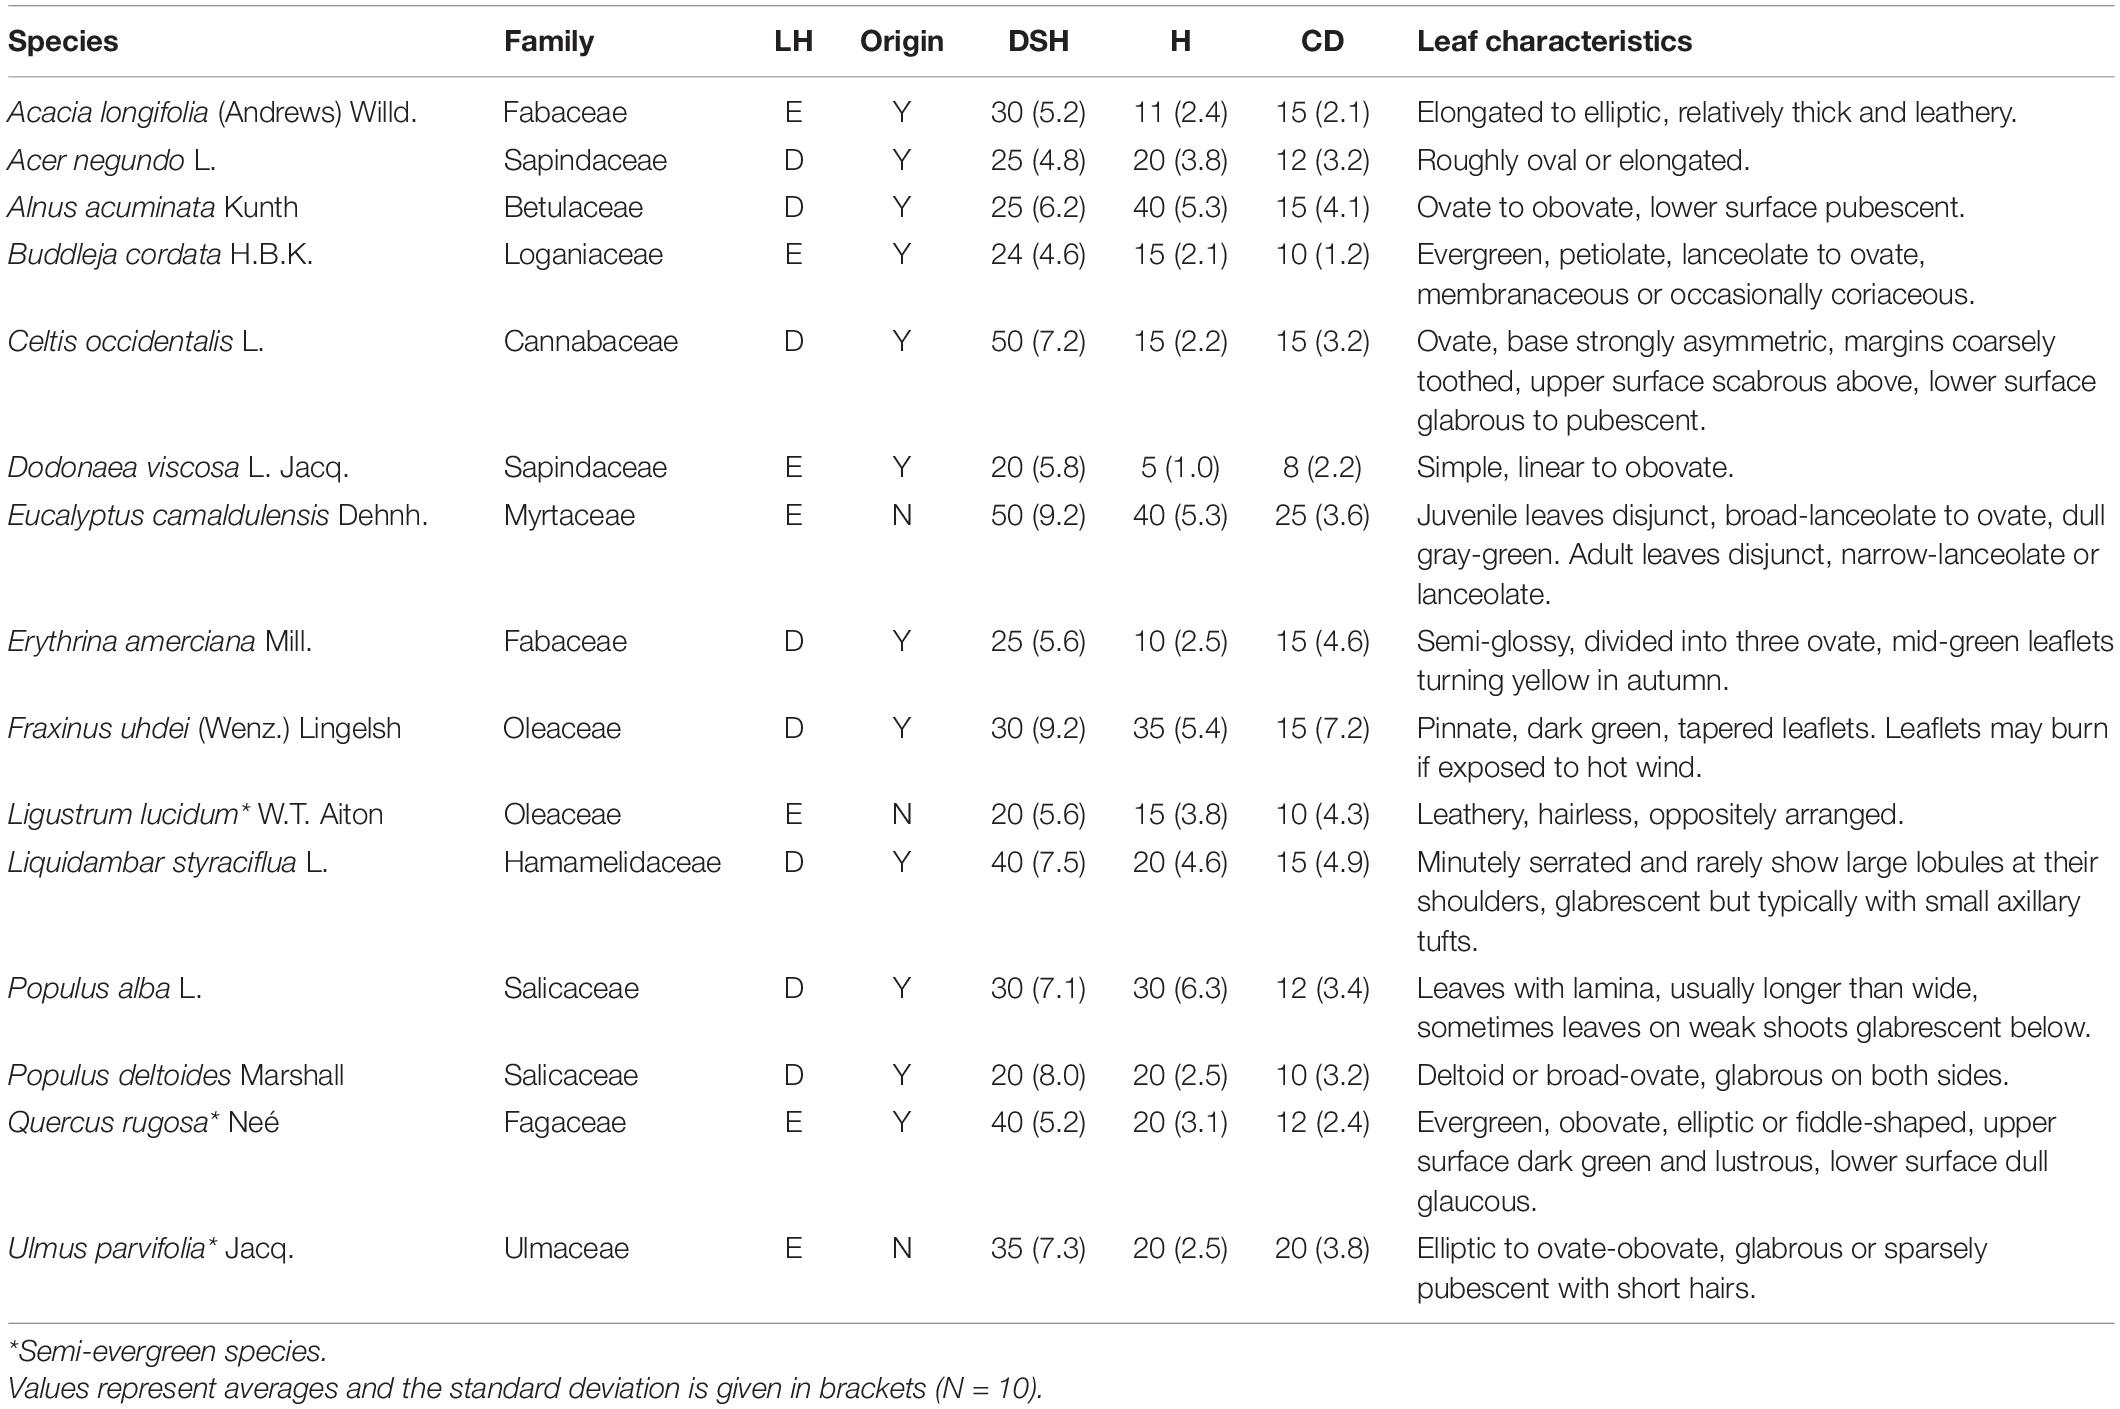
Table 1. Families, leaf habit (LH; D: deciduous, E: evergreen), origin [native to Mexico, yes (Y), no (N)], diameter at standard height (DSH, cm), height (H, m), crown diameter (CD, m) and leaf characteristics for 15 tree species from Mexico City’s urban forest.
Data Collection
All individual trees were identified within urban parks located toward the center and west of the city (Figure 1). Stomatal conductance (gS) was measured with a steady-state diffusion porometer (LI-1600, LI-COR, Lincoln, NE, United States) on at least five sunlit and shaded expanded leaves per individual tree in the mid-level of the tree and for at least four individuals at each park. Photosynthetically active radiation (PAR), air temperature (TA) and relative humidity (RH) were determined next to each measured leaf with a quantum sensor (LI-190SB, LI-COR Ltd., Lincoln, Nebraska, United States), a thermocouple and a humicap sensor (Vaisala, Helsinki, Finland), respectively. The quantum sensor was installed near and parallel to the leaf maintaining the orientation of the leaf when measuring. The vapor pressure deficit (VPD) was calculated from TA and RH measurements: VPD = eS(1-RH) and eS = 0.6108{exp[(17.27TA)/(TA + 237.3)]} and 0 ≤ RH ≤ 1. Concomitantly, leaf water potential (ψ) was measured in two full-light exposed leaves per individual tree, with a pressure chamber (PMS Corvallis, Oregon, United States) (Scholander et al., 1964). Measurements were made from 08:00 to 16:00 h (local time, h) during 16 days in April and May, the warmest and driest months of the year. We recorded the highest (i.e., less negative) ψ between 08:00 and 09:00 h. During measurements, the maximum average temperature was 29°C and precipitation was 10.2 mm was registered only during the last 6 days of March before measurements. No rain was recorded during the study period.
The Boundary-Line Analysis
The boundary-line analysis assesses the relationship between gS and climatic/environmental and physiological variables (i.e., TA, PAR, VPD, ψ). From this analysis, graphs are generated representing the optimal stomatal response to a given selected variable (Jarvis, 1976; Fanjul and Barradas, 1985; Jones, 1992; Barradas et al., 2004; Esperon-Rodriguez and Barradas, 2014). The analysis of the effect of each variable on stomatal conductance is determined with simple models that are referred to as boundary-line functions.
These simple models consist of the selection of data from a probable upper limit represented by a cloud of points in each graph made by plotting gS as a function of any driving variable (i.e., TA, PAR, VPD, ψ). This analysis has three assumptions: (1) the boundary-line function represents the optimal response of gS to the selected variable (e.g., TA); (2) the points that fall below the selected function are the result of a change in any of the other variables (e.g., PAR, VPD); and (3) it assumes no synergism at the boundary (Jarvis, 1976; Fanjul and Barradas, 1985; Jones, 1992; Ramos-Vázquez and Barradas, 1998; Barradas et al., 2004; Figure 2).
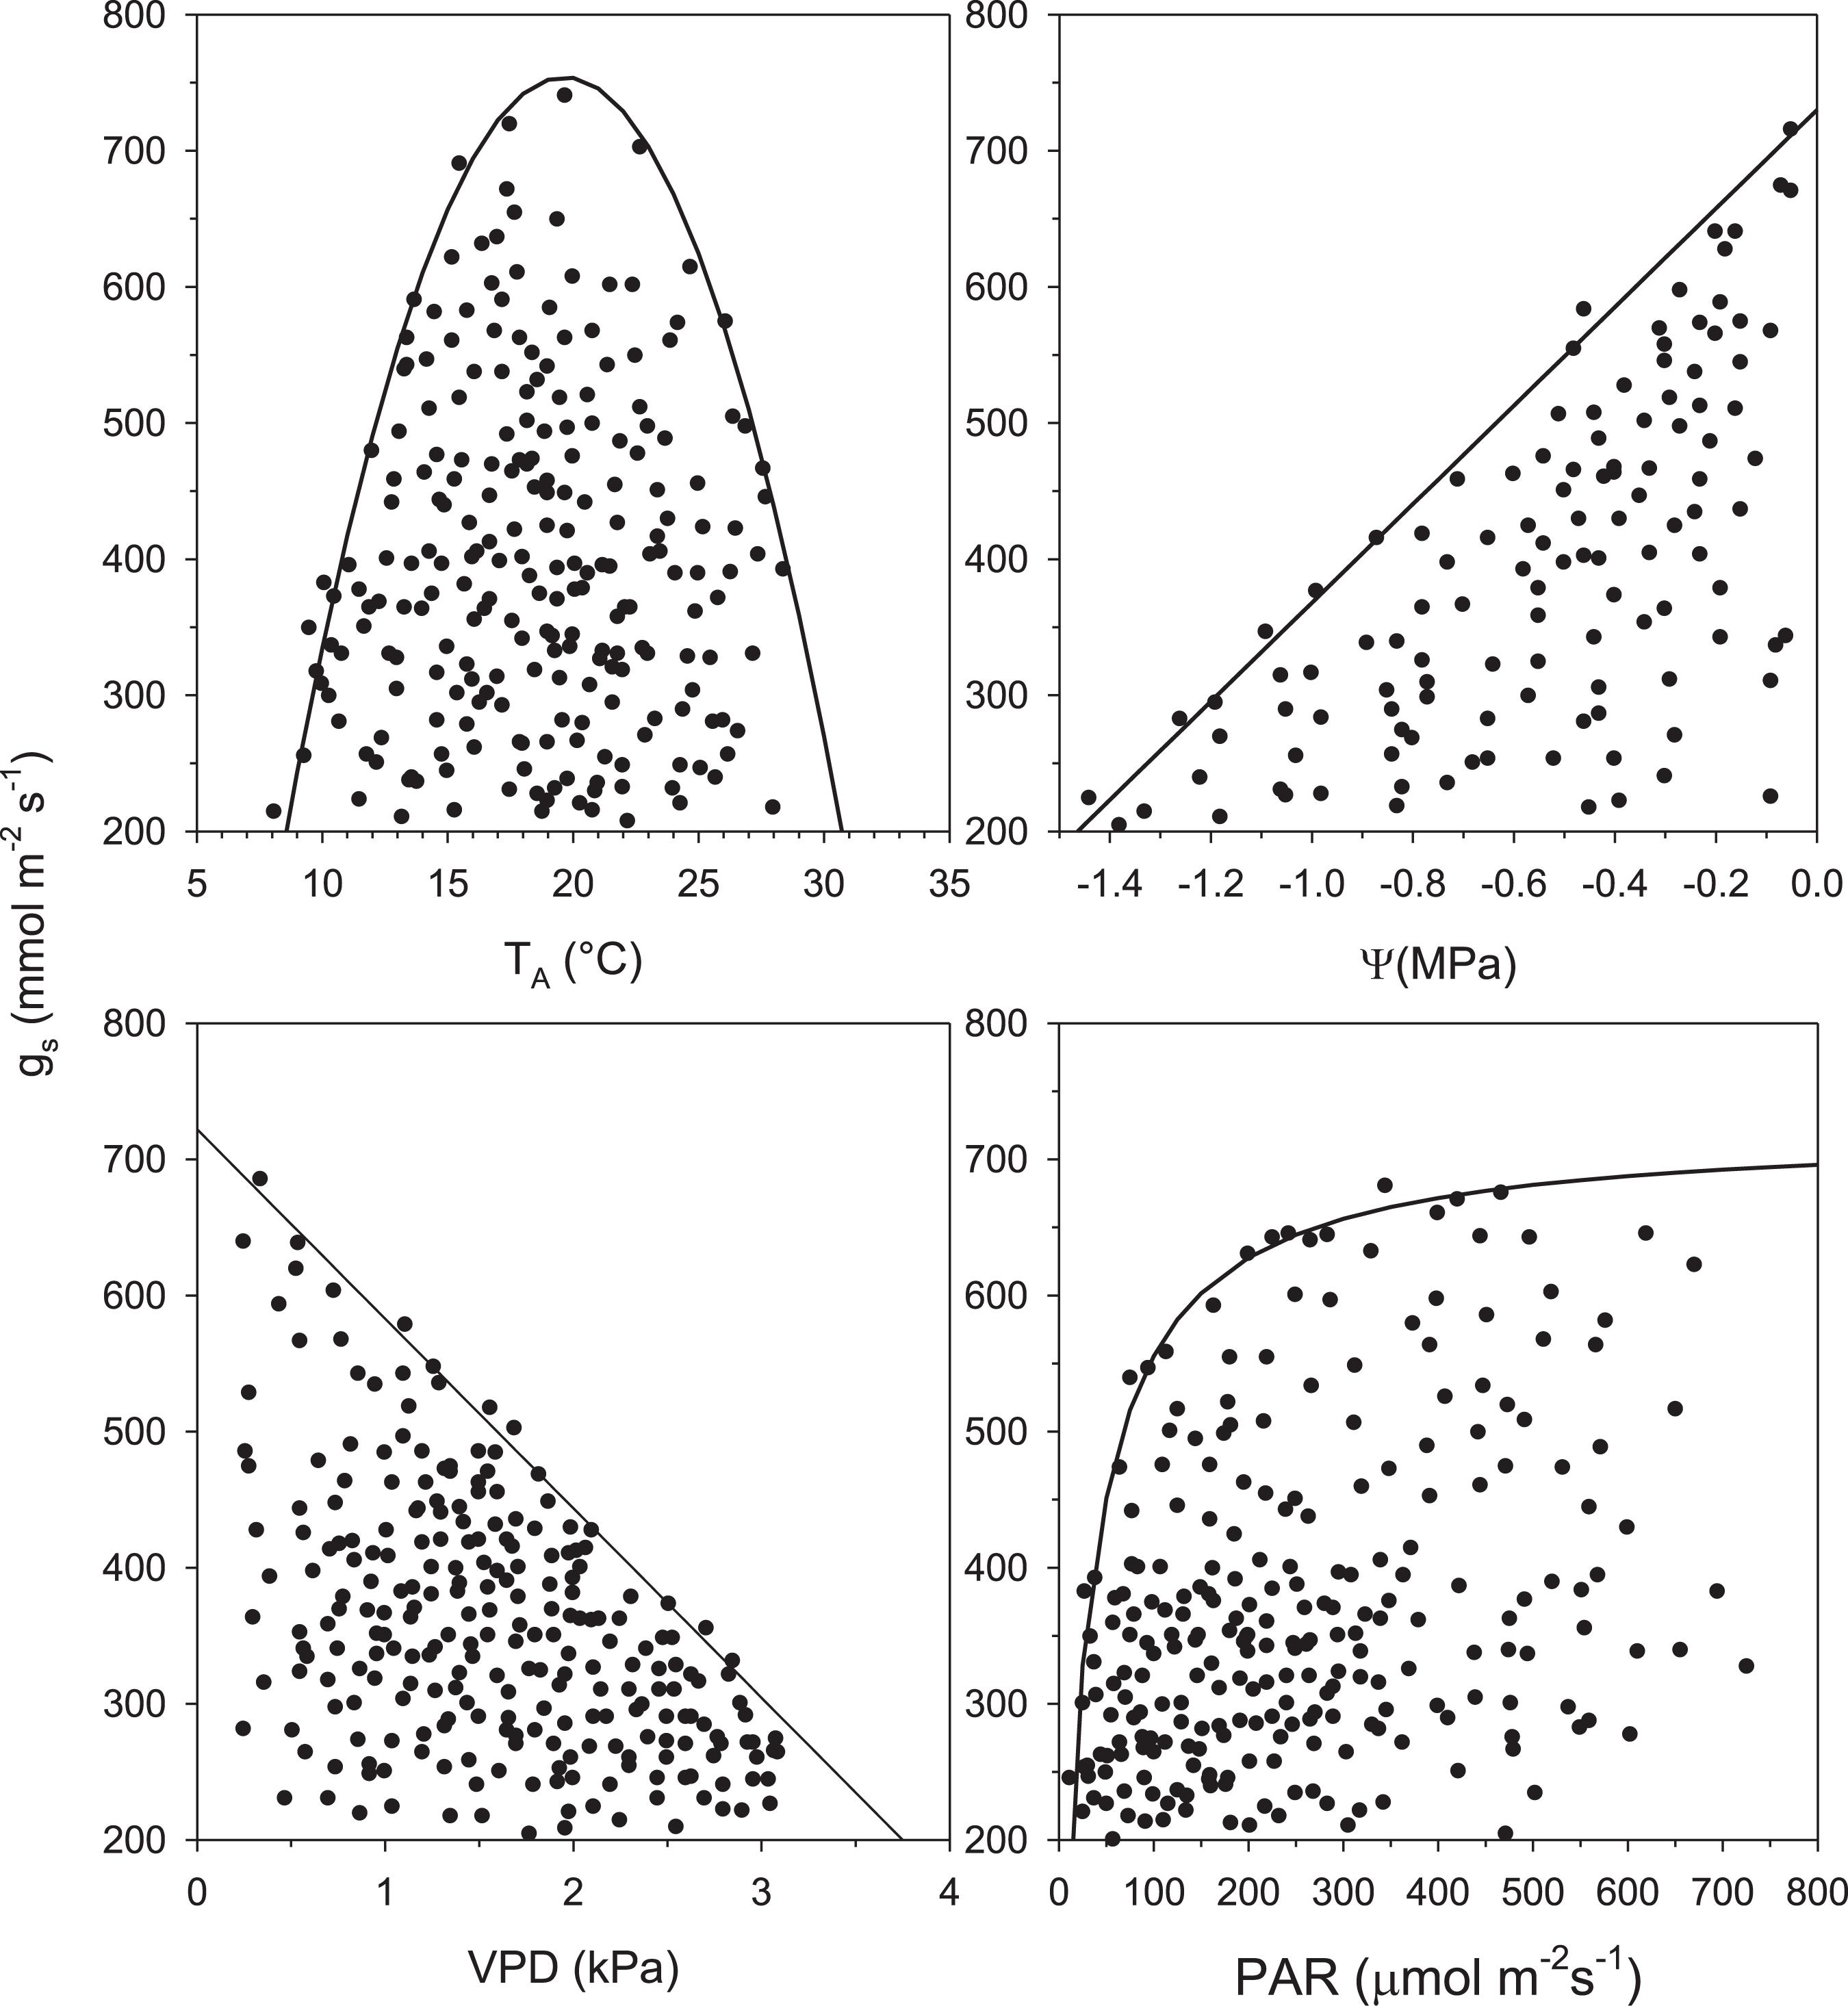
Figure 2. Scatter diagrams and probable boundary-line function of stomatal conductance (gS) vs. air temperature (TA), leaf water potential (ψ), vapor pressure deficit (VPD), and photosynthetically active radiation (PAR) for Acacia longifolia.
The relationship of gS as a function of air temperature (TA) is given by the boundary-line values that conform to a quadratic equation:
where a, b and c are the function parameters that allow calculating the optimum temperature (TO) at which the maximum stomatal conductance (gSMAX) is reached and the cardinal temperatures (minimum and maximum) when gS is zero. Also, from this relationship (gS vs. TA), a thermal interval (TI) can be obtained (considering this interval from the maximum stomatal opening up to 30% closure) and the maximum temperature (TMAX) before gS decrease by 50%; this value is used because this decrease is considered to represent a potential vulnerability and stress that threatens stomatal performance (Esperon-Rodriguez and Barradas, 2015b).
The boundary-line values of stomatal conductance (gS) as a function of photosynthetically active radiation (PAR) are consistent with a hyperbolic function:
where A is the asymptotic value of gS or gSMAX, and B is gS sensitivity to changes in PAR.
While the function of gs vs. the vapor pressure deficit (VPD) generates a simple linear equation:
where β is the sensitivity of gS to VPD and α is the zero shift. With these plots, the minimum VPD value (VPDMIN) before gS decreases by 50% was calculated.
Similarly, the gS response to leaf water potential (ψ) is also a simple linear equation:
where b is gS sensitivity to the ψ, and a is the zero shift. Also, the maximum ψ value (ψ50%) before gS decrease by 50% was calculated.
Boundary-line points are selected and adjusted to the functions and coefficients mentioned above.
Finally, to predict and analyze gS at any present and future time, a function composition model was used (i.e., multiple regression analysis). In this case, we used a multiplicative model weighted by the effect of each environmental variable (Jarvis, 1976; Ballinas and Barradas, 2016b), i.e., when all these variables act in concert on gS:
where ğ(TA), ğ(PAR), ğ(VPD) and ğ(ψ) are the boundary-line functions and are weighted by the effect of each environmental variable taking a proportionality k from 0 to 1; these values change according to the studied species (kTA, kPAR, kVPD, kψ). The maximum value 1 coincides with gSMAX. Theoretically, gSMAX is obtained mainly from the function of gS vs. PAR, being the parameter A of equation (2), and all response variables have the same weight. We used the consistent estimated values of TA (25.0°C), PAR (300 μmol m–2 s–1), VPD (2.0 kPa), and ψ (–1.2 MPa) for model development. These values were derived from data generated from weather stations of Mexico City (Barradas, unpublished dataset) to reduce uncertainty of future climate projections.
Here, we determined species vulnerability by identifying the sensitivity of gS responses to environmental conditions (i.e., TA, PAR, VPD, ψ); that is, a species that is more sensitive to environmental changes will close stomata as a response to small changes in a given environmental variable. For example, in the case of TA, the most sensitive species will be those that have a narrower interval (TI) confining the optimal function of gS to a smaller interval. For the other predictor variables (i.e., VPD, PAR, ψ), the slope of the response variable indicates the sensitivity of each species. Highly vulnerable species have higher slopes (i.e., high sensitivity) compared to less vulnerable species (Esperon-Rodriguez and Barradas, 2015b). However, we highlight that the stomatal function is species specific, and the functional responses to environmental variables could reflect species plasticity. This response, therefore, can indicate species resilience to climate change (Frank et al., 2017; Ming et al., 2019). Differences among species reflect different evolutionary histories and adaptations to distinct niches, and although all the species studied here share a similar environment (i.e., Mexico City), they respond differently to environmental factors.
Statistical Analysis
To evaluate significant differences, the non-parametrical test Kruskal–Wallis was used to compare the variables of TA, PAR and VPD among sites. Statistical significance was considered at 95% for all cases. We used the software Statgraphics to perform this analysis. For the boundary line analysis, the upper points of the point cloud were chosen, which are assumed to be the maximum function with no restriction of the other environmental or physiological variables. For this analysis, we used the software Table Curve 2D.
Results
The highest gS was recorded for L. lucidum, followed by E. camaldulensis, whereas the lowest gS corresponded to D. viscosa and B. cordata. The lowest ψ (i.e., more negative) belonged to B. cordata Q. rugosa and A. acuminata, and the highest ψ corresponded to P. deltoides and L. styraciflua. All species had the lowest ψ, values between 14:00 and 15:00 h (Table 2). Similarly, all environmental variables (i.e., TA, PAR and VPD) varied among species (Table 2). We found significant differences in air temperature when we compared species among sites, finding higher TA in the parks EP and MP (average of 24.8°C) and lower TA in CU and VP (22.1°C) (H = 14.85, df = 7, p = 0.05). This result probably reflects the effect of the urban heat island. In contrast, we found no significant differences when comparing VPD (H = 6.350, df = 7, p = 0.15) and PAR (H = 1.356, df = 7, p = 0.153) among parks.
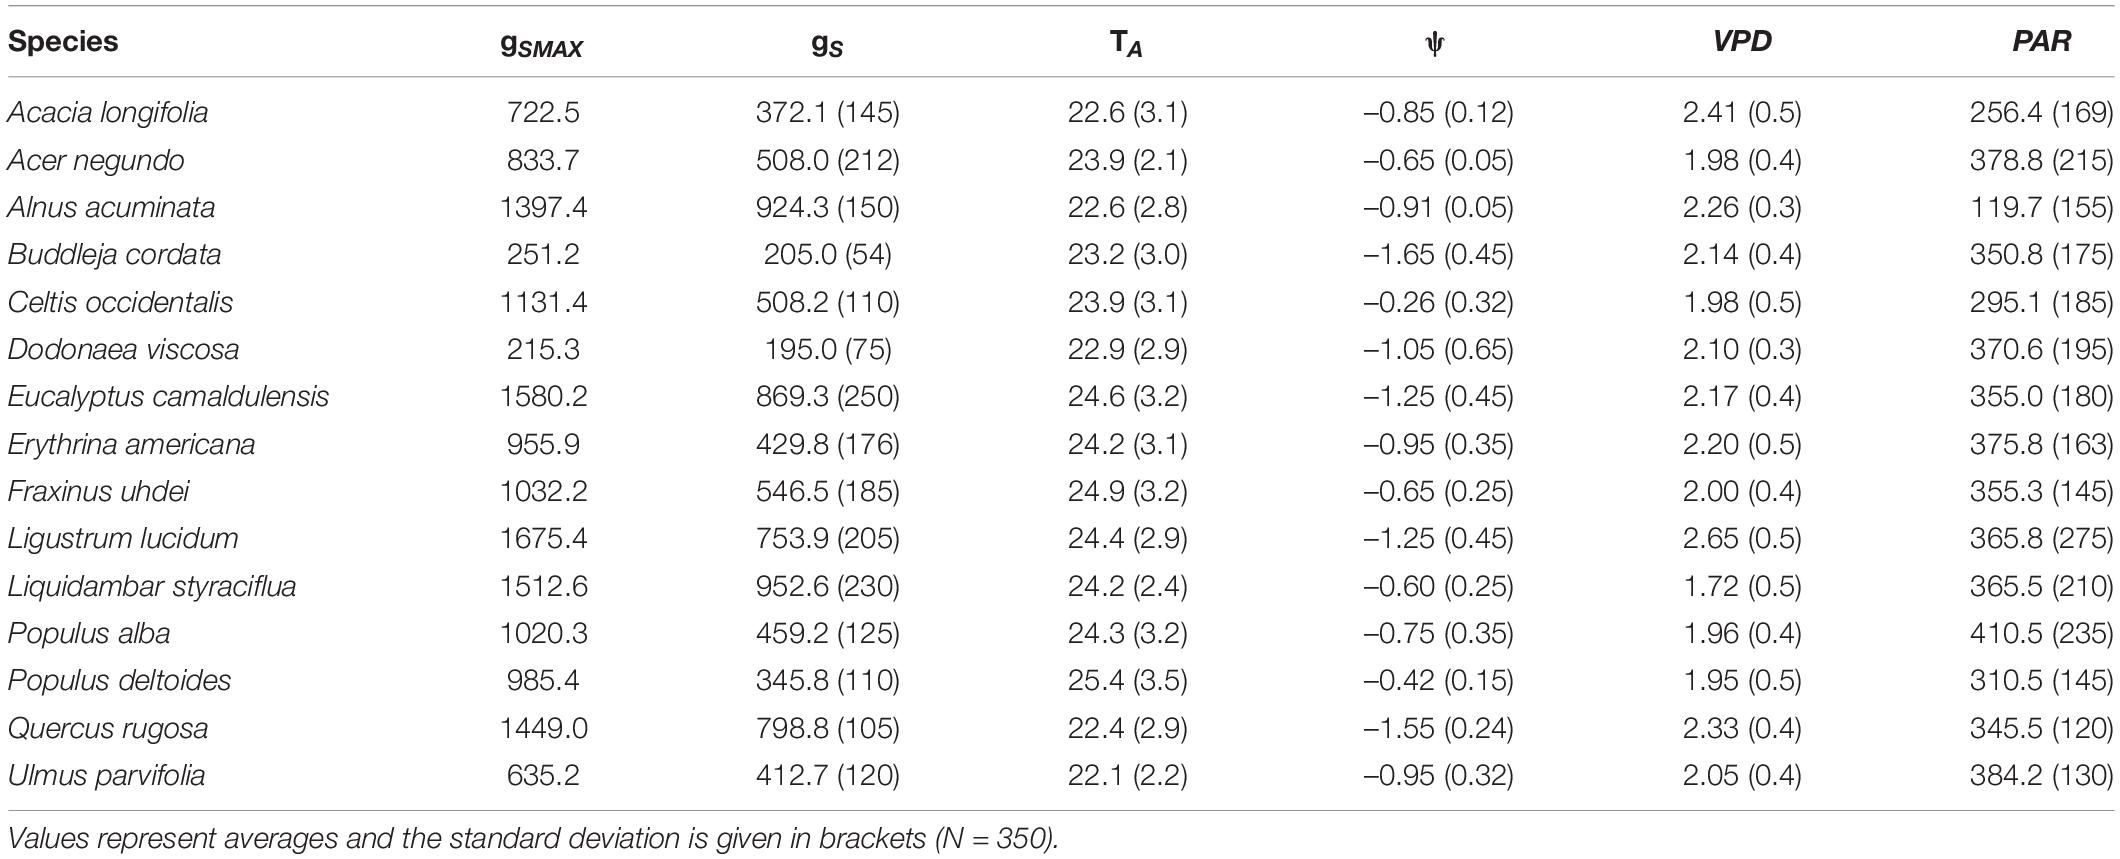
Table 2. Maximum stomatal conductance (gSMAX, mmol m–2 s–1) and averages of stomatal conductance (gS, mmol m–2 s–1), leaf water potential (ψ, MPa), air temperature (TA, °C), vapor pressure deficit (VPD, kPa) and photosynthetically active radiation (PAR, μmol m–2 s–1) for 15 tree species from Mexico City’s urban forest.
The parameters for each curve and each variable among the 15 species were compared (one case study is shown in Figure 2 and the parameters of the boundary-line analysis for gS vs. TA are presented in Supplementary Table 1). All species presented different TO (ranging from 18.0 to 28.5°C), optimal thermal interval, and different TI range. Populus deltoides had the lowest TO, whereas E. camaldulensis had the highest TO. Optimal temperature on average and across all species was 22.5 ± 3.2°C (standard deviation). Regarding TI, P. alba (20.3°C), D. viscosa (19.9°C) and B. cordata (19.3°C) had the widest thermal range, whereas C. occidentalis (11.0°C) and E. camaldulensis (11.2°C) had the narrowest intervals across all species (Table 3).
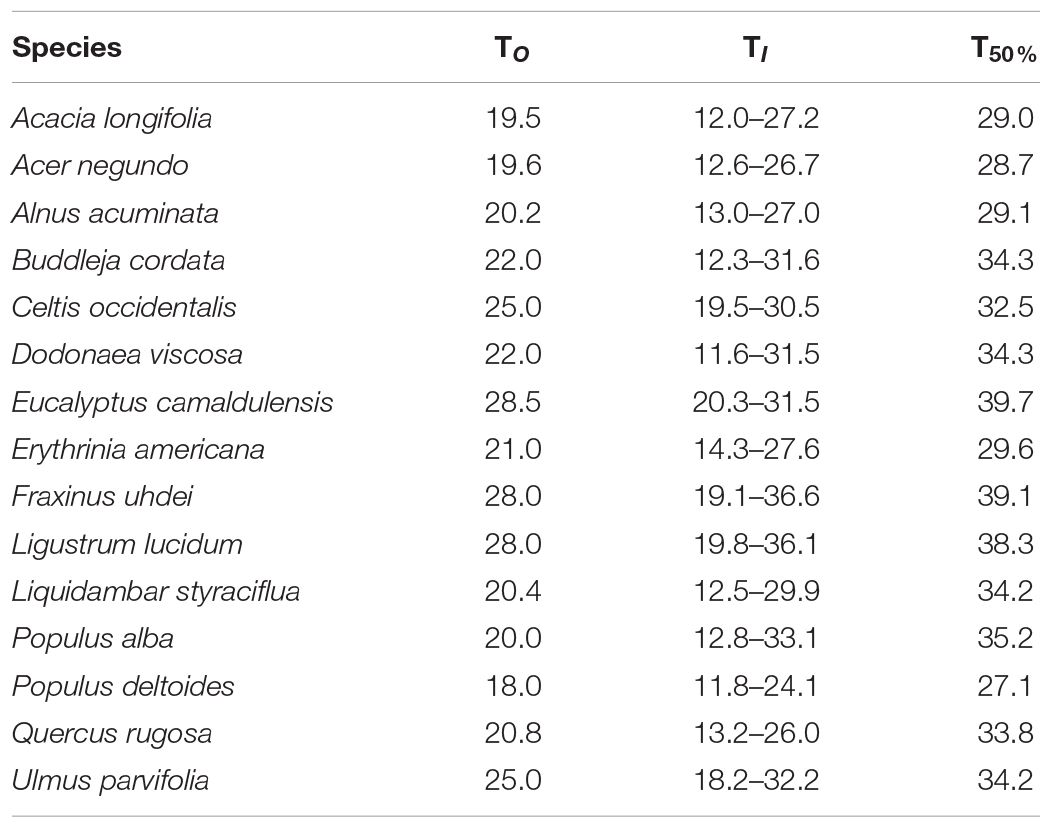
Table 3. Optimal temperature (TO, °C), optimal thermal interval (TI, °C), and maximum temperature when stomatal conductance decreased by 50% (T50%, °C) for the stomatal function for 15 tree species from Mexico City’s urban forest.
For VPD, P. deltoides and F. uhdei reached the highest rates of gS change, while the lowest rates were registered for B. cordata and D. viscosa (Supplementary Table 2). As for VPD50%, for all species, the critical temperature and relative humidity values were above 33.0°C and less than 30% of relative humidity, where D. viscosa and P. deltoides presented the lowest VPD50% and B. cordata, E. camaldulensis and U. parvifolia had the highest VPD50% (Table 4). Concerning PAR, the highest and lowest values were recorded in A. acuminata (119.7 ± 155 μmol m–2 s–1) and P. alba (410.5 ± 235 μmol m–2 s–1) (Table 2).
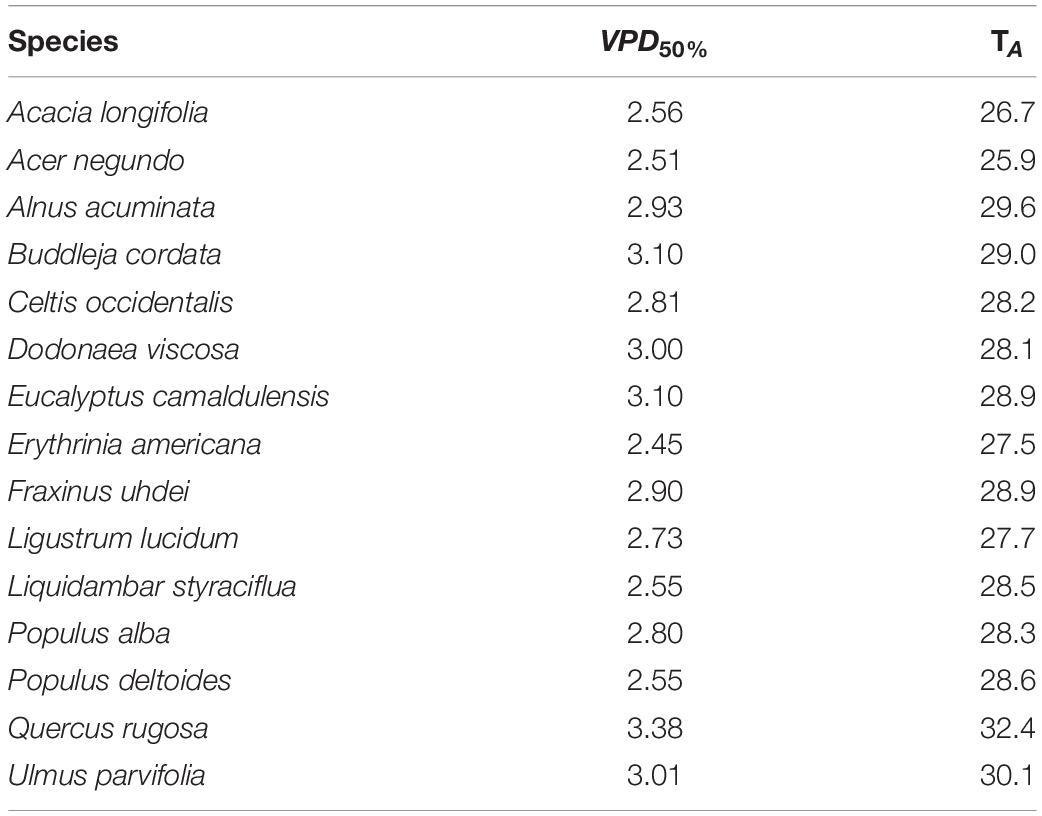
Table 4. Minimum vapor pressure deficit (VPD50%, kPa) when stomatal conductance decreased by 50%, and associated values of air temperature (TA, °C) for 15 tree species from Mexico City’s urban forest.
Regarding vulnerability, for some species, we found wide thermal ranges (e.g., P. alba and D. viscosa); however, we highlight that although a species interval can be wide, this does not necessarily mean the species is not vulnerable. In the case of the increase in TA, the temperature at which stomatal conductance decreases by 50% is more useful to assess species vulnerability. Here, we identified P. deltoides as the most vulnerable species, since it reaches its T50% at 27.1°C (Table 3). We considered less vulnerable, those species that present their T50% at least at 30°C. The species that presented the highest T50% were E. camaldulensis and F. uhdei (Table 3).
Leaf water potential was used to analyze tree vulnerability to water availability. Based on the ψ when stomatal conductance decreased by 50% (ψ50%), the most vulnerable species were P. deltoides, L. styraciflua and C. occidentalis, as these species had the highest (i.e., less negative) values. In contrast, the least vulnerable species were B. cordata, Q. rugosa, and E. camaldulensis, which also coincide with their lowest ψ values (Table 5). Concerning VPD and PAR, vulnerability was assessed using the slope of the hyperbola (or sensitivity) given by the constant β and B, respectively, in which the more vulnerable species were those with the highest β and B values. For VPD, the most vulnerable species was P. deltoides (β = 1367.42), whereas B. cordata (β = 136.01) was the least vulnerable. As for PAR, we identified B. cordata (B = 40.21) and L. lucidum (B = 2.08) as the most and least vulnerable species, respectively (Supplementary Table 2).
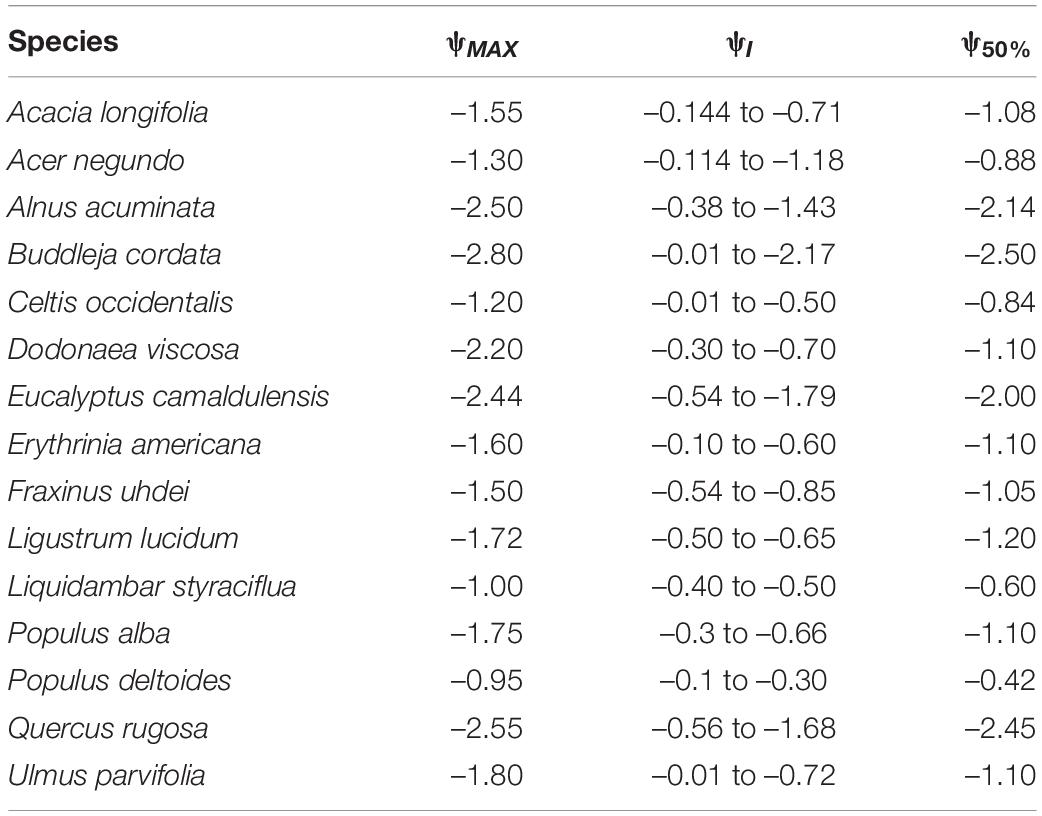
Table 5. Maximum leaf water potential (ψMAX, MPa), optimum ψ interval value (ψI, MPa) and ψ when stomatal conductance decreased by 50% (ψ50%, MPa) for 15 tree species from Mexico City’s urban forest.
The performance of the gS response to all variables is presented in Table 6. For U. parvifolia, the proportionality kTA was higher than 1, probably caused by recording high gS at elevated TA. We found P. deltoides and F. uhdei presented negative proportionalities (kψ), indicating high vulnerability. Further, P. deltoides presented the lowest proportionality values in all environmental variables, except PAR, indicating that this is the most vulnerable species to climate change. According to the predictions of gS using the multiplicative model, survival of P. deltoides and F. uhdei might be not possible in urban environments. From our results, it became evident that the effect of ψ was restrictive in all species, except for Q. rugosa, which showed good performance (Table 6).
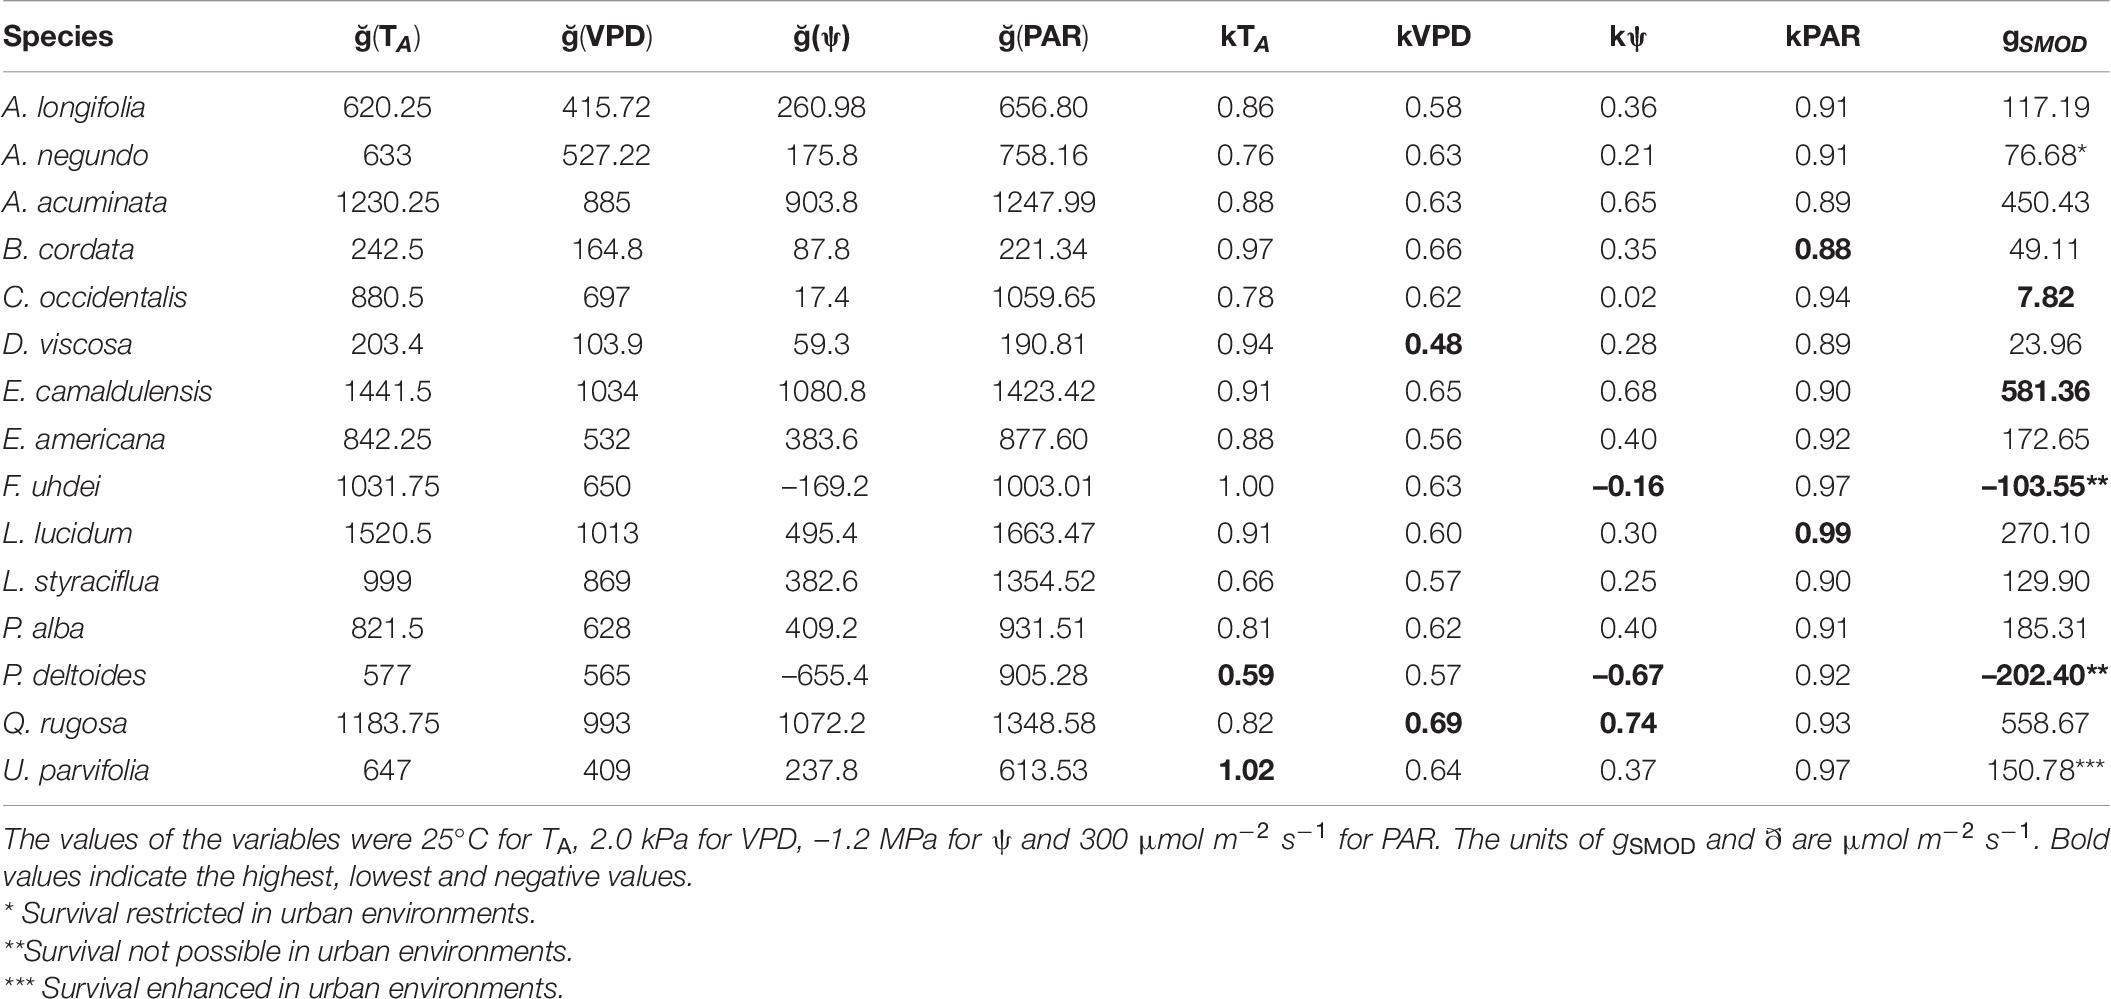
Table 6. Predictions of stomatal conductance (gS) using a multiplicative model (equation 5 from Methods, gSMOD) and the contribution of each environmental (kTA, kVPD, kPAR) and physiological (kψ) variable that can restrict or enhance stomatal performance in 15 tree species from Mexico City’s urban forest.
Discussion
We used the boundary-line analysis to identify vulnerable species to environmental changes based on their stomatal response. The approximation of the boundary line functions of each variable through the determination coefficient (r2), indicated that these functions were adequate for determining the environmental effect on the gS response. This response showed a higher gS sensitivity to VPD and ψ compared to TA and PAR. Differences in stomatal sensitivity found here may be caused by different microclimates at each study site, which could cause acclimatization of stomata to the urban environment (Barradas et al., 2016). Stomatal responsiveness could also be an adaptation (i.e., protective of water loss) related to different management practices (e.g., irrigation) at each site.
The multiplicative model allowed us to identify the most (i.e., P. deltoides and F. uhdei) and least (i.e., E. camaldulensis, U. parvifolia and A. acuminata) vulnerable species to environmental changes. It is worth noting that P. alba had a better gS performance than P. deltoides, showing that other factors rather than phylogeny, may improve species performance, such as plasticity and climate of origin (Nicotra and Davidson, 2010; Du et al., 2019). However, studies in tropical areas showed that phenomenological models, such as the boundary line analysis, are site-specific (Barradas et al., 2004). Also, for the multiplicative model, we used input data derived from meteorological stations from Mexico City; a different approach might be using modeled meteorological data (e.g., PRISM). Our results, therefore, are site- and species-specific, and caution must be taken if the parameters are extrapolated to other sites and individuals under different conditions.
As a response to climate change, global warming will continue toward the end of the century increasing air temperature in urban areas (Esperon-Rodriguez et al., 2021; IPCC, 2021). The average air temperature in Mexico City is expected to be 24.5°C by 2050 (Ballinas, 2011) and daytime temperatures will likely exceed the species’ temperature ranges found here. While the annual average air temperature in Mexico City keeps increasing, extreme temperatures will be aggravated by the UHI effect negatively affecting some species by limiting their stomatal function. In this study, we found that temperatures above 27°C limited the stomatal opening, although some species could maintain stomata open (T50%) at higher temperatures. This was the case of E. camaldulensis and F. uhdei, which had gS associated with T50% of up to 39°C. In contrast, species such as P. deltoides, had the lowest T50% at 27.1°C. Additionally, changes in precipitation and cloudiness, which affect solar radiation, may also affect the stomatal function with effects on species growth and performance.
A direct effect of the increase in air temperature is the increase in VPD when water is limited and relative humidity is low. The response of gS to high temperatures can be uncertain, particularly when these temperatures are coupled with low relative humidity and high VPD (Medlyn et al., 2002; Esperon-Rodriguez and Barradas, 2014). The increase in VPD restricts gS, thus, species capable of maintaining stomata open when VPD is high are less vulnerable (i.e., Q. rugosa, E. camaldulensis and B. cordata). In contrast, species with low gS under high VPD conditions are more vulnerable (i.e., E. americana, A. negundo, L. styraciflua, and P. deltoides). From our analysis, we found all species were vulnerable to changes in VPD and ψ indicating sensitivity to water stress conditions. However, caution must be exercised when interpreting the proportionalities in the model because if two proportionalities are negative, for example, the value of gSMOD is positive. As for PAR, its effect was less significant compared to the other variables (i.e., VPD, ψ) because C3 plants become saturated toward 300 μmol m–2 s–1 (Jones, 1992), hence, gS would be limited by PAR below the saturation point; that, however, did not occur in our study.
Finding a high vulnerability to VPD and ψ, two variables directly related to water availability, highlights the importance of water in urban environments to keep stomatal function. Water is crucial to maintain gS for leaf cooling via evapotranspiration, and therefore is associated with the cooling benefits of trees even under extreme high temperatures (Drake et al., 2018). Leaf temperature is an important parameter; a decrease in gS can be associated with increases in leaf temperatures (Lu et al., 1994) and leaf temperatures can exceed air temperature by several degrees (Miller et al., 2021) leading to leaf damage (Hueve et al., 2011). Thus, identifying resistant species to high temperatures in water-limited environments is beneficial in urban environments because canopy loss can have negative environmental and social impacts (e.g., decrease in cooling benefits) (Sanusi and Livesley, 2020).
Here, we used leaf water potential as an indicator of plant resistance to drought (Fanjul and Barradas, 1987; Jones, 1992). Furthermore, decreases in ψ can reduce gS (Fanjul and Barradas, 1985, 1987; Esperon-Rodriguez and Barradas, 2015b). When water is limited, species that respond by decreasing their ψ are less vulnerable. This was the case of B. cordata, Q. rugosa, A. acuminata, and E. camaldulensis, which presented ψ lower than –2.0 MPa. In contrast, the most vulnerable species were P. deltoides and L. styraciflua. For L. styraciflua, previous research showed its vulnerability to water-limited natural environments (Esperon-Rodriguez and Barradas, 2015b), and here, we confirm its vulnerability also in urban environments. To confirm the species vulnerability to ψ, we recommend using the leaf turgor loss point as an additional trait. The less vulnerable species would be those that are able to maintain ψ above their turgor loss point under water stress conditions, allowing gas exchange and evaporative cooling to continue.
Our results can aid species selection in a changing climate to minimize economic losses related to urban tree failures. By working together, scientists, policymakers and urban planners can develop and implement strategies and management actions that not only guarantee the preservation of urban forests but also benefit local communities.
Data Availability Statement
The datasets presented in this article are not readily available because when data is generated for an investigation, by law it is reserved for 10 years in Mexico. Requests to access the datasets should be directed to corresponding author.
Author Contributions
VB and ME-R designed the research, collected, analyzed the data, and wrote the manuscript. Both authors contributed to the article and approved the submitted version.
Funding
This wok was supported by the PAPIIT Programa de Apoyo a Proyectos de Investigación e Innovación Tecnológica, DGAPA, UNAM, Grant/Award No. IT200620.
Conflict of Interest
The authors declare that the research was conducted in the absence of any commercial or financial relationships that could be construed as a potential conflict of interest.
Publisher’s Note
All claims expressed in this article are solely those of the authors and do not necessarily represent those of their affiliated organizations, or those of the publisher, the editors and the reviewers. Any product that may be evaluated in this article, or claim that may be made by its manufacturer, is not guaranteed or endorsed by the publisher.
Acknowledgments
We thank Alejandro Morales, Martín Bonifacio, and Alfredo Zamora for their help during the field work.
Supplementary Material
The Supplementary Material for this article can be found online at: https://www.frontiersin.org/articles/10.3389/fevo.2021.732250/full#supplementary-material
References
Ackerly, D. (2004). Functional strategies of chaparral shrubs in relation to seasonal water deficit and disturbance. Ecol. Monogr. 74, 25–44. doi: 10.1890/03-4022
Aitken, S. N., Yeaman, S., Holliday, J. A., Wang, T., and Curtis-McLane, S. (2008). Adaptation, migration or extirpation: climate change outcomes for tree populations. Evol. Applic. 1:95. doi: 10.1111/j.1752-4571.2007.00013.x
Atkin, O. K., and Tjoelker, M. G. (2003). Thermal acclimation and the dynamic response of plant respiration to temperature. Trends Plant Sci. 8, 343–351. doi: 10.1016/s1360-1385(03)00136-5
Atkins, K. E., and Travis, J. M. J. (2010). Local adaptation and the evolution of species’ ranges under climate change. J. Theor. Biol. 266, 449–457.
Ballinas, M. (2011). Mitigación de la Isla de Calor Urbana: Estudio de Caso de la Zona Metropolitana de la Ciudad de México. Master of Sciences Thesis. México City: Universidad Nacional Autónoma de México.
Ballinas, M., and Barradas, V. L. (2016a). Transpiration and stomatal conductance as potential mechanisms to mitigate the heat load in Mexico City. Urban For. Urban Gree. 20, 152–159. doi: 10.1016/j.ufug.2016.08.004
Ballinas, M., and Barradas, V. L. (2016b). The urban tree as a tool to mitigate the urban heat island in Mexico City: a simple phenomenological model. J. Environ. Qual. 45, 157–166. doi: 10.2134/jeq2015.01.0056
Barradas, V. L. (1991). Air temperature and humidity and human comfort index of some city parks of Mexico City. Int. J. Biometeorol. 35, 24–28. doi: 10.1007/BF01040959
Barradas, V. L. (2000). Energy balance and transpiration in an urban tree hedgerow in Mexico City. Urban Ecosyst. 4, 55–67. doi: 10.1023/A:1009591803532
Barradas, V. L., Ramos-Vázquez, A., and Orozco-Segovia, A. (2004). Stomatal conductance in a tropical xerophilous shrubland at a lava substratum. Int. J. Biometeorol. 48, 119–127. doi: 10.1007/s00484-003-0195-x
Barradas, V. L., Ruiz-Cordova, J. P., and Esperon-Rodriguez, M. (2016). Microclimatology and ecophysiology of the urban vegetation of a city with tropical climate modified by altitude in Mexico. Bot. Sci. 94, 775–786.
Barradas, V. L., Tapia Vargas, L. M., and Cervantes Pérez, J. (2011). Consequences of climate change on the plant ecophysiology of a temperate forest in Veracruz. Rev. Mexicana Cien. Agríc. Publ. Espec. 2, 183–194.
Brazel, A. J., and Quattrochi, D. A. (2005). “Urban climates,” in Encyclopedia of World Climatology, ed. J. E. Oliver (Dordrecht: Springer), 766–769.
Buckley, T. N. (2005). The control of stomata by water balance. New Phytol. 168, 275–292. doi: 10.1111/j.1469-8137.2005.01543.x
CONAGUA, Comisión Nacional del Agua, Mexican Government (2021). Normales Climatológicas 1981-2010. Mexico City: CONAGUA.
Day, S. D., and Bassuk, N. L. (1994). A review of the effects of soil compaction and amelioration treatments on landscape trees. J. Arboricult. 20, 9–17.
Dobbs, C., Nitschke, C., and Kendal, D. (2017). Assessing the drivers shaping global patterns of urban vegetation landscape structure. Sci. Total Environ. 592, 171–177. doi: 10.1016/j.scitotenv.2017.03.058
Drake, J. E., Tjoelker, M. G., Vårhammar, A., Medlyn, B. E., Reich, P. B., Leigh, A., et al. (2018). Trees tolerate an extreme heatwave via sustained transpirational cooling and increased leaf thermal tolerance. Glob. Chang. Biol. 24, 2390–2402. doi: 10.1111/gcb.14037
Du, P., Arndt, S. K., and Farrell, C. (2019). Is plant survival on green roofs related to their drought response, water use or climate of origin? Sci. Total Environ. 667, 25–32. doi: 10.1016/j.scitotenv.2019.02.349
Esperon-Rodriguez, M., and Barradas, V. L. (2014). Potential vulnerability to climate change of four tree species from the central mountain region of Veracruz, Mexico. Clim. Res. 60, 163–174.
Esperon-Rodriguez, M., and Barradas, V. L. (2015a). Ecophysiological vulnerability to climate change: water stress responses in four tree species from the central mountain region of Veracruz, Mexico. Reg. Environ. Change 15, 93–108.
Esperon-Rodriguez, M., and Barradas, V. L. (2015b). Comparing environmental vulnerability in the montane cloud forestof eastern Mexico: a vulnerability index. Ecol. Indic. 52, 300–310. doi: 10.1016/j.ecolind.2014.12.019
Esperon-Rodriguez, M., Baumgartner, J., Beaumont, L., Lenoir, J., Nipperess, N., Power, S., et al. (2021). Climate-change risk analysis for global urban forests. bioRxiv [Preprint] doi: 10.1101/2021.05.09.443030
Fanjul, L., and Barradas, V. L. (1985). Stomatal behaviour of two heliophile understorey species of a tropical deciduous forest in Mexico. J. Appl. Ecol. 22, 943–954. doi: 10.2307/2403242
Fanjul, L., and Barradas, V. L. (1987). Diurnal and seasonal variation in the water relations of some deciduous and evergreen trees of a deciduous dry forest of the western coast of Mexico. J. Appl. Ecol. 24, 289–303. doi: 10.3389/10.2307/2403805
Farquhar, G. D., and Sharkey, T. D. (1982). Stomatal conductance and photosynthesis. Annu. Rev. Plant Physiol. 33, 317–345.
Frank, A., Plues, A. R., Howe, G. T., Sperisen, C., and Heiri, C. (2017). Quantitative genetic differentiation and phenotypic plasticity of European beech in a heterogenous landscape: indications for past climate adaptation. Perspect. Plant Ecol. Syst. 26, 1–13. doi: 10.1016/j.ppees.2017.02.01
García-Sánchez, I. E., Barradas, V. L., Ponce de Leon Hill, C., Esperon-Rodriguez, M., Rosas Perez, I., and Ballinas, M. (2019). Effect of heavy metals and environmental variables on the assimilation of CO2 and stomatal conductance of Ligustrum lucidum, an urban tree from Mexico City. Urban For. Urban Green. 42, 72–81. doi: 10.1016/j.ufug.2019.05.002
Göbel, P., Starke, P., Voss, A., and Coldewey, W. (2013). “Field measurements of evapotranspiration rates on seven pervious concrete pavement systems,” in Proceedings of the Novatech 2013 - 8ème Conférence internationale sur les Techniques et Stratégies Durables Pour la Gestion des Eaux Urbaines par Temps de Pluie / 8th International Conference on Planning and Technologies for Sustainable Management of Water in the City, (Lyon).
Gregg, J. W., Jones, C. G., and Dawson, T. E. (2003). Urbanization effects on tree growth in the vicinity of New York City. Nature 424, 183–187. doi: 10.1038/nature01728
Gui, J., Phelan, P. E., Kaloush, K. E., and Golden, J. S. (2007). Impact of pavement thermophysical properties on surface temperatures. J. Mater. Civil Eng. 19, 683–690. doi: 10.1061/(asce)0899-1561(2007)19:8(683)
Hauer, R., Koeser, A., Parbs, S., Kringer, J., Krouse, R., Ottman, K., et al. (2020). Effects of a tree preservation program on tree survival, condition, and growth in Milwaukee, WI, USA. Landsc. Urban Plann. 193:103670. doi: 10.1016/j.landurbplan.2019.103670
Hueve, K., Bichele, I., Rasulov, B., and Niinemets, ÜL. O. (2011). When it is too hot for photosynthesis: heat-induced instability of photosynthesis in relation to respiratory burst, cell permeability changes and H2O2 formation. Plant Cell Environ. 34, 113–126. doi: 10.1111/j.1365-3040.2010.02229.x
IPCC (2001). “Climate change 2001: impacts, adaptation, and vulnerability,” in Contribution of Working Group II to the Third Assessment Report of the Intergovernmental Panel on Climate Change, eds J. J. McCarthy, O. F. Canziani, N. A. Leary, D. J. Dokken, and K. S. White (Cambridge: Cambridge University Press).
IPCC (2021). Climate Change 2021: The Physical Science Basis. Contribution of Working Group I to the Sixth Assessment Report of the Intergovernmental Panel on Climate Change, Switzerland. Geneva: IPCC.
Jarvis, A. J., and Davies, W. J. (1998). The coupled response of stomatal conductance to photosynthesis and transpiration. J. Exp. Bot. 49, 399–406. doi: 10.1093/jexbot/49.suppl_1.399
Jarvis, P. G. (1976). The interpretation of the variation in leaf water potential and stomatal conductance found in canopies in the field. Philos. Transa. R. Soc. B 273, 593–610. doi: 10.1098/rstb.2014.0311
Keeler, B. L., Hamel, P., McPhearson, T., Hamann, M. H., Donahue, M. L., Meza Prado, K. A., et al. (2019). Social-ecological and technological factors moderate the value of urban nature. Nat. Sustain. 2, 29–38. doi: 10.1038/s41893-018-0202-1
Kornaska, J., Uddling, J., Holmer, B., Lutz, M., Lindberg, F., Pleijel, H., et al. (2016). Transpiration of urban trees and its cooling effect in a high latitude city. Int. J. Biomteorol. 60, 159–172. doi: 10.1007/s00484-015-1014-x
Lambers, H., Chapin, F. S. III, and Pons, T. L. (1998). Plant Physiological Ecology. New York, NY: Springer.
Laschewski, G., and Jendritzky, G. (2002). Effects of the thermal environment on human health: an investigation of 30 years of daily mortality data from SW Germany. Clim. Res. 21, 91–103. doi: 10.3354/cr021091
Lu, Z., Radin, J. W., Turcotte, E. L., Percy, R., and Zeiger, E. (1994). High yields in advanced lines of Pima cotton are associated with higher stomatal conductance, reduced leaf area and lower leaf temperature. Physiol. Plant. 92, 266–272.
Luber, G., and McGeehin, M. (2008). Climate change and extreme heat events. Am. J. Prev. Med. 35, 429–435. doi: 10.1016/j.amepre.2008.08.021
Manoli, G., Fatichi, S., Schläpfer, M., Yu, K., Crowther, T. W., Meili, N., et al. (2019). Magnitude of urban heat islands largely explained by climate and population. Nature 573, 55–60. doi: 10.1038/s41586-019-1512-9
Mathur, S., Agrawal, D., and Jajoo, A. (2014). Photosynthesis: response to high temperature stress. J. Photochem. Photobiol. B Biol. 137, 116–126.
Medlyn, B., Dreyer, E., Ellsworth, D., Forstreuter, M., Harley, P., Kirschbaum, M., et al. (2002). Temperature response of parameters of a biochemically based model of photosynthesis. II. A review of experimental data. Plant Cell Environ. 25, 1167–1179.
Miller, B. D., Carter, K. R., Reed, S. C., Wood, T. E., and Cavaleri, M. A. (2021). Only sun-lit leaves of the uppermost canopy exceed both air temperature and photosynthetic thermal optima in a wet tropical forest. Agric. For. Meteorol. 301:108347.
Ming, H. W., Jing, R. W., Xiao, W. Z., Ai, P. Z., Sun, S., and Chang, M. Z. (2019). Phenotypic plasticity of stomatal and phostosynthetic features of four Picea species in two contrasting commo gardens. AoB Plants 11:plz034. doi: 10.1093/aobpla/plz034
Moser, A., Uhl, E., Rötzer, T., Biber, P., Dahlhausen, J., Lefer, B., et al. (2017). Effects of climate and the urban heat island effect on urban tree growth in Houston. Open J. For. 7:428. doi: 10.1038/s41598-017-14831-w
Nicotra, A. B., and Davidson, A. (2010). Adaptive phenotypic plasticity and plant water use. Funct. Plant Biol. 37, 117–127. doi: 10.1071/fp09139
Oke, T. R. (1995). “The heat island of the urban boundary layer: characteristics, causes and effects,” in Wind Climate in Cities. NATO ASI Series (Series E: Applied Sciences), Vol. 277, eds J. E. Cermak, A. G. Davenport, E. J. Plate, and D. X. Viegas (Dordrecht: Springer), doi: 10.1007/978-94-017-3686-2_5
Ramos-Vázquez, A., and Barradas, V. L. (1998). El efecto del microambiente en la conductividad estomática de Buddleia chordata H.B.K., en la reserva del Pedregal de San Angel. Boletín Soc. Bot. México 62, 63–71. doi: 10.17129/botsci.1551
Sanusi, R., and Livesley, S. J. (2020). London Plane trees (Platanus x acerifolia) before, during and after a heatwave: losing leaves means less cooling benefit. Urban For. Urban Green. 54:126746.
Scholander, P. F., Hammel, H. T., Hemmingsen, E. A., and Bradstreet, E. D. (1964). Hydrostatic pressure and osmotic potential in leaves of mangroves and some other plants. Proc. Natl. Acad. Sci. U.S.A. 52, 119–125. doi: 10.1073/pnas.52.1.119
Smith, I. A., Dearborn, V. K., and Hutyra, L. R. (2019). Live fast, die young: accelerated growth, mortality, and turnover in street trees. PLoS One 14:e0215846. doi: 10.1371/journal.pone.0215846
Susca, T., Gaffin, S. R., and Dell’Osso, G. R. (2011). Positive effects of vegetation: urban heat island and green roofs. Environ. Pollut. 159, 2119–2126. doi: 10.1016/j.envpol.2011.03.007
Keywords: boundary-line analysis, leaf water potential, stomatal conductance, urban tree, environmental vulnerability
Citation: Barradas VL and Esperon-Rodriguez M (2021) Ecophysiological Vulnerability to Climate Change in Mexico City’s Urban Forest. Front. Ecol. Evol. 9:732250. doi: 10.3389/fevo.2021.732250
Received: 28 June 2021; Accepted: 19 October 2021;
Published: 04 November 2021.
Edited by:
Camilo Ordóñez Barona, University of Toronto Mississauga, CanadaReviewed by:
Nancy Falxa Sonti, Northern Research Station, United States Forest Service, United States Department of Agriculture (USDA), United StatesNancy Elizabeth Grulke, Western Wildland Environmental Threat Assessment Center, Pacific Northwest Research Station, US Forest Service, United States
Copyright © 2021 Barradas and Esperon-Rodriguez. This is an open-access article distributed under the terms of the Creative Commons Attribution License (CC BY). The use, distribution or reproduction in other forums is permitted, provided the original author(s) and the copyright owner(s) are credited and that the original publication in this journal is cited, in accordance with accepted academic practice. No use, distribution or reproduction is permitted which does not comply with these terms.
*Correspondence: Victor L. Barradas, dmxiYXJyYWRhc0BlY29sb2dpYS51bmFtLm14